Attached files
| file | filename |
|---|---|
| 8-K - 8-K - HUNTINGTON BANCSHARES INC /MD/ | hban20180530_8-k.htm |
Exhibit 99.1 Welcome Huntington Bancshares Incorporated Deutsche Bank Global Financial Services Conference May 30, 2018 ©2018 Huntington Bancshares Incorporated. All rights reserved. (NASDAQ: HBAN)
Disclaimer CAUTION REGARDING FORWARD-LOOKING STATEMENTS This communication contains certain forward-looking statements, including, but not limited to, certain plans, expectations, goals, projections, and statements, which are not historical facts and are subject to numerous assumptions, risks, and uncertainties. Statements that do not describe historical or current facts, including statements about beliefs and expectations, are forward-looking statements. Forward-looking statements may be identified by words such as expect, anticipate, believe, intend, estimate, plan, target, goal, or similar expressions, or future or conditional verbs such as will, may, might, should, would, could, or similar variations. The forward-looking statements are intended to be subject to the safe harbor provided by Section 27A of the Securities Act of 1933, Section 21E of the Securities Exchange Act of 1934, and the Private Securities Litigation Reform Act of 1995. While there is no assurance that any list of risks and uncertainties or risk factors is complete, below are certain factors which could cause actual results to differ materially from those contained or implied in the forward-looking statements: changes in general economic, political, or industry conditions; uncertainty in U.S. fiscal and monetary policy, including the interest rate policies of the Federal Reserve Board; volatility and disruptions in global capital and credit markets; movements in interest rates; competitive pressures on product pricing and services; success, impact, and timing of our business strategies, including market acceptance of any new products or services implementing our “Fair Play” banking philosophy; the nature, extent, timing, and results of governmental actions, examinations, reviews, reforms, regulations, and interpretations, including those related to the Dodd-Frank Wall Street Reform and Consumer Protection Act and the Basel III regulatory capital reforms, as well as those involving the OCC, Federal Reserve, FDIC, and CFPB; and other factors that may affect our future results. Additional factors that could cause results to differ materially from those described above can be found in our Annual Report on Form 10-K for the year ended December 31, 2017, which is on file with the Securities and Exchange Commission (the “SEC”) and available in the “Investor Relations” section of our website, http://www.huntington.com, under the heading “Publications and Filings” and in other documents we file with the SEC. All forward-looking statements speak only as of the date they are made and are based on information available at that time. We do not assume any obligation to update forward-looking statements to reflect circumstances or events that occur after the date the forward- looking statements were made or to reflect the occurrence of unanticipated events except as required by federal securities laws. As forward-looking statements involve significant risks and uncertainties, caution should be exercised against placing undue reliance on such statements. 2
Huntington Bancshares Overview Huntington is a $104 billion asset regional bank holding company headquartered in Columbus, Ohio. Founded in 1866, The Huntington 1Q18 National Bank and its affiliates provide Total Loans consumer, small business, commercial, treasury management, capital markets, wealth management, and insurance services. $71B Ohio Michigan Extended Footprint Branches: 464 Branches: 306 WI Products Deposits: $49.7 Billion Deposits: $14.8 Billion Loans(1): $40.4 Billion Loans(1): $16.4 Billion Asset Finance MI Auto Corporate Pennsylvania Indiana Franchise Branches: 50 Branches: 42 Food & Agriculture Deposits: $3.6 Billion Deposits: $3.6 Billion PA Healthcare (1) (1) IL OH Loans : $6.5 Billion Loans : $5.6 Billion IN Marine & RV National Settlements WV Sponsor Finance Illinois West Virginia Huntington Technology Branches: 37 Branches: 25 KY …Finance Deposits: $2.1 Billion Deposits: $1.8 Billion Loans(1): $5.3 Billion Loans(1): $2.2 Billion 2017 Wisconsin Kentucky Total Revenue Branches: 31 Branches: 10 Deposits: $0.8 Billion Deposits: $0.5 Billion (1) (1) Loans : $1.4 Billion Loans : $2.5 Billion Selected Highlights $4.4B 1Q18 Huntington’s top 10 deposit MSAs Combined GDP of 8 state core footprint Total Deposits th (2) represent ~78% of total deposits represents 4 largest economy in the world Ranked #1 SBA 7(a) lender in footprint and #1 in nation (3) Ranked #1 in deposit market share in 14% $79B Ranked #4 mortgage lender in footprint (4) of total footprint MSAs and top 3 in 41% Note: As of Dec. 31, 2017; Source: FDIC Market share as of Jun. 30, 2017 3 (1) Funded and unfunded loan commitments; (2) 2016 IMF and US Bureau of Economic Analysis; (3) Rankings through SBA 2018 second fiscal quarter; (4) Icon Advisory Group, YTD 9/17
Strategic Planning Process Initiated the strategic planning process in 1Q18 which will yield new long-term goals for the company Initial areas of focus 2014 Strategic Plan Outcomes: for the 2018 Strategic ✔ Improved scale Planning Process: ✔ Accelerated achievement of long-term financial goals Top-Line Revenue Best in class return profile Growth ✔ Business 2009 Strategic Plan Outcomes: Capital Model Optimization Evolution ✔ Disciplined risk management & Disruption ✔ Fair Play consumer strategy ✔ Huntington brand evolution 4
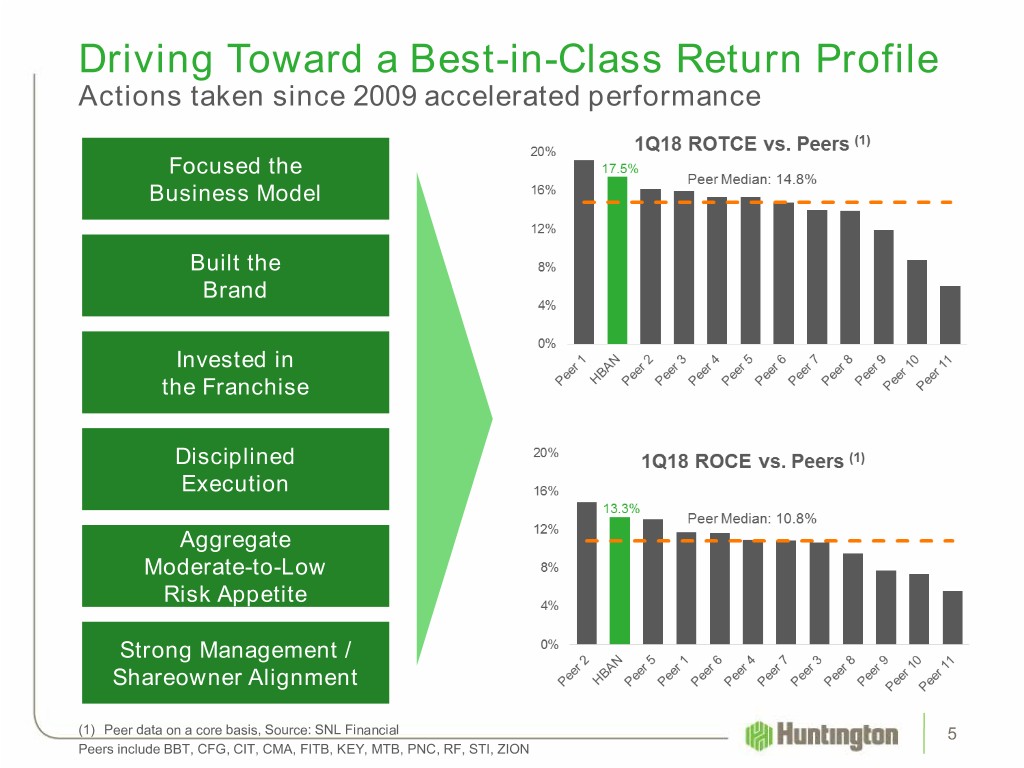
Driving Toward a Best-in-Class Return Profile Actions taken since 2009 accelerated performance Focused the Business Model Built the Brand Invested in the Franchise Disciplined Execution Aggregate Moderate-to-Low Risk Appetite Strong Management / Shareowner Alignment (1) Peer data on a core basis, Source: SNL Financial 5 Peers include BBT, CFG, CIT, CMA, FITB, KEY, MTB, PNC, RF, STI, ZION

Positioned for Strong Relative Performance Through-the-Cycle Note: Ranking among 19 traditional commercial banks 6 (1) Non-GAAP financial metric; see Reconciliation on slide 9; (2) Annualized; (3) 1Q18 average balances; (4) projected minimum in the Federal Reserve Severely Adverse Scenario
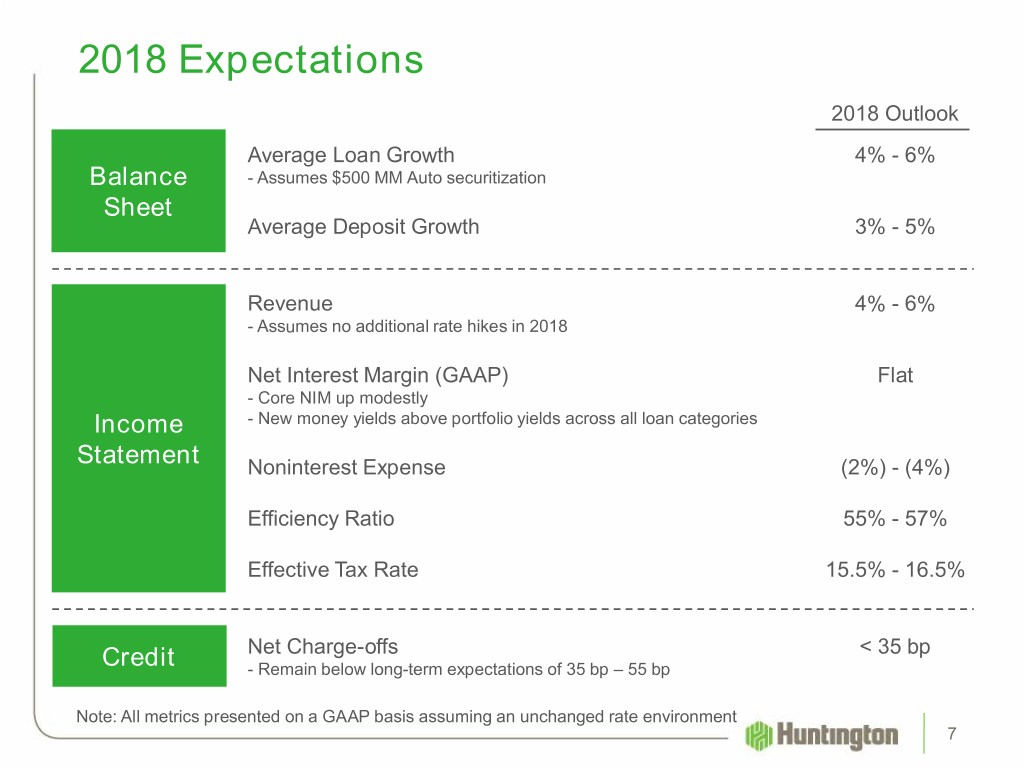
2018 Expectations 2018 Outlook Average Loan Growth 4% - 6% Balance - Assumes $500 MM Auto securitization Sheet Average Deposit Growth 3% - 5% Revenue 4% - 6% - Assumes no additional rate hikes in 2018 Net Interest Margin (GAAP) Flat - Core NIM up modestly Income - New money yields above portfolio yields across all loan categories Statement Noninterest Expense (2%) - (4%) Efficiency Ratio 55% - 57% Effective Tax Rate 15.5% - 16.5% Net Charge-offs < 35 bp Credit - Remain below long-term expectations of 35 bp – 55 bp Note: All metrics presented on a GAAP basis assuming an unchanged rate environment 7
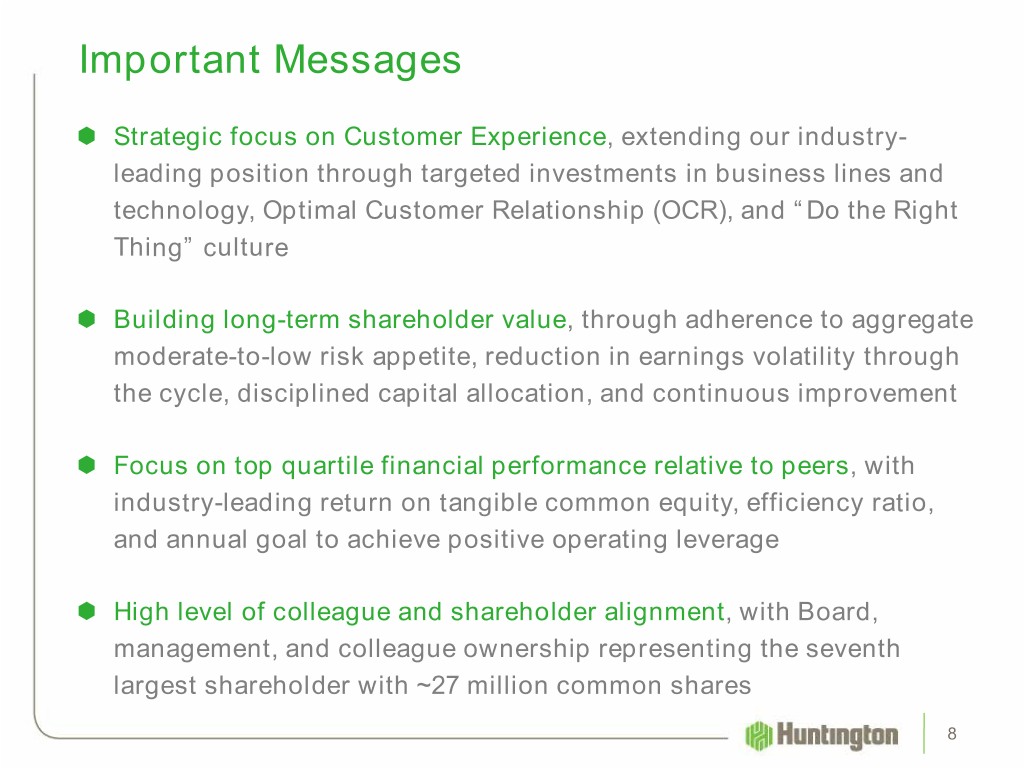
Important Messages Strategic focus on Customer Experience, extending our industry- leading position through targeted investments in business lines and technology, Optimal Customer Relationship (OCR), and “Do the Right Thing” culture Building long-term shareholder value, through adherence to aggregate moderate-to-low risk appetite, reduction in earnings volatility through the cycle, disciplined capital allocation, and continuous improvement Focus on top quartile financial performance relative to peers, with industry-leading return on tangible common equity, efficiency ratio, and annual goal to achieve positive operating leverage High level of colleague and shareholder alignment, with Board, management, and colleague ownership representing the seventh largest shareholder with ~27 million common shares 8
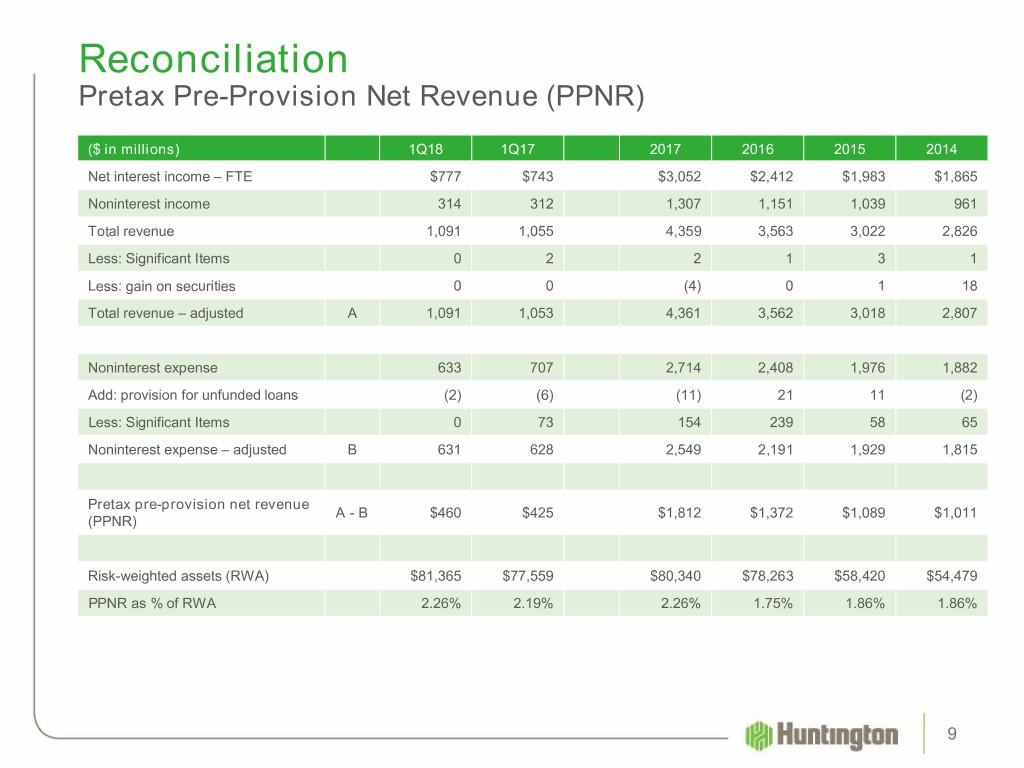
Reconciliation Pretax Pre-Provision Net Revenue (PPNR) ($ in millions) 1Q18 1Q17 2017 2016 2015 2014 Net interest income – FTE $777 $743 $3,052 $2,412 $1,983 $1,865 Noninterest income 314 312 1,307 1,151 1,039 961 Total revenue 1,091 1,055 4,359 3,563 3,022 2,826 Less: Significant Items 0 2 2 1 3 1 Less: gain on securities 0 0 (4) 0 1 18 Total revenue – adjusted A 1,091 1,053 4,361 3,562 3,018 2,807 Noninterest expense 633 707 2,714 2,408 1,976 1,882 Add: provision for unfunded loans (2) (6) (11) 21 11 (2) Less: Significant Items 0 73 154 239 58 65 Noninterest expense – adjusted B 631 628 2,549 2,191 1,929 1,815 Pretax pre-provision net revenue A - B $460 $425 $1,812 $1,372 $1,089 $1,011 (PPNR) Risk-weighted assets (RWA) $81,365 $77,559 $80,340 $78,263 $58,420 $54,479 PPNR as % of RWA 2.26% 2.19% 2.26% 1.75% 1.86% 1.86% 9
