Attached files
| file | filename |
|---|---|
| 8-K - 8-K - CF BANKSHARES INC. | cfbk-20180530x8k.htm |
Exhibit 99
Central Federal Corporation Annual Stockholders Meeting Wednesday May 30, 2018 Columbus Cleveland Cincinnati Fairlawn Columbiana County
FORWARD LOOKING STATEMENTS Comments made in this presentation include “forward-looking statements ”within the meaning of the Private Securities Litigation Reform Act of 1995and are made in good faith by us. forward-looking statements include, but are not limited to: (1) projections of revenues, income or loss, earnings or loss per common share, capital structure and other financial items; (2) plans and objectives of the management or Boards of Directors of Central Federal Corporation (the“HoldingCompany”) or CFBank, National Association (“CFBank”); (3) statements regarding future events, actions or economic performance; and (4) statements of assumptions underlying such statements.Words such as"estimate,""strategy,""may,""believe,""anticipate," "expect,""predict,""will,""intend,""plan,""targeted,"and the negative of these terms,or similar expressions,are intended to identifyforward-lookingstatements, but are not the exclusive means of identifying such statements.Various risks and uncertainties may cause actual results to differ materially from those indicated by our forward-looking statements. For factors that could cause actual results to differ from our forward-looking statement, please refer to “RiskFactors”in the Company's Form10-K and other reports filed with the SEC.
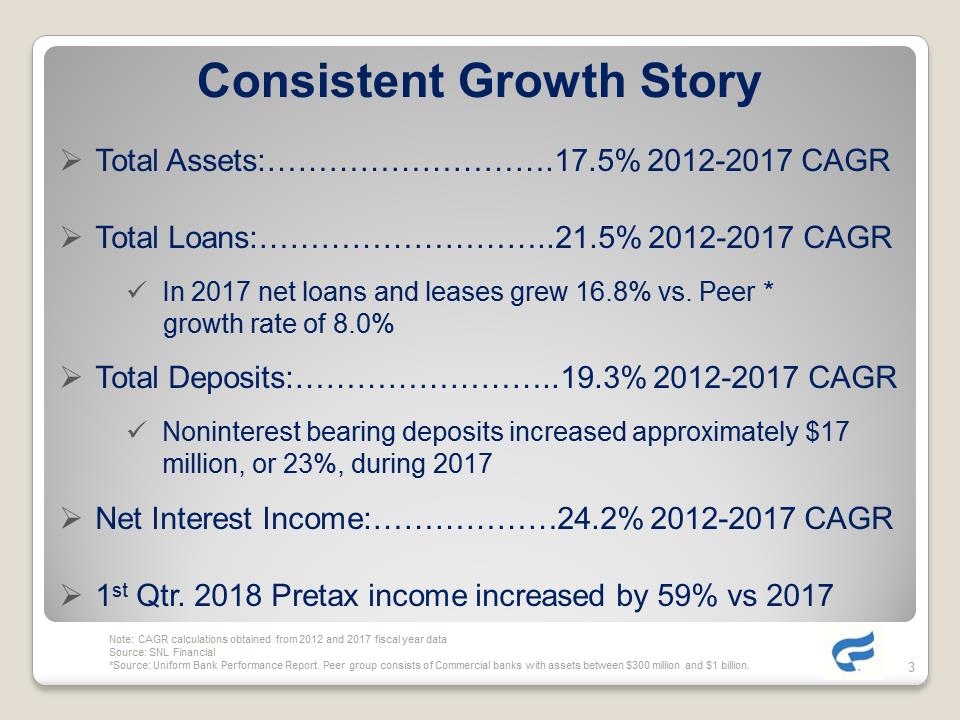
Consistent Growth Story. Total Assets: 17.5% 2012-2017 CAGR. Total Loans:.21.5% 2012-2017 CAGR .In 2017 net loans and leases grew 16.8% vs. Peer * growth rate of 8.0%.Total Deposits:19.3% 2012-2017 CAGR. Noninterest bearing deposits increased approximately $17 million, or 23%, during 2017. Net Interest Income:24.2% 2012-2017 CAGR.1st Qtr. 2018 Pretax income increased by 59% vs 2017 Note: CAGR calculations obtained from 2012 and 2017 fiscal year data Source: SNL Financial *Source: Uniform Bank Performance Report. Peer group consists of Commercial banks with assets between $300 million and $1 billion.
CFBANK, OUR BUSINESS MODEL. Full service Commercial Banking .C&I.CRE.SBA (PLP).Interest Rate Swap .Equipment Leasing .Cash Management products and services. Mortgage Lending .Recently began expanding Residential Mortgage Lending volumes (Direct to Consumer) similar to Quicken Model. Hired experienced proven Mortgage Lending Team
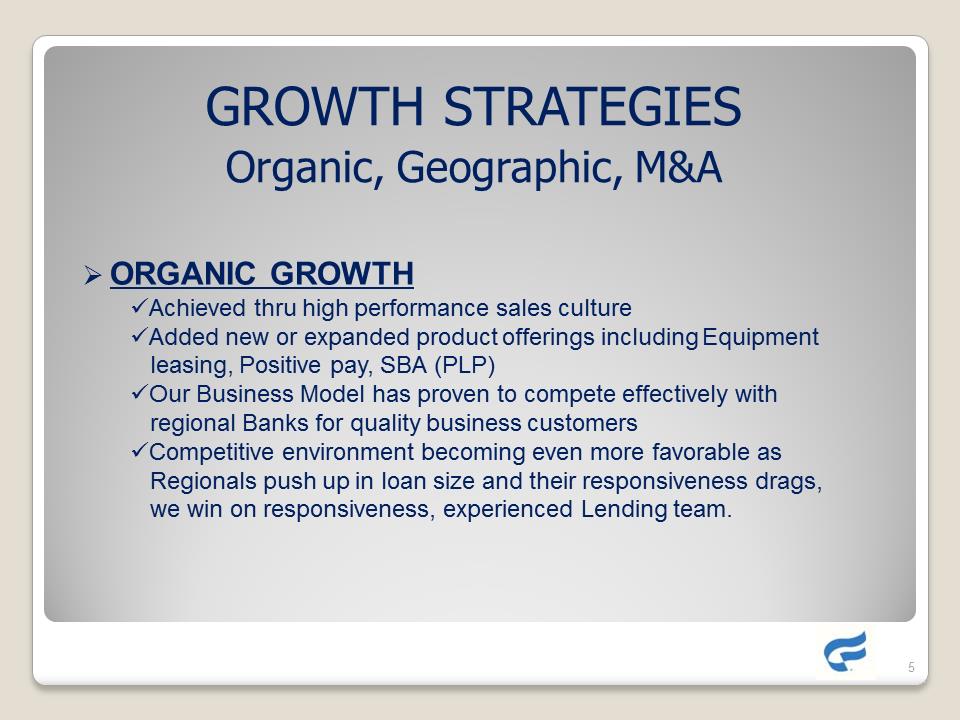
GROWTH STRATEGIES Organic, Geographic, M&A.ORGANIC GROWTH. Achieved thru high performance sales culture .Added new or expanded product offerings including Equipment leasing, Positive pay, SBA (PLP).Our Business Model has proven to compete effectively with regional Banks for quality business customers. Competitive environment becoming even more favorable as Regionals push up in loan size and their responsiveness drags, we win on responsiveness, experienced Lending team.
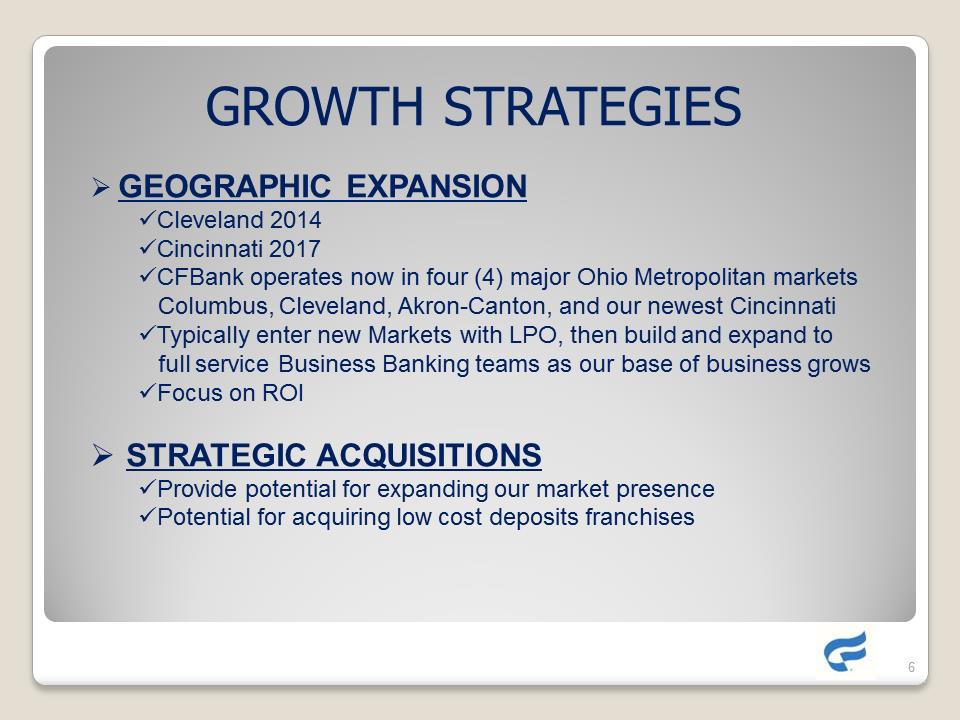
GROWTH STRATEGIES Organic, Geographic, M&A.ORGANIC GROWTH. Achieved thru high performance sales culture .Added new or expanded product offerings including Equipment leasing, Positive pay, SBA (PLP).Our Business Model has proven to compete effectively with regional Banks for quality business customers. Competitive environment becoming even more favorable as Regionals push up in loan size and their responsiveness drags, we win on responsiveness, experienced Lending team. GROWTH STRATEGIES. GEOGRAPHIC EXPANSION. Cleveland 2014.Cincinnati 2017.CFBank operates now in four (4) major Ohio Metropolitan markets Columbus, Cleveland, Akron-Canton, and our newest Cincinnati. Typically enter new Markets with LPO, then build and expand to full service Business Banking teams as our base of business grows. Focus on ROI. STRATEGIC ACQUISITIONS. Provide potential for expanding our market presence. Potential for acquiring low cost deposits franchises
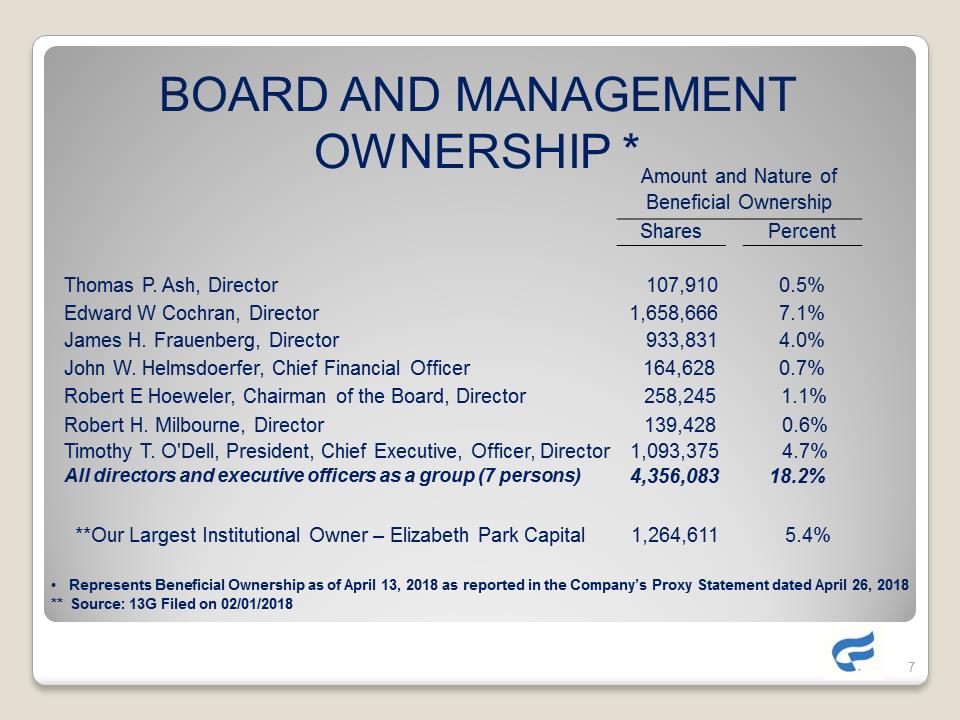
BOARD AND MANAGEMENTOWNERSHIP *Amount and Nature of Beneficial Ownership Shares Percent Thomas P. Ash, Director 107,910 0.5% Edward W Cochran, Director 1,658,666 7.1%James H. Frauenberg, Director933,831 4.0% John W. Helmsdoerfer, Chief Financial Officer 164,628 0.7% Robert H. Milbourne, Director 139,428 0.6% Timothy T. O'Dell, President, Chief Executive, Officer, Director 1,093,375 4.7% All directors and executive officers as a group (7 persons) 4,356,08318.2% Robert E Hoeweler, Chairman of the Board, Director 258,245 1.1% •Represents Beneficial Ownership as of April 13, 2018 as reported in the Company’s Proxy Statement dated April 26, 2018 ** Source: 13GFiled on 02/01/2018 **Our Largest Institutional Owner –Elizabeth Park Capital 1,264,611 5.4%
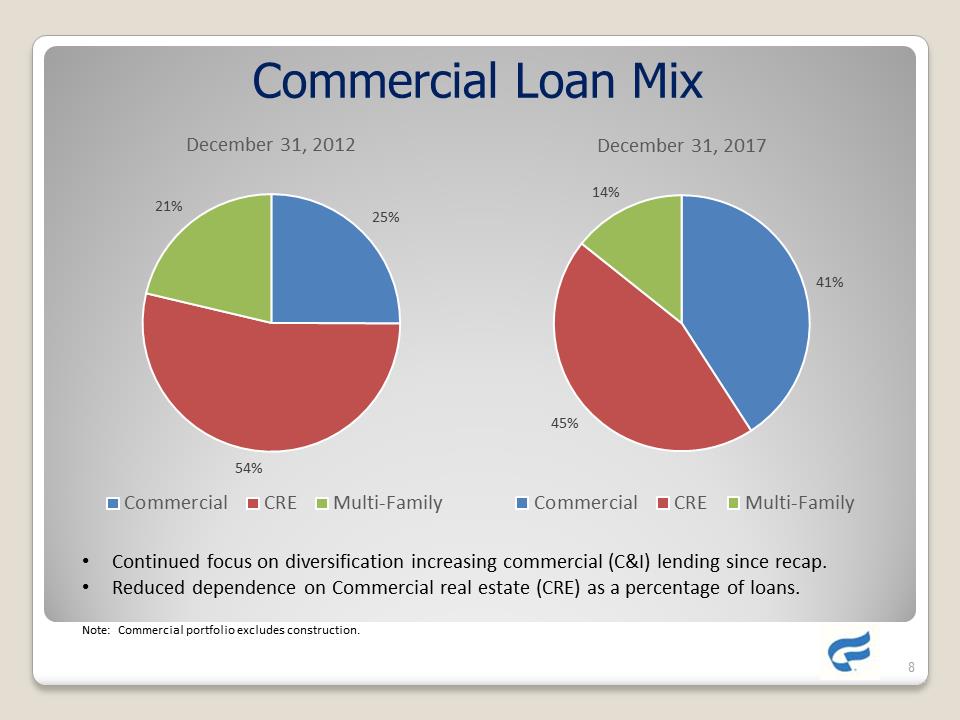
Commercial Loan Mix 25% 54% 21% December 31, 2012 Commercial CRE Multi-Family December 31, 2017 Commercial CRE Multi-Family 41% 45% 14% •Continued focus on diversification increasing commercial (C&I) lending since recap.• Reduced dependence on Commercial real estate (CRE) as a percentage of loans.Note: Commercial portfolio excludes construction.
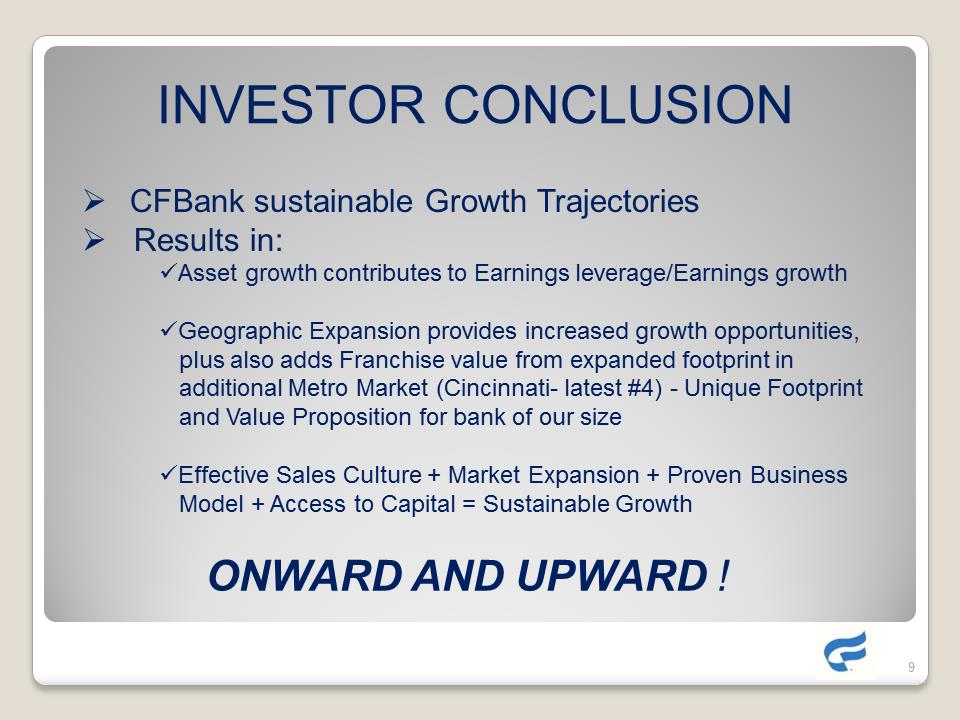
INVESTOR CONCLUSION CFBank sustainable Growth Trajectories .Results in: Asset growth contributes to Earnings leverage/Earnings growth. Geographic Expansion provides increased growth opportunities, plus also adds Franchise value from expanded footprint in additional Metro Market (Cincinnati-latest #4) -Unique Footprint and Value Proposition for bank of our size. Effective Sales Culture + Market Expansion + Proven Business Model + Access to Capital = Sustainable Growth ONWARD AND!
FINANCIAL HIGHLIGHTS John Helmsdoerfer, EVP & CFO
FINANCIAL HIGHLIGHTS Keys to Success Continued earnings improvement. Optimizing balance sheet performance. Maintaining strong credit quality. Continued capital strength to support growth. Driving noninterest income. Achieving operational efficiencies
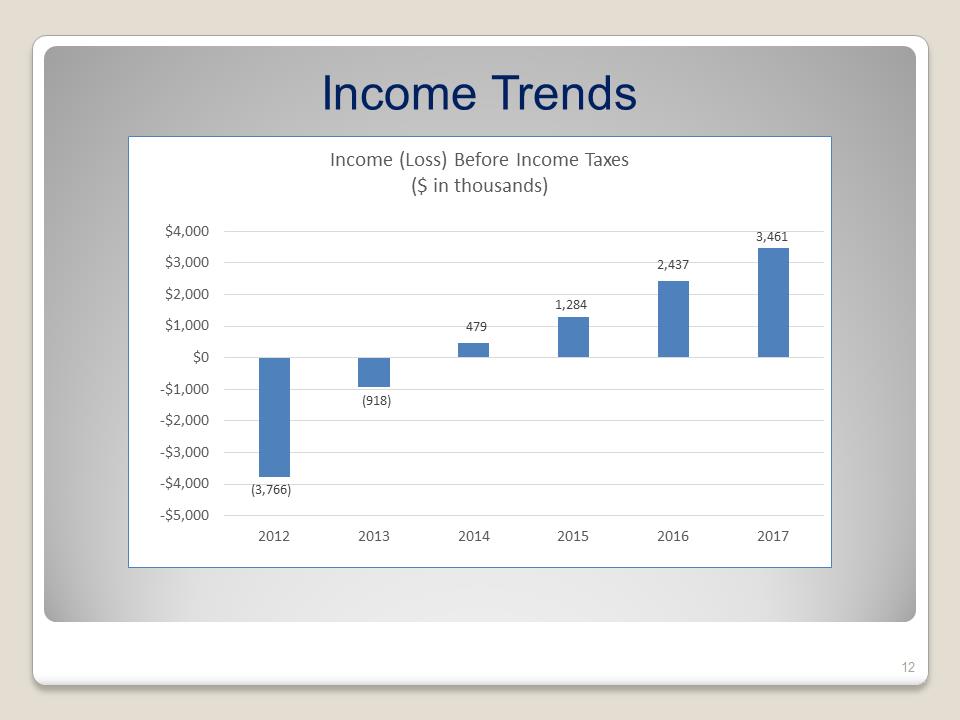
Income Trends (3,766)(918)479 1,284 2,437 3,461 -$5,000-$4,000-$3,000-$2,000-$1,000 $0 $1,000 $2,000 $3,000 $4,000 2012 2013 2014 2015 2016 2017Income (Loss) Before Income Taxes ($ in thousands)
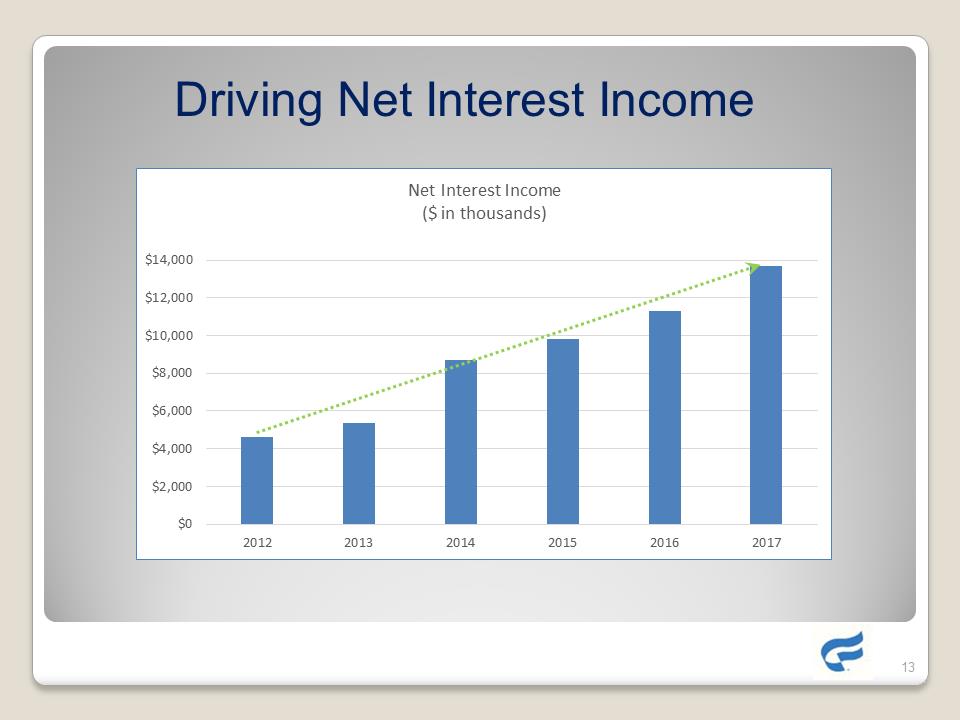
Driving Net Interest Income $0 $2,000 $4,000 $6,000 $8,000 $10,000 $12,000 $14,000 2012 2013 2014 2015 2016 2017 Net Interest Income ($ in thousands)
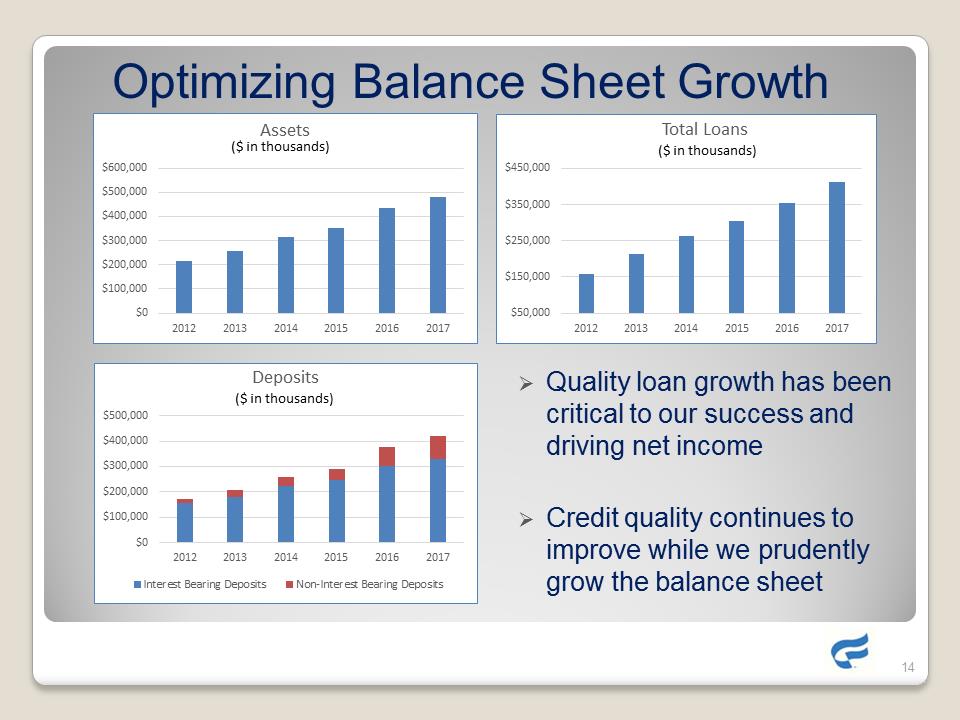
Optimizing Balance Sheet Growth. Quality loan growth has been critical to our success and driving net income. Credit quality continues to improve while we prudently grow the balance sheet$0 $100,000 $200,000 $300,000 400,000 $500,000 $600,000 2012 2013 2014 2015 2016 2017 Assets ($ in thousands) $50,000 $150,000 $250,000 $350,000 $450,000 2012 2013 2014 2015 2016 2017otal Loans ($ in thousands)$0 $100,000 $200,000 $300,000 $400,000 $500,000 2012 2013 2014 2015 2016 2017 Deposits Interest Bearing Deposits Non-Interest Bearing Deposits ($ in thousands)
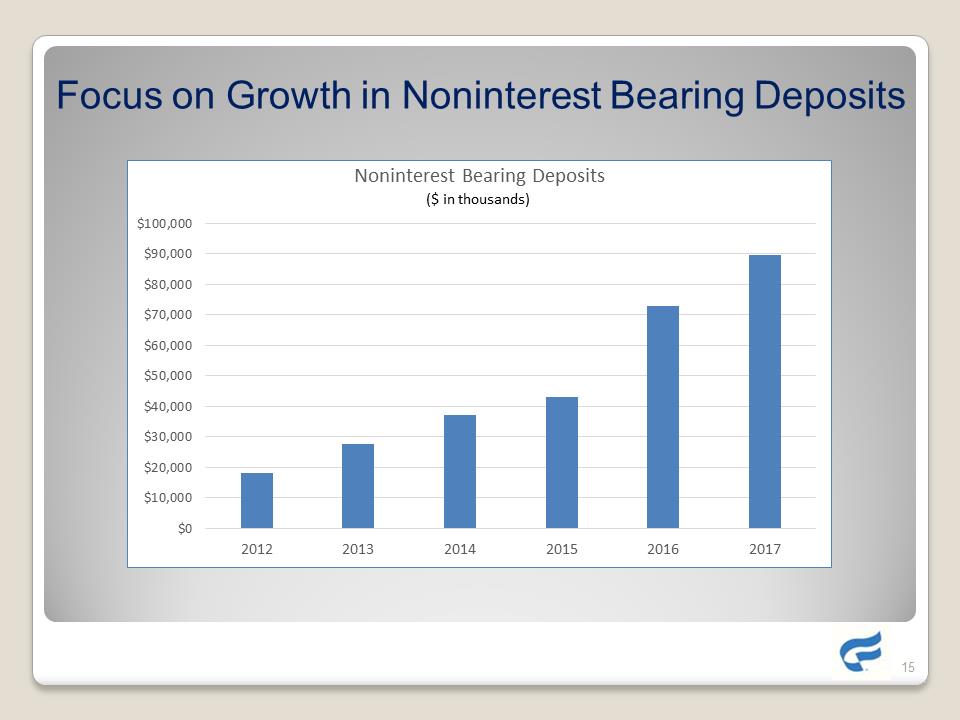
Focus on Growth in Noninterest Bearing Deposits$0 $10,000 $20,000 $30,000 $40,000 $50,000 $60,000 $70,000 $80,000 $90,000 $100,000 2012 2013 2014 2015 2016 2017 Noninterest Bearing Deposits($ in thousands)
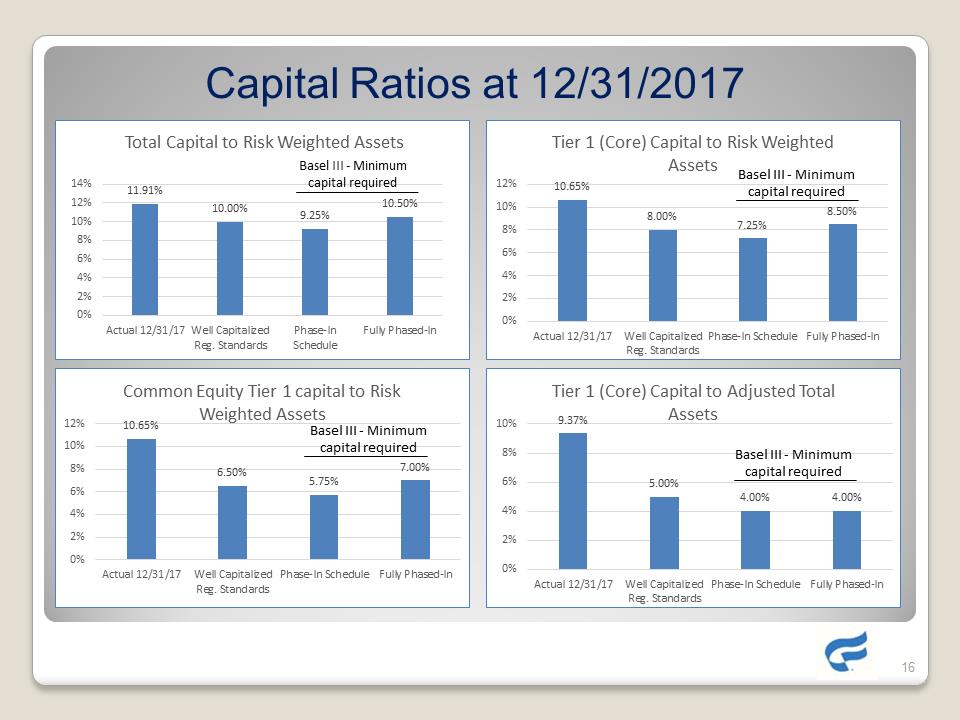
Capital Ratios at 12/31/2017 11.91% 10.00% 9.25% 10.50% 0% 2% 4% 6% 8% 10% 12% 14% Actual 12/31/17Well Capitalized Reg. Standards Phase-In Schedule Fully Phased-In Total Capital to Risk Weighted Assets Basel III -Minimum capital required10.65%8.00%7.25%8.50%0%2%4%6%8%10%12%Actual 12/31/17Well Capitalized Reg. Standards Phase-In Schedule Fully Phased-In Tier 1 (Core) Capital to Risk Weighted Assets Basel III -Minimum capital required10.65%6.50%5.75%7.00%0%2%4%6%8%10%12%Actual 12/31/17Well Capitalized Reg. Standards Phase-In Schedule Fully Phased-In Common Equity Tier 1 capital to Risk Weighted Assets Basel III -Minimum capital required9.37%5.00%4.00%4.00%0%2%4%6%8%10% Actual 12/31/17Well Capitalized Reg. Standards Phase-In Schedule Fully Phased-In Tier 1 (Core) Capital to Adjusted Total Assets Basel III -Minimum capital required
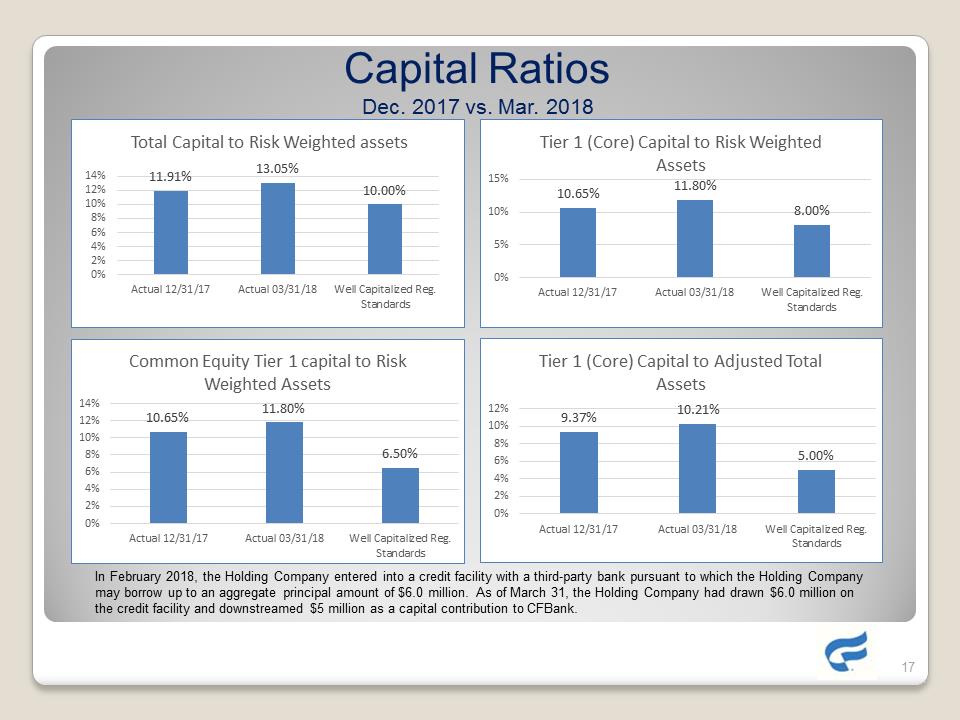
Capital Ratios Dec. 2017 vs. Mar. 2018 11.91%13.05%10.00%0%2%4%6%8%10%12%14%Actual 12/31/17Actual 03/31/18Well Capitalized Reg. Standards Total Capital to Risk Weighted assets 10.65%11.80%8.00%0%5%10%15%Actual 12/31/17Actual 03/31/18Well Capitalized Reg. Standards Tier 1 (Core) Capital to Risk Weighted Assets10.65%11.80%6.50%0%2%4%6%8%10%12%14%Actual 12/31/17Actual 03/31/18Well Capitalized Reg. Standards Common Equity Tier 1 capital to Risk Weighted Assets9.37%10.21%5.00%0%2%4%6%8%10%12% Actual 12/31/17Actual 03/31/18Well Capitalized Reg. Standards Tier 1 (Core) Capital to Adjusted Total Assets In February 2018, the Holding Company entered into a credit facility with a third-party bank pursuant to which the Holding Company may borrow up to an aggregate principal amount of $6.0 million. As of March 31, the Holding Company had drawn $6.0 million on the credit facility and downstreamed$5 million as a capital contribution to CFBank.
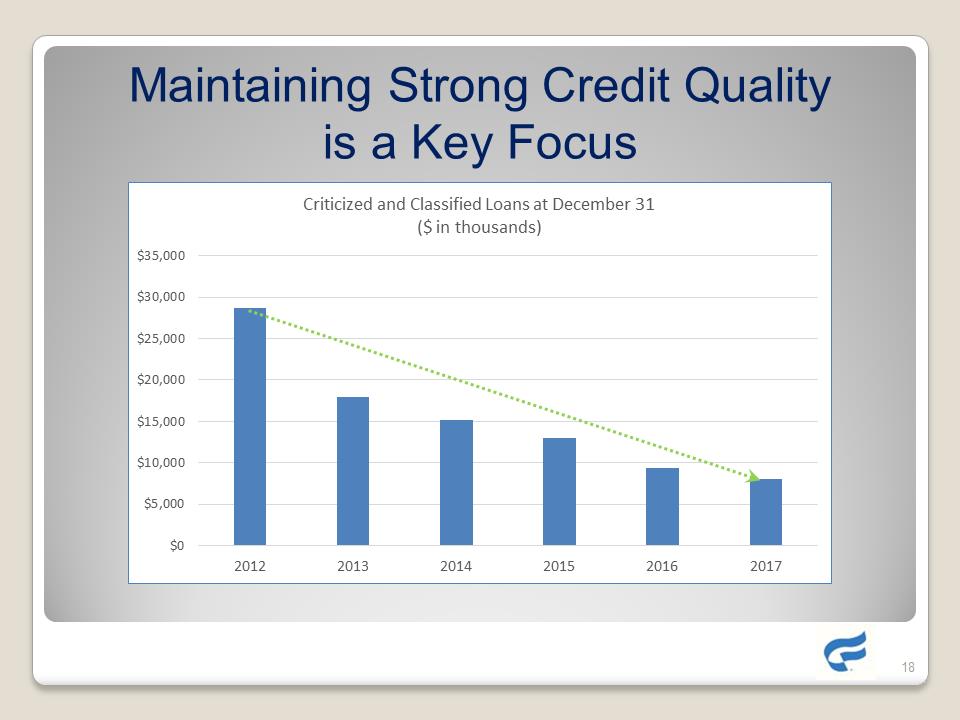
Maintaining Strong Credit Quality is a Key Focus$0$5,000$10,000$15,000 $20,000 $25,000 $30,000 $35,000 2012 2013 2014 2015 2016 2017Criticized and Classified Loans at December 31($ in thousands)
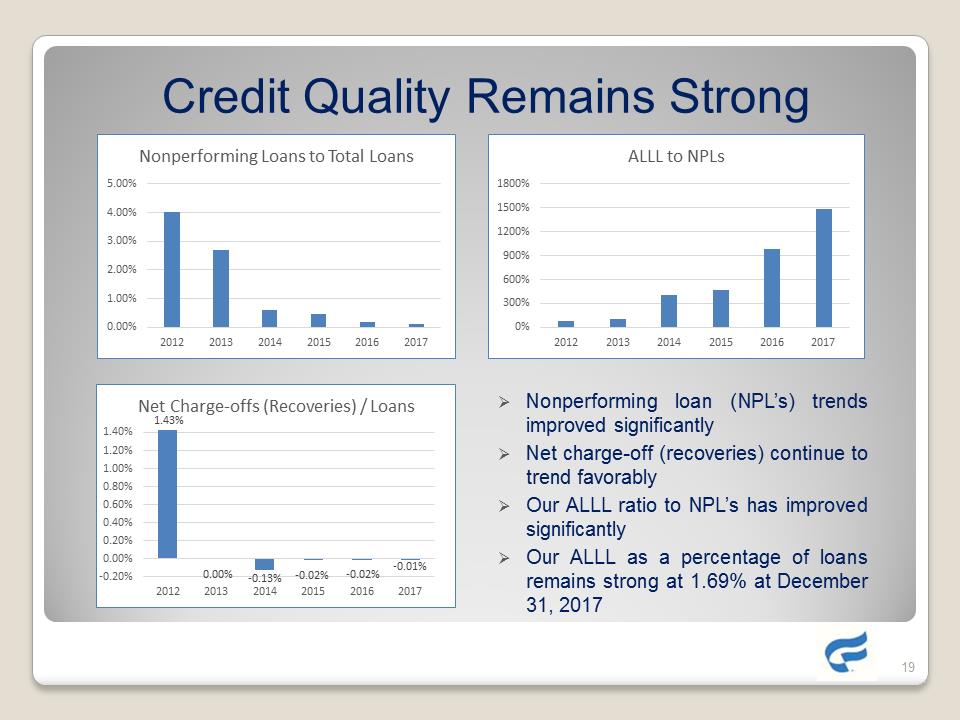
Credit Quality Remains Strong .Nonperforming loan (NPL’s) trends improved significantly. Netcharge-off (recoveries) continue to trend favorably Our ALLL ratio to NPL’s has improved significantly. Our ALLL as a percentage of loans remains strong at1.69% at December31,2017 0.00%1.00%2.00%3.00%4.00%5.00% 2012 2013 2014 2015 2016 2017 Nonperforming Loans to Total Loans0%300%600%900%1200%1500%1800% 2012 2013 2014 2015 2016 2017ALLL to NPLs1.43%0.00%-0.13%-0.02%-0.02%-0.01%-0.20%0.00%0.20%0.40%0.60%0.80%1.00%1.20%1.40% 20122013 2014 2015 2016 2017 Net Charge-offs (Recoveries) / Loans
IN SUMMARY Focus remains on optimizing balance sheet and earnings performance. Continued emphasis on maintaining strong credit quality. Opportunities exist to improve noninterest income. Maintain strong capital position. Achieve operational efficiencies

Thank you!