Attached files
| file | filename |
|---|---|
| EX-23.1 - EX-23.1 - ADAPTIVE INSIGHTS INC | d454129dex231.htm |
| EX-3.1 - EX-3.1 - ADAPTIVE INSIGHTS INC | d454129dex31.htm |
Table of Contents
As filed with the Securities and Exchange Commission on May 29, 2018.
Registration No. 333-224996
UNITED STATES
SECURITIES AND EXCHANGE COMMISSION
Washington, D.C. 20549
AMENDMENT NO. 1
TO
FORM S-1
REGISTRATION STATEMENT
UNDER
THE SECURITIES ACT OF 1933
ADAPTIVE INSIGHTS, INC.
(Exact name of Registrant as specified in its charter)
| Delaware | 7372 | 65-1188215 | ||
| (State or other jurisdiction of incorporation or organization) |
(Primary Standard Industrial Classification Code Number) |
(I.R.S. Employer Identification Number) |
3350 W. Bayshore Road, Suite 200
Palo Alto, California 94303
(650) 528-7500
(Address, including zip code, and telephone number, including area code, of Registrant’s principal executive offices)
Thomas F. Bogan
Chief Executive Officer
Adaptive Insights, Inc.
3350 W. Bayshore Road, Suite 200
Palo Alto, California 94303
(650) 528-7500
(Name, address, including zip code, and telephone number, including area code, of agent for service)
Copies to:
| Eric C. Jensen Jon C. Avina Calise Y. Cheng Cooley LLP 3175 Hanover Street Palo Alto, California 94304 (650) 843-5000 |
James D. Johnson Chief Financial Officer Melanie D. Vinson General Counsel and Secretary Adaptive Insights, Inc. 3350 W. Bayshore Road, Suite 200 Palo Alto, California 94303 (650) 528-7500 |
Gordon K. Davidson Jeffrey R. Vetter James D. Evans Fenwick & West LLP 801 California Street Mountain View, California 94041 (650) 988-8500 |
Approximate date of commencement of proposed sale to the public: As soon as practicable after this Registration Statement is declared effective.
If any of the securities being registered on this form are to be offered on a delayed or continuous basis pursuant to Rule 415 under the Securities Act of 1933, check the following box. ☐
If this form is filed to register additional securities for an offering pursuant to Rule 462(b) under the Securities Act, check the following box and list the Securities Act registration statement number of the earlier effective registration statement for the same offering. ☐
If this form is a post-effective amendment filed pursuant to Rule 462(c) under the Securities Act, check the following box and list the Securities Act registration statement number of the earlier effective registration statement for the same offering. ☐
If this form is a post-effective amendment filed pursuant to Rule 462(d) under the Securities Act, check the following box and list the Securities Act registration statement number of the earlier effective registration statement for the same offering. ☐
Indicate by check mark whether the registrant is a large accelerated filer, an accelerated filer, a non-accelerated filer, a smaller reporting company or an emerging growth company. See the definitions of “large accelerated filer,” “accelerated filer,” “smaller reporting company” and “emerging growth company” in Rule 12b-2 of the Exchange Act.
| Large accelerated filer | ☐ | Accelerated filer | ☐ | |||
| Non-accelerated filer | ☒ (Do not check if a smaller reporting company) | Smaller reporting company | ☐ | |||
| Emerging growth company | ☒ |
If an emerging growth company, indicate by check mark if the registrant has elected not to use the extended transition period for complying with any new or revised financial accounting standards provided pursuant to Section 7(a)(2)(B) of the Securities Act. ☐
CALCULATION OF REGISTRATION FEE
|
| ||||
| Title of Each Class of Securities To Be Registered |
Proposed Maximum Aggregate Offering Price(1)(2) |
Amount of Registration Fee | ||
| Common Stock, $0.001 par value per share |
$100,000,000 | $12,450(3) | ||
|
| ||||
|
| ||||
| (1) | Estimated solely for the purpose of calculating the registration fee pursuant to Rule 457(o) under the Securities Act of 1933, as amended. |
| (2) | Includes the aggregate offering price of additional shares that the underwriters have the option to purchase, if any. |
| (3) | Previously paid. |
The Registrant hereby amends this Registration Statement on such date or dates as may be necessary to delay its effective date until the Registrant shall file a further amendment which specifically states that this Registration Statement shall thereafter become effective in accordance with Section 8(a) of the Securities Act of 1933 or until the Registration Statement shall become effective on such date as the Commission, acting pursuant to said Section 8(a), may determine.
Table of Contents
The information in this preliminary prospectus is not complete and may be changed. We may not sell these securities until the registration statement filed with the Securities and Exchange Commission is effective. This prospectus is not an offer to sell these securities and we are not soliciting offers to buy these securities in any jurisdiction where the offer or sale is not permitted.
PRELIMINARY PROSPECTUS (Subject to Completion)
Issued May 29, 2018
SHARES

COMMON STOCK
This is an initial public offering of shares of common stock of Adaptive Insights, Inc.
Prior to this offering, there has been no public market for our common stock. We anticipate that the initial public offering price will be between $ and $ per share.
We have applied to list our common stock on the New York Stock Exchange under the symbol “ADIN.”
We are an “emerging growth company” as defined under the federal securities laws. Investing in our common stock involves risks. See “Risk Factors” beginning on page 14.
PRICE $ A SHARE
|
Price to |
Underwriting |
Proceeds to |
||||||||||
| Per Share |
$ | $ | $ | |||||||||
| Total |
$ | $ | $ | |||||||||
| (1) | See the section titled “Underwriting” for additional information regarding compensation payable to the underwriters. |
We have granted the underwriters the right to purchase up to an additional shares of common stock to cover overallotments, if any.
The Securities and Exchange Commission and state regulators have not approved or disapproved of these securities or determined if this prospectus is truthful or complete. Any representation to the contrary is a criminal offense.
The underwriters expect to deliver the shares to purchasers on , 2018.
| MORGAN STANLEY | BofA MERRILL LYNCH | JEFFERIES | RBC CAPITAL MARKETS | |||
| JMP SECURITIES | OPPENHEIMER & CO. | |||||
, 2018.
Table of Contents

Software For People Who Plan Everybody plans.That’s why we make planning easy. P.F. Chang’s relies on Adaptive Insights for corporate-wide planning across its 400+ restaurants.
Table of Contents
Prospectus
Through and including , 2018 (the 25th day after the date of this prospectus), all dealers effecting transactions in these securities, whether or not participating in this offering, may be required to deliver a prospectus. This is in addition to a dealer’s obligation to deliver a prospectus when acting as an underwriter and with respect to an unsold allotment or subscription.
We have not authorized anyone to provide you with any information or to make any representations other than those contained in this prospectus or in any free writing prospectuses we have prepared. We and the underwriters take no responsibility for, and can provide no assurance as to the reliability of, any other information that others may give you. We are offering to sell, and seeking offers to buy, shares of our common stock only in jurisdictions where offers and sales are permitted. The information contained in this prospectus is accurate only as of the date of this prospectus, regardless of the time of delivery of this prospectus or of any sale of our common stock. Our business, financial condition, results of operations and future growth prospects may have changed since that date.
For investors outside the United States: Neither we nor any of the underwriters have done anything that would permit this offering or possession or distribution of this prospectus in any jurisdiction where action for that purpose is required, other than in the United States. Persons outside of the United States who come into possession of this prospectus must inform themselves about, and observe any restrictions relating to, the offering of the shares of our common stock and the distribution of this prospectus outside of the United States.
Table of Contents
This summary highlights selected information contained elsewhere in this prospectus. This summary does not contain all of the information you should consider before investing in our common stock. You should read this entire prospectus carefully, including the sections titled “Risk Factors,” “Management’s Discussion and Analysis of Financial Condition and Results of Operations” and our consolidated financial statements and the related notes included elsewhere in this prospectus, before making an investment decision. Our fiscal year ends on January 31. Unless the context otherwise requires, all references in this prospectus to “we,” “us,” “our,” “our company” and “Adaptive Insights” refer to Adaptive Insights, Inc.
ADAPTIVE INSIGHTS, INC.
Overview
We are a leading provider of cloud-based software to modernize business planning. Our platform—the Adaptive Insights Business Planning Cloud—transforms business planning into a strategic and competitive advantage by enabling organizations to respond to changing business conditions with confidence and agility. The Adaptive Insights Business Planning Cloud allows customers to rapidly and effectively model their businesses, monitor and analyze performance on an ongoing basis, share dashboards, and generate management reports. In addition, customers can use our Business Planning Cloud to evaluate actual performance versus plan, test alternative scenarios, and leverage insights from analytics to make informed, timely decisions that drive future business results.
Every organization plans. This includes small businesses, nonprofits, government agencies and Fortune 500 enterprises. Within these organizations, every function and department plans. We believe the Adaptive Insights Business Planning Cloud is capable of transforming how all organizations plan.
Our Business Planning Cloud is:
| • | Easy—our intuitive, accessible user interface empowers all users within an organization to contribute to the planning and performance management process. |
| • | Powerful—our innovative, in-memory architecture scales to support very large and complex multi-dimensional models, enabling users to run and analyze virtually unlimited scenarios. |
| • | Fast—users can quickly access and update planning models utilizing data from numerous sources, allowing people across an organization to access real-time views of performance versus plan, and rapidly respond to change. |
Our Business Planning Cloud enables a continuous, comprehensive, and collaborative planning process across the organization—from business-wide planning to in-depth planning within specific business units and functions, such as sales, marketing and operations.
We believe that the market opportunity for our cloud-based planning platform is largely untapped because most organizations still rely on spreadsheets and other manual processes to plan. Our solutions are capable of addressing these opportunities and are also a modern replacement for legacy planning tools. Our platform is easy to use, has powerful modeling capabilities, enables insights from analytics, facilitates rapid iterative planning processes, and offers fast time-to-value and low total cost of ownership for our customers. This allows us to address the needs of a wide range of organizations, whether they use legacy planning tools or spreadsheets and manual processes to plan. To capitalize on this opportunity, we have built both a direct sales force and a customer success team. We also have a global partner ecosystem, which includes over 150 software solution
1
Table of Contents
providers, enterprise resource planning vendors, systems integrators and regional consulting firms. We have been consistently recognized as a leader in the market and were positioned as a Leader in the 2017 Gartner Magic Quadrant for Cloud Strategic Corporate Performance Management Solutions for the second consecutive year. Additionally, we are positioned as a Leader by Forrester in its most recent Wave on this topic, the 2016 Forrester Enterprise Performance Management (EPM) Wave Report.
We believe that our customers are our greatest asset. As of April 30, 2018, we had over 3,800 customers located in more than 50 countries. Our powerful and scalable platform with an intuitive user interface is able to reach across the market spectrum, as low total cost of ownership makes it accessible to small and medium-sized business, or SMB, and mid-market customers. At the same time, our scalability enables us to serve large enterprise customers. Our solutions have broad applicability across all types of organizations, and our domain expertise in certain verticals enhances our market leadership.
Our mission is to free people to do their best work and to empower teams to better manage their business. We do this in part by eliminating repetitive, manual tasks, enabling people to do higher value, more strategic work. Because of this, our customers are passionate about how our solutions have transformed their day-to-day jobs.
We initially created our Business Planning Cloud for financial planning and analysis teams. Over time, our customers have leveraged our platform’s flexible modeling capabilities to create solutions to address other use cases specific to their businesses. For example, a global airline extended their use of our platform to analyze route profitability, and a global software company expanded their use of our platform for integrated departmental budgeting and sales quota and capacity planning. We recently introduced a purpose-built solution for sales planning and analysis targeting sales teams, and we plan to continue to provide new solutions to address additional customer needs outside of finance and sales.
We have experienced significant platform adoption leading to revenue growth in recent periods. For our fiscal years ended January 31, 2016, 2017 and 2018, our total revenues were $61.7 million, $81.8 million and $106.5 million, respectively. For the three months ended April 30, 2017 and 2018, our total revenues were $24.2 million and $32.1 million, respectively. For our fiscal years ended January 31, 2016, 2017 and 2018, our subscription revenues were $49.4 million, $69.7 million and $93.9 million, respectively. For the three months ended April 30, 2017 and 2018, our subscription revenues were $21.2 million and $28.3 million, respectively. Our net losses were $59.1 million, $44.7 million and $42.7 million for the fiscal years ended January 31, 2016, 2017 and 2018, respectively. Our net losses were $10.0 million and $11.0 million for the three months ended April 30, 2017 and 2018, respectively.
Industry Background
Planning is a Universal, Mission-Critical Function
Every organization plans, from small businesses and nonprofits to government agencies and Fortune 500 enterprises. Within organizations, every function plans, including finance, sales, marketing and operations. An effective planning process democratizes participation across an organization, enabling managers to determine strategy, set priorities and allocate resources, while providing a real-time, single source of truth in order to monitor, evaluate and report on performance. Leveraging insights from this planning process, companies are able to make timely and better-informed decisions to drive future results.
Businesses Need to Adapt to Dynamic Markets Faster Than Ever Before
The global business environment is increasingly competitive and dynamic. The fast pace of technological development enables companies to launch and scale quickly, while requiring them to adapt to shortened product
2
Table of Contents
cycles and increased customer expectations. At the same time, with advances in technology, organizations of all sizes are now capturing more data than ever before. This data, however, is often locked away in siloed applications or systems of record within an organization. The relative speed with which an organization can utilize this data and adapt its plans to changing market dynamics is increasingly important as a competitive advantage.
Cloud-Based Software Has Significant Advantages
Mission-critical applications are increasingly being delivered reliably, securely and cost-effectively to customers via the cloud without the need to purchase and manage supporting hardware, or engage in costly upgrades or ongoing maintenance. More importantly, cloud-based solutions more readily facilitate real-time collaboration across the organization, which is particularly relevant to an effective planning process.
Limitations of Existing Planning Tools
Most organizations still use legacy tools, spreadsheets and manual processes for planning purposes. Due to the limitations of these existing tools, businesses currently face numerous challenges with their planning processes.
| • | Business Planning is Episodic and Lacks Agility. To compete effectively, organizations need to have a continuous planning process in which plans are revised and adapted on an ongoing basis. However, due to the limitations of current planning tools, many organizations only engage in the planning process on an episodic basis, leading to plans that are out of date by the time they are completed. According to an Association of Finance Professionals Benchmarking Survey from October 2016, it takes a typical organization 75 days to complete its annual planning process. |
| • | Planning is Conducted in Silos with Stale Data. In order for organizations to plan effectively, teams and departments need to be able to collaborate with one another using assumptions and accurate data that are shared. However, due to the limitations of legacy tools, spreadsheets and manual processes, teams are often forced to plan in isolation, without access to a real-time, accurate or centralized source of data, leading to inconsistencies and lack of an organization-wide view. |
| • | Existing Business Planning Processes are Error Prone. Legacy tools, spreadsheets and manual processes often introduce errors and delays into businesses planning processes. Multiple users operating in silos use different assumptions and different data, resulting in a lack of coordination across the organization. In addition, the often manual and time-consuming aggregation of disparate plans into an organization-wide view adds a further layer of complexity and risk to an already burdensome process. |
| • | Current Tools Do Not Effectively Provide Business Insights. Organizations need to be able to leverage their historical performance and key performance indicators, or KPIs, in order to develop informed assumptions that influence future business strategy. However, traditional legacy tools are too complicated for non-finance users, and spreadsheets and manual processes are too limited in capability. Neither of these legacy approaches provides widespread access to reliable data and analytics. |
| • | Legacy Planning Tools are Costly and Burdensome. On-premise legacy tools typically used by enterprise customers require considerable support from dedicated IT resources or professional services for model changes, report creation, data integration and data management. Significant investments in costly professional services are also required to deploy, customize, maintain and update these legacy systems. Spreadsheets burden organizations of all sizes with manual processes that take critical business resources away from strategic tasks and focus them on low-value tasks, such as the aggregation of data. |
3
Table of Contents
The Adaptive Insights Business Planning Cloud
Our Business Planning Cloud is a flexible and scalable platform that enables and empowers planning processes, including modeling, scenario planning, monitoring, reporting and analysis. Our platform drives continuous, active planning across the organization—from business-wide financial planning and analysis, to in-depth planning for specific functions such as sales, marketing and operations. We have designed our Business Planning Cloud to enable our customers to build comprehensive models that capture the details of their businesses in real time and gain critical insights from this data, allowing them to rapidly adapt to changes in their environments. Our platform addresses the limitations of existing business planning tools and manual processes through the following key attributes:
| • | Easy. We employ a “click not code” approach as a central component of our intuitive, accessible user interface for both “power” users, who use our solutions to build and maintain models, and for business users, who use our solutions to plan for their organization as well as to create and review reports and dashboards without the help of IT. Business users are able to effectively present data and metrics directly from our visual analytics tool, instead of having to create cumbersome slide exhibits, and can more easily answer questions and run scenarios in real-time by drilling into the data with our data exploration capabilities. |
| • | Powerful. Our innovative, in-memory computing platform, which was built for the cloud from day one, includes a highly scalable modeling engine, capable of supporting very large and complex multi-dimensional models with quintillions (1018) of cells. Our platform provides users with the flexibility to model nearly every aspect of their business and to simultaneously run virtually unlimited scenarios, enabling them to drive better decisions. In addition, our platform securely integrates relevant data from across the organization, providing a comprehensive model that enables users to view and respond quickly to changes in the business. |
| • | Fast. Our platform provides rapid scenario planning, allowing users to dynamically model and evaluate multiple scenarios in real time. Our solutions allow users to quickly access and utilize information from existing applications and information systems, including enterprise resource planning, or ERP, customer relationship management, or CRM, and human capital management, or HCM, systems, giving users a real-time view into changes in their business in order to react to change and course correct as necessary. |
Key Benefits
Our solutions provide numerous benefits to our customers, including:
| • | Continuous Decision Making Through Active Planning. We enable organizations to make more informed decisions on a continuous basis, driving better business outcomes. We built our platform to facilitate active planning by utilizing centralized assumptions and drivers, and eliminating time-consuming manual processes. Through our integrated analytics engine, users can access and create ad hoc reports and analytical dashboards on an ongoing basis. The resulting insights can be used to test new scenarios and hypotheses, and take action to respond to changes in market dynamics. |
| • | Collaborative Planning Across the Organization. We enable employees to collaborate with each other using real-time data, rather than conducting their planning processes in silos. By providing ready access to accurate data, our solutions allow users to more effectively engage with stakeholders across the organization. Additionally, our solutions include workflow and task management capabilities that facilitate a transparent, collaborative planning process, and also increase accountability across departments and business units. When more users are planning, and planning in concert, the entire organization benefits. |
4
Table of Contents
| • | Comprehensive Planning and Insights. Our platform enables users to build comprehensive, end-to-end financial and operational models based on their particular business drivers. These models allow users to easily adjust granular base-level assumptions such as sales headcount in a particular region or marketing expenses in a particular channel and see the real-time impact of these changes in financial outcomes and KPIs. A comprehensive planning process also must integrate relevant data from multiple systems of record, which is a key capability of our platform. Further, our platform automates the consolidation of plan inputs from different business units and pushes updated financial data and KPIs to users across the organization, enabling improved planning, reporting and collaboration. |
| • | Single Planning Platform with Unified Data. We built our cloud-based solutions to provide users with access to a single source for real-time plans and data. Our solutions eliminate manual data manipulation and aggregation, reduce errors and standardize data and assumptions across the organization. As a result, managers are able to drive strategy and insights across the organization, improving operational efficiency and effectiveness. |
| • | Eliminate Infrastructure Costs and Manual Processes. Our cloud-based architecture is simple and easy to deploy and manage, eliminating the need to install and maintain costly infrastructure hardware and software that would be necessary for an on-premise legacy deployment. In addition, our customers are able to eliminate time consuming and error prone manual processes utilized in spreadsheet-based planning approaches that create friction and waste resources during the planning cycle. |
Our Competitive Strengths
| • | Market Leadership. We are a pioneer and leader in cloud corporate performance management, or CPM, solutions. In its 2017 Magic Quadrant for Cloud Strategic Corporate Performance Management Solutions for the second consecutive year, Gartner recognized us as a Leader and positioned us the highest for Ability to Execute. We have also been named a Leader in the Forrester EPM Wave Report (2016). Additionally, we have been named a Leader in the 2017 and 2018 Nucleus Research Technology Value Matrix Reports. |
| • | Easy and Intuitive User Interface Enables Broad Applicability. Our Business Planning Cloud is a fast, powerful and scalable platform with an intuitive user interface. Our platform’s ease of use enables rapid time-to-value for our customers and collaboration between all the stakeholders involved in the planning process. We believe that our platform’s ease of use creates a competitive advantage by easing customer transition from Microsoft Excel-based processes, and driving user adoption across functions and in organizations of any size. |
| • | Large, Growing and Passionate Customer Base. With more than 3,800 customers as of April 30, 2018, we believe we have a significantly greater number of cloud customers than any of our competitors. Our customers are passionate about our solutions, which they frequently promote within their organizations and to prospective customers, and repurchase when they move to new organizations. We also gather insights from our large customer base to refine our offerings and expand use cases. |
| • | Finance Expertise. Because finance teams are ultimately responsible for creating an integrated financial plan for the company, they play a critical and central role in the planning process. Our company was founded through the leadership of a former chief financial officer to provide a better planning solution to finance teams, and our deep expertise and credibility with finance makes us effective at meeting and anticipating the unique needs of this strategically important function. |
| • | Vertical Domain Expertise. While our solutions have broad applicability across all types of organizations, our domain expertise in certain verticals, such as software and nonprofits, increases our ability to understand industry-specific customer needs as well as to increase our sales velocity and |
5
Table of Contents
| productivity. Focused selling and tailored solutions enhance our leadership in these and other key verticals. |
| • | Independence and Interoperability. Our open architecture enables interoperability and integration with numerous software applications, back-end systems and other third-party offerings including ERP, CRM and HCM systems typically used by our customers. We offer our customers the flexibility either to use our application programming interfaces, or APIs, or our purpose-built integration framework to manage their own data integrations. |
| • | Partner Ecosystem. We have strong relationships with over 150 partners, including solution providers, systems integrators, ERP vendors and regional consulting firms. Our partnership strategy is tailored to extend our go-to-market reach and enhance our positioning in each market segment. |
Our Market Opportunity
We believe that the market opportunity for our platform is largely untapped as we provide planning solutions for use cases where a cost-effective yet powerful solution has not been historically available. Due to the large number of companies that use spreadsheets and other manual processes today, we estimate that this opportunity is approximately $12.5 billion. We calculated this opportunity using the total number of global companies with more than 100 employees in 2017, based on independent data from S&P Global Market Intelligence, for developed countries in North America, Europe, Asia Pacific, and Latin America. We then multiplied the total number of companies by our average subscription revenues per customer for the fiscal year ended January 31, 2018. In addition, as we continue to expand our product offerings, including our Sales Planning solution, we believe that we have an opportunity to expand our addressable market by increasing the amount customers spend on their organization-wide planning capabilities.
According to IDC, the worldwide market for Enterprise Performance Management, or EPM, software is expected to grow from $4.2 billion in 2018 to $5.0 billion in 2021. We believe this generally captures the purchases by larger enterprises of legacy tools, but largely excludes the opportunity with mid-market and smaller organizations that cannot afford such tools. Within this market, the demand for on-premise software is shrinking as the acceptance of software-as-a-service, or SaaS, continues to grow. IDC estimates that the market for EPM products purchased as SaaS will be $830 million in 2018 and is expected to grow at a compound annual growth rate of 20% from 2018 to 2021. Given our cloud-based architecture, we believe that we are well-positioned to benefit from this shift to cloud-based, collaborative and integrated planning solutions.
Market opportunity estimates and growth forecasts are subject to significant uncertainty, and not every company covered by our market opportunity estimates will necessarily buy planning solutions offered by us or our competitors. Many of the companies used in our market opportunity estimates may choose to continue using legacy tools, spreadsheets, or manual processes in the future. Furthermore, we have historically focused our selling and marketing efforts on mid-market customers, and have focused on selling and marketing in the United States, Canada, the United Kingdom, the Nordics, Australia, New Zealand and Japan. In order for us to successfully address this broader market opportunity, we will need to successfully market and sell our planning solutions to more enterprise customers, where we have only recently made focused investments, as well as further expand our international presence. For further information regarding the limitations of our market opportunity estimates and growth forecasts, please see “Risk Factors—The estimates of market opportunity and forecasts of market growth included in this prospectus may prove to be inaccurate, and even if the market in which we compete achieves the forecasted growth, our business could fail to grow at similar rates, if at all.”
6
Table of Contents
Our Growth Strategy
Our focus on democratizing planning and data access across organizations creates significant growth opportunities. Our growth strategy is focused on new customer acquisition, increasing the number of users and expanding use cases.
| • | Driving new customer acquisition. We have increased our customer base by more than 1,100 customers in the past two fiscal years. Even with our substantial customer base, we believe that we have a large underpenetrated opportunity with a $12.5 billion total addressable market, providing the opportunity for sustained growth. We plan to leverage our brand, innovation, ease of use and scalability to both extend our leadership position in the mid-market and to acquire new customers in international markets, the enterprise market and new verticals. |
| • | Continue international expansion. We continue to focus on international markets as we believe there is a significant global opportunity for cloud CPM solutions. We have a direct sales presence in Australia, Canada, Ireland, Japan, New Zealand and the United Kingdom. We also offer our solutions worldwide through a network of partners. We intend to continue to grow our international revenues in the future. |
| • | Leverage mid-market leadership to grow in the enterprise market. We believe our leadership and experience in the mid-market, as well as the power and scalability of our platform, strongly positions us to expand our customer base more broadly in the enterprise market. For example, for fiscal 2017 and 2018, we had 420 and 468 enterprise customers that contributed $20.1 million and $24.7 million in total revenues, or 25% and 23% of our total revenues, respectively. |
| • | Capitalize on vertical domain expertise. While our solutions are widely applicable across all industries, we have benefited from developing a specialized go-to-market strategy for certain verticals, including software and nonprofit. In fiscal 2019, we are also focusing on business services and biotechnology. |
| • | Expanding wallet share of existing customers. We believe that we have the opportunity to expand the use of our platform within our large customer base of over 3,800 customers by increasing the number of users and use cases, as well as by introducing new solutions such as sales planning. |
| • | Sales planning and additional solutions. Building on the success of Adaptive Insights for Finance, we recently launched Adaptive Insights for Sales, which allows sales teams to plan and optimize their territory assignments and sales capacity investment. We intend to leverage our industry experience, innovation and customer relationships to further invest in extending our platform to address additional customer use cases outside of finance and sales as we focus on democratizing actionable insights for planning across organizations. |
| • | Expanding footprint across existing customers. We aim to increase the use of our platform by increasing the number of users and promoting additional use cases within our customers’ organizations. We capture additional revenues as our customers’ usage of our platform grows across departments and business units, providing us with an opportunity to increase the lifetime value of existing customers. We intend to continue investing in our sales team to drive increased adoption within and across our existing customers. |
Risk Factors Summary
Our business is subject to numerous risks, as more fully described in the section entitled “Risk Factors” immediately following this prospectus summary. These risks include, among others:
| • | We have a history of operating losses and may not achieve profitability in the future. |
7
Table of Contents
| • | The market for cloud-based planning solutions is relatively new and evolving, and if the market does not develop further or develops more slowly than we expect, our business will be adversely affected. |
| • | If we are unable to attract new customers or sell additional solutions to our existing customers, our revenue growth will be adversely affected. |
| • | We cannot predict with certainty our subscription renewal rates and the impact these rates may have on our future revenues and operating results. |
| • | We have historically focused on selling and marketing our cloud-based platform for financial planning to mid-market customers and have only recently made focused investments in selling and marketing to enterprise customers, which makes it difficult to evaluate our future prospects and increases the risk that we will not be successful. |
| • | As we target enterprise customers, our sales cycle may lengthen substantially and our sales and marketing efforts will require considerably more time and expense. |
| • | We face significant competition from both established and new companies offering CPM software solutions, which may have a negative effect on our ability to add new customers, retain existing customers and grow our business. |
| • | We may not be able to sustain our revenue growth rates in the future. |
| • | We cannot predict with certainty the rate of renewal of customers who formerly purchased our solutions through NetSuite, and the dissolution of our partnership with NetSuite has resulted in non-recurring increases in revenue growth rates. |
| • | If we experience significant fluctuations in our rate of growth and fail to balance our expenses with our revenue forecasts, our results could be harmed. |
| • | If we have a security incident or breach involving unauthorized access to customer data, our platform may be perceived as lacking sufficient security, customers may reduce their use of, or stop using, our platform and we may incur significant liabilities. |
| • | Our directors, executive officers, 5% or greater stockholders and their affiliates beneficially owned, in the aggregate, approximately 84% of our outstanding capital stock as of April 30, 2018 and, as a result, if they act together they will exercise significant control over our company and all corporate matters. |
Corporate Information
We were incorporated under the laws of the state of Delaware in May 2003 under the name Visus Technology, Inc., and in November 2003, we changed our name to Adaptive Planning, Inc. In January 2014, we changed our name to Adaptive Insights, Inc. Our principal executive offices are located at 3350 W. Bayshore Road, Suite 200, Palo Alto, California 94303. Our telephone number is (650) 528-7500. Our website address is www.adaptiveinsights.com. Information contained on, or that can be accessed through, our website is not incorporated by reference into this prospectus, and you should not consider information on our website to be part of this prospectus.
The Adaptive Insights design logo, “Adaptive Insights” and our other registered or common law trademarks, service marks, or trade names appearing in this prospectus are the property of Adaptive Insights, Inc. Other trade names, trademarks and service marks used in this prospectus are the property of their respective owners.
Implications of Being an Emerging Growth Company
As a company with less than $1.07 billion in revenues during our last fiscal year, we qualify as an “emerging growth company” as defined in the Jumpstart Our Business Startups Act, or JOBS Act, enacted in
8
Table of Contents
April 2012. An emerging growth company may take advantage of reduced reporting requirements that are otherwise applicable to public companies. These provisions include, but are not limited to:
| • | not being required to comply for a certain period of time with the auditor attestation requirements of Section 404 of the Sarbanes-Oxley Act of 2002, as amended, or the Sarbanes-Oxley Act; |
| • | reduced disclosure obligations regarding executive compensation in our periodic reports, proxy statements and registration statements; and |
| • | exemptions from the requirements of holding a stockholder advisory vote on executive compensation and any golden parachute payments not previously approved. |
We may take advantage of these provisions until the last day of our fiscal year following the fifth anniversary of the date of the first sale of our common stock in this offering. However, if certain events occur prior to the end of such five-year period, including if (i) we become a “large accelerated filer,” with at least $700 million of equity securities held by non-affiliates; (ii) our annual gross revenues exceed $1.07 billion; or (iii) we issue more than $1.0 billion of non-convertible debt in any three-year period, we will cease to be an emerging growth company prior to the end of such five-year period.
We have elected to take advantage of certain of the reduced disclosure obligations in the registration statement of which this prospectus is a part and may elect to take advantage of other reduced reporting requirements in future filings. As a result, the information that we provide to our stockholders may be different than you might receive from other public reporting companies in which you hold equity interests.
In addition, the JOBS Act provides that an “emerging growth company” can take advantage of an extended transition period for complying with new or revised accounting standards. This provision allows an emerging growth company to delay the adoption of some accounting standards until those standards would otherwise apply to private companies. We have elected to use the extended transition period under the JOBS Act. Accordingly, our financial statements may not be comparable to the financial statements of public companies that comply with such new or revised accounting standards.
9
Table of Contents
THE OFFERING
| Common stock offered |
shares | |
| Common stock to be outstanding after this offering |
shares | |
| Over-allotment option |
shares | |
| Use of proceeds |
We estimate that our net proceeds from the sale of our common stock that we are offering will be approximately $ million (or approximately $ million if the underwriters exercise their over-allotment option in full), assuming an initial public offering price of $ per share, the midpoint of the estimated price range set forth on the cover page of this prospectus, and after deducting estimated underwriting discounts and commissions and estimated offering expenses.
We currently intend to use the net proceeds we receive from this offering for general corporate purposes, including working capital, operating expenses and capital expenditures. We also intend to use a portion of the net proceeds we receive from this offering to repay outstanding indebtedness. We may also use a portion of the net proceeds to acquire complementary businesses, products, services or technologies. See the section titled “Use of Proceeds” for additional information. | |
| Proposed New York Stock Exchange trading symbol |
“ADIN” | |
The number of shares of our common stock that will be outstanding after this offering is based on 36,984,914 shares of our common stock outstanding as of April 30, 2018, and excludes:
| • | 8,921,141 shares of our common stock issuable upon the exercise of options to purchase shares of our common stock outstanding as of April 30, 2018, with a weighted-average exercise price of $5.72 per share; |
| • | 137,000 shares of our common stock issuable upon the exercise of options to purchase shares of our common stock granted after April 30, 2018, with an exercise price of $13.50 per share; |
| • | 427,131 shares of our common stock issuable upon the exercise of warrants outstanding as of April 30, 2018, with a weighted-average exercise price of $4.38 per share; |
| • | shares of our common stock reserved for future issuance under our 2018 Equity Incentive Plan, or 2018 Plan, which includes an annual evergreen increase and will become effective in connection with this offering; and |
| • | shares of our common stock reserved for future issuance under our 2018 Employee Stock Purchase Plan, or ESPP, which will become effective immediately prior to the public trading date of our common stock. |
Unless otherwise indicated, the information in this prospectus assumes:
| • | a 1-for-4 reverse stock split effected on May 25, 2018; |
| • | the filing of our amended and restated certificate of incorporation and the effectiveness of our amended and restated bylaws, each of which will occur immediately prior to the completion of this offering; |
10
Table of Contents
| • | the automatic conversion of all outstanding shares of our redeemable convertible preferred stock into 30,277,523 shares of our common stock immediately prior to the completion of this offering; |
| • | no exercise of the outstanding options or warrant described above; and |
| • | no exercise of the underwriters’ option to purchase up to an additional shares of common stock to cover over-allotments. |
11
Table of Contents
SUMMARY CONSOLIDATED FINANCIAL DATA
The summary consolidated statements of operations data for the years ended January 31, 2016, 2017 and 2018 are derived from our audited consolidated financial statements included elsewhere in this prospectus. The unaudited consolidated statements of operations data for the three months ended April 30, 2017 and 2018 and the unaudited consolidated balance sheet data as of April 30, 2018 are derived from our unaudited consolidated financial statements included elsewhere in this prospectus. We have prepared the unaudited financial information on a basis consistent with our audited consolidated financial statements and have included, in our opinion, all adjustments, consisting only of normal recurring adjustments, which we consider necessary for a fair presentation of the financial information set forth in those statements. You should read the consolidated financial data set forth below in conjunction with our consolidated financial statements and the accompanying notes and the information in “Management’s Discussion and Analysis of Financial Condition and Results of Operations” contained elsewhere in this prospectus. Our historical results are not necessarily indicative of the results to be expected for any other period in the future. The last day of our fiscal year is January 31.
| Year Ended January 31, | Three Months Ended April 30, |
|||||||||||||||||||
| 2016 | 2017 | 2018 | 2017 | 2018 | ||||||||||||||||
| (unaudited) | ||||||||||||||||||||
| (in thousands, except per share data) | ||||||||||||||||||||
| Consolidated Statements of Operations Data: |
||||||||||||||||||||
| Revenues: |
||||||||||||||||||||
| Subscription |
$ | 49,365 | $ | 69,696 | $ | 93,888 | $ | 21,220 | $ | 28,290 | ||||||||||
| Professional services and other |
12,341 | 12,095 | 12,620 | 2,995 | 3,761 | |||||||||||||||
|
|
|
|
|
|
|
|
|
|
|
|||||||||||
| Total revenues |
61,706 | 81,791 | 106,508 | 24,215 | 32,051 | |||||||||||||||
|
|
|
|
|
|
|
|
|
|
|
|||||||||||
| Cost of revenues: |
||||||||||||||||||||
| Subscription |
9,104 | 11,628 | 14,684 | 3,526 | 4,240 | |||||||||||||||
| Professional services and other |
13,623 | 13,236 | 13,209 | 3,173 | 3,943 | |||||||||||||||
|
|
|
|
|
|
|
|
|
|
|
|||||||||||
| Total cost of revenues |
22,727 | 24,864 | 27,893 | 6,699 | 8,183 | |||||||||||||||
|
|
|
|
|
|
|
|
|
|
|
|||||||||||
| Gross profit |
38,979 | 56,927 | 78,615 | 17,516 | 23,868 | |||||||||||||||
|
|
|
|
|
|
|
|
|
|
|
|||||||||||
| Operating expenses: |
||||||||||||||||||||
| Sales and marketing |
62,463 | 64,417 | 77,903 | 17,805 | 19,746 | |||||||||||||||
| Research and development |
22,024 | 23,514 | 24,342 | 5,768 | 6,876 | |||||||||||||||
| General and administrative |
12,718 | 13,669 | 16,993 | 3,753 | 6,124 | |||||||||||||||
|
|
|
|
|
|
|
|
|
|
|
|||||||||||
| Total operating expenses |
97,205 | 101,600 | 119,238 | 27,326 | 32,746 | |||||||||||||||
|
|
|
|
|
|
|
|
|
|
|
|||||||||||
| Loss from operations |
(58,226 | ) | (44,673 | ) | (40,623 | ) | (9,810 | ) | (8,878 | ) | ||||||||||
| Other expense (income), net |
596 | (100 | ) | 1,796 | 146 | 2,092 | ||||||||||||||
|
|
|
|
|
|
|
|
|
|
|
|||||||||||
| Loss before provision for income taxes |
(58,822 | ) | (44,573 | ) | (42,419 | ) | (9,956 | ) | (10,970 | ) | ||||||||||
| Provision for income taxes |
316 | 147 | 254 | 42 | 76 | |||||||||||||||
|
|
|
|
|
|
|
|
|
|
|
|||||||||||
| Net loss |
$ | (59,138 | ) | $ | (44,720 | ) | $ | (42,673 | ) | $ | (9,998 | ) | $ | (11,046 | ) | |||||
|
|
|
|
|
|
|
|
|
|
|
|||||||||||
| Net loss per share attributable to common stockholders, basic and diluted(1) |
$ | (15.00 | ) | $ | (9.04 | ) | $ | (7.65 | ) | $ | (1.88 | ) | $ | (1.74 | ) | |||||
|
|
|
|
|
|
|
|
|
|
|
|||||||||||
| Weighted average shares used in computing net loss per share attributable to common stockholders, basic and diluted(1) |
3,943 | 4,946 | 5,576 | 5,305 | 6,356 | |||||||||||||||
|
|
|
|
|
|
|
|
|
|
|
|||||||||||
| Pro forma net loss per share attributable to common stockholders, basic and diluted (unaudited)(1) |
$ | (1.19 | ) | $ | (0.30 | ) | ||||||||||||||
|
|
|
|
|
|||||||||||||||||
| Weighted average shares used in computing pro forma net loss per share, basic and diluted (unaudited)(1) |
35,854 | 36,634 | ||||||||||||||||||
|
|
|
|
|
|||||||||||||||||
| (1) | See Notes 15 and 16 to our consolidated financial statements included elsewhere in this prospectus for an explanation of the method used to calculate the historical net loss and the historical and pro forma net loss per share attributable to common stockholders, basic and diluted, and the number of shares used in the computation of these per share amounts. |
12
Table of Contents
| As of April 30, 2018 | ||||||||||||
| Actual | Pro Forma(1) | Pro Forma As Adjusted(1)(2) |
||||||||||
| (in thousands) | ||||||||||||
| Consolidated Balance Sheet Data: |
||||||||||||
| Cash and cash equivalents |
$ | 43,819 | $ | 43,819 | ||||||||
| Working capital (deficit) |
(30,548 | ) | (30,548 | ) | ||||||||
| Total assets |
82,169 | 82,169 | ||||||||||
| Deferred revenues, current and non-current |
96,519 | 96,519 | ||||||||||
| Long-term debt, current and non-current, net of debt issuance costs |
50,062 | 50,062 | ||||||||||
| Redeemable convertible preferred stock |
179,245 | — | ||||||||||
| Total stockholders’ equity (deficit) |
(269,662 | ) | (90,417 | ) | ||||||||
| (1) | Gives effect to the automatic conversion of all of our outstanding shares of redeemable convertible preferred stock as of April 30, 2018 into an aggregate of 30,277,523 shares of common stock. |
| (2) | Gives further effect to the repayment of our indebtedness of $ and issuance and sale of shares of common stock in this offering at the assumed initial public offering price of $ per share, the midpoint of the price range set forth on the cover page of this prospectus, after deducting estimated underwriting discounts and commissions and estimated offering expenses payable by us. Each $1.00 increase (decrease) in the assumed initial public offering price of $ per share would increase (decrease) the pro forma as adjusted amount of each of cash and cash equivalents, working capital (deficit), total assets and total stockholders’ deficit by approximately $ , assuming that the number of shares offered by us, as set forth on the cover page of this prospectus, remains the same and after deducting estimated underwriting discounts and commissions. Similarly, each increase (decrease) of 1.0 million shares in the number of shares offered by us at the assumed initial public offering price would increase (decrease) each of cash and cash equivalents, working capital (deficit), total assets and total stockholders’ deficit by approximately $ , assuming the estimated offering price of $ per share remains the same, and after deducting estimated underwriting discounts and commissions. The pro forma information discussed above is illustrative only and will be adjusted based on the actual initial public offering price and other terms of our initial public offering determined at pricing. |
13
Table of Contents
Investing in our common stock involves a high degree of risk. You should consider and read carefully all of the risks and uncertainties described below, as well as other information included in this prospectus, including our consolidated financial statements and related notes appearing at the end of this prospectus, before making an investment decision. The risks described below are not the only ones facing us. The occurrence of any of the following risks or additional risks and uncertainties not presently known to us or that we currently believe to be immaterial could materially and adversely affect our business, financial condition or results of operations. In such case, the trading price of our common stock could decline, and you may lose all or part of your investment.
Risks Related to Our Business and Industry
We have a history of operating losses and may not achieve profitability in the future.
We have historically incurred net losses, including $59.1 million, $44.7 million and $42.7 million for the years ended January 31, 2016, 2017 and 2018, respectively, and $10.0 million and $11.0 million for the three months ended April 30, 2017 and 2018, respectively. We had an accumulated deficit of $299.0 million at April 30, 2018. We will need to increase our revenues in future periods in order to become profitable, and, even if we do, we may not be able to maintain or further increase our level of profitability. We intend to continue to invest in sales and marketing, product and solution development and operations, including by hiring additional personnel, upgrading our infrastructure and expanding into new geographical markets. To the extent we are successful in increasing our customer base, we will also incur increased losses in the short term because costs associated with acquiring customers are generally incurred up front, while subscription revenues are generally recognized ratably over the terms of our customer agreements. Our efforts to grow our business may be more costly than we expect, and we may not be able to increase our revenues enough to offset our higher operating expenses. We may incur significant losses in the future for a number of reasons, including the other risks described in this section, and unforeseen expenses, difficulties, complications and delays, and other unknown events. If we are unable to achieve and sustain profitability, the value of our business and common stock may significantly decrease.
The market for cloud-based planning solutions is relatively new and evolving, and if the market does not develop further or develops more slowly than we expect, our business will be adversely affected.
The market for software-as-a-service, or SaaS, solutions is less mature than the market for on-premise software solutions, and the adoption rate of SaaS solutions may be slower at companies in industries with heightened data security requirements or businesses requiring highly customizable application software. Many organizations have invested substantial personnel and financial resources to integrate traditional on-premise solutions into their businesses, and therefore may be reluctant or unwilling to purchase SaaS solutions as a replacement or supplement to these legacy tools. In addition, some organizations have been reluctant to use SaaS solutions because they have concerns regarding the risks associated with the reliability or security of the delivery model associated with these solutions. Because SaaS solutions, such as ours, aggregate, store and use confidential information and related data, including highly confidential financial data, some customers may be reluctant or unwilling to migrate to cloud-based solutions. We expect that we will continue to need intensive sales efforts to educate prospective customers about the uses and benefits of our cloud-based solutions. If businesses do not recognize or understand the value and utility of our offerings, then a viable market for our solutions may not develop further, or it may develop more slowly than we expect, either of which would significantly and adversely affect our business and operating results.
It is difficult to predict customer adoption rates and future demand for our solutions, the future growth rate and size of the SaaS market generally or the entry of competitive solutions. The expansion of the SaaS market depends on a number of factors, including the cost, performance, and perceived value associated with SaaS offerings, as well as the ability of SaaS companies to address security and privacy concerns. If other SaaS
14
Table of Contents
providers experience security incidents, loss of customer data, disruptions in delivery or other problems, the market for SaaS offerings as a whole, including our offerings, may be negatively affected. If SaaS offerings do not achieve widespread adoption, or there is a reduction in demand for SaaS offerings caused by a lack of customer acceptance, technological challenges, weakening economic conditions, security or privacy concerns, competing technologies and products, decreases in corporate spending or otherwise, it could negatively affect our business and results of operations.
If we are unable to attract new customers or sell additional solutions to our existing customers, our revenue growth will be adversely affected.
Our ability to grow depends in large part upon increasing our customer base. Our ability to achieve significant growth in revenues in the future will depend upon the effectiveness of our sales and marketing efforts, both domestically and internationally. Our future growth also depends upon our ability to add users and retain and sell additional solutions to our existing customers, as well as our ability to diversify our user base beyond finance professionals. If we do not retain customers, our customers do not purchase additional subscriptions or we do not add additional users to our platform, our revenues may grow more slowly than expected or may not grow at all. Additionally, increasing incremental sales to our current customer base will require additional sales and marketing efforts, which may not be successful. Any failure to attract new customers or maintain and expand current customer relationships will have an adverse effect on our business and results of operations.
We cannot predict with certainty our subscription renewal rates and the impact these rates may have on our future revenues and operating results.
Our customers have no obligation to renew their subscriptions after the expiration of their initial subscription period. In addition, our customers may renew for fewer solutions, on different pricing terms, or for fewer users. We cannot predict with certainty our renewal rates given our diverse customer base. Our renewal rates may decline or fluctuate as a result of a number of factors, including customer spending levels, customer dissatisfaction with our solutions, decreases in their number of users, the type and size of our customers, pricing changes, the acquisition of our customers by other companies and general economic conditions. These fluctuations will affect our results of operations and will make forecasting our future results of operations more difficult.
We have historically focused on selling and marketing our cloud-based platform for financial planning to mid-market customers and have only recently made focused investments in selling and marketing to enterprise customers, which makes it difficult to evaluate our future prospects and increases the risk that we will not be successful.
We have historically focused on selling and marketing our solutions to mid-market customers and have only recently made focused investments in selling and marketing to enterprise customers, which we define as organizations with more than 2,000 employees. Therefore, we may not be effective in convincing prospective enterprise customers that our solutions will address their planning needs. Also, we may not be able to properly price our solutions in this market, which could negatively affect our ability to sell to enterprise customers. Furthermore, enterprise customers may demand more features and professional services, which may require us to devote greater research and development, sales, support, and professional services resources to these customers. This could strain our resources and result in increased costs. If we are not able to address these challenges, or if our investments in selling and marketing our solutions to enterprises are unsuccessful, our business and results of operations will suffer.
As we target enterprise customers, our sales cycle may lengthen substantially and our sales and marketing efforts will require considerably more time and expense.
As we target our sales and marketing efforts at enterprise customers, we face greater costs, longer sales cycles and less predictability in completing our sales. Larger organizations may require a greater number of
15
Table of Contents
product evaluations and multiple approvals within the organization, which may require us to invest more time engaging with and educating these potential customers. If an expected transaction is delayed until a subsequent period, or if we are unable to close one or more expected significant transactions with enterprise customers in a particular period, our results of operations for that period, and for any future periods in which revenues from such transaction would otherwise have been recognized, may be adversely affected.
We face significant competition from both established and new companies offering corporate performance management, or CPM, software solutions, which may have a negative effect on our ability to add new customers, retain existing customers and grow our business.
Our solutions compete with similar cloud-based and on-premise offerings by others including Anaplan, Inc., Host Analytics, Inc., International Business Machines Corporation, Oracle Hyperion, Oracle Planning and Budgeting Cloud Service, SAP SE, and Workday, Inc., as well as smaller providers in local markets such as Centage Corporation, Prophix Software Inc. and Vena Solutions. In addition, some potential customers may elect to utilize or develop their own internal applications, based on Microsoft Excel or similar point products, for their CPM needs. The CPM market is rapidly evolving and highly competitive, with relatively low barriers to entry, and in the future there will likely be an increasing number of similar solutions offered by additional competitors.
Many of our principal competitors have substantially longer operating histories, greater financial, technical, marketing or other resources, stronger brand and customer recognition, larger intellectual property portfolios and broader global distribution and presence than we have. Our competitors may be able to offer products or functionality similar to ours at a more attractive price than we can by integrating or bundling such products with their other product offerings. Acquisitions and consolidation in our industry may provide our competitors with even more resources or may increase the likelihood of our competitors offering bundled or integrated products with which we cannot effectively compete. New innovative start-ups and existing large companies that are making significant investments in research and development could also launch new products and services that are competitive with ours and that could gain market acceptance quickly. In addition, we face potential competition from participants in adjacent markets that may enter our markets by leveraging related technologies and partnering with or acquiring other companies, or providing alternative approaches to provide similar results. If we are unable to anticipate or react to these competitive challenges, our competitive position would weaken, which would adversely affect our business and results of operations.
We may not be able to sustain our revenue growth rates in the future.
From the fiscal year ended January 31, 2016, or fiscal 2016, through the fiscal year ended January 31, 2018, or fiscal 2018, our total revenues grew from $61.7 million to $106.5 million.
You should not consider our historical revenue growth rates as indicative of our future performance. Our revenue growth rates have declined in the past, and may decline in future periods, as the size of our customer base increases and as we achieve higher market penetration rates. Other factors may also contribute to declines or volatility in our growth rates, including slowing demand for our solutions, increasing competition, a decrease in the growth of our overall market, our failure to continue to capitalize on growth opportunities, and the maturation of our business. If our growth rates decline, investors’ perceptions of our business could be adversely affected.
We cannot predict with certainty the rate of renewal of customers who formerly purchased our solutions through NetSuite, and the dissolution of our partnership with NetSuite has resulted in non-recurring increases in revenue growth rates.
In February 2017, we terminated our reseller partnership with NetSuite after Oracle Corporation acquired NetSuite. Since then, all contract renewals for our software solutions with Oracle/NetSuite customers must be signed directly between us and those customers. By establishing a direct relationship with our Oracle/NetSuite customers, we expect to achieve higher renewal rates. However, because Oracle’s Planning and Budgeting Cloud
16
Table of Contents
Solution competes directly with our offerings and Oracle has longstanding relationships with these customers, we may not be able to achieve such results. In particular, we expect Oracle to pursue the installed base of our Oracle/NetSuite customers aggressively and as a result, we may see a decrease in renewal rates unless we are able to convince these customers of the value and effectiveness of our solutions relative to Oracle’s offerings. If we are unable to successfully market and sell our solutions to both the end customers that previously purchased our solutions through the NetSuite channel as well as new customers that otherwise would have been part of the NetSuite channel partnership, our revenues and business will be adversely affected.
Under our prior reseller agreement, NetSuite sold our software solution directly to Oracle/NetSuite customers. In exchange, we generally received 50% of the contract value for subscriptions sold through NetSuite for new and renewing customers, which we recognized as revenues. For all renewals closed on or after March 1, 2017, we negotiate directly with the customer and recognize 100% of the contract value as revenues. As a result, there was a non-recurring increase in revenues associated with initial NetSuite renewals, resulting in a higher revenue growth rate, which we expect to normalize in future periods. In addition, our dollar-based net retention rate for the period after the termination of the reseller agreement has been adjusted downward to exclude the increased revenues from the initial NetSuite renewals, which we expect to normalize in future periods. See “Management’s Discussion and Analysis—Termination of NetSuite Reseller Agreement” and “Management’s Discussion and Analysis—Key Metrics—Dollar-Based Net Retention Rate” for additional information regarding the impacts of these changes in our relationship with NetSuite.
If we experience significant fluctuations in our rate of growth and fail to balance our expenses with our revenue forecasts, our results could be harmed.
Our ability to forecast our future rate of growth is subject to a number of uncertainties, including general economic and market conditions. We plan our expense levels and investment on estimates of future revenues and future anticipated rates of growth. We may not be able to adjust our spending quickly enough if our growth rates fall short of our expectations.
Moreover, we have encountered and will encounter risks and uncertainties frequently experienced by growing companies in rapidly changing industries, such as the risks and uncertainties described in this section. If our assumptions regarding these risks and uncertainties are incorrect or change due to changes in our markets, or if we do not address these risks successfully, our operating and financial results could differ materially from our expectations and our business and results of operations could suffer.
If we have a security incident or breach involving unauthorized access to customer data, our platform may be perceived as lacking sufficient security, customers may reduce their use of, or stop using, our platform and we may incur significant liabilities.
Our platform involves the storage and transmission of our customers’ confidential and proprietary information, which may include their employees’ personal data as well as information regarding customers, suppliers, and financial and payroll data. As a result, unauthorized access or use of customer data could expose us to regulatory actions, litigation, investigations, remediation costs, damage to our reputation and brand, disclosure obligations, loss of customer and partner confidence in the security of our solutions and resulting fees, costs, expenses, loss of revenues, and other potential liabilities. While we have security measures in place designed to protect the integrity of customer information and prevent data loss, misappropriation, and other security breaches, if these measures are inadequate or are compromised as a result of third-party action, including intentional misconduct by computer hackers, theft, employee error, malfeasance or otherwise, our reputation could be damaged, our business may suffer, and we could incur significant liabilities. Cybersecurity challenges, including threats to our own IT infrastructure or those of our customers or third-party providers, are often targeted at companies such as ours, and may take a variety of forms ranging from malware, phishing, ransomware, man-in-the-middle attacks, session hijacking, denial-of-service, password attacks, viruses, worms and other malicious software programs or cybersecurity attacks to “mega breaches” targeted against cloud
17
Table of Contents
services and other hosted software, which could be initiated by individual or groups of hackers or sophisticated cyber criminals. A cybersecurity incident or breach could result in disclosure of confidential information and intellectual property, or cause production downtimes and compromised data. Because cybersecurity attacks change frequently, we may be unable to anticipate these techniques or implement adequate preventative measures. Any or all of these issues could negatively affect our ability to attract new customers, cause existing customers to elect to terminate or not renew their subscriptions, result in reputational damage, cause us to pay remediation costs or issue service credits or refunds to customers for prepaid and unused subscription services, or result in lawsuits, regulatory fines or other action or liabilities, which could adversely affect our business and results of operations.
Many states in the United States as well as foreign governments have enacted laws requiring companies to provide notice of data security breaches involving certain types of personal data, and significant fines on companies involved in such incidents may be imposed. In addition, some of our customers contractually require notification of data security breaches. Security compromises experienced by us or by our competitors may lead to public disclosures, which may lead to widespread negative publicity. Any security compromise in our industry, whether actual or perceived, could harm our reputation, erode customer confidence in the effectiveness of our security measures, negatively impact our ability to attract new customers, cause existing customers to elect not to renew their subscriptions, or subject us to third-party lawsuits, regulatory fines or other action or liability, which could materially and adversely affect our business and operating results.
There can be no assurance that any limitations of liability provisions in our contracts would be enforceable or adequate or would otherwise protect us from any such liabilities or damages with respect to any particular claim. We also cannot be sure our existing general liability insurance coverage and coverage for errors or omissions will continue to be available on acceptable terms or will be available in sufficient amounts to cover one or more large claims, or that the insurer will not deny coverage as to any future claim. The successful assertion of one or more large claims against us that exceeds available insurance coverage, or the occurrence of changes in our insurance policies, including premium increases or the imposition of large deductible or co-insurance requirements, could have a material adverse effect on our business and results of operations.
Privacy concerns and domestic or foreign privacy laws or regulations may result in significant costs and compliance challenges, reduce demand for our solutions, and adversely affect our business.
Our customers can use our platform to collect, use and store certain personal data regarding their employees, customers and suppliers. National and local governments, agencies, and authorities in the countries in which we and our customers operate have adopted or may adopt laws and regulations regarding the collection, use, storage, processing and disclosure of personal data obtained from consumers and individuals, which could impact our ability to offer our solutions in certain jurisdictions or our customers’ ability to deploy our solutions globally. Privacy-related laws are particularly stringent in Europe. If we or our subprocessors fail to adequately comply with privacy-related laws, regulations and standards, it may limit the use and adoption of our solutions, reduce overall demand for our solutions, lead to significant fines, penalties or liabilities for noncompliance, or slow the pace at which we close sales transactions, any of which could harm our business. Moreover, if we or our subprocessors fail to adhere to adequate data protection practices around the usage of our customers’ personal data, it may damage our reputation and brand.
The European Union, or the EU, and the United States agreed to a framework for data transferred from the EU to the United States called the Privacy Shield in 2016, but this framework has been challenged by private parties and may face additional challenges by national regulators or additional private parties. In addition, the other bases on which we and our customers rely for the transfer of data, such as model contractual clauses, continue to be subjected to regulatory and judicial scrutiny. If we or our customers are unable to transfer data between and among countries and regions in which we operate, it could decrease demand for our solutions, require us to restrict our business operations, and impair our ability to maintain and grow our customer base and increase our revenues.
18
Table of Contents
Additionally, in 2016 the EU adopted a new regulation governing data privacy called the General Data Protection Regulation, or the GDPR, which became effective on May 25, 2018. The GDPR establishes new requirements applicable to the handling of personal data and imposes penalties for non-compliance of up to four percent of worldwide annual turnover or 20 million euro, whichever is higher. Customers, particularly in the EU, are seeking assurances from their suppliers, including us, that their processing of personal data of EU nationals is in accordance with the GDPR, and if we are unable to provide adequate assurances to such customers, demand for our solutions could be adversely affected. In addition, we must continue to seek assurances from our subprocessors that they are handling personal data in accordance with GDPR requirements in order to meet our own obligations under the GDPR.
Compliance with privacy laws and regulations, particularly the GDPR, that are applicable to our business and the businesses of our customers is costly and time-consuming. Such laws and regulations may adversely affect our customers’ ability and willingness to process, handle, store, use and transmit personal data of their employees, customers and suppliers, which in turn could limit the use, effectiveness and adoption of our solutions and reduce overall demand. Even the perception of privacy concerns, whether or not valid, may inhibit the adoption, effectiveness or use of our solutions. Future laws, regulations, standards and other obligations, and changes in the interpretation of existing laws, including challenges to onward transfer mechanisms such as Privacy Shield and model contractual clauses, regulations, standards and other obligations could result in increased regulation, increased costs of compliance and penalties for non-compliance, as well as limitations on data collection, use, disclosure and transfer for us and our customers.
If we are unable to maintain successful relationships with channel partners, our business, operating results, and financial condition could be adversely affected.
We have historically relied on channel partners, such as referral partners, resellers, and integration partners, to attract new customers and sell additional services to our existing customers. Our agreements with our channel partners are generally non-exclusive and some of our channel partners have entered, and may continue to enter, into strategic relationships with our competitors. Further, many of our channel partners have multiple strategic relationships, and they may not regard us as significant for their businesses. Our channel partners may terminate their respective relationships with us with limited or no notice and with limited or no penalty, pursue other partnerships or relationships, or attempt to develop or acquire products or services that compete with our platform. We may also terminate our relationships with channel partners who choose to work with our competitors or for other reasons. Moreover, we may have difficulty attracting effective channel partners to sell our platform to larger organizations, particularly given our lower average sales price as compared to those of our competitors and our less costly implementations. If we are not able to maintain and grow our channel partner relationships, our growth could be adversely affected.
Our partners also may impair our ability to enter into other desirable strategic relationships. If our channel partners do not effectively market and sell our solutions, if they choose to place greater emphasis on products of their own or those offered by our competitors, or if they fail to meet the needs of our customers, our ability to grow our business and sell our platform may be adversely affected. Similarly, the loss of a substantial number of our channel partners, and our possible inability to replace them, the failure to recruit additional channel partners, any reduction or delay in their sales of our platform, or any conflicts between channel sales and our direct sales and marketing activities could materially and adversely affect our business and results of operations.
Failure to effectively develop and expand our sales and marketing capabilities could harm our ability to increase our customer base and achieve broader market acceptance of our solutions.
Our ability to increase our customer base and achieve broader market acceptance of our platform will depend to a significant extent on our ability to expand our sales and marketing operations. The cost to acquire customers is high due to our sales and marketing efforts, and we may not be able to realize the expected benefits of this investment through increased revenues.
19
Table of Contents
We plan to continue expanding our sales force, both domestically and internationally, which will require the investment of significant financial resources. Identifying and recruiting qualified personnel and training them in the use of our solutions is time-consuming and resource-intensive, and our sales representatives may not be fully trained and productive for a significant amount of time. We may not achieve anticipated revenue growth from expanding our sales force if we are unable to hire, develop and retain talented sales personnel, if our new sales personnel are unable to achieve desired productivity levels in a reasonable period of time.
We also plan to dedicate significant resources to our marketing programs, including online advertising and e-mail marketing. The effectiveness of our online advertising has varied over time and may vary in the future due to competition for key search terms, changes in search engine use and changes in the search algorithms used by major search engines. In addition, our e-mail marketing efforts may be limited by privacy regulations and requirements that current and potential customers affirmatively consent to e-mail marketing programs. If our marketing programs are not effective, our business and results of operations will be adversely affected.
We currently derive substantially all of our subscription revenues from Adaptive Insights for Finance, and our future growth is dependent on its success.
We currently derive and expect to continue to derive substantially all of our revenues from Adaptive Insights for Finance. As such, the continued growth in market demand for this solution is critical to our continued success. While we have recently introduced a new software solution for sales planning, Adaptive Insights for Sales, we cannot be certain that it will generate significant revenues in the near term or at all. Accordingly, our business and financial results are and will be substantially dependent on Adaptive Insights for Finance for the foreseeable future.
If we are not able to provide successful enhancements, new features and modifications, or if we cannot successfully integrate our solutions into other platforms and technologies, our business and results of operations could be adversely affected.
If we are unable to provide enhancements and new features that achieve market acceptance or that keep pace with rapid technological developments, our business and results of operations could be adversely affected. When we develop new or enhanced solutions, we typically incur expenses and expend resources up front to develop, market, promote and sell the new offering. Therefore, when we develop and introduce new or enhanced solutions, they must achieve sufficient levels of market acceptance in order to justify the amount of our investment in developing and bringing them to market. For example, we have devoted substantial resources to enhancing the features and functionality of our solutions to enhance their utility to larger customers with complex, dynamic and global operations, and to enhance their utility to functions beyond finance, such as sales and marketing. The success of enhancements, new features and solutions depends on several factors, including the timely completion, introduction and market acceptance of the enhancements or new features or solutions. Failure in this regard may significantly impair our revenue growth. In addition, because our solutions are designed to integrate with a variety of systems, we will need to regularly modify and enhance our solutions to keep pace with technological changes. We may not be successful in either developing these modifications and enhancements or in bringing them to market in a timely fashion. We must also appropriately balance the demands of our current customers with the capabilities required to address the broader market. Our new solutions or enhancements and changes to our existing solutions could fail to attain sufficient market acceptance for many reasons, including:
| • | failure to predict market demand accurately in terms of functionality and to supply solutions that meets this demand in a timely fashion; |
| • | defects, errors or failures in any new features or solutions; |
| • | negative publicity about the performance or effectiveness of new features or solutions; |
| • | delays in releasing our new features or solutions to the market; and |
| • | introduction or anticipated introduction of competing products and features by our competitors. |
20
Table of Contents
In addition, our platform is designed to integrate with existing enterprise resource planning, or ERP, systems such as Microsoft, NetSuite, Oracle, SAP, and Workday, and will require modifications and enhancements as these systems change over time. Any failure of our solutions to operate effectively with future platforms and technologies could reduce the demand for our solutions or result in customer dissatisfaction. Furthermore, uncertainties about the timing and nature of new network platforms or technologies, or modifications to existing platforms or technologies, could increase our product development expenses. Any failure of our solutions to operate effectively with future network platforms and technologies could reduce the demand for our solutions, result in customer dissatisfaction and adversely affect our business and results of operations.
Our research and development efforts are costly and subject to international risks, and may not contribute significantly to revenues for several years, if at all.
In order to remain competitive, we must continue to invest in research and development. We have made and expect to continue to make significant investments in development and related opportunities, and these investments could adversely affect our operating results if not offset by increases in revenues. However, we may not receive significant revenues from these investments for several years, if at all.
Further, our competitors may expend a greater amount of funds on their research and development programs, and those that do not may be acquired by larger companies that would allocate greater resources to our competitors’ research and development programs. Our failure to maintain adequate research and development resources or to compete effectively with the research and development programs of our competitors could materially and adversely affect our business and results of operations.
We use third-party contractors in India to supplement our research and development capabilities. Managing operations that are remote from our U.S. headquarters is difficult and we may not be able to manage these third-party contractors successfully. If we fail to maintain productive relationships with these contractors generally, we may be required to develop our platform in a less efficient and cost-effective manner. In addition, our release schedule for new features, enhancements and solutions may be delayed while we hire software developers or find alternative contract development resources. Additionally, while we take precautions to ensure that software components developed by our third-party contractors are reviewed and that our source code is protected, misconduct by our third-party contractors could result in infringement or misappropriation of our intellectual property. Furthermore, any acts of espionage, malware attacks, theft of confidential information or other malicious cyber incidents attributed to our third-party contractors may compromise our system infrastructure, expose us to litigation and lead to reputational harm that could adversely affect our business and results of operations.
Any failure to offer high-quality customer and technical support may adversely affect our relationships with our customers.
Our customers’ rapid and successful implementation and adoption of our solutions are essential to our success. We provide implementation, customer success, technical support, and training services to our customers to ensure that they maximize the benefits they realize from our solutions and encourage them to increase and extend their use of our platform throughout their organizations. We may be unable to modify the nature, scope and delivery of our services to compete with changes in product support services provided by our competitors. Increased customer demand for support, without corresponding revenues, could increase costs and adversely affect our results of operations. Moreover, as we target larger organizations, those organizations may demand more services, which would increase our up front investment in sales and professional services resources to individual customers. We may also be unable to respond quickly enough to accommodate short-term increases in customer demand for support. Our sales strategy is highly dependent on our ability to make our existing users successful with their use of our platform, such that they recommend our platform to both users within their department and across their organization, as well as new customers. Any failure to maintain high-quality customer support, or a market perception that we do not maintain high-quality support, could adversely affect our reputation, and our ability to sell our platform to existing and new customers.
21
Table of Contents
If we fail to manage our technical operations infrastructure, our existing customers may experience service outages and our new customers may experience delays in the deployment of our solutions.
We have experienced significant growth in the number of users, transactions and data that our operations infrastructure supports. We seek to maintain sufficient excess capacity in our operations infrastructure to meet the needs of all of our customers. We also seek to maintain excess capacity to facilitate the rapid provision of new customer deployments and the expansion of existing customer deployments. In addition, we need to properly manage our technological operations infrastructure in order to support version control, changes in hardware and software parameters and the evolution of our platform. For example, today we run approximately 5% of our customer-related infrastructure on Amazon Web Services, or AWS. We plan to transition the majority of our customer-related infrastructure to AWS in the next 12 months. The provision of new hosting infrastructure requires significant lead time, and we could experience down time while a transition to new hosting infrastructure takes place. As we transition to AWS, we may experience interruptions, delays and outages in service and availability, and we expect our subscription gross margin to decline modestly in the near term reflecting the costs of this transition.
We have experienced, and may in the future experience, website disruptions, outages and other performance problems. These problems may be caused by a variety of factors, including infrastructure changes, vendor issues, human or software errors, viruses, security attacks, fraud, general Internet availability issues, spikes in customer usage and denial of service issues. In some instances, we may not be able to identify the cause or causes of these performance problems within an acceptable period of time. If we do not accurately predict our infrastructure requirements, our existing customers may experience service outages that may subject us to financial penalties, financial liabilities and customer losses. If our operations infrastructure fails to keep pace with increased sales, customers may experience delays as we seek to obtain additional capacity, which could adversely affect our reputation, business and results of operations.
If our solutions fail to perform properly due to defects or similar problems, and if we fail to develop enhancements to resolve any defect or other problems, we could lose customers, become subject to service performance or warranty claims or incur significant costs.
Our operations are dependent upon our ability to prevent system interruption. The applications underlying our cloud-based solutions are inherently complex and may contain material defects or errors, which may cause disruptions in availability or other performance problems as well as calculation errors. We have from time to time found defects in our solutions and may discover additional defects in the future. We may not be able to detect and correct defects or errors before deploying new solutions, enhancements or features. Consequently, we or our customers may discover defects or errors after our solutions, enhancements or features have been implemented. We implement bug fixes and upgrades as part of our regularly scheduled system maintenance. If we do not complete this maintenance according to schedule or if customers are otherwise dissatisfied with the frequency or duration of our maintenance services and related system outages, customers could elect not to renew their subscriptions, delay or withhold payment to us, or cause us to issue credits, make refunds or pay penalties.
The occurrence of any defects, errors, disruptions in service or other performance problems with our software, whether in connection with the day-to-day operation, upgrades or otherwise, could result in:
| • | loss of customers; |
| • | lost or delayed market acceptance and sales of our solutions; |
| • | delays in payment to us by customers; |
| • | injury to our reputation and brand; |
| • | legal claims, including warranty and service claims, against us; |
22
Table of Contents
| • | diversion of our resources, including through increased service and warranty expenses or financial concessions; and |
| • | increased insurance costs. |
Because of the large amount of data that we collect and analyze, we have in the past experienced errors in our systems that have resulted in data loss or corruption. These errors could also cause the information that we collect to be incomplete or contain inaccuracies that our customers regard as significant. Furthermore, the availability or performance of our solutions could be adversely affected by a number of factors, including our customers’ inability to access the Internet, the failure of our network or software systems, security breaches or variability in user traffic for our services. For example, our customers access our solutions through their Internet service providers. If a service provider fails to provide sufficient capacity to support our solutions or otherwise experiences service outages or slowdowns, such failure could interrupt our customers’ access to our solutions, which could adversely affect their perception of our solutions’ reliability. We may be required to issue credits or refunds for prepaid amounts related to unused services or otherwise be liable to our customers for damages that they may incur resulting from certain of these events. In addition to potential liability, if we experience interruptions in the availability of our solutions, our reputation could be adversely affected and we could lose customers.
The costs incurred in correcting any material defects or errors in our software or other performance problems may be substantial and may not be adequately covered by our errors and omissions insurance, and could materially and adversely affect our business and results of operations.
We typically provide service level commitments under our customer contracts. Interruptions or delays in performance of our service could result in customer dissatisfaction, damage to our reputation, loss of customers, limited growth and reduction in revenues.
Our customer agreements typically provide service level commitments on a monthly basis. If we are unable to meet the stated service level commitments or suffer extended periods of unavailability for our platform, we will be contractually obligated to provide these customers with service credits, refunds for prepaid amounts related to unused subscription services. Moreover, if we fail to meet these service level commitments, our existing customers could choose not to renew their subscriptions. Our revenues could be significantly affected if we suffer unscheduled downtime that exceeds the allowed downtimes under our customer subscriptions. Any extended service outages could adversely affect our reputation, business and results of operations.
We currently serve our customers from third-party data center hosting facilities located in the United States, Canada, Europe and Australia. Our operations depend, in part, on our third-party facility or hosting providers’ ability to protect these facilities against damage or interruption from natural disasters, power or telecommunications failures, criminal acts and similar events. In the event that our data center arrangements are terminated, or if there are any lapses of service or damage to a center, we could experience lengthy interruptions in our service as well as delays and additional expenses in arranging new facilities and services. Even with current and planned disaster recovery arrangements, including the existence of secondary data centers that become active during certain lapses of service or damage at a primary data center, our business could be harmed.
We designed our system infrastructure and own or lease the computer hardware used for our services in the third-party data center hosting facilities. Design and mechanical errors, power outages, spikes in usage volume and failure to follow system protocols and procedures could cause our systems to fail, resulting in interruptions in our cloud-based solutions. Any interruptions or delays in our service, whether as a result of third-party error, our own error, natural disasters or security breaches, whether accidental or willful, could harm our relationships with customers and cause our revenues to decrease and/or our expenses to increase. Also, in the event of damage or interruption, our insurance policies may not adequately compensate us for any losses that we may incur. These factors in turn could further reduce our revenues, subject us to liability and cause us to issue service credits or
23
Table of Contents
cause customers to decide not to renew their subscriptions, any of which could materially and adversely affect our business and results of operations. In addition, we also rely on AWS for customer-related infrastructure. Any disruption of or interference with our use of AWS could cause interruptions as well as delays and outages in service and availability, any of which could also materially and adversely affect our business and results of operations.
Problems faced by our data center operations, with the telecommunications network providers with whom we or our third party providers contract, or with the systems by which our telecommunications providers allocate capacity among their customers, including us, could adversely affect the experience of our customers. Our third-party data center operators could decide to close their facilities without adequate notice. In addition, any financial difficulties, such as bankruptcy, faced by our third-party data center operators or any of the service providers with whom we or they contract may have negative effects on our business, the nature and extent of which are difficult to predict. Additionally, if our data centers or AWS are unable to keep up with our growing needs for capacity, this could have an adverse effect on our business. Any changes in service levels at our data centers or at AWS or any errors, defects, disruptions, or other performance problems with our solutions could adversely affect our reputation and may damage our customers’ stored files or result in lengthy interruptions in our services. Interruptions in our services might reduce our revenues, cause us to issue refunds to customers for prepaid and unused subscription services, subject us to other potential liabilities, or adversely affect our renewal rates.
Incorrect or improper implementation or use of our solutions could result in customer dissatisfaction and negatively affect our business, results of operations, financial condition, and growth prospects.
Our platform is deployed in a wide variety of technology environments and into a broad range of complex workflows. Our platform has been integrated into large-scale, enterprise-wide technology environments, and specialized use cases, and our success depends on our ability to implement our platform successfully in diverse environments. We often assist our customers in implementing our platform, but many customers attempt to implement deployments themselves or use a third-party service firm. If we or our customers are unable to implement our platform successfully, or are unable to do so in a timely manner, customer perceptions of our platform and company may be impaired, our reputation and brand may suffer, and customers may choose not to renew or expand the use of our platform.
Our customers and third-party resellers may need training in the proper use of our platform to maximize its potential. If our platform is not implemented or used correctly or as intended, including if customers input incorrect or incomplete financial data into our platform, inadequate performance may result. Because our customers rely on our platform to manage their financial models, reporting and other financial tasks, the incorrect or improper implementation or use of our platform, our failure to train customers on how to efficiently and effectively use our platform, or our failure to provide adequate support services to our customers, may result in negative publicity or legal claims against us. Also, as we continue to expand our customer base, any failure by us to properly provide these services will likely result in lost opportunities for additional subscriptions to our platform.
Our quarterly results may fluctuate, and if we fail to meet the expectations of analysts or investors, our stock price could decline substantially.
Our quarterly financial results may fluctuate as a result of a variety of factors, many of which are outside of our control. Some of the important factors that may cause our revenues, operating results and cash flows to fluctuate from quarter to quarter include:
| • | fluctuations in demand for or pricing of our solutions; |
| • | timing of new subscriptions and payments; |
| • | issues relating to partnerships with third parties, product and geographic mix; |
24
Table of Contents
| • | timing of new solutions, features and enhancements; |
| • | potential acceleration of deferred costs; |
| • | addition of new customers and increased use of our platform by our existing customers; |
| • | customer renewal rates and pricing; |
| • | customer delays in purchasing decisions in anticipation of new solutions, features or enhancements by us or our competitors; |
| • | budgeting cycles of our customers; |
| • | accounts receivable payment cycles and collections issues; |
| • | changes in the competitive dynamics of our market, including consolidation among competitors or customers; |
| • | the amount and timing of payment for operating expenses, particularly research and development and sales and marketing expenses (including commissions and bonuses associated with performance); |
| • | the amount and timing of non-cash expenses, including stock based compensation, goodwill impairments and other non-cash charges; |
| • | the amount and timing of costs associated with recruiting, training and integrating new employees; |
| • | awareness of our brand on a global basis; and |
| • | general economic conditions and trends. |
Because we recognize revenues from subscriptions over the term of the relevant contract, downturns or upturns in sales are not immediately reflected in full in our operating results.
We recognize subscription revenues ratably over the term of each of our subscriptions. As a result, a significant portion of our revenues in any particular period is the result of the amortization of deferred revenues from contracts entered into during previous periods. Consequently, a shortfall in demand for our solutions and professional services or a decline in new or renewed subscriptions in any one quarter may not significantly reduce our subscription revenues for that quarter but could negatively affect our subscription revenues in future quarters. Our revenue recognition model also makes it difficult for us to rapidly increase our revenues through additional sales in any period, as subscription revenues from new customers is recognized over the applicable term of their contracts. We may be unable to adjust our cost structure to reflect the changes in subscription revenues. In addition, a significant majority of our costs are expensed as incurred. As a result, increased growth in the number of our customers could result in our recognition of more costs than revenues in the earlier periods of the terms of our subscriptions.
We rely on our executive officers and other key employees. The loss of one or more key employees, or of a significant number of our team members, could harm our business.
Our success and future growth depend upon the continued services of our management team and other key employees. From time to time, there may be changes in our management team resulting from the hiring or departure of executives, which could disrupt our business. We also are dependent on the continued service of our existing software engineers because of the complexity of our platform. We may terminate any employee’s employment at any time, with or without cause, and any employee may resign at any time, with or without cause. The loss of one or more of our key employees could harm our business and results of operations.
The failure to attract and retain additional qualified personnel could prevent us from executing our business strategy.
To execute our business strategy, we must attract and retain highly qualified personnel. Competition for executive officers, software developers, sales personnel and other key employees in our industry is intense. In
25
Table of Contents
particular, we compete with many other companies for software developers with high levels of experience in designing, developing and managing cloud-based software, as well as for skilled sales and operations professionals. At times, we have experienced, and we may experience in the future, difficulty in hiring and retaining employees with appropriate qualifications, and may not be able to fill positions. If we fail to attract new personnel or fail to retain and motivate our current personnel, our business and future growth prospects could be harmed.
Many of the companies with which we compete for experienced personnel have greater resources than we have, and some of these companies may offer greater compensation packages. Particularly in the San Francisco Bay Area, job candidates and existing employees carefully consider the value of the equity awards they receive in connection with their employment. If the perceived value of our equity awards declines, or if the mix of equity and cash compensation that we offer is unattractive, it may adversely affect our ability to recruit and retain highly skilled employees. Job candidates may also be threatened with legal action under agreements with their existing employers if we attempt to hire them, which could impact hiring and result in a diversion of our time and resources. Additionally, laws and regulations, such as restrictive immigration laws, may limit our ability to recruit internationally. We must also continue to retain and motivate existing employees through our compensation practices, company culture and career development opportunities. If we fail to attract new personnel or to retain our current personnel, our business and future growth prospects could be adversely affected.
If we cannot maintain our corporate culture, we could lose the customer service, innovation, collaboration, transparency and passion that we believe contribute to our success, and our business may be harmed.
We believe that a critical component of our success has been our corporate culture, which emphasizes customer service, innovation, collaboration, transparency and passion. We have invested substantial time and resources in building our team with an emphasis on these shared values. As we continue to grow, both organically and through acquisitions of employee teams, and develop the infrastructure associated with being a more mature public company, we will need to maintain our corporate culture among a larger number of employees dispersed in various geographic regions. Any failure to preserve our culture could negatively affect our future success, including our ability to retain and recruit personnel and to effectively focus on and pursue our corporate objectives.
If we fail to enhance our brand and our thought leadership position in CPM software solutions, our ability to expand our customer base will be impaired and our financial condition may suffer.
We believe that developing the Adaptive Insights brand and maintaining our thought leadership position in CPM software solutions are important foundations to driving widespread acceptance of our existing and future solutions, which we believe will help us engage new customers and retain existing customers. We also believe that the importance of brand recognition and thought leadership will increase as competition in our market increases. We devote significant resources to developing and maintaining our brand and thought leadership position, with a focus on identifying and interpreting emerging trends in the market, shaping and guiding industry dialogue, and expanding the adoption of CPM software solutions. Brand promotion and other activities related to developing and maintaining our thought leadership may not yield increased revenues, and even if they do, any increased revenues may not offset the expenses we incur in such effort. If we fail to successfully promote and maintain our brand and our thought leadership, we may fail to attract enough new customers or retain our existing customers to the extent necessary to realize a sufficient return on our efforts, and our business and results of operations could suffer.
26
Table of Contents
The estimates of market opportunity and forecasts of market growth included in this prospectus may prove to be inaccurate, and even if the market in which we compete achieves the forecasted growth, our business could fail to grow at similar rates, if at all.
Market opportunity estimates and growth forecasts included in this prospectus, including those we have generated ourselves, are subject to significant uncertainty and are based on assumptions and estimates that may not prove to be accurate. Not every company covered by our market opportunity estimates will necessarily buy planning solutions at all, and some or many of those companies may choose to continue using legacy tools, spreadsheets, manual processes, or planning tools offered by our competitors. It is impossible to build every product feature that every customer wants, and our competitors may develop and offer features that our solutions do not offer. The variables that go into the calculation of our market opportunity are subject to change over time, and there is no guarantee that any particular number or percentage of the companies covered by our market opportunity estimates will purchase our solutions at all or generate any particular level of revenues for us. Even if the market in which we compete meets the size estimates and growth forecasted in this prospectus, our business could fail to grow for a variety of reasons outside of our control, including competition in our industry. Furthermore, we have historically focused our selling and marketing efforts on mid-market customers in the United States, Canada, the United Kingdom, the Nordics, Australia, New Zealand and Japan. In order for us to successfully address this broader market opportunity, we will need to successfully market and sell our planning solutions to more enterprise customers, where we have only recently made significant investments, and also further expand our international presence. If any of these risks materialize, it could adversely affect our results of operations. For more information regarding the estimates of market opportunity and the forecasts of market growth included in this prospectus, see the section titled “Market and Industry Data.”
We may not be able to scale our business quickly enough to meet our customers’ needs and if we are not able to grow efficiently, our business and results of operations could be harmed.
As usage of our solutions grows, we will need to devote additional resources to improve our architecture, potentially integrating our platform with additional third-party systems, and maintain infrastructure performance. In addition, we will need to appropriately scale our internal business systems and our services organization, including our customer support and professional services, to serve our growing customer base.
Any failure of or delay in these efforts could cause impaired system performance and reduced customer satisfaction. These issues could reduce the attractiveness of our solutions to customers, resulting in decreased sales to new customers, lower renewal rates by existing customers, the issuance of service credits, or requested refunds, which could hurt our revenue growth and our reputation. Even if we are able to upgrade our systems and expand our internal resources, any such expansion will be expensive and complex, requiring significant management time and attention. We could also face inefficiencies or operational failures as a result of our efforts to scale our infrastructure. Moreover, there are inherent risks associated with upgrading, improving and expanding our systems infrastructure. We cannot be sure that the expansion and improvements to our systems infrastructure will be effectively implemented on a timely basis, if at all. These efforts may reduce our revenues and margins and adversely affect our financial results.
We rely on third-party hardware, software and infrastructure that may be difficult to replace or which could cause errors or failures of our service.
We rely on hardware and infrastructure purchased or leased and software licensed from third parties to operate critical business functions. Our business would be disrupted if any of this third-party hardware, software and infrastructure becomes unavailable on commercially reasonable terms, or at all. Any loss of the right to use any of this hardware, software or infrastructure could result in delays in our ability to offer our platform until equivalent technology is either developed by us, or, if available, is identified, obtained and integrated from third parties. Furthermore, any errors or defects in third-party hardware, software or infrastructure could result in errors or a failure of our platform, which could harm our business and results of operations.
27
Table of Contents
Our current operations are international in scope and we are planning further geographic expansion, creating a variety of potential operational challenges.
We currently have office locations in the United States, the United Kingdom, and Australia. If we expand in the future, our offices, personnel and operations may be further dispersed around the world. In connection with such expansion, we may face a number of challenges, including costs associated with developing software and providing support in additional languages, varying seasonality patterns, potential adverse movement of currency exchange rates, longer payment cycles and difficulties in collecting accounts receivable in some countries, tariffs and trade barriers, a variety of regulatory or contractual limitations on our ability to operate, adverse tax events, reduced protection of intellectual property rights in some countries and a geographically and culturally diverse workforce and customer base. Failure to overcome any of these difficulties could negatively affect our business and results of operations.
Sales to customers outside the United States or with international operations expose us to risks inherent in international sales.
A key element of our growth strategy is to expand our international operations and develop a worldwide customer base. Operating in international markets requires significant resources and management attention and will subject us to regulatory, economic and political risks that are different from those in the United States. Because of our limited experience with international operations, our international expansion efforts may not be successful in creating demand for our solutions outside of the United States or in effectively selling subscriptions to our solutions in all of the international markets we enter. In addition, we will face risks in doing business internationally that could adversely affect our business, including:
| • | the need to localize and adapt our solutions for specific countries, including translation into foreign languages and associated expenses; |
| • | data privacy laws that require that customer data be stored and processed in a designated territory; |
| • | difficulties in staffing and managing foreign operations; |
| • | regulatory and other delays and difficulties in setting up foreign operations; |
| • | different pricing environments, longer sales cycles and longer accounts receivable payment cycles and collections issues; |
| • | new and different sources of competition; |
| • | increased reliance on channel partners; |
| • | difficulties in communicating with vendors and partners; |
| • | weaker protection for intellectual property and other legal rights than in the United States and practical difficulties in enforcing intellectual property and other rights outside of the United States; |
| • | laws and business practices favoring local competitors; |
| • | compliance challenges related to the complexity of multiple, conflicting and changing governmental laws and regulations, including employment, tax, privacy and data protection laws and regulations; |
| • | increased financial accounting and reporting burdens and complexities; |
| • | restrictions on the transfer of funds; |
| • | adverse tax consequences; |
| • | the cost of and potential outcomes of any claims or litigation; |
| • | future accounting pronouncements and changes in accounting policies; |
| • | changes in tax laws or tax regulations; and |
| • | unstable regional and economic political conditions. |
28
Table of Contents
As we expand our business globally, our success will depend, in large part, on our ability to anticipate and effectively manage these risks. These factors and other factors could harm our ability to increase international revenues and, consequently, could materially impact our business and results of operations. The expansion of our existing international operations and entry into additional international markets will require significant management attention and financial resources. Our failure to successfully manage our international operations and the associated risks effectively could limit the future growth of our business.
We face exposure to foreign currency exchange rate fluctuations that could harm our results of operations.
We conduct transactions, including intercompany transactions, in currencies other than the U.S. dollar. As we grow our international operations, we expect the amount of our revenues that are denominated in foreign currencies to increase in the future. Accordingly, changes in the value of foreign currencies relative to the U.S. dollar could affect our revenues and operating results due to transactional and translational remeasurements that are reflected in our results of operations. As a result of such foreign currency exchange rate fluctuations, it could be more difficult to detect underlying trends in our business and results of operations. In addition, to the extent that fluctuations in currency exchange rates cause our results of operations to differ from our expectations or the expectations of our investors, the trading price of our common stock could be adversely affected.
We do not currently maintain a program to hedge transactional exposures in foreign currencies. However, in the future, we may use derivative instruments, such as foreign currency forward and option contracts, to hedge exposures to fluctuations in foreign currency exchange rates. The use of such hedging activities may not offset any or more than a portion of the adverse financial effects of unfavorable movements in foreign exchange rates over the limited time the hedges are in place. Moreover, the use of hedging instruments may introduce additional risks if we are unable to structure effective hedges with such instruments.
We are subject to governmental export and import controls that could impair our ability to compete in international markets due to licensing requirements and subject us to liability if we are not in compliance with applicable laws.
Our platform is subject to export controls, including the U.S. Department of Commerce’s Export Administration Regulations and various economic and trade sanctions regulations administered by the U.S. Treasury Department’s Office of Foreign Assets Controls. The U.S. export control laws and U.S. economic sanctions laws include prohibitions on the sale or supply of certain products and services to U.S. embargoed or sanctioned countries, governments, persons and entities and also require authorization for the export of encryption items. In addition, various countries regulate the import of certain encryption technology, including through import permitting and licensing requirements, and have enacted laws that could limit our ability to distribute our platform or could limit our customers’ ability to implement our platform in those countries. Although we take precautions to prevent our platform from being provided or deployed in violation of such laws, our platform may have been in the past, and could in the future be, provided inadvertently in violation of such laws, despite the precautions we take.
Changes in our platform, or changes in export, sanctions and import laws, may delay the introduction and sale of subscriptions to our platform in international markets, prevent our customers with international operations from deploying our platform or, in some cases, prevent the provision of our platform to certain countries, governments, persons or entities altogether. Any change in export or import regulations, economic sanctions or related laws, shift in the enforcement or scope of existing regulations, or change in the countries, governments, persons or technologies targeted by such regulations, could result in decreased use of our platform, or in our decreased ability to export or sell our platform to existing or potential customers with international operations. Any decreased use of our platform or limitation on our ability to export or sell our platform would likely adversely affect our business, financial condition and results of operations.
29
Table of Contents
Failure to comply with anti-bribery, anti-corruption, and anti-money laundering laws could subject us to penalties and other adverse consequences.
We are subject to the Foreign Corrupt Practices Act, or the FCPA, the U.K. Bribery Act and other anti-corruption, anti-bribery and anti-money laundering laws in domestic and various international jurisdictions. We leverage third parties, including channel partners, to sell subscriptions to our platform and conduct our business abroad. We and our third-party intermediaries may have direct or indirect interactions with officials and employees of government agencies or state-owned or affiliated entities and may be held liable for the corrupt or other illegal activities of these third-party business partners and intermediaries, our employees, representatives, contractors, channel partners, and agents, even if we do not explicitly authorize such activities. While we have policies and procedures to address compliance with such laws, we cannot assure you that all of our employees and agents will not take actions in violation of our policies and applicable law, for which we may be ultimately held responsible. Any violation of the FCPA or other applicable anti-bribery, anti-corruption laws, and anti-money laundering laws could result in whistleblower complaints, adverse media coverage, investigations, loss of export privileges, severe criminal or civil sanctions, or suspension or debarment from U.S. government contracts, all of which may have an adverse effect on our reputation, business and results of operations.
Adverse economic conditions may negatively impact our business.
Our business depends on the overall demand for business software and on the economic health of our current and prospective customers. Any significant weakening of the economy in the United States or Europe and of the global economy, more limited availability of credit, a reduction in business confidence and activity, increased government deficits, rising interest rates and increased inflation, economic uncertainty and other difficulties, may affect one or more of the sectors or countries in which we sell our solutions.
The vote of the United Kingdom, or the UK, to leave the EU, known as Brexit, has created substantial economic and political uncertainty, the impact of which depends on the terms of the UK’s withdrawal from the EU, which may not be determined for several years or more. This uncertainty may cause some of our customers or potential customers to curtail spending, and may ultimately result in new regulatory and cost challenges to our UK and other international operations. In addition, a strong dollar could reduce demand for our solutions in countries with relatively weaker currencies. Brexit has had an effect on global markets and currencies, including a decline in the value of the British pound as compared to the U.S. dollar. These adverse conditions could result in reductions in sales of our solutions, longer sales cycles, reductions in subscription terms and value, slower adoption of new technologies and increased price competition. Any of these events would likely have an adverse effect on our business and results of operations.
Catastrophic events may disrupt our business.
We rely heavily on our network infrastructure and information technology systems for our business operations. A disruption or failure of these systems in the event of online attack, earthquake, fire, terrorist attack, power loss, telecommunications failure or other similar catastrophic event could cause system interruptions, delays in accessing our service, reputational harm and loss of critical data or could prevent us from providing our solutions to our customers. A catastrophic event that results in the destruction or disruption of our data centers, or our network infrastructure or information technology systems, could affect our ability to conduct normal business operations and adversely affect our operating results.
The terms of our existing credit facility, loan agreement and any future indebtedness, could restrict our operations, particularly our ability to respond to changes in our business or to take specified actions.
As of April 30, 2018, we had a total of $52.2 million in outstanding principal indebtedness. Our existing credit facility and loan agreement contain, and any future indebtedness would likely contain, a number of restrictive covenants that impose significant operating and financial restrictions on us, including restrictions on
30
Table of Contents
our ability to take actions that may be in our best interests. Our credit facility and loan agreement require us to satisfy specified financial covenants. Our ability to meet those financial covenants can be affected by events beyond our control, and we may not be able to continue to meet those covenants. A breach of any of these covenants or the occurrence of other events specified in the credit facility and in the loan agreement could result in an event of default. Upon the occurrence of an event of default, our creditors could elect to declare all amounts outstanding to be immediately due and payable and terminate all commitments to extend further credit. If we were unable to repay those amounts, our creditors could proceed against the collateral granted to them to secure such indebtedness. We have pledged all of our assets, including our intellectual property, as collateral under the credit facility and the loan agreement. If our creditors accelerate the repayment of borrowings, if any, we may not have sufficient funds to repay our existing loan. See our Notes to the Consolidated Financial Statements for an additional description of our credit facility and loan agreement.
Our ability to timely raise capital in the future may be limited, and our failure to raise capital when needed could seriously harm our business, operating results and financial condition. In addition, debt or equity issued to raise additional capital may reduce the value of our common stock.
Our business and operations may consume our financial resources faster than we anticipate, and we may need to raise additional funds. Additional financing may not be available on favorable terms, if at all. If adequate funds are not available on acceptable terms, we may be unable to invest in future growth opportunities, which could seriously harm our business, operating results and financial condition. If we incur additional debt, the debt holders would have rights senior to holders of common stock to make claims on our assets, and the terms of any debt could restrict our operations, including our ability to pay dividends on our common stock. Furthermore, if we issue additional equity securities, stockholders will experience dilution, and the new equity securities could have rights senior to those of our common stock. Because our decision to issue securities in a future offering will depend on numerous considerations, including factors beyond our control, we cannot predict or estimate the amount, timing or nature of any future issuances of debt or equity securities. As a result, our stockholders bear the risk of future issuances of debt or equity securities reducing the value of our common stock and diluting their interest.
The nature of our business requires the application of complex revenue and expense recognition rules. Significant changes in current principles will affect our consolidated financial statements and changes in financial accounting standards or practices may cause adverse, unexpected financial reporting fluctuations and harm our results of operations.
The accounting rules and regulations that we must comply with are complex and subject to interpretation by the Financial Accounting Standards Board, or FASB, the Securities and Exchange Commission, or SEC, and various bodies formed to promulgate and interpret appropriate accounting principles. In addition, many companies’ accounting disclosures are being subjected to heightened scrutiny by regulators and the public. Further, the accounting rules and regulations are continually changing in ways that could impact our financial statements.
For example, in May 2014, FASB issued new accounting guidance on revenue recognition, Accounting Standards Update No. 2014-09, Revenue from Contracts with Customers (Topic 606). ASU 2014-09 will be effective for us for the first quarter of fiscal year 2020, though early adoption is permitted. Changes to accounting principles or our accounting policies on our financial statements going forward are difficult to predict, could have a significant effect on our reported financial results, and could affect the reporting of transactions completed before the announcement of the change. In addition, were we to change our critical accounting estimates, including the timing of recognition of subscription and professional services revenues and other revenue sources, our results of operations could be significantly impacted.
31
Table of Contents
We may not be able to successfully manage the growth of our business if we are unable to improve our internal systems, processes and controls.
We need to continue to improve our internal systems, processes and controls to effectively manage our operations and growth. We may not be able to successfully implement and scale improvements to our systems and processes in a timely or efficient manner or in a manner that does not negatively affect our operating results. In addition, our systems and processes may not prevent or detect all errors, omissions or fraud. We have licensed technology from third parties to help us improve our internal systems, processes and controls. The support services available for such third-party technology may be negatively affected by mergers and consolidation in the software industry, and support services for such technology may not be available to us in the future. We may experience difficulties in managing improvements to our systems, processes and controls or in connection with third-party software, which could impair our ability to provide our solutions or professional services to our customers in a timely manner, causing us to lose customers, limit us to smaller deployments of our solutions or increase our technical support costs.
We previously identified a material weakness in our internal control over financial reporting and, if our remediation of this material weakness is not effective, or if we fail to maintain an effective system of internal control over financial reporting in the future, we may not be able to accurately or timely report our financial condition or results of operations, which may adversely affect investor confidence in us and the valuation of our common stock.
As a public company, we will be required to maintain internal control over financial reporting and to report any material weaknesses in such internal controls. Section 404 of the Sarbanes-Oxley Act of 2002, or the Sarbanes-Oxley Act, requires that we evaluate and determine the effectiveness of our internal control over financial reporting and, beginning with our second annual report following this offering, provide a management report on internal control over financial reporting. A material weakness is a deficiency or combination of deficiencies in internal control over financial reporting such that there is a reasonable possibility that a material misstatement of our financial statements will not be prevented or detected on a timely basis.
Prior to fiscal 2016, we did not maintain processes, procedures and internal controls that were adequately designed, documented and executed over our revenue process which could have led to inaccurate and untimely recording or reporting of revenues. We put in place additional review and validation controls during subsequent fiscal years focused on ensuring the accuracy and completeness of revenues and deferred revenues and were able to remediate the material weakness in the revenue cycle in subsequent periods.
While we believe that these efforts will improve our internal control over financial reporting, the implementation of these measures is ongoing and will require validation and testing of the design and operating effectiveness of internal controls over a sustained period of financial reporting cycles. We cannot assure you that the measures we have taken to date, and are continuing to implement, will be sufficient to avoid potential future material weaknesses. Accordingly, there could continue to be a reasonable possibility that these deficiencies or others could result in a material misstatement of our financial statements that would not be prevented or detected on a timely basis.
The process of designing and implementing internal controls over financial reporting is time consuming, costly and complicated. If during the evaluation and testing process, we identify one or more other material weaknesses in our internal control over financial reporting or determine that existing material weaknesses have not been remediated, our management will be unable to assert that our internal control over financial reporting is effective. Even if our management concludes that our internal control over financial reporting is effective, our independent registered public accounting firm may conclude that there are material weaknesses with respect to our internal controls or the level at which our internal controls are documented, designed, implemented or reviewed. If we are unable to assert that our internal control over financial reporting is effective, or when required in the future, if our independent registered public accounting firm is unable to express an opinion as to
32
Table of Contents
the effectiveness of our internal control over financial reporting, investors may lose confidence in the accuracy and completeness of our financial reports and the valuation of our common stock could be adversely affected.
Our business is subject to a variety of U.S. and foreign laws, many of which are unsettled and still developing and which could subject us to claims or otherwise harm our business.
We are subject to a variety of laws in the United States and abroad, including laws regarding data retention, privacy and consumer protection, that are continuously evolving and developing. The scope and interpretation of the laws that are or may be applicable to us are often uncertain and may be conflicting, particularly laws outside the United States. For example, laws relating to the liability of providers of online services for activities of their users and other third parties are currently being tested by a number of claims, including actions based on invasion of privacy and other torts, unfair competition, copyright and trademark infringement, and other theories based on the nature and content of the materials searched, the ads posted, or the content provided by users. In addition, regulatory authorities around the world have enacted or are considering a number of legislative and regulatory proposals concerning privacy and data protection and other matters that may be applicable to our business. It is also likely that as our business grows and evolves and our solutions are used in a greater number of countries, we will become subject to laws and regulations in additional jurisdictions. It is difficult to predict how existing laws will be applied to our business and the new laws to which we may become subject.
If we are not able to comply with these laws or regulations or if we become liable under these laws or regulations, we could be directly harmed, and we may be forced to implement new measures to reduce our exposure to this liability. This may require us to expend substantial resources or to change certain solutions, which would negatively affect our business, financial condition and results of operations. In addition, the increased attention focused upon liability issues as a result of lawsuits and legislative proposals could harm our reputation or otherwise impact the growth of our business. Any costs incurred as a result of this potential liability could harm our business and operating results.
If we fail to adequately protect our proprietary rights, our competitive position could be impaired and we may lose valuable assets, experience reduced revenues and incur costly litigation to protect our rights.
Our success is dependent, in part, upon protecting our proprietary technology. We rely on a combination of patents, copyrights, trademarks, service marks, trade secret laws and contractual provisions in an effort to establish and protect our proprietary rights. However, the steps we take to protect our intellectual property may be inadequate. We will not be able to protect our intellectual property if we are unable to enforce our rights or if we do not detect unauthorized use of our intellectual property. Any of our patents, trademarks or other intellectual property rights may be challenged by others or invalidated through administrative process or litigation. While we have patent applications pending in the United States, we may be unable to obtain patent protection for the technology covered in our patent applications. In addition, any patents issued in the future may not provide us with competitive advantages, or may be successfully challenged by third parties. Furthermore, legal standards relating to the validity, enforceability and scope of protection of intellectual property rights are uncertain. Despite our precautions, it may be possible for unauthorized third parties to copy our solutions and use information that we regard as proprietary to create products and services that compete with ours. Some license provisions protecting against unauthorized use, copying, transfer and disclosure of our technology may be unenforceable under the laws of jurisdictions outside the United States. In addition, the laws of some countries do not protect proprietary rights to the same extent as the laws of the United States. To the extent we expand our international activities, our exposure to unauthorized copying and use of our solutions and proprietary information may increase.
We enter into confidentiality and invention assignment agreements with our employees and consultants and enter into confidentiality agreements with the parties with whom we have strategic relationships and business alliances. No assurance can be given that these agreements will be effective in controlling access to and distribution of our solutions and proprietary information. Further, these agreements do not prevent our
33
Table of Contents
competitors or partners from independently developing technologies that are substantially equivalent or superior to our solutions.
In order to protect our intellectual property rights, we may be required to spend significant resources to monitor and protect these rights. Litigation may be necessary in the future to enforce our intellectual property rights and to protect our trade secrets. Litigation brought to protect and enforce our intellectual property rights could be costly, time consuming and distracting to management and could result in the impairment or loss of portions of our intellectual property. Furthermore, our efforts to enforce our intellectual property rights may be met with defenses, counterclaims and countersuits attacking the validity and enforceability of our intellectual property rights. Our inability to protect our proprietary technology against unauthorized copying or use, as well as any costly litigation or diversion of our management’s attention and resources, could delay further sales or the implementation of our solutions, impair the functionality of our solutions, delay introductions of new solutions, result in our substituting inferior or more costly technologies into our solutions, or injure our reputation. In addition, we may be required to license additional technology from third parties to develop and market new solutions, and we cannot assure you that we would be able to license that technology on commercially reasonable terms or at all. Any inability to license third party technology in the future would have a material adverse effect on our business or operating results, and would adversely affect our ability to compete.
We may in the future be subject to legal proceedings and litigation, including intellectual property disputes, which are costly and may subject us to significant liability and increased costs of doing business. Our business may suffer if it is alleged or determined that our technology infringes the intellectual property rights of others.
The software industry is characterized by the existence of a large number of patents, copyrights, trademarks, trade secrets and other intellectual and proprietary rights. Companies in the software industry are often required to defend against litigation claims based on allegations of infringement or other violations of intellectual property rights. Our technologies may not be able to withstand any third-party claims or rights against their use. In addition, we may be contractually obligated to indemnify our customers in the event of infringement of a third party’s intellectual property rights. Responding to such claims, including those currently pending, regardless of their merit, can be time consuming, costly to defend in litigation, and damage our reputation and brand.
Intellectual property lawsuits are complex and inherently uncertain and there can be no assurance that we will prevail in defense of any such actions. Decisions in favor of the plaintiffs in any lawsuits that are brought against us in the future could subject us to significant liability for damages and our ability to develop and sell our solutions may be seriously harmed. We also may be required to redesign our solutions, delay releases, enter into costly settlement or license agreements, pay costly damage awards, or face a temporary or permanent injunction prohibiting us from marketing or selling our solutions. Requiring us to change one or more aspects of the way we deliver our solutions may harm our business.
Lawsuits are time-consuming and expensive to resolve, and they divert management’s time and attention. Although we carry liability insurance, our insurance may not be adequate to indemnify us for all liability that may be imposed. We cannot predict the outcome of lawsuits.
Indemnity provisions in various agreements potentially expose us to substantial liability for intellectual property infringement and other losses.
Our agreements with customers and other third parties typically include indemnification or other provisions under which we agree to indemnify or otherwise be liable to them for losses suffered or incurred as a result of claims of intellectual property infringement or other liabilities relating to or arising from our platform or services or other acts or omissions. Large indemnity payments or damage claims from contractual breach could harm our business, results of operations and financial condition. Although we contractually limit our liability with respect to such obligations, we may still incur substantial liability related to them. Any dispute with a customer with
34
Table of Contents
respect to such obligations could have adverse effects on our relationship with that customer and other current and prospective customers, reduce demand for our platform and adversely affect our business, results of operations and financial condition.
We may use open source software in our solutions, which could subject us to litigation or other actions.
We may use open source software in our solutions. From time to time, there have been claims challenging the ownership of open source software against companies that incorporate open source software into their products. As a result, we could be subject to lawsuits by parties claiming ownership of what we believe to be open source software. Litigation could be costly for us to defend, have a negative effect on our operating results and financial condition or require us to devote additional research and development resources to change our solutions. In addition, if we were to combine our proprietary software with open source software in a certain manner, we could, under certain of the open source licenses, be required to release the source code of our proprietary software. If we inappropriately use open source software, we may be required to re-engineer our solutions, discontinue the sale of our solutions or take other remedial actions.
Our customers may fail to pay us in accordance with the terms of their agreements, necessitating action by us to compel payment.
We typically enter into one- to three-year, non-cancelable arrangements with customers of our services. If customers fail to pay us under the terms of our agreements, we may be adversely affected both from the inability to collect amounts due and the cost of enforcing the terms of our contracts, including litigation. The risk of such negative effects increases with the term length of our customer arrangements. Furthermore, some of our customers may seek bankruptcy protection or other similar relief and fail to pay amounts due to us, or pay those amounts more slowly, either of which could adversely affect our operating results, financial position and cash flow.
Changes in laws and regulations related to the internet or changes in the internet infrastructure itself may diminish the demand for our solutions, and could have a negative impact on our business.
Federal, state or foreign government bodies or agencies have in the past adopted, and may in the future adopt, laws or regulations relating to Internet usage. Changes in these laws or regulations could require us to modify our solutions in order to comply with these laws or regulations. In addition, government agencies or private organizations may begin to impose taxes, fees or other charges for accessing the Internet or commerce conducted via the Internet. These laws or charges could limit the growth of Internet-related commerce or communications, or negatively impact demand for Internet-based solutions such as ours.
In addition, businesses could be adversely affected due to delays in the development or adoption of new standards and protocols to handle increased demands of Internet activity, security, reliability, cost, ease of use, accessibility, and quality of service. Businesses have been adversely affected by “viruses,” “worms” and similar malicious programs and have experienced a variety of outages and other delays as a result of damage to Internet infrastructure. These issues could negatively impact demand for our cloud-based solutions.
Future acquisitions, strategic investments, partnerships or alliances could be difficult to identify and integrate, divert the attention of management, disrupt our business, dilute stockholder value and adversely affect our operating results and financial condition.
We may in the future seek to acquire or invest in businesses, products or technologies that we believe could complement or expand our solutions, enhance our technical capabilities or otherwise offer growth opportunities. The pursuit of potential acquisitions may divert the attention of management and cause us to incur various expenses in identifying, investigating and pursuing suitable acquisitions, whether or not the acquisition purchases are completed. In addition, we have only limited experience in acquiring other businesses. If we acquire
35
Table of Contents
additional businesses, we may not be able to integrate successfully the acquired personnel, operations and technologies, or effectively manage the combined business following the acquisition. We may not be able to find and identify desirable acquisition targets or be successful in entering into an agreement with any particular target. Acquisitions could also result in dilutive issuances of equity securities or the incurrence of debt, which could adversely affect our operating results. In addition, if an acquired business fails to meet our expectations, our operating results, business and financial condition may suffer.
In order to grow our business, we anticipate that we will continue to depend on relationships with third parties, such as deployment partners, and technology and content providers. Identifying partners, and negotiating and documenting relationships with them, requires significant time and resources. Our competitors may be effective in providing incentives to third parties to favor their products or services or to prevent or reduce subscriptions to our services. In addition, acquisitions of our partners by our competitors could result in a decrease in the number of our current and potential customers, as our partners may no longer facilitate the adoption of our solutions by potential customers.
If we are unsuccessful in establishing or maintaining our relationships with third parties, our ability to compete in the marketplace or to grow our revenues could be impaired and our operating results may suffer. Even if we are successful, we cannot assure you that these relationships will result in increased customer usage of our solutions or increased revenues.
Adverse tax laws or regulations could be enacted or existing laws could be applied to us or our customers, which could increase the costs of our services and adversely impact our business.
The application of federal, state, local and international tax laws to services provided electronically is evolving. New income, sales, use or other tax laws, statutes, rules, regulations or ordinances could be enacted at any time (possibly with retroactive effect), and could be applied solely or disproportionately to services provided over the internet. These enactments could adversely affect our sales activity due to the inherent cost increase the taxes would represent and ultimately result in a negative impact on our operating results and cash flows.
In addition, existing tax laws, statutes, rules, regulations or ordinances could be interpreted, changed, modified or applied adversely to us (possibly with retroactive effect), which could require us or our customers to pay additional tax amounts, as well as require us or our customers to pay fines or penalties and interest for past amounts. If we are unsuccessful in collecting such taxes from our customers, we could be held liable for such costs, thereby adversely impacting our operating results and cash flows.
On December 22, 2017, new legislation was signed into law that significantly revises the Internal Revenue Code of 1986, as amended. The newly enacted federal income tax law, among other things, contains significant changes to corporate taxation, including reduction of the corporate tax rate from a top marginal rate of 35% to a flat rate of 21%, limitation of the tax deduction for interest expense to 30% of adjusted earnings (except for certain small businesses), limitation of the deduction for net operating losses to 80% of current year taxable income and elimination of net operating loss carrybacks, one time taxation of offshore earnings at reduced rates regardless of whether they are repatriated, elimination of U.S. tax on foreign earnings (subject to certain important exceptions), immediate deductions for certain new investments instead of deductions for depreciation expense over time, and modifying or repealing many business deductions and credits. Notwithstanding the reduction in the corporate income tax rate, the overall impact of the new federal tax law is uncertain and our business and financial condition could be adversely affected. In addition, it is uncertain if and to what extent various states will conform to the newly enacted federal tax law. The impact of this tax reform on holders of our common stock is also uncertain and could be adverse. We urge our stockholders to consult with their legal and tax advisors with respect to this legislation and the potential tax consequences of investing in or holding our common stock.
36
Table of Contents
Taxing authorities may successfully assert that we should have collected or paid, or in the future should collect or pay, sales, use, value added or similar taxes, and we could be subject to liability with respect to past or future sales, which could adversely affect our financial results.
We do not collect sales, use, value added and similar taxes in all jurisdictions in which we have sales, based on our belief that such taxes are not applicable. Sales, use, value added and similar tax laws and rates vary greatly by jurisdiction. Certain jurisdictions in which we do not collect such taxes may assert that such taxes are applicable, which could result in tax assessments, penalties and interest, and we may be required to collect and/or remit such taxes in the future. While we reserve estimated amounts with respect to such taxes on our financial statements, we cannot be certain that we have made sufficient reserves to cover such tax liabilities or such taxes. If our reserve amounts are inadequate, such tax assessments, penalties and interest or future requirements may adversely affect our results of operations and financial condition. Additionally, the application of federal, state, local and international tax laws to cloud services are continuously evolving. Income, sales, use or other tax laws, statutes, rules, regulations or ordinances could be enacted or amended at any time, possibly with retroactive effect, which could increase our taxes and ultimately have a negative impact on our results of operations and cash flows.
Our ability to use our net operating losses to offset future taxable income may be subject to certain limitations.
As of January 31, 2018, we had federal and state net operating loss carryforwards of $379.0 million. The federal and state net operating loss carryforwards will begin to expire, if not utilized, beginning in 2023. These net operating loss carryforwards could expire unused and be unavailable to offset future income tax liabilities. Under the newly enacted federal income tax law, federal net operating losses incurred in 2018 and in future years may be carried forward indefinitely, but the deductibility of such federal net operating losses is limited. It is uncertain if and to what extent various states will conform to the newly enacted federal tax law. In addition, under Section 382 of the Internal Revenue Code of 1986, as amended, and corresponding provisions of state law, if a corporation undergoes an “ownership change,” which is generally defined as a greater than 50% change, by value, in its equity ownership over a three-year period, the corporation’s ability to use its pre-change net operating loss carryforwards and other pre-change tax attributes to offset its post-change income or taxes may be limited. In connection with this offering, it is possible that we may experience an ownership change limitation. We may also experience ownership changes in the future as a result of subsequent shifts in our stock ownership, some of which may be outside of our control. If an ownership change occurs and our ability to use our net operating loss carryforwards is materially limited, it would harm our future operating results by effectively increasing our future tax obligations.
Risks Related to Being a Public Company
The requirements of being a public company may strain our resources, result in more litigation and divert management’s attention.
As a public company, we will be subject to the reporting requirements of the Securities Exchange Act of 1934, as amended, or the Exchange Act, the Sarbanes-Oxley Act, the Dodd-Frank Wall Street Reform and Consumer Protection Act, or the Dodd-Frank Act, the listing requirements of the stock exchange on which we will list and other applicable securities rules and regulations. Complying with these rules and regulations has increased and will increase our legal and financial compliance costs, make some activities more difficult, time consuming or costly and increase demand on our systems and resources. The Exchange Act requires, among other things, that we file annual, quarterly and current reports with respect to our business and operating results. The Sarbanes-Oxley Act requires, among other things, that we maintain effective disclosure controls and procedures and internal control over financial reporting. We are required to disclose changes made in our internal control and procedures on a quarterly basis. In order to maintain and, if required, improve our disclosure controls and procedures and internal control over financial reporting to meet this standard, significant resources and management oversight may be required. As a result, management’s attention may be diverted from other business concerns, which could
37
Table of Contents
adversely affect our business and operating results. We may need to hire additional employees or engage outside consultants to comply with these requirements, which will increase our costs and expenses.
In addition, changing laws, regulations and standards relating to corporate governance and public disclosure are creating uncertainty for public companies, increasing legal and financial compliance costs and making some activities more time consuming. These laws, regulations and standards are subject to varying interpretations and, as a result, their application in practice may evolve over time as new guidance is provided by regulatory and governing bodies. This could result in continuing uncertainty regarding compliance matters and higher costs necessitated by ongoing revisions to disclosure and governance practices. We intend to invest resources to comply with evolving laws, regulations and standards, and this investment may result in increased general and administrative expenses and a diversion of management’s time and attention from revenue-generating activities to compliance activities. If our efforts to comply with new laws, regulations and standards differ from the activities intended by regulatory or governing bodies due to ambiguities related to their application and practice, regulatory authorities may initiate legal proceedings against us and our business may be adversely affected.
These new rules and regulations may make it more expensive for us to obtain director and officer liability insurance and, in the future, we may be required to accept reduced coverage or incur substantially higher costs to obtain coverage. These factors could also make it more difficult for us to attract and retain qualified members of our board of directors, particularly to serve on our audit committee and compensation committee, and qualified executive officers.
By disclosing information in this prospectus and in filings required of a public company, our business and financial condition will become more visible, which we believe may result in threatened or actual litigation, including by competitors and other third parties. If those claims are successful, our business could be seriously harmed. Even if the claims do not result in litigation or are resolved in our favor, the time and resources needed to resolve them could divert our management’s resources and seriously harm our business.
We are an emerging growth company, and any decision on our part to comply only with certain reduced reporting and disclosure requirements applicable to emerging growth companies could make our common stock less attractive to investors.
We are an emerging growth company and, for as long as we continue to be an emerging growth company, we may choose to take advantage of exemptions from various reporting requirements applicable to other public companies but not to “emerging growth companies,” including:
| • | not being required to have our independent registered public accounting firm audit our internal control over financial reporting under Section 404 of the Sarbanes-Oxley Act; |
| • | reduced disclosure obligations regarding executive compensation in our periodic reports and annual report on Form 10-K; and |
| • | exemptions from the requirements of holding non-binding advisory votes on executive compensation and stockholder approval of any golden parachute payments not previously approved. |
We could be an emerging growth company for up to five years following the completion of this offering, although we expect to not be an emerging growth company sooner. Our status as an emerging growth company will end as soon as any of the following takes place:
| • | the last day of the fiscal year in which we have more than $1.07 billion in annual revenues; |
| • | the date we qualify as a “large accelerated filer,” with at least $700 million of equity securities held by non-affiliates; |
| • | the date on which we have issued, in any three-year period, more than $1.0 billion in non-convertible debt securities; or |
| • | the last day of the fiscal year ending after the fifth anniversary of the completion of this offering. |
38
Table of Contents
We cannot predict if investors will find our common stock less attractive if we choose to rely on any of the exemptions afforded emerging growth companies. If some investors find our common stock less attractive because we rely on any of these exemptions, there may be a less active trading market for our common stock and the market price of our common stock may be more volatile.
Under the JOBS Act, “emerging growth companies” can also delay adopting new or revised accounting standards until such time as those standards apply to private companies. We have elected to use the extended transition period under the JOBS Act. Accordingly, our financial statements may not be comparable to the financial statements of public companies that comply with such new or revised accounting standards.
Risks Related to This Offering and Our Common Stock
There has been no prior public trading market for our common stock, and an active trading market may never develop or be sustained.
We have applied to list our common stock on the New York Stock Exchange, or NYSE, under the symbol “ADIN.” However, we cannot assure you that an active trading market for our common stock will develop on that exchange or elsewhere or, if developed, that any market will be sustained. Accordingly, we cannot assure you of the likelihood that an active trading market for our common stock will develop or be maintained, the liquidity of any trading market, your ability to sell your shares of our common stock when desired, or the prices that you may obtain for your shares.
The market price of our common stock may be volatile or may decline steeply or suddenly regardless of our operating performance and we may not be able to meet investor or analyst expectations. You may not be able to resell your shares at or above the initial public offering price and may lose all or part of your investment.
The initial public offering price for our common stock will be determined through negotiations between the underwriters and us, and may vary from the market price of our common stock following this offering. If you purchase shares of our common stock in this offering, you may not be able to resell those shares at or above the initial public offering price. We cannot assure you that the market price following this offering will equal or exceed prices in privately negotiated transactions of our shares that have occurred from time to time before this offering. The market price of our common stock may fluctuate or decline significantly in response to numerous factors, many of which are beyond our control, including:
| • | announcements of new products or technologies, commercial relationships, acquisitions or other events by us or our competitors; |
| • | changes in how customers perceive the benefits of our software solutions; |
| • | departures of key personnel; |
| • | price and volume fluctuations in the overall stock market from time to time; |
| • | fluctuations in the trading volume of our shares or the size of our public float; |
| • | sales of large blocks of our common stock, and significant distributions to, and subsequent sales by, partners of our venture capital investors; |
| • | actual or anticipated changes or fluctuations in our results of operations; |
| • | whether our results of operations meet the expectations of securities analysts or investors; |
| • | changes in actual or future expectations of investors or securities analysts; |
| • | litigation involving us, our industry, or both; |
| • | regulatory developments in the United States, foreign countries, or both; |
39
Table of Contents
| • | general economic conditions and trends; |
| • | major catastrophic events in our domestic and foreign markets; and |
| • | “flash crashes,” “freeze flashes” or other glitches that disrupt trading on the securities exchange on which we will be listed. |
In addition, if the market for technology stocks or the stock market in general experiences a loss of investor confidence, the trading price of our common stock could decline for reasons unrelated to our business, results of operations or financial condition. The trading price of our common stock might also decline in reaction to events that affect other companies in our industry even if these events do not directly affect us. In the past, following periods of volatility in the trading price of a company’s securities, securities class action litigation has often been brought against that company. If our stock price is volatile, we may become the target of securities litigation. Securities litigation could result in substantial costs and divert our management’s attention and resources from our business. This could have an adverse effect on our business, results of operations and financial condition.
Future sales of shares by existing stockholders could cause our stock price to decline.
If our existing stockholders sell, or indicate an intent to sell, substantial amounts of our common stock in the public market after the 180-day contractual lock-up and other legal restrictions on resale discussed in this prospectus lapse, the trading price of our common stock could decline significantly and could decline below the initial public offering price. Upon the completion of this offering, we will have outstanding shares of common stock, assuming no exercise of outstanding options. Of these shares, the shares of common stock sold in this offering, plus any shares sold pursuant to the underwriters’ option to purchase additional shares, will be immediately freely tradable, without restriction, in the public market. However, Morgan Stanley & Co. LLC and Merrill Lynch, Pierce, Fenner & Smith Incorporated may, in their discretion, permit our officers, directors and other stockholders who have entered to lock-up agreements in connection with this offering to sell shares prior to the expiration of the lock-up agreements.
After the lock-up agreements pertaining to this offering expire, substantially all of such shares will be eligible for sale in the public market. In addition, upon issuance, the shares subject to outstanding options under our stock option plans, as well as the shares reserved for future issuance under our stock incentive plans will become eligible for sale in the public market, subject to certain legal and contractual limitations. Moreover, 180 days after the completion of this offering, holders of approximately 30,271,273 shares of our common stock will have the right to require us to register these shares under the Securities Act of 1933, as amended, or the Securities Act, pursuant to an investors’ rights agreement. If our existing stockholders sell substantial amounts of our common stock in the public market, or if the public perceives that such sales could occur, this could have an adverse effect on the market price of our common stock.
We have broad discretion in how we may use the net proceeds from this offering, and we may not use them effectively.
Our management will have broad discretion in applying the net proceeds we receive from this offering. We currently intend to use the net proceeds for general corporate purposes, including working capital, operating expenses and capital expenditures. We also intend to use a portion of the net proceeds we receive from this offering to repay outstanding indebtedness of $ . We cannot specify with certainty all of the particular uses for the remaining net proceeds to us from this offering. We may also use a portion of the net proceeds to acquire complementary businesses, products, services or technologies. However, we do not have agreements or commitments to enter into any acquisitions at this time. We may also spend or invest these proceeds in a way with which our stockholders disagree. If our management fails to use these funds effectively, our business could be seriously harmed. Pending their use, the net proceeds from this offering may be invested in a way that does not produce income or that loses value.
40
Table of Contents
We do not currently intend to pay dividends on our common stock and, consequently, your ability to achieve a return on your investment will depend on appreciation of the value of our common stock.
We have never declared or paid cash dividends on our capital stock. We currently intend to retain any future earnings to finance the operation and expansion of our business, and we do not expect to pay any cash dividends on our common stock in the foreseeable future. As a result, any investment return our common stock will depend upon increases in the value for our common stock, which are not certain. Furthermore, our credit facility and loan agreements have restrictions on the payment of dividends.
Purchasers in this offering will experience immediate and substantial dilution in the book value of their investment.
The initial public offering price of our common stock is substantially higher than the net tangible book value per share of our common stock immediately after this offering. Therefore, if you purchase our common stock in this offering, you will incur immediate dilution of $ in net tangible book value per share from the price you paid, based on the initial public offering price. In addition, new investors who purchase shares in this offering will contribute approximately % of the total amount of equity capital raised by us through the date of this offering, but will only own approximately % of the outstanding equity capital. The exercise of outstanding options will result in further dilution. For a detailed description of the dilution that you will experience immediately after this offering, see “Dilution.”
Future sales and issuances of our common stock or rights to purchase common stock, including pursuant to our equity incentive plans, could result in additional dilution of the percentage ownership of our stockholders and could cause the stock price of our common stock to decline.
We may issue additional securities following the completion of this offering. In the future, we may sell common stock, convertible securities or other equity securities in one or more transactions at prices and in a manner we determine from time to time. We also expect to issue common stock to employees and directors pursuant to our equity incentive plans. If we sell common stock, convertible securities or other equity securities in subsequent transactions, or common stock is issued pursuant to equity incentive plans, investors may be materially diluted. New investors in such subsequent transactions could gain rights, preferences and privileges senior to those of holders of our common stock.
Insiders will exercise significant control over our company and all corporate matters.
Our directors, executive officers, 5% or greater stockholders and their affiliates beneficially owned, in the aggregate, approximately 84% of our outstanding capital stock as of April 30, 2018. Upon the completion of this offering, and assuming they do not purchase shares in this offering, this same group will hold approximately % of our outstanding capital stock. As a result, if they act together, these stockholders will be able to exercise significant influence over all matters submitted to our stockholders for approval, including the election of directors and approval of significant corporate transactions, such as a merger or sale of our company or its assets. This concentration of ownership may have the effect of delaying or preventing a third party from acquiring control of our company and could adversely affect the market price of our common stock.
If securities or industry analysts issue an adverse opinion regarding our stock or do not publish research or reports about our company, our stock price and trading volume could decline.
The trading market for our common stock will depend in part on the research and reports that equity research analysts publish about us and our business. We do not control these analysts or the content and opinions included in their reports. Securities analysts may elect not to provide research coverage of our company after the closing of this offering, and such lack of research coverage may adversely affect the market price of our common stock. The price of our common stock could also decline if one or more equity research analysts downgrade our
41
Table of Contents
common stock, misinterpret our financial results or guidance, issue other unfavorable commentary or cease publishing reports about us or our business. If one or more equity research analysts cease coverage of our company, we could lose visibility in the market, which in turn could cause our stock price to decline.
Delaware law and provisions in our amended and restated certificate of incorporation and amended and restated bylaws that will be in effect on the completion of this offering could make a merger, tender offer or proxy contest difficult, thereby depressing the trading price of our common stock.
Our amended and restated certificate of incorporation and amended and restated bylaws that will be in effect on the completion of this offering contain provisions that could depress the trading price of our common stock by acting to discourage, delay or prevent a change of control of our company or changes in our management that the stockholders of our company may deem advantageous. These provisions include the following:
| • | establish a classified board of directors so that not all members of our board of directors are elected at one time; |
| • | permit the board of directors to establish the number of directors and fill any vacancies and newly-created directorships; |
| • | provide that directors may only be removed for cause; |
| • | require super-majority voting to amend some provisions in our certificate of incorporation and bylaws; |
| • | authorize the issuance of “blank check” preferred stock that our board of directors could use to implement a stockholder rights plan; |
| • | eliminate the ability of our stockholders to call special meetings of stockholders; |
| • | prohibit stockholder action by written consent, which requires all stockholder actions to be taken at a meeting of our stockholders; |
| • | provide that the board of directors is expressly authorized to make, alter or repeal our bylaws; |
| • | restrict the forum for certain litigation against us to Delaware; and |
| • | establish advance notice requirements for nominations for election to our board of directors or for proposing matters that can be acted upon by stockholders at annual stockholder meetings. |
Any provision of our amended and restated certificate of incorporation or amended and restated bylaws, that will be in effect on the completion of this offering or Delaware law that has the effect of delaying or deterring a change in control could limit the opportunity for our stockholders to receive a premium for their shares of our common stock, and could also affect the price that some investors are willing to pay for our common stock. For information regarding these and other provisions, see “Description of Capital Stock—Anti-Takeover Effects of Delaware Law and Our Certificate of Incorporation and Bylaws.”
Our amended and restated certificate of incorporation that will be in effect on the completion of this offering will provide that the Court of Chancery of the State of Delaware and the federal district courts of the United States will be the exclusive forums for substantially all disputes between us and our stockholders, which could limit our stockholders’ ability to obtain a favorable judicial forum for disputes with us or our directors, officers or employees.
Our amended and restated certificate of incorporation that will be in effect on the completion of this offering will provide that the Court of Chancery of the State of Delaware is the exclusive forum for:
| • | any derivative action or proceeding brought on our behalf; |
| • | any action asserting a breach of fiduciary duty or any other wrongdoing by any of our directors, officers, employees or agents to us or our stockholders; |
42
Table of Contents
| • | any action asserting a claim against us arising under the Delaware General Corporation Law, our amended and restated certificate of incorporation or our amended and restated bylaws; |
| • | any action to interpret, apply, enforce or determine the validity of our amended and restated certificate of incorporation or our amended and restated bylaws; and |
| • | any action asserting a claim against us governed by the internal affairs doctrine. |
Our amended and restated certificate of incorporation that will be in effect on the completion of this offering will further provide that the federal district courts of the United States of America will be the exclusive forum for resolving any complaint asserting a cause of action arising under the Securities Act.
These exclusive-forum provisions may limit a stockholder’s ability to bring a claim in a judicial forum that it finds favorable for disputes with us or our directors, officers or other employees, which may discourage lawsuits against us and our directors, officers and other employees. Some companies that have adopted a similar federal district court forum selection provision are currently subject to a lawsuit in the Court of Chancery of the State of Delaware by stockholders who assert that the provision is not enforceable. If a court were to find either exclusive-forum provision in our amended and restated certificate of incorporation that will be in effect on the completion of this offering to be inapplicable or unenforceable in an action, we may incur additional costs associated with resolving the dispute in other jurisdictions, which could seriously harm our business.
43
Table of Contents
SPECIAL NOTE REGARDING FORWARD-LOOKING STATEMENTS
This prospectus contains forward-looking statements about us and our industry that involve substantial risks and uncertainties. All statements other than statements of historical facts contained in this prospectus, including statements regarding our future results of operations or financial condition, business strategy and plans and objectives of management for future operations, including our statements regarding the benefits and timing of the roll-out of new technology, are forward-looking statements. In some cases, you can identify forward-looking statements because they contain words such as “anticipate,” “believe,” “contemplate,” “continue,” “could,” “estimate,” “expect,” “intend,” “may,” “plan,” “potential,” “predict,” “project,” “should,” “target,” “will” or “would” or the negative of these words or other similar terms or expressions.
You should not rely on forward-looking statements as predictions of future events. We have based the forward-looking statements contained in this prospectus primarily on our current expectations and projections about future events and trends that we believe may affect our business, financial condition and operating results. The outcome of the events described in these forward-looking statements is subject to risks, uncertainties and other factors described in the section titled “Risk Factors” and elsewhere in this prospectus. Moreover, we operate in a very competitive and rapidly changing environment. New risks and uncertainties emerge from time to time, and it is not possible for us to predict all risks and uncertainties that could have an impact on the forward-looking statements contained in this prospectus. The results, events and circumstances reflected in the forward-looking statements may not be achieved or occur, and actual results, events or circumstances could differ materially from those described in the forward-looking statements.
In addition, statements that “we believe” and similar statements reflect our beliefs and opinions on the relevant subject. These statements are based on information available to us as of the date of this prospectus. While we believe that information provides a reasonable basis for these statements, that information may be limited or incomplete. Our statements should not be read to indicate that we have conducted an exhaustive inquiry into, or review of, all relevant information. These statements are inherently uncertain, and investors are cautioned not to unduly rely on these statements.
The forward-looking statements made in this prospectus relate only to events as of the date on which the statements are made. We undertake no obligation to update any forward-looking statements made in this prospectus to reflect events or circumstances after the date of this prospectus or to reflect new information or the occurrence of unanticipated events, except as required by law. We may not actually achieve the plans, intentions or expectations disclosed in our forward-looking statements, and you should not place undue reliance on our forward-looking statements. Our forward-looking statements do not reflect the potential impact of any future acquisitions, mergers, dispositions, joint ventures or investments.
44
Table of Contents
This prospectus contains estimates and information concerning our industry, including market size and growth rates of the markets in which we participate, that are based on industry publications and reports. This information involves a number of assumptions and limitations, and you are cautioned not to give undue weight to these estimates. We have not independently verified the accuracy or completeness of the data contained in these industry publications and reports. The industry in which we operate is subject to a high degree of uncertainty and risk due to a variety of factors, including those described in the section titled “Risk Factors.” These and other factors could cause results to differ materially from those expressed in these publications and reports.
Certain information in the text of this prospectus is contained in independent industry publications. The source of these independent industry publications is provided below:
| • | Association for Finance Professionals, Inc., 2016 AFP Financial Planning & Analysis Benchmarking Survey: FP&A, a Function in Transition Report of Survey Results, October 2016. |
| • | Forrester Research, Inc., The Forrester Wave™: Enterprise Performance Management, Q4 2016, October 6, 2016. |
| • | Gartner, Magic Quadrant for Cloud Strategic Corporate Performance Management Solutions Published 29 June 2017 (Previous title: Gartner, Magic Quadrant for Strategic Corporate Performance Management Solutions). |
| • | International Data Corporation, IDC Semiannual Public Cloud Services Tracker: Forecast, 2017H1, November 10, 2017. |
| • | International Data Corporation, IDC Semiannual Software Tracker: 2017H1 Forecast Release, November 10, 2017. |
| • | Nucleus Research Inc., CPM Technology Value Matrix 2017, June 2017. |
| • | Nucleus Research Inc., CPM Technology Value Matrix 2018, February 2018. |
| • | S&P Global Market Intelligence database accessed on February 5, 2018. |
The Gartner Reports described herein, (the “Gartner Reports”) represent research opinion or viewpoints published, as part of a syndicated subscription service, by Gartner, Inc. (“Gartner”), and are not representations of fact. Each Gartner Report speaks as of its original publication date (and not as of the date of this Prospectus) and the opinions expressed in the Gartner Reports are subject to change without notice.
Gartner does not endorse any vendor, product or service depicted in its research publications, and does not advise technology users to select only those vendors with the highest ratings or other designation. Gartner research publications consist of the opinions of Gartner’s research organization and should not be construed as statements of fact. Gartner disclaims all warranties, expressed or implied, with respect to this research, including any warranties of merchantability or fitness for a particular purpose.
Unless otherwise indicated, information contained in this prospectus concerning our industry and the markets in which we operate, including our general expectations and market position, market opportunity, and market size, is based on information and data from various sources, including S&P Global Market Intelligence, on assumptions that we have made that are based on that information and data and other similar sources and on our knowledge of the markets for our products and services. This information involves a number of assumptions and limitations, and you are cautioned not to give undue weight to such estimates. While we believe the market position, market opportunity and market size information included in this prospectus is generally reliable, such information is inherently imprecise. In addition, projections, assumptions and estimates of our future performance and the future performance of the industry in which we operate is necessarily subject to a high degree of uncertainty and risk due to a variety of factors, including those described in the section titled “Risk Factors” and elsewhere in this prospectus. These and other factors could cause results to differ materially from those expressed in the estimates made by the independent parties and by us.
45
Table of Contents
The S&P Global Market Intelligence data described herein represents proprietary data gathered by S&P Global Market Intelligence and is not a representation of fact. The S&P Global Market Intelligence data is as of February 5, 2018 (and not as of the date of this prospectus) and is subject to change without notice.
46
Table of Contents
We estimate that we will receive net proceeds from this offering of approximately $ million (or approximately $ million if the underwriters exercise their over-allotment option in full) based on an assumed initial public offering price of $ per share of common stock, the midpoint of the estimated price range set forth on the cover page of this prospectus, after deducting estimated underwriting discounts and commissions and estimated offering expenses.
A $1.00 increase (decrease) in the assumed initial public offering price of $ per share of common stock would increase (decrease) the net proceeds to us from this offering by approximately $ million, assuming the number of shares offered by us, as set forth on the cover page of this prospectus, remains the same, and after deducting estimated underwriting discounts and commissions. Similarly, each increase (decrease) of 1.0 million shares in the number of shares of common stock offered by us would increase (decrease) the net proceeds to us from this offering by approximately $ million, assuming the assumed initial public offering price of $ per share of common stock remains the same, and after deducting estimated underwriting discounts and commissions.
The principal purposes of this offering are to increase our capitalization and financial flexibility, and create a public market for our common stock. We currently intend to use the net proceeds we receive from this offering for general corporate purposes, including working capital, operating expenses and capital expenditures. We also intend to use a portion of the net proceeds we receive from this offering to repay outstanding indebtedness of $ under our 2018 Amended Loan Agreement and our 2017 Loan Agreement, as described in “Management’s Discussion and Analysis of Financial Condition and Results of Operations—Results of Operations—Liquidity and Capital Resources.” The outstanding principal under the 2018 Amended Loan Agreement accrues interest at a floating annual rate of 0.25% above the Wall Street Journal’s Prime Rate, and matures in March 2021. The outstanding principal under the 2017 Loan Agreement matures in June 2021. We pay cash interest in arrears on the unpaid principal on a monthly basis at a fixed rate of 6.5% per annum, and we also incur additional interest paid in kind on the unpaid principal at a fixed rate of 5.5% per annum, which amount is added to the outstanding principal balance monthly in arrears. If we prepay the principal under the 2017 Loan Agreement, we will be required to pay a prepayment premium between 1.0% and 4.0% of the principal amount prepaid. We cannot specify with certainty all of the particular uses for the remaining net proceeds to us from this offering.
We may also use a portion of the net proceeds to acquire complementary businesses, products, services or technologies. However, we do not have agreements or commitments to enter into any acquisitions at this time.
We will have broad discretion over how to use the net proceeds to us from this offering. We intend to invest the net proceeds to us from the offering that are not used as described above in investment-grade, interest-bearing instruments.
We have never declared or paid cash dividends on our capital stock. We currently intend to retain all available funds and future earnings, if any, to fund the development and expansion of our business, and we do not anticipate paying any cash dividends in the foreseeable future. Any future determination regarding the declaration and payment of dividends, if any, will be at the discretion of our board of directors and will depend on then-existing conditions, including our financial condition, operating results, contractual restrictions, capital requirements, business prospects and other factors our board of directors may deem relevant. In addition, our credit agreements contain restrictions on payments of cash dividends and we may enter into other agreements in the future that could have similar restrictions.
47
Table of Contents
The following table sets forth our cash and cash equivalents, and our capitalization as of April 30, 2018 as follows:
| • | on an actual basis; |
| • | on a pro forma basis to reflect (1) the automatic conversion of all outstanding shares of our redeemable convertible preferred stock as of April 30, 2018 into 30,277,523 shares of common stock immediately prior to the completion of this offering and (2) the filing of our amended and restated certificate of incorporation immediately prior to the completion of this offering; and |
| • | on a pro forma as adjusted basis to give further effect to the repayment of indebtedness of $ , and our issuance and sale of shares of common stock in this offering at an assumed initial public offering price of $ per share, the midpoint of the price range set forth on the cover page of this prospectus, after deducting the estimated underwriting discounts and commissions and estimated offering expenses payable by us. |
The pro forma and pro forma as adjusted information below is illustrative only, and our capitalization following the completion of this offering will be adjusted based on the actual initial public offering price and other terms of this offering determined at pricing. You should read this information in conjunction with our consolidated financial statements and the related notes included in this prospectus and the “Management’s Discussion and Analysis of Financial Condition and Results of Operations” section and other financial information contained in this prospectus.
| As of April 30, 2018 | ||||||||||||
| Actual | Pro Forma | Pro Forma As Adjusted(1) |
||||||||||
| (in thousands, except per share data) | ||||||||||||
| Cash and cash equivalents |
$ | 43,819 | $ | 43,819 | $ | |||||||
|
|
|
|
|
|
|
|||||||
| Long-term debt |
$ | 50,062 | $ | 50,062 | ||||||||
| Redeemable convertible preferred stock, $0.001 par value per share; 121,181 shares authorized; 30,278 shares issued and outstanding, actual; no shares authorized, issued and outstanding, pro forma and pro forma as adjusted |
179,245 | — | ||||||||||
| Stockholders’ deficit: |
||||||||||||
| Preferred stock, $0.001 par value per share: no shares authorized, issued or outstanding, actual; shares authorized and no shares issued or outstanding, pro forma and pro forma as adjusted |
— | — | ||||||||||
| Common stock, $0.001 par value per share; 195,000 shares authorized, 6,707 shares issued and outstanding, actual; 195,000 shares authorized; pro forma and pro forma as adjusted; 36,985 shares issued and outstanding, pro forma; shares issued and outstanding, pro forma as adjusted |
26 | 147 | ||||||||||
| Additional paid-in capital |
29,354 | 208,478 | ||||||||||
| Accumulated deficit |
(299,042 | ) | (299,042 | ) | ||||||||
|
|
|
|
|
|
|
|||||||
| Total stockholders’ equity (deficit) |
(269,662 | ) | (90,417 | ) | ||||||||
|
|
|
|
|
|
|
|||||||
| Total capitalization |
$ | (90,417 | ) | $ | (90,417 | ) | $ | |||||
|
|
|
|
|
|
|
|||||||
| (1) | Each $1.00 increase (decrease) in the assumed initial public offering price of $ per share, the midpoint of the price range set forth on the cover page of this prospectus, would increase (decrease) the pro |
48
Table of Contents
| forma as adjusted amount of each of cash and cash equivalents, total stockholders’ deficit and total capitalization by approximately $ , assuming that the number of shares offered by us, as set forth on the cover page of this prospectus, remains the same and after deducting estimated underwriting discounts and commissions. Similarly, each increase (decrease) of 1.0 million shares in the number of shares offered by us at the assumed initial public offering price per share would increase (decrease) the pro forma as adjusted amount of each of cash and cash equivalents, total stockholders’ deficit and total capitalization by approximately $ , assuming the assumed initial public offering price of $ per share of common stock remains the same, and after deducting estimated underwriting discounts and commissions. |
The number of shares in the table above excludes:
| • | 8,921,141 shares of our common stock issuable upon the exercise of options to purchase shares of our common stock outstanding as of April 30, 2018, with a weighted-average exercise price of $5.72 per share; |
| • | 137,000 shares of our common stock issuable upon the exercise of options to purchase shares of our common stock granted after April 30, 2018, with an exercise price of $13.50 per share; |
| • | 427,131 shares of our common stock issuable upon the exercise of warrants outstanding as of April 30, 2018, with a weighted-average exercise price of $4.38 per share; |
| • | shares of our common stock reserved for future issuance under our 2018 Plan, which includes an annual evergreen increase and will become effective in connection with this offering; and |
| • | shares of our common stock reserved for future issuance under our ESPP, which will become effective immediately prior to the public trading date of our common stock. |
49
Table of Contents
If you invest in our common stock in this offering, your ownership interest will be immediately diluted to the extent of the difference between the initial public offering price per share and the pro forma as adjusted net tangible book value per share of our common stock after this offering.
As of April 30, 2018, we had a pro forma net tangible book value (deficit) of $(94.7) million, or $(2.56) per share of common stock. Pro forma net tangible book value per share represents the amount of our total tangible assets less our total liabilities, divided by the number of shares of our common stock outstanding as of April 30, 2018, after giving effect to the automatic conversion of all shares of our redeemable convertible preferred stock outstanding as of April 30, 2018 into 30,277,523 shares of our common stock.
After giving further effect to the sale of shares of common stock that we are offering at an assumed initial public offering price of $ per share, the midpoint of the price range set forth on the cover page of this prospectus, and after deducting the estimated underwriting discounts and commissions and estimated offering expenses payable by us, our pro forma as adjusted net tangible book value as of April 30, 2018 would have been approximately $ million, or approximately $ per share. This amount represents an immediate increase in pro forma net tangible book value of $ per share to our existing stockholders and an immediate dilution in pro forma net tangible book value of approximately $ per share to new investors purchasing shares of common stock in this offering.
Dilution per share to new investors is determined by subtracting pro forma as adjusted net tangible book value per share after this offering from the initial public offering price per share paid by new investors. The following table illustrates this dilution (without giving effect to any exercise by the underwriters of their over-allotment option):
| Assumed initial public offering price per share |
$ | |||||||
| Pro forma net tangible book value per share as of April 30, 2018 |
$ | (2.56) | ||||||
| Increase in pro forma net tangible book value per share attributable to this offering |
||||||||
|
|
|
|||||||
| Pro forma as adjusted net tangible book value per share after this offering |
||||||||
|
|
|
|||||||
| Dilution per share to new investors in this offering |
$ | |||||||
|
|
|
Each $1.00 increase (decrease) in the assumed initial public offering price of $ per share, the midpoint of the price range set forth on the cover page of this prospectus, would increase (decrease) the pro forma as adjusted net tangible book value per share after this offering by approximately $ , and dilution in pro forma net tangible book value per share to new investors by approximately $ , assuming that the number of shares offered by us, as set forth on the cover page of this prospectus, remains the same and after deducting the estimated underwriting discounts and commissions. Each increase (decrease) of 1.0 million shares in the number of shares offered by us would increase (decrease) our pro forma as adjusted net tangible book value per share after this offering by approximately $ per share and decrease (increase) the dilution to investors participating in this offering by approximately $ per share, assuming that the assumed initial public offering price remains the same, and after deducting the estimated underwriting discounts and commissions.
If the underwriters exercise their over-allotment option in full, the pro forma as adjusted net tangible book value after the offering would be $ per share, the increase in pro forma net tangible book value per share to existing stockholders would be $ per share and the dilution per share to new investors would be $ per share, in each case assuming an initial public offering price of $ per share, the midpoint of the price range set forth on the cover page of this prospectus.
The following table summarizes on the pro forma as adjusted basis described above, as of April 30, 2018, the differences between the number of shares purchased from us, the total consideration paid to us in cash and the
50
Table of Contents
average price per share paid by existing stockholders for shares issued prior to this offering and the price to be paid by new investors in this offering. The calculation below is based on the assumed initial public offering price of $ per share, the midpoint of the price range set forth on the cover page of the prospectus, before deducting the estimated underwriting discounts and commissions and estimated offering expenses payable by us.
| Shares Purchased | Total Consideration | Average Price Per Share |
||||||||||||||||||
| Number | Percent | Amount | Percent | |||||||||||||||||
| Existing stockholders |
% | $ | % | $ | ||||||||||||||||
| New investors |
||||||||||||||||||||
|
|
|
|
|
|
|
|
|
|||||||||||||
| Total |
100 | % | 100 | % | ||||||||||||||||
|
|
|
|
|
|
|
|
|
|||||||||||||
The foregoing tables and calculations exclude:
| • | 8,921,141 shares of our common stock issuable upon the exercise of options to purchase shares of our common stock outstanding as of April 30, 2018, with a weighted-average exercise price of $5.72 per share; |
| • | 137,000 shares of our common stock issuable upon the exercise of options to purchase shares of our common stock granted after April 30, 2018, with an exercise price of $13.50 per share; |
| • | 427,131 shares of our common stock issuable upon the exercise of warrants outstanding as of April 30, 2018, with a weighted-average exercise price of $4.38 per share; |
| • | shares of our common stock reserved for future issuance under our 2018 Plan, which includes an annual evergreen increase and will become effective in connection with this offering; and |
| • | shares of our common stock reserved for future issuance under our ESPP, which will become effective immediately prior to the public trading date of our common stock. |
To the extent any outstanding options or warrants are exercised, there will be further dilution to new investors. If all of such outstanding options and warrants had been exercised as of January 31, 2018, the pro forma as adjusted net tangible book value per share after this offering would be $ , and total dilution per share to new investors would be $ .
If the underwriters exercise their over-allotment option in full:
| • | the percentage of shares of common stock held by existing stockholders will decrease to approximately % of the total number of shares of our common stock outstanding after this offering; and |
| • | the number of shares held by new investors will increase to , or approximately % of the total number of shares of our common stock outstanding after this offering. |
51
Table of Contents
SELECTED CONSOLIDATED FINANCIAL DATA
The following selected consolidated statements of operations data for the years ended January 31, 2016, 2017 and 2018 and the consolidated balance sheet data as of January 31, 2017 and 2018 have been derived from our audited consolidated financial statements included elsewhere in this prospectus. The selected consolidated balance sheet data as of January 31, 2016 has been derived from our audited consolidated financial statements not included in this prospectus. The selected consolidated statements of operations data presented below for the three month periods ended April 30, 2017 and 2018 and the balance sheet data as of April 30, 2018 are derived from our unaudited quarterly consolidated financial statements included elsewhere in this prospectus and contain all adjustments, consisting of normal recurring adjustments, that management considers necessary for a fair presentation of our financial position and results of operations for the periods presented. Our historical results are not necessarily indicative of the results that may be expected in the future, and our interim results are not necessarily indicative of the results to be expected for the full fiscal year. You should read the consolidated financial data set forth below in conjunction with our consolidated financial statements and the accompanying notes and the information in “Management’s Discussion and Analysis of Financial Condition and Results of Operations” contained elsewhere in this prospectus. The last day of our fiscal year is January 31.
| Year Ended January 31, | Three Months Ended April 30, |
|||||||||||||||||||
| 2016 | 2017 | 2018 | 2017 | 2018 | ||||||||||||||||
| (unaudited) | ||||||||||||||||||||
| (in thousands, except per share data) | ||||||||||||||||||||
| Consolidated Statements of Operations Data: |
||||||||||||||||||||
| Revenues: |
||||||||||||||||||||
| Subscription |
$ | 49,365 | $ | 69,696 | $ | 93,888 | $ | 21,220 | $ | 28,290 | ||||||||||
| Professional services and other |
12,341 | 12,095 | 12,620 | 2,995 | 3,761 | |||||||||||||||
|
|
|
|
|
|
|
|
|
|
|
|||||||||||
| Total revenues |
61,706 | 81,791 | 106,508 | 24,215 | 32,051 | |||||||||||||||
|
|
|
|
|
|
|
|
|
|
|
|||||||||||
| Cost of revenues: |
||||||||||||||||||||
| Subscription |
9,104 | 11,628 | 14,684 | 3,526 | 4,240 | |||||||||||||||
| Professional services and other |
13,623 | 13,236 | 13,209 | 3,173 | 3,943 | |||||||||||||||
|
|
|
|
|
|
|
|
|
|
|
|||||||||||
| Total cost of revenues(1) |
22,727 | 24,864 | 27,893 | 6,699 | 8,183 | |||||||||||||||
|
|
|
|
|
|
|
|
|
|
|
|||||||||||
| Gross profit |
38,979 | 56,927 | 78,615 | 17,516 | 23,868 | |||||||||||||||
|
|
|
|
|
|
|
|
|
|
|
|||||||||||
| Operating expenses: |
||||||||||||||||||||
| Sales and marketing(1) |
62,463 | 64,417 | 77,903 | 17,805 | 19,746 | |||||||||||||||
| Research and development(1) |
22,024 | 23,514 | 24,342 | 5,768 | 6,876 | |||||||||||||||
| General and administrative(1) |
12,718 | 13,669 | 16,993 | 3,753 | 6,124 | |||||||||||||||
|
|
|
|
|
|
|
|
|
|
|
|||||||||||
| Total operating expenses |
97,205 | 101,600 | 119,238 | 27,326 | 32,746 | |||||||||||||||
|
|
|
|
|
|
|
|
|
|
|
|||||||||||
| Loss from operations |
(58,226 | ) | (44,673 | ) | (40,623 | ) | (9,810 | ) | (8,878 | ) | ||||||||||
| Other expense (income), net |
596 | (100 | ) | 1,796 | 146 | 2,092 | ||||||||||||||
|
|
|
|
|
|
|
|
|
|
|
|||||||||||
| Loss before provision for income taxes |
(58,822 | ) | (44,573 | ) | (42,419 | ) | (9,956 | ) | (10,970 | ) | ||||||||||
| Provision for income taxes |
316 | 147 | 254 | 42 | 76 | |||||||||||||||
|
|
|
|
|
|
|
|
|
|
|
|||||||||||
| Net loss |
$ | (59,138) | $ | (44,720 | ) | $ | (42,673 | ) | $ | (9,998 | ) | $ | (11,046 | ) | ||||||
|
|
|
|
|
|
|
|
|
|
|
|||||||||||
| Net loss per share attributable to common stockholders, basic and diluted(2) |
$ | (15.00 | ) | $ | (9.04 | ) | $ | (7.65 | ) | $ | (1.88 | ) | $ | (1.74 | ) | |||||
|
|
|
|
|
|
|
|
|
|
|
|||||||||||
| Weighted average shares used in computing net loss per share attributable to common stockholders, basic and diluted(2) |
3,943 | 4,946 | 5,576 | 5,305 | 6,356 | |||||||||||||||
|
|
|
|
|
|
|
|
|
|
|
|||||||||||
| Pro forma net loss per share attributable to common stockholders, basic and diluted (unaudited)(2) |
$ | (1.19 | ) | $ | (0.30 | ) | ||||||||||||||
|
|
|
|
|
|||||||||||||||||
| Weighted average shares used in computing pro forma net loss per share, basic and diluted (unaudited)(2) |
35,854 | 36,634 | ||||||||||||||||||
|
|
|
|
|
|||||||||||||||||
52
Table of Contents
| (1) | Includes stock-based compensation expense as follows (in thousands): |
| Year Ended January 31, | Three Months Ended April 30, |
|||||||||||||||||||
| 2016 | 2017 | 2018 | 2017 | 2018 | ||||||||||||||||
| (unaudited) | ||||||||||||||||||||
| Cost of revenues |
$ | 78 | $ | 146 | $ | 274 | $ | 47 | $ | 109 | ||||||||||
| Research and development |
204 | 462 | 766 | 168 | 257 | |||||||||||||||
| Sales and marketing |
513 | 633 | 1,138 | 282 | 350 | |||||||||||||||
| General and administrative |
1,524 | 1,813 | 2,000 | 481 | 553 | |||||||||||||||
|
|
|
|
|
|
|
|
|
|
|
|||||||||||
| Total |
$ | 2,319 | $ | 3,054 | $ | 4,178 | $ | 978 | $ | 1,269 | ||||||||||
|
|
|
|
|
|
|
|
|
|
|
|||||||||||
| (2) | See Notes 15 and 16 to our consolidated financial statements included elsewhere in this prospectus for an explanation of the method used to calculate the historical net loss and the historical and pro forma net loss per share attributable to common stockholders, basic and diluted, and the number of shares used in the computation of these per share amounts. |
| As of January 31, | As of April 30, 2018 |
|||||||||||||||
| 2016 | 2017 | 2018 | ||||||||||||||
| (unaudited) | ||||||||||||||||
| (in thousands) |
||||||||||||||||
| Consolidated Balance Sheet Data: |
||||||||||||||||
| Cash and cash equivalents |
$ | 62,039 | $ | 22,709 | $ | 30,134 | $ | 43,819 | ||||||||
| Working capital (deficit) |
14,174 | (29,474 | ) | (44,133 | ) | (30,548 | ) | |||||||||
| Total assets |
85,194 | 51,692 | 63,238 | 82,169 | ||||||||||||
| Deferred revenues, current and non-current |
74,218 | 83,661 | 92,384 | 96,519 | ||||||||||||
| Long-term debt, current and non-current |
3,226 | 2,120 | 26,019 | 50,062 | ||||||||||||
| Common stock warrant liability |
— | — | 1,386 | — | ||||||||||||
| Redeemable convertible preferred stock |
179,245 | 179,245 | 179,245 | 179,245 | ||||||||||||
| Total stockholders’ deficit |
(189,311 | ) | (228,526 | ) | (263,829 | ) | (269,662 | ) | ||||||||
Free Cash Flow
Free cash flow is a non-GAAP financial measure that we calculate as net cash (used in) provided by operating activities less capital expenditures. We believe free cash flow is an important liquidity measure of the cash that is available, after capital expenditures, for operational expenses and investment in our business.
Our free cash flow was as follows (in thousands):
| Year Ended January 31, | Three Months Ended April 30, |
|||||||||||||||||||
| 2016 | 2017 | 2018 | 2017 | 2018 | ||||||||||||||||
| Free cash flow |
$ | (45,513 | ) | $ | (38,565 | ) | $ | (20,048 | ) | $ | (7,097 | ) | $ | (11,825 | ) | |||||
Reconciliation of Free Cash Flow
Our use of free cash flow has limitations as an analytical tool and you should not consider it in isolation or as a substitute for an analysis of our results under GAAP. First, free cash flow is not a substitute for net cash (used in) provided by operating activities. Second, other companies may calculate free cash flow or similarly titled non-GAAP financial measures differently or may use other measures to evaluate their performance, all of which could reduce the usefulness of free cash flow as a tool for comparison. Additionally, the utility of free cash flow as a measure of liquidity is further limited as it does not represent the total increase or decrease in our cash balance for a given period. Because of these and other limitations, you should consider free cash flow along with our GAAP financial results.
53
Table of Contents
The following table presents a reconciliation of free cash flow to net cash (used in) provided by operating activities (in thousands):
| Year Ended January 31, |
Three Months Ended April 30, |
|||||||||||||||||||
| 2016 | 2017 | 2018 | 2017 | 2018 | ||||||||||||||||
| Net cash used in operating activities |
$ | (40,811 | ) | $ | (34,394 | ) | $ | (15,197 | ) | $ | (5,898 | ) | $ | (10,601 | ) | |||||
| Less: Purchases of property and equipment |
(2,433 | ) | (1,894 | ) | (1,360 | ) | (381 | ) | (253 | ) | ||||||||||
| Less: Capitalized software development costs |
(2,045 | ) | (2,277 | ) | (3,491 | ) | (818 | ) | (971 | ) | ||||||||||
| Less: Acquisition of intangible asset |
(224 | ) | — | — | — | — | ||||||||||||||
| Free cash flow |
$ | (45,513 | ) | $ | (38,565 | ) | $ | (20,048 | ) | $ | (7,097 | ) | $ | (11,825 | ) | |||||
| Net cash used in investing activities |
(4,702 | ) | (4,171 | ) | (4,851 | ) | (1,199 | ) | (1,224 | ) | ||||||||||
| Net cash (used in) provided by financing activities |
78,741 | (765 | ) | 27,473 | (196 | ) | 25,510 | |||||||||||||
54
Table of Contents
MANAGEMENT’S DISCUSSION AND ANALYSIS OF
FINANCIAL CONDITION AND RESULTS OF OPERATIONS
The following Management’s Discussion and Analysis of Financial Condition and Results of Operations should be read together with our consolidated financial statements and accompanying notes included elsewhere within this prospectus. This discussion includes both historical information and forward-looking information that involves risk, uncertainties and assumptions. Our actual results may differ materially from management’s expectations as a result of various factors, including, but not limited to, those discussed in the section entitled “Risk Factors.” The last day of our fiscal year is January 31. Our fiscal quarters end on April 30, July 31, October 31, and January 31. Fiscal 2019, our current fiscal year, will end on January 31, 2019.
Overview
We are a leading provider of cloud-based software to modernize business planning. Our platform—the Adaptive Insights Business Planning Cloud—transforms business planning into a strategic and competitive advantage by enabling organizations to respond to changing business conditions with confidence and agility. The Adaptive Insights Business Planning Cloud allows customers to rapidly and effectively model their businesses, monitor and analyze performance on an ongoing basis, share dashboards, and generate management reports. In addition, customers can use our Business Planning Cloud to evaluate actual performance versus plan, test alternative scenarios, and leverage insights from analytics to make informed, timely decisions that drive future results.
We were founded in 2003 through the leadership of Rob Hull, a chief financial officer frustrated with the inherent difficulty, complexity and resource intensity of corporate planning. From day one, we have focused on enabling companies and teams to better manage their planning processes with an easy-to-use cloud solution. Over the next decade, we built a highly usable and capable planning solution and grew our customer base to more than 1,000 customers. In 2012, we expanded our offering to include data visualization and analytics capabilities, and in 2014, we launched OfficeConnect, which provides companies with the ability to automate reporting through Microsoft Office products. In 2017, we were recognized as a Leader in the Gartner Magic Quadrant for Cloud Strategic Corporate Performance Management Solutions for the second consecutive year. We launched our Sales Planning product in early 2018 to extend the benefits of our platform to the sales organization. Additionally, we are positioned as a Leader by Forrester in its most recent Wave on this topic, the 2016 Forrester Enterprise Performance Management (EPM) Wave Report.
55
Table of Contents
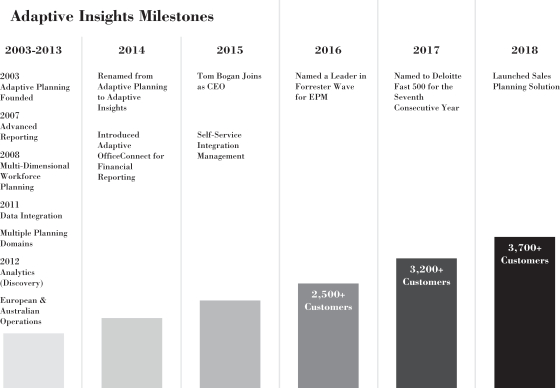
Customer numbers in the bar chart are as of January 31 for a given year.
As of April 30, 2018, we had more than 3,800 customers in over 50 countries.
Our flexible and scalable platform enables the entire planning process across an organization. We target our sales and marketing efforts towards finance and sales leaders, across all market segments, with an increasing focus on mid-market and enterprise organizations. We define the enterprise market as organizations with more than 2,000 employees, the mid-market as organizations with 250–2,000 employees, and the small and medium-sized business, or SMB, market as organizations with fewer than 250 employees. In fiscal 2018, enterprise customers accounted for 23% of total revenues, mid-market customers accounted for 43% of total revenues, and SMB customers accounted for 34% of total revenues. No single end customer represented more than 1% of our total revenues in fiscal 2016, 2017 or 2018, and the aggregate total revenues from our 10 largest end customers was approximately 4%, 5% and 3% of our total revenues in fiscal 2016, 2017 and 2018, respectively.
We offer solutions built on our Business Planning Cloud platform, which consist of Adaptive Insights for Finance and Adaptive Insights for Sales. While most of our customers begin with Adaptive Insights for Finance, our financial planning solution, many of them also use our platform to create custom models and solutions for other areas of their business (flexible modeling). We released Adaptive Insights for Sales in February 2018 based on this experience, and we plan to create new solutions targeted to additional use cases.
In fiscal 2018, we derived approximately 88% of our total revenues from subscriptions and approximately 12% of our total revenues from services. The majority of our subscription revenues is sold through one-year non-cancellable agreements and is invoiced up front. Multi-year subscriptions are either invoiced up front or in annual installments. We price our subscriptions based on several factors, primarily the market segment of the customer, the number of solutions included in the subscription, and the number of users having access to each of the solutions. Subscription revenues are recognized ratably over the term of the agreement. We record amounts invoiced for portions of subscription periods that have not occurred or for services that have not been performed as deferred revenues on our balance sheet.
56
Table of Contents
Services consist of implementation and consulting services, which we refer to as professional services, as well as training services. Our implementation services help customers implement our platform for quicker time to value. We also provide consulting services to help customers optimize the use of our platform.
We sell our solutions through our direct sales force and our partner network. Our direct sales force leverages our relationships with our technology vendor and professional service ecosystem to expand our sales and marketing reach. We have separate sales teams dedicated to each of the markets we serve. We also focus on expanding the number of use cases and users within our customers’ organizations and up-selling additional features and options. We also continue to invest in our partner network to market and sell our solutions. For fiscal 2018, we generated 37% of our total revenues through our partner network.
We have experienced significant revenue growth and adoption of our platform in recent periods. For our fiscal years ended January 31, 2016, 2017 and 2018, our total revenues were $61.7 million, $81.8 million and $106.5 million, respectively. For the three months ended April 30, 2017 and 2018, our total revenues were $24.2 million and $32.1 million, respectively. For our fiscal years ended January 31, 2016, 2017 and 2018, our subscription revenues were $49.4 million, $69.7 million and $93.9 million, respectively. For the three months ended April 30, 2017 and 2018, our subscription revenues were $21.2 million and $28.3 million, respectively. Our net losses were $59.1 million, $44.7 million and $42.7 million for the fiscal years ended January 31, 2016, 2017 and 2018, respectively. Our net losses were $10.0 million and $11.0 million for the three months ended April 30, 2017 and 2018, respectively.
Factors Affecting Future Performance
We believe that our future performance will depend on many factors, including those described below. While these areas present significant opportunity, they also present risks that we must manage to achieve successful results. See the section titled “Risk Factors.” If we are unable to address these challenges, our business and operating results could be adversely affected.
Market Adoption of our Platform. A key focus of our sales and marketing efforts is creating market awareness about the benefits and adoption of our platform. To date, we have primarily marketed our platform to users in the finance function of our customers’ organizations. We believe there is a significant opportunity for us to penetrate other areas within an organization, such as sales, marketing and operations. Many potential customers still use legacy tools, spreadsheets, and manual processes. While we believe we have a significant market opportunity that our platform addresses, it is difficult to predict customer adoption rates and demand or the future growth rate and size of the market for our solutions. We will need to continue to invest in sales and marketing in order to address this opportunity.
Innovation and Expansion of our Solutions. We intend to invest in growing our research and development team to extend the functionality of our solutions to bring new solutions to market. For example, we have recently announced Adaptive Insights for Sales, which expands our platform to users in sales functions of organizations. We intend to continue to develop solutions for users in other functions across the organization. We also intend to continue to develop a specialized go-to-market strategy for certain verticals, including a focus on business services and biotechnology, in fiscal 2019. To be successful in expanding into these verticals, we need to expend additional resources to provide customers with solutions that meet their specific needs.
International Expansion. International revenues represented approximately 25% of our total revenues in fiscal 2018, and we will need to further expand our international presence in order to address our market opportunity. We believe there is significant opportunity to further expand the use of our solutions internationally, particularly in Europe and Japan. The expansion of our existing international operations and entry into additional international markets require significant upfront investment and management attention and additional resources over the long term, which may not result in significant additional revenues to us and will subject us to regulatory, economic and political risks that are different from those in the United States.
57
Table of Contents
Investment in Sales and Marketing. We have made significant investments in growing our sales and marketing and our customer success teams to acquire new customers with broader use cases, increase sales to existing customers through our account management team, and target larger organizations through our enterprise sales team. We have also recently increased our investments in sales and marketing efforts to enterprise customers. We expect that we will continue to invest in these areas because we believe that we have a significant opportunity to sell our platform to organizations of all sizes, particularly those in the mid-market and enterprise market.
While we believe that these investments will contribute to our long-term growth, they will have an adverse impact on our profitability in the near term, unless and until we begin to realize the return on these investments with significant growth in our number of customers, the dollar size of our subscriptions with existing customers and the number of larger enterprise customers.
Termination of NetSuite Reseller Agreement
In July 2009, we entered into a reseller agreement with NetSuite, Inc., pursuant to which NetSuite was the exclusive reseller of our solutions and services to their customers. Under the reseller agreement, NetSuite sold our software solutions directly to Oracle/NetSuite customers. In exchange, we generally received 50% of the contract value for subscriptions sold through NetSuite for new and renewing customers which we recognized as revenues. For fiscal 2016, 2017 and 2018, revenues from NetSuite represented approximately 11%, 9% and 5% of our total revenues, respectively.
In October 2016, Oracle acquired NetSuite and we terminated the reseller agreement effective February 28, 2017. At the date of the termination, we had 760 active customers that had been acquired through the NetSuite agreement. Beginning March 1, 2017, all contract renewals for our solutions with Oracle/NetSuite customers have been contracted directly with us. We continue to work with Oracle to support such customers that continue to be under contract with Oracle, and we remain an Oracle Partner through the SuiteCloud Developer Network Program.
For all renewals closed after February 28, 2017, we negotiate directly with the customer and recognize 100% of the contract value as revenues. Under the terms of our agreement with Oracle, for renewal orders closed with Oracle/NetSuite customers between March 1, 2017 and February 28, 2018, we paid Oracle a commission fee of 45% of the first year’s subscription amount. We do not owe Oracle any fees for renewals after February 28, 2018. For those customers with expiring contracts in fiscal 2018, we renewed a higher percentage of the total annual contract value as compared to the total annual contract value renewed by Oracle/NetSuite in the prior fiscal year through the NetSuite reseller agreement.
Key Metrics
We regularly review a number of metrics, including the following key metrics, to evaluate our business, measure our performance, identify trends affecting our business, formulate financial projections, and make strategic decisions.
Number of Customers. We believe that our ability to expand our customer base is an indicator of our market penetration and the growth of our business. We define the number of customers at the end of any particular period as the number of customers with signed subscription agreements for subscriptions with service periods that run through the current or future periods. In situations where an organization has multiple subsidiaries or divisions, each entity that is invoiced as a separate entity is treated as a separate customer. In cases where our customers have subscriptions to our platform obtained through resellers or other distributors, each end customer is counted separately.
| January 31, | April 30, | |||||||||||||||
| 2016 | 2017 | 2018 | 2018 | |||||||||||||
| Number of customers (as of end of period) |
2,587 | 3,208 | 3,740 | 3,868 | ||||||||||||
58
Table of Contents
Average Subscription Revenues per Customer. We believe that our ability to grow our average subscription revenues per customer is an indicator of increasing users, increasing use cases, and increasing average selling prices. We define average subscription revenues per customer as the total subscription revenues for the trailing 12-month period divided by the average number of customers over the measurement period. Our average subscription revenues per customer has increased due to increasing users, increasing use cases, and increasing average selling prices. For the three months ended April 30, 2018, our average subscription revenues per customer was $28 thousand, a year-over-year increase of 13%.
| Year Ended January 31, | Three Months Ended April 30, 2018 |
|||||||||||||||
| 2016 | 2017 | 2018 | ||||||||||||||
| Average subscription revenues per customer (in thousands) |
$ | 20.8 | $ | 24.1 | $ | 27.0 | $ | 28.0 | ||||||||
Dollar-Based Net Retention Rate. We believe that dollar-based net retention rate is an important metric to measure the long-term value of customer agreements and our ability to retain and grow our relationships with existing customers over time. We calculate dollar-based net retention rate as (x) the annual recurring revenues under contract at the end of a period for the base set of customers from the year prior to the calculation divided by (y) the annual recurring revenues under contract one year prior to the date of calculation for that same customer base. We define annual recurring revenues under contract as the total amount of subscription revenues contractually committed to under each of our customer agreements over the term of the agreement, divided by the number of years in the term of the agreement. Our dollar-based net retention rate increases primarily when the number of users or solutions within an organization increases. Conversely, our dollar-based net retention rate decreases primarily when customers reduce the number of users or solutions, or cease usage of our platform. For the purposes of calculating our dollar-based net retention rate for periods after the termination of our NetSuite reseller agreement, we have adjusted the annual recurring revenues under contract for NetSuite customers to reflect the fact that we now recognize as revenue 100% of the annual contract value upon renewal, compared to 50% while the NetSuite reseller agreement was in effect. This as-adjusted number is reflected below, and results in a lower dollar-based net retention rate for this period than would be calculated on an unadjusted basis, in order to provide a comparable measurement for the periods prior to, and after, the termination of the NetSuite reseller agreement.
| January 31, | ||||||||||||
| 2016 | 2017 | 2018 | ||||||||||
| Dollar-based net retention rate |
103 | % | 102 | % | 98 | % | ||||||
Customer Lifetime Value and Acquisition Cost
Our business model focuses on attracting new customers and maximizing their lifetime value to us. Due to our subscription model, we recognize subscription revenues ratably over the term of the subscription period. As a result, the profitability of a customer to our business depends in part upon how long a customer has been a subscriber on our platform. We estimate that, for fiscal 2018, the calculated lifetime value of our customers was 3.8 times the associated cost of acquiring them. We calculate the lifetime value of our customers and associated customer acquisition costs for a particular year by dividing (x) the product of the subscription gross margin in the current year multiplied by the difference between the net new subscription revenues for the current year compared to the prior year multiplied by the inverse of the estimated dollar-based gross retention rate for the current year by (y) the average sales and marketing expense incurred in the current and preceding year. For fiscal 2018, our dollar-based gross retention rate was 93%, which we define as the amount of annual recurring revenues renewed in a given period, not including upsell, divided by the amount of total annual recurring revenues up for renewal in that period.
In addition, in order to achieve our plans for the growth of our business, we must continue to improve the efficiency of our sales process. We measure our progress by tracking our cost efficiency for the acquisition of new subscription revenues and the retention of existing customers, and we use this information in the
59
Table of Contents
management of our business. We categorize our sales and marketing spend as: (a) expenses related to the acquisition of new subscription revenues and (b) expenses related to the renewal of existing customers. We capture these expenses in separate cost centers within our accounting system. We define our acquisition efficiency ratio as (x) the average sales and marketing expense incurred in the current and preceding year to acquire new subscription revenues, divided by (y) the annual value of the subscription revenues of the contracts acquired in the current year. We have improved our acquisition efficiency ratio over time. For fiscal 2018, our acquisition efficiency ratio was 1.9, compared to 2.3 in fiscal 2017 and 2.5 in fiscal 2016. We also measure our renewal efficiency ratio, which we define as (x) the average sales and marketing expense to renew customers in the current and preceding year, divided by (y) the annual value of the subscription revenues of the contracts renewed in the current year. For fiscal 2018, our renewal efficiency ratio was 0.11, compared to 0.11 in fiscal 2017 and 0.10 in fiscal 2016.
The calculations described above are not intended to be a measure of profitability and are not prepared on a GAAP basis. You should not consider these metrics in isolation or as a substitute for an analysis of our results under GAAP. For purposes of these calculations, we have excluded stock-based compensation expense and the non-recurring commissions related to the termination of the NetSuite reseller agreement from sales and marketing expenses. We have also excluded the impact on subscription revenues and subscription gross margin resulting from the one-time uplift in annual contract value from renewing NetSuite customers.
Key Components of our Results of Operations
Revenues
Subscription. Customers pay annual or multi-year subscription fees for the right to access our cloud-based software platform. Customers do not have the right to take possession of the cloud-based software platform at any time. We also offer downloadable software components with additional functionality that are installed on customers’ servers. Subscription fees are based on a number of factors, primarily the size of the customer, the number of solutions and features to which the customer is subscribing, and the number of users having access to the solution. We initially record the subscription fees as deferred revenues and recognize subscription revenues on a straight-line basis over the term of the agreement. At any time during the subscription period, customers may increase their number of users and add solutions. Additional fees are payable for the remainder of the initial or renewed contract term.
Professional Services and Other. We offer our customers assistance in implementing and optimizing the use of our platform, as well as providing our customers with training on the use of our solutions. Although our software platform is ready to use immediately after a new customer has access to it, customers can use our professional services to assist with implementation for a fixed fee or on a time and materials basis, and we recognize revenues for these services over the period such services are performed.
We expect our professional services and other revenues may vary from period to period based on, among other things, the timing associated with the delivery of professional services and the impact of significant transactions.
For a description of our revenue accounting policies, see “—Critical Accounting Policies and Estimates.”
Cost of Revenues
Subscription Cost of Revenues. Subscription cost of revenues primarily consists of costs related to the hosting of our platform and supporting our customers. These costs include third-party cloud hosting costs, costs directly associated with our cloud infrastructure and operations, including amortization of acquired developed technology costs and internally developed software, personnel-related costs of our customer support organization, including salaries, bonuses, benefits, and stock-based compensation. We also include in subscription cost of revenues allocated overhead associated with facilities and information technology. We expect our cost of subscription revenues to increase in absolute dollars as our subscription revenues increase.
60
Table of Contents
Professional Services and Other Costs of Revenues. Costs associated with providing professional services primarily consist of personnel costs directly associated with deployment of our solution and delivery of training, including salaries, benefits, bonuses, and stock-based compensation, travel costs, and allocated overhead, as well as the cost of subcontractors. These costs are expensed as incurred. We expect our cost of services revenues to increase in absolute dollars as our services revenues increase.
Gross Profit and Gross Margin
Gross Profit and Gross Margin. We expect our subscription gross margin to decline modestly in the near term as we invest in our cloud infrastructure, although it may fluctuate from period to period depending on the interplay of factors discussed above.
Professional services and other gross margin, or professional services revenues less cost of professional services revenues, expressed as a percentage of professional services revenues, can fluctuate based on a number of factors, including timing of service delivery, the level of our investment in our professional services organization and the use of partners to provide professional services. The primary focus of our professional services business will continue to be providing high-quality customer deployments that allow customers to realize rapid value from our solutions and become long-term, loyal customers. In the future, we may choose to invest in our professional services organization at a pace faster than professional services revenue growth, in which case we may experience a decline in professional services gross margin. We expect professional services gross margin to modestly improve over the long term, although it may fluctuate from period to period depending on the interplay of factors discussed above.
We expect total gross margin to increase modestly over the long term as our subscription revenues increase as a percentage of total revenues, as we realize operational efficiencies in our hosting infrastructure, and as we continue to leverage our partners to help us provide professional services, although total gross margin may fluctuate from period to period depending on the interplay of the factors discussed above.
Operating Expenses
Sales and Marketing. Sales and marketing expenses consist primarily of personnel costs of our sales and marketing employees, including salaries, sales commissions and incentives, benefits, bonuses and stock-based compensation, travel and related costs, marketing programs, costs of our annual user conference (Adaptive Live), advertising and trade shows, other event expenses, channel partner-related commission costs as well as allocated overhead costs. We currently expense sales commissions and channel partner commissions as incurred. Upon adoption of ASC 606 in fiscal 2020, we will amortize these expenses over an estimated customer life for the initial acquisition of a contract and over the contractual term for renewal contracts. We expect sales and marketing expenses to increase as we expand our direct sales teams and increase sales through our strategic partnerships and resellers.
Research and Development. Research and development expenses consist primarily of salaries, benefits, bonuses, and stock-based compensation associated with our engineering, product development, and quality assurance personnel. Research and development expenses also include third-party contractors and suppliers and allocated overhead. Other than internal-use software development costs that qualify for capitalization, research and development costs are expensed as incurred. We expect research and development costs to increase as we develop new solutions and make improvements to our platform.
General and Administrative. General and administrative expenses consist primarily of salaries, benefits, bonuses, and stock-based compensation associated with our executive, finance, legal, human resources, and other administrative personnel, as well as accounting, auditing and legal professional services fees, recruitment costs, other corporate-related expenses, and allocated overhead costs. We expect that general and administrative expenses will increase as we incur the costs of compliance associated with being a publicly-traded company, including legal, audit, and consulting fees.
61
Table of Contents
Other Expense (Income), Net
Other expense (income), net consists primarily of interest expense from borrowings under our credit facility and loan facility, changes in the fair value of the common stock warrant liability and foreign currency exchange fluctuations.
Provision for Income Taxes
We are subject to federal and state income taxes in the United States and taxes in foreign jurisdictions. As we have expanded our international operations, we have incurred increased foreign tax expense, and we expect this to continue. We have a full valuation allowance for net deferred tax assets, including net operating loss carryforwards, and tax credits related primarily to research and development for our operations in the United States. We expect to maintain this full valuation allowance for the foreseeable future. As of January 31, 2018, we had federal and state net operating loss carryforwards of $379.0 million. The federal and state net operating loss carryforwards will begin to expire, if not utilized, beginning in 2023. These net operating loss carryforwards could expire unused and be unavailable to offset future income tax liabilities. In connection with this offering, it is possible that we may experience an ownership change limitation. We may also experience ownership changes in the future as a result of subsequent shifts in our stock ownership, some of which may be outside of our control. If an ownership change occurs and our ability to use our net operating loss carryforwards is materially limited, it would harm our future operating results by effectively increasing our future tax obligations.
Results of Operations
The following table sets forth our consolidated statements of operations for each of the years indicated in dollars (in thousands).
| Year Ended January 31, |
Three Months Ended April 30, |
|||||||||||||||||||
| 2016 | 2017 | 2018 | 2017 | 2018 | ||||||||||||||||
| Revenues: |
||||||||||||||||||||
| Subscription |
$ | 49,365 | $ | 69,696 | $ | 93,888 | $ | 21,220 | $ | 28,290 | ||||||||||
| Professional services and other |
12,341 | 12,095 | 12,620 | 2,995 | 3,761 | |||||||||||||||
|
|
|
|
|
|
|
|
|
|
|
|||||||||||
| Total revenues |
61,706 | 81,791 | 106,508 | 24,215 | 32,051 | |||||||||||||||
|
|
|
|
|
|
|
|
|
|
|
|||||||||||
| Cost of revenues: |
||||||||||||||||||||
| Subscription |
9,104 | 11,628 | 14,684 | 3,526 | 4,240 | |||||||||||||||
| Professional services and other |
13,623 | 13,236 | 13,209 | 3,173 | 3,943 | |||||||||||||||
|
|
|
|
|
|
|
|
|
|
|
|||||||||||
| Total cost of revenues |
22,727 | 24,864 | 27,893 | 6,699 | 8,183 | |||||||||||||||
|
|
|
|
|
|
|
|
|
|
|
|||||||||||
| Gross profit |
38,979 | 56,927 | 78,615 | 17,516 | 23,868 | |||||||||||||||
|
|
|
|
|
|
|
|
|
|
|
|||||||||||
| Operating expenses |
||||||||||||||||||||
| Sales and marketing |
62,463 | 64,417 | 77,903 | 17,805 | 19,746 | |||||||||||||||
| Research and development |
22,024 | 23,514 | 24,342 | 5,768 | 6,876 | |||||||||||||||
| General and administrative |
12,718 | 13,669 | 16,993 | 3,753 | 6,124 | |||||||||||||||
|
|
|
|
|
|
|
|
|
|
|
|||||||||||
| Total operating expenses |
97,205 | 101,600 | 119,238 | 27,326 | 32,746 | |||||||||||||||
|
|
|
|
|
|
|
|
|
|
|
|||||||||||
| Loss from operations |
(58,226 | ) | (44,673 | ) | (40,623 | ) | (9,810 | ) | (8,878 | ) | ||||||||||
| Other expense (income), net |
596 | (100 | ) | 1,796 | 146 | 2,092 | ||||||||||||||
|
|
|
|
|
|
|
|
|
|
|
|||||||||||
| Loss before provision for income taxes |
(58,822 | ) | (44,573 | ) | (42,419 | ) | (9,956 | ) | (10,970 | ) | ||||||||||
| Provision for income taxes |
316 | 147 | 254 | 42 | 76 | |||||||||||||||
|
|
|
|
|
|
|
|
|
|
|
|||||||||||
| Net loss |
$ | (59,138 | ) | $ | (44,720 | ) | $ | (42,673 | ) | $ | (9,998 | ) | $ | (11,046 | ) | |||||
|
|
|
|
|
|
|
|
|
|
|
|||||||||||
62
Table of Contents
The following table sets forth our consolidated statements of operations for each of the years as a percentage of total revenues.
| Year Ended January 31, | Three Months Ended April 30, |
|||||||||||||||||||
| 2016 | 2017 | 2018 | 2017 | 2018 | ||||||||||||||||
| Revenues: |
||||||||||||||||||||
| Subscription |
80 | % | 85 | % | 88 | % | 88 | % | 88 | % | ||||||||||
| Professional services and other |
20 | 15 | 12 | 12 | 12 | |||||||||||||||
|
|
|
|
|
|
|
|
|
|
|
|||||||||||
| Total revenues |
100 | 100 | 100 | 100 | 100 | |||||||||||||||
|
|
|
|
|
|
|
|
|
|
|
|||||||||||
| Cost of revenues: |
||||||||||||||||||||
| Subscription |
15 | 14 | 14 | 15 | 13 | |||||||||||||||
| Professional services and other |
22 | 16 | 12 | 13 | 13 | |||||||||||||||
|
|
|
|
|
|
|
|
|
|
|
|||||||||||
| Total cost of revenues |
37 | 30 | 26 | 28 | 26 | |||||||||||||||
|
|
|
|
|
|
|
|
|
|
|
|||||||||||
| Gross profit |
63 | 70 | 74 | 72 | 74 | |||||||||||||||
|
|
|
|
|
|
|
|
|
|
|
|||||||||||
| Operating expenses |
||||||||||||||||||||
| Sales and marketing |
101 | 79 | 73 | 74 | 62 | |||||||||||||||
| Research and development |
36 | 29 | 23 | 24 | 21 | |||||||||||||||
| General and administrative |
21 | 17 | 16 | 15 | 19 | |||||||||||||||
|
|
|
|
|
|
|
|
|
|
|
|||||||||||
| Total operating expenses |
158 | 125 | 112 | 113 | 102 | |||||||||||||||
|
|
|
|
|
|
|
|
|
|
|
|||||||||||
| Loss from operations |
(95 | ) | (55 | ) | (38 | ) | (41 | ) | (28 | ) | ||||||||||
| Other expense (income), net |
1 | (1 | ) | 2 | 1 | 7 | ||||||||||||||
|
|
|
|
|
|
|
|
|
|
|
|||||||||||
| Loss before provision for income taxes |
(96 | ) | (54 | ) | (40 | ) | (42 | ) | (35 | ) | ||||||||||
| Provision for income taxes |
1 | — | — | — | — | |||||||||||||||
|
|
|
|
|
|
|
|
|
|
|
|||||||||||
| Net loss |
(97 | )% | (54 | )% | (40 | )% | (42 | )% | (35 | )% | ||||||||||
|
|
|
|
|
|
|
|
|
|
|
|||||||||||
Comparison of Three Months Ended April 30, 2017 and 2018
Total Revenues
| Three Months Ended April 30, |
Change | |||||||||||||||
| 2017 | 2018 | Amount | % | |||||||||||||
| (in thousands, except percentages) | ||||||||||||||||
| Subscription |
$ | 21,220 | $ | 28,290 | $ | 7,070 | 33 | % | ||||||||
| Professional services and other |
2,995 | 3,761 | 766 | 26 | ||||||||||||
|
|
|
|
|
|
|
|
|
|||||||||
| Total revenues |
$ | 24,215 | $ | 32,051 | $ | 7,836 | 32 | % | ||||||||
|
|
|
|
|
|
|
|
|
|||||||||
Total revenues increased due to sales of subscriptions to new customers and the expanded use of our platform by existing customers. Since April 30, 2017, we added 536 net new customers, which substantially contributed to the increase in subscription revenues in the three months ended April 30, 2018 as compared to the three months ended April 30, 2017.
Revenues from professional services and other increased slightly due to higher billable hours as a result of increased headcount and increased use of partners to supplement internal staff in deploying solutions.
63
Table of Contents
Total Cost of Revenues
| Three Months Ended April 30, |
Change | |||||||||||||||
| 2017 | 2018 | Amount | % | |||||||||||||
| (in thousands, except percentages) | ||||||||||||||||
| Subscription |
$ | 3,526 | $ | 4,240 | $ | 714 | 20 | % | ||||||||
| Professional services and other |
3,173 | 3,943 | 770 | 24 | ||||||||||||
|
|
|
|
|
|
|
|
|
|||||||||
| Total cost of revenues |
$ | 6,699 | $ | 8,183 | $ | 1,484 | 22 | % | ||||||||
|
|
|
|
|
|
|
|
|
|||||||||
| Subscription gross margin |
83 | % | 85 | % | ||||||||||||
| Professional services and other gross margin |
(6 | )% | (5 | )% | ||||||||||||
| Total gross margin |
72 | % | 74 | % | ||||||||||||
The year-over-year improvement in total gross margin resulted from an increase in both subscription gross margin and professional services and other gross margin. Subscription gross margin increased due to increased subscription revenues, whereas certain key components of cost of revenues, such as hosting costs, are fixed to a certain extent. Professional services and other gross margin increased due to increased use of partners to supplement internal staff in deploying solutions.
Total cost of revenues increased primarily due to a $0.8 million increase in compensation costs due to increased headcount and higher bonus payout, a $0.2 million increase in hosting costs from an expanded customer base, and a $0.3 million increase in partner-related costs to supplement internal staff in deploying solutions.
Sales and Marketing
| Three Months Ended April 30, |
Change | |||||||||||||||
| 2017 | 2018 | Amount | % | |||||||||||||
| (in thousands, except percentages) | ||||||||||||||||
| Sales and marketing |
$ | 17,805 | $ | 19,746 | $ | 1,941 | 11 | % | ||||||||
| Percentage of total revenues |
74 | % | 62 | % | ||||||||||||
Sales and marketing expense increased primarily due to an increase of $1.6 million in compensation related expenses resulting from increased headcount and expenses of $0.6 million related to our annual sales kick-off event, which previously took place in the fourth quarter of fiscal 2017 versus the first quarter of fiscal 2019. In addition, marketing expenses increased $0.3 million primarily due to an increase in brand awareness campaigns. These increases were offset slightly by a decrease of $0.6 million in commission costs paid to Oracle. Under the terms of our agreement with Oracle, for renewal subscriptions closed with Oracle/NetSuite customers between March 1, 2017 and February 28, 2018, we paid Oracle a commission fee of 45% of the first year’s subscription amount. We do not owe Oracle any fees for such renewal subscriptions after February 28, 2018.
Research and Development
| Three Months Ended April 30, |
Change | |||||||||||||||
| 2017 | 2018 | Amount | % | |||||||||||||
| (in thousands, except percentages) | ||||||||||||||||
| Research and development |
$ | 5,768 | $ | 6,876 | $ | 1,108 | 19 | % | ||||||||
| Percentage of total revenues |
24 | % | 21 | % | ||||||||||||
64
Table of Contents
Research and development expense increased primarily due to a $1.2 million increase in compensation costs as a result of increased headcount and higher bonus expense, partially offset by a $0.2 million increase in internal costs capitalized as a result of the development of significant software features.
General and Administrative
| Three Months Ended April 30, |
Change | |||||||||||||||
| 2017 | 2018 | Amount | % | |||||||||||||
| (in thousands, except percentages) | ||||||||||||||||
| General and administrative |
$ | 3,753 | $ | 6,124 | $ | 2,371 | 63 | % | ||||||||
| Percentage of total revenues |
15 | % | 19 | % | ||||||||||||
General and administrative expense increased due to a $1.0 million increase in compensation costs and higher bonus expense and a $1.4 million increase in legal, accounting and consulting costs primarily associated with preparing to be a public company as well as compliance costs.
Other Expense (Income), Net
| Three Months Ended April 30, |
Change | |||||||||||||||
| 2017 | 2018 | Amount | % | |||||||||||||
| (in thousands, except percentages) | ||||||||||||||||
| Other expense (income), net |
$ | 146 | $ | 2,092 | $ | 1,946 | 1,333 | % | ||||||||
Other expense (income), net increased primarily due to $1.2 million of net interest expense as a result of new debt financing arrangements entered into in June 2017 and March 2018, $0.3 million change in the fair value of warrants, and $0.4 million of unfavorable foreign currency fluctuations.
Provision for Income Taxes
| Three Months Ended April 30, |
Change | |||||||||||||||
| 2017 | 2018 | Amount | % | |||||||||||||
| (in thousands, except percentages) | ||||||||||||||||
| Provision for income taxes |
$ | 42 | $ | 76 | $ | 34 | 81 | % | ||||||||
Our provision for income taxes for each period was primarily attributable to foreign taxes incurred by certain non-U.S. subsidiaries and foreign withholding taxes. The increase in provision for income taxes was primarily due to an increase in net taxable income in foreign subsidiaries.
Comparison of Fiscal 2017 and 2018
Total Revenues
| Year Ended January 31, |
Change | |||||||||||||||
| 2017 | 2018 | Amount | % | |||||||||||||
| (in thousands, except percentages) | ||||||||||||||||
| Subscription |
$ | 69,696 | $ | 93,888 | $ | 24,192 | 35 | % | ||||||||
| Professional services and other |
12,095 | 12,620 | 525 | 4 | % | |||||||||||
|
|
|
|
|
|
|
|
|
|||||||||
| Total revenues |
$ | 81,791 | $ | 106,508 | $ | 24,717 | 30 | % | ||||||||
|
|
|
|
|
|
|
|
|
|||||||||
65
Table of Contents
Total revenues increased due to sales of subscriptions to new customers and the expanded use of our platform by existing customers. Of the $24.2 million increase in subscription revenues, 74% was attributable to sales to new customers and 26% was attributable to sales to existing customers. Additionally, after Oracle’s acquisition of NetSuite, we terminated the reseller agreement with NetSuite, effective February 28, 2017. Prior to the termination, we generally received 50% of the contract value for subscriptions sold through NetSuite to new and renewing customers, which we recognized as subscription revenues. For renewals that closed after February 28, 2017, we negotiated directly with these customers and recognized or will recognize 100% of the contract value as revenues. For fiscal 2018, renewals from these customers that previously subscribed to our solutions through NetSuite increased our subscription revenues by $2.2 million, our subscription growth rate by 3.2% and our total revenues growth rate by 2.7% relative to the growth rates that would have been obtained without the increase in the percentage of contract value recognized by us.
Revenues from professional services and other increased slightly due to higher billable hours as a result of increased use of partners to supplement internal staff in deploying solutions.
International revenues represented approximately 25% of our total revenues in fiscal 2018.
Total Cost of Revenues
| Year Ended January 31, |
Change | |||||||||||||||
| 2017 | 2018 | Amount | % | |||||||||||||
| (in thousands, except percentages) | ||||||||||||||||
| Subscription |
$ | 11,628 | $ | 14,684 | $ | 3,056 | 26 | % | ||||||||
| Professional services and other |
13,236 | 13,209 | (27 | ) | 0 | % | ||||||||||
|
|
|
|
|
|
|
|
|
|||||||||
| Total cost of revenues |
$ | 24,864 | $ | 27,893 | $ | 3,029 | 12 | % | ||||||||
|
|
|
|
|
|
|
|
|
|||||||||
| Subscription gross margin |
83 | % | 84 | % | ||||||||||||
| Professional services and other gross margin |
(9 | )% | (5 | )% | ||||||||||||
| Total gross margin |
70 | % | 74 | % | ||||||||||||
The year-over-year improvement in total gross margin was primarily the result of an improvement in professional services and other gross margin which is due to increased use of partners to supplement internal staff in deploying solutions.
Subscription gross margin increased due to increased subscription revenues. Certain key components of cost of revenues, such as hosting costs, are fixed to a certain extent, which also improved subscription gross margin.
Total cost of revenues increased primarily due to a $0.9 million increase in compensation costs due to higher bonus payout, a $1.5 million increase in hosting and support cost from an expanded customer base, and a $0.6 million increase in amortization of capitalized software.
Sales and Marketing
| Year Ended January 31, |
Change | |||||||||||||||
| 2017 | 2018 | Amount | % | |||||||||||||
| (in thousands, except percentages) | ||||||||||||||||
| Sales and marketing |
$ | 64,417 | $ | 77,903 | $ | 13,486 | 21 | % | ||||||||
| Percentage of total revenues |
79 | % | 73 | % | ||||||||||||
Sales and marketing expense increased primarily due to a $4.7 million increase in commission due to increased sales, a $4.0 million increase in commission fees paid to Oracle for renewal orders closed directly by
66
Table of Contents
us with Oracle/NetSuite customers, a $2.5 million increase in salary expense due to headcount growth, and $2.3 million increase in bonus and other compensation expenses driven by an increase in headcount and higher bonus payout.
Research and Development
| Year Ended January 31, |
Change | |||||||||||||||
| 2017 | 2018 | Amount | % | |||||||||||||
| (in thousands, except percentages) | ||||||||||||||||
| Research and development |
$ | 23,514 | $ | 24,342 | $ | 828 | 4 | % | ||||||||
| Percentage of total revenues |
29 | % | 23 | % | ||||||||||||
Research and development expense increased primarily due to a $2.0 million increase in compensation costs as a result of increased headcount and higher bonus payout, partially offset by a $1.2 million increase in capitalized software cost due to development of significant software features in fiscal 2018.
General and Administrative
| Year Ended January 31, |
Change | |||||||||||||||
| 2017 | 2018 | Amount | % | |||||||||||||
| (in thousands, except percentages) | ||||||||||||||||
| General and administrative |
$ | 13,669 | $ | 16,993 | $ | 3,324 | 24 | % | ||||||||
| Percentage of total revenues |
17 | % | 16 | % | ||||||||||||
General and administrative expense increased primarily due to a $2.0 million increase in compensation costs and higher bonus payout and a $1.5 million increase in legal, accounting and consulting costs associated with preparing to be a public company.
Other Expense (Income), Net
| Year Ended January 31, |
Change | |||||||||||||||
| 2017 | 2018 | Amount | % | |||||||||||||
| (in thousands, except percentages) | ||||||||||||||||
| Other Expense (Income), Net |
$ | (100 | ) | $ | 1,796 | $ | 1,896 | (1,896 | )% | |||||||
Other expense (income), net changed from an income of $0.1 million to expense of $1.8 million, primarily due to an additional $2.1 million of net interest expense as a result of new debt financing entered into in 2017, and $0.7 million change in the fair value of warrants, partially offset by $0.9 million of favorable foreign currency fluctuations.
Provision for Income Taxes
| Year Ended January 31, |
Change | |||||||||||||||
| 2017 | 2018 | Amount | % | |||||||||||||
| (in thousands, except percentages) | ||||||||||||||||
| Provision for income taxes |
$ | 147 | $ | 254 | $ | 107 | 73 | % | ||||||||
67
Table of Contents
Our provision for income taxes for each period was primarily attributable to foreign taxes incurred by certain non-U.S. subsidiaries and foreign withholding taxes. The increase in provision for income taxes was primarily due to an increase in net taxable income in foreign subsidiaries.
Comparison of Fiscal 2016 and 2017
Total Revenues
| Year Ended January 31, |
Change | |||||||||||||||
| 2016 | 2017 | Amount | % | |||||||||||||
| (in thousands, except percentages) | ||||||||||||||||
| Subscription |
$ | 49,365 | $ | 69,696 | $ | 20,331 | 41 | % | ||||||||
| Professional services and other |
12,341 | 12,095 | (246 | ) | (2 | )% | ||||||||||
|
|
|
|
|
|
|
|
|
|||||||||
| Total revenues |
$ | 61,706 | $ | 81,791 | $ | 20,085 | 33 | % | ||||||||
|
|
|
|
|
|
|
|
|
|||||||||
Total revenues increased year over year due to sales of subscriptions to new customers and the expanded use of our platform by existing customers. Of the $20.3 million increase in subscription revenues, 60% was attributable to sales to new customers and 40% was attributable to sales to existing customers. Revenues from professional services and other declined slightly due to lower billable hours as a result of lower average headcount year over year. International revenues represented approximately 25% of our total revenues in fiscal 2017.
Total Cost of Revenues
| Year Ended January 31, |
Change | |||||||||||||||
| 2016 | 2017 | Amount | % | |||||||||||||
| (in thousands, except percentages) | ||||||||||||||||
| Subscription |
$ | 9,104 | $ | 11,628 | $ | 2,524 | 28 | % | ||||||||
| Professional services and other |
13,623 | 13,236 | (387 | ) | (3 | )% | ||||||||||
|
|
|
|
|
|
|
|
|
|||||||||
| Total cost of revenues |
$ | 22,727 | $ | 24,864 | $ | 2,137 | 9 | % | ||||||||
|
|
|
|
|
|
|
|
|
|||||||||
| Subscription gross margin |
82 | % | 83 | % | ||||||||||||
| Professional services and other gross margin |
(10 | )% | (9 | )% | ||||||||||||
| Total gross margin |
63 | % | 70 | % | ||||||||||||
The year-over-year improvement in total gross margin was primarily the result of an increase in subscription revenues, which have a higher gross margin than that of professional services. Subscription gross margin increased due to increased subscription revenues. Certain key components of cost of revenues, such as hosting costs, are fixed to a certain extent, which resulted in an improvement in subscription gross margin.
Total cost of revenues increased $2.1 million primarily due to a $0.9 million increase in hosting costs to support additional data usage from expanded customer base and a $0.9 million increase in employee-related compensation and travel costs.
Professional services gross margin decreased slightly due to lower billable hours as a result of lower average headcount year over year.
68
Table of Contents
Sales and Marketing
| Year Ended January 31, |
Change | |||||||||||||||
| 2016 | 2017 | Amount | % | |||||||||||||
| (in thousands, except percentages) | ||||||||||||||||
| Sales and marketing |
$ | 62,463 | $ | 64,417 | $ | 1,954 | 3 | % | ||||||||
| Percentage of total revenues |
101 | % | 79 | % | ||||||||||||
Sales and marketing expense increased primarily due to a $0.8 million increase in commissions due to increased sales, a $0.7 million increase in travel and employee-related costs and a $0.5 million increase in employee compensation costs.
Research and Development
| Year Ended January 31, |
Change | |||||||||||||||
| 2016 | 2017 | Amount | % | |||||||||||||
| (in thousands, except percentages) | ||||||||||||||||
| Research and development |
$ | 22,024 | $ | 23,514 | $ | 1,490 | 7 | % | ||||||||
| Percentage of total revenues |
36 | % | 29 | % | ||||||||||||
Research and development expense increased primarily due to a $1.1 million increase in compensation costs.
General and Administrative
| Year Ended January 31, |
Change | |||||||||||||||
| 2016 | 2017 | Amount | % | |||||||||||||
| (in thousands, except percentages) | ||||||||||||||||
| General and administrative |
$ | 12,718 | $ | 13,669 | $ | 951 | 7 | % | ||||||||
| Percentage of total revenues |
21 | % | 17 | % | ||||||||||||
General and administrative expense increased primarily due to a $0.5 million increase in compensation costs. In addition, there was a $0.3 million increase in professional services for legal and accounting services.
Other (Income) Expense, Net
| Year Ended January 31, |
Change | |||||||||||||||
| 2016 | 2017 | Amount | % | |||||||||||||
| (in thousands, except percentages) | ||||||||||||||||
| Other (income) expense, net |
$ | 596 | $ | (100 | ) | $ | (696 | ) | (117 | )% | ||||||
Other (income) expense, net changed from an expense of $0.6 million to income of $0.1 million, primarily due to foreign currency fluctuations.
Provision for Income Taxes
| Year Ended January 31, |
Change | |||||||||||||||
| 2016 | 2017 | Amount | % | |||||||||||||
| (in thousands, except percentages) | ||||||||||||||||
| Provision for income taxes |
$ | 316 | $ | 147 | $ | (169 | ) | (53 | )% | |||||||
69
Table of Contents
Our provision for income taxes for each period was primarily attributable to foreign taxes incurred by certain non-U.S. subsidiaries and foreign withholding taxes. The decrease in provision for income taxes was primarily due to a decrease in tax provision for one of our subsidiaries as a result of foreign exchange loss on foreign-denominated cash balance.
Quarterly Results of Operations
The following table sets forth our unaudited quarterly statements of operations data for each of the quarters indicated. The unaudited quarterly statements of operations data set forth below have been prepared on the same basis as our audited consolidated financial statements and, in the opinion of management, reflect all adjustments, consisting only of normal recurring adjustments, that are necessary for the fair statement of such data. Our historical results are not necessarily indicative of the results that may be expected in the future, and the results for any quarter are not necessarily indicative of results to be expected for a full fiscal year or any other period. The following quarterly financial data should be read in conjunction with our consolidated financial statements and the related notes included elsewhere in this prospectus.
| Three Months Ended | ||||||||||||||||||||||||
| January 31, 2017 |
April 30, 2017 |
July 31, 2017 |
October 31, 2017 |
January 31, 2018 |
April 30, 2018 |
|||||||||||||||||||
| (in thousands) | ||||||||||||||||||||||||
| Revenues: |
||||||||||||||||||||||||
| Subscription |
$ | 18,959 | $ | 21,220 | $ | 22,373 | $ | 24,100 | $ | 26,196 | $ | 28,290 | ||||||||||||
| Professional services and other |
2,449 | 2,995 | 3,141 | 3,355 | 3,129 | 3,761 | ||||||||||||||||||
|
|
|
|
|
|
|
|
|
|
|
|
|
|||||||||||||
| Total revenues |
21,408 | 24,215 | 25,514 | 27,455 | 29,325 | 32,051 | ||||||||||||||||||
|
|
|
|
|
|
|
|
|
|
|
|
|
|||||||||||||
| Cost of revenues:(1) |
||||||||||||||||||||||||
| Subscription services |
3,025 | 3,526 | 3,601 | 3,694 | 3,863 | 4,240 | ||||||||||||||||||
| Professional services and other |
3,513 | 3,173 | 3,043 | 3,588 | 3,406 | 3,943 | ||||||||||||||||||
|
|
|
|
|
|
|
|
|
|
|
|
|
|||||||||||||
| Total cost of revenues |
6,538 | 6,699 | 6,644 | 7,282 | 7,269 | 8,183 | ||||||||||||||||||
|
|
|
|
|
|
|
|
|
|
|
|
|
|||||||||||||
| Gross profit |
14,870 | 17,516 | 18,870 | 20,173 | 22,056 | 23,868 | ||||||||||||||||||
|
|
|
|
|
|
|
|
|
|
|
|
|
|||||||||||||
| Operating expenses:(1) |
||||||||||||||||||||||||
| Sales and marketing |
18,465 | 17,805 | 19,830 | 19,633 | 20,636 | 19,746 | ||||||||||||||||||
| Research and development |
5,551 | 5,768 | 6,098 | 6,227 | 6,249 | 6,876 | ||||||||||||||||||
| General and administrative |
3,316 | 3,753 | 3,737 | 4,326 | 5,177 | 6,124 | ||||||||||||||||||
|
|
|
|
|
|
|
|
|
|
|
|
|
|||||||||||||
| Total operating expenses |
27,332 | 27,326 | 29,665 | 30,186 | 32,062 | 32,746 | ||||||||||||||||||
|
|
|
|
|
|
|
|
|
|
|
|
|
|||||||||||||
| Loss from operations |
(12,462 | ) | (9,810 | ) | (10,795 | ) | (10,013 | ) | (10,006 | ) | (8,878 | ) | ||||||||||||
| Other expense, net |
5 | 146 | 102 | 1,061 | 487 | 2,092 | ||||||||||||||||||
|
|
|
|
|
|
|
|
|
|
|
|
|
|||||||||||||
| Loss before provision for income taxes |
(12,467 | ) | (9,956 | ) | (10,897 | ) | (11,074 | ) | (10,493 | ) | (10,970 | ) | ||||||||||||
| Provision for income taxes |
33 | 42 | 111 | 22 | 78 | 76 | ||||||||||||||||||
|
|
|
|
|
|
|
|
|
|
|
|
|
|||||||||||||
| Net loss |
$ | (12,500 | ) | $ | (9,998 | ) | $ | (11,008 | ) | $ | (11,096 | ) | $ | (10,571 | ) | $ | (11,046 | ) | ||||||
|
|
|
|
|
|
|
|
|
|
|
|
|
|||||||||||||
70
Table of Contents
| (1) | Includes stock-based compensation expense as follows: |
| Three Months Ended | ||||||||||||||||||||||||
| January 31, 2017 |
April 30, 2017 |
July 31, 2017 |
October 31, 2017 |
January 31, 2018 |
April 30, 2018 |
|||||||||||||||||||
| (in thousands) | ||||||||||||||||||||||||
| Cost of revenue |
$ | 49 | $ | 47 | $ | 51 | $ | 77 | $ | 98 | $ | 109 | ||||||||||||
| Research and development |
166 | 168 | 168 | 216 | 215 | 257 | ||||||||||||||||||
| Sales and marketing |
257 | 282 | 287 | 318 | 251 | 350 | ||||||||||||||||||
| General and administrative |
549 | 481 | 486 | 539 | 494 | 553 | ||||||||||||||||||
|
|
|
|
|
|
|
|
|
|
|
|
|
|||||||||||||
| Total |
$ | 1,021 | $ | 978 | $ | 992 | $ | 1,150 | $ | 1,058 | $ | 1,269 | ||||||||||||
|
|
|
|
|
|
|
|
|
|
|
|
|
|||||||||||||
Percentage of Revenue Data:
| Three Months Ended | ||||||||||||||||||||||||
| January 31, 2017 |
April 30, 2017 |
July 31, 2017 |
October 31, 2017 |
January 31, 2018 |
April 30, 2018 |
|||||||||||||||||||
| Revenues: |
||||||||||||||||||||||||
| Subscription |
89 | % | 88 | % | 88 | % | 88 | % | 89 | % | 88 | % | ||||||||||||
| Professional services and other |
11 | 12 | 12 | 12 | 11 | 12 | ||||||||||||||||||
|
|
|
|
|
|
|
|
|
|
|
|
|
|||||||||||||
| Total revenues |
100 | 100 | 100 | 100 | 100 | 100 | ||||||||||||||||||
|
|
|
|
|
|
|
|
|
|
|
|
|
|||||||||||||
| Cost of revenues: |
||||||||||||||||||||||||
| Subscription services |
14 | 15 | 14 | 13 | 13 | 13 | ||||||||||||||||||
| Professional services and other |
16 | 13 | 12 | 13 | 12 | 13 | ||||||||||||||||||
|
|
|
|
|
|
|
|
|
|
|
|
|
|||||||||||||
| Total cost of revenues |
30 | 28 | 26 | 26 | 25 | 26 | ||||||||||||||||||
|
|
|
|
|
|
|
|
|
|
|
|
|
|||||||||||||
| Gross margin |
70 | 72 | 74 | 74 | 75 | 74 | ||||||||||||||||||
| Operating expenses |
||||||||||||||||||||||||
| Sales and marketing |
86 | 74 | 78 | 72 | 70 | 62 | ||||||||||||||||||
| Research and development |
26 | 24 | 24 | 23 | 21 | 21 | ||||||||||||||||||
| General and administrative |
15 | 15 | 15 | 16 | 18 | 19 | ||||||||||||||||||
|
|
|
|
|
|
|
|
|
|
|
|
|
|||||||||||||
| Total operating expenses |
127 | 113 | 117 | 111 | 109 | 102 | ||||||||||||||||||
|
|
|
|
|
|
|
|
|
|
|
|
|
|||||||||||||
| Loss from operations |
(57 | ) | (41 | ) | (43 | ) | (37 | ) | (34 | ) | (28 | ) | ||||||||||||
| Other expense, net |
0 | 1 | 0 | 4 | 2 | 7 | ||||||||||||||||||
|
|
|
|
|
|
|
|
|
|
|
|
|
|||||||||||||
| Loss before provision for income taxes |
(57 | ) | (42 | ) | (43 | ) | (41 | ) | (36 | ) | (35 | ) | ||||||||||||
| Provision for income taxes |
— | — | — | — | — | — | ||||||||||||||||||
|
|
|
|
|
|
|
|
|
|
|
|
|
|||||||||||||
| Net loss |
(57 | )% | (42 | )% | (43 | )% | (41 | )% | (36 | )% | (35 | )% | ||||||||||||
|
|
|
|
|
|
|
|
|
|
|
|
|
|||||||||||||
Quarterly Revenue Trends
Total revenues increased sequentially in each of the quarters presented primarily due to sales of subscriptions to new customers and the expanded use of our platform by existing customers.
Quarterly Cost of Revenue Trends
Total cost of revenues increased over the course of the periods presented primarily due to expanded use of our platform by existing and new customers, which resulted in increased infrastructure costs. The sequential
71
Table of Contents
decrease during the quarter ended July 31, 2017 was due to a temporary decrease in professional service headcount and the related compensation cost. The sequential decrease in cost of revenues during the quarter ended January 31, 2018 was due to reduced use of partners to supplement internal staff in deploying solutions compared to the prior quarter.
Quarterly Gross Margin Trends
The overall increase in gross margin over the course of the periods presented was primarily the result of an increase in subscription revenues, which have a higher gross margin than that of professional services. Certain key components of cost of revenues, such as hosting costs, are fixed to a certain extent, which resulted in an improvement in subscription gross margin.
Quarterly Operating Expense Trends
Our total quarterly operating expenses increased over the periods presented primarily due to overall increases in headcount and other related expenses to support our growth.
Sales and Marketing
Our sales and marketing expenses increased over the periods presented primarily due to increases in sales commission and marketing campaigns. The timing of achievement of commission accelerators and marketing campaigns can impact the trends in sales and marketing expenses. Sales and marketing expenses were higher in the quarters ended January 31, 2017 and January 31, 2018 due to higher sales commission as more sales personnel achieved their accelerated sales targets during the last quarter of the fiscal year. Sales and marketing expenses were higher in the quarter ended July 31, 2017 due to marketing costs incurred for Adaptive Live, our annual user conference.
Research and Development
Our research and development expenses increased sequentially over the quarters presented, primarily due to increases in employee-related costs as a result of hiring more seasoned employees.
General and Administrative
Our overall general and administrative expenses increased in the quarters presented primarily due to increases in employee-related expenses and legal, accounting, and other professional fees. Our general and administrative expenses increased at a faster rate during the quarters ended January 31, 2018 and April 30, 2018, as we incurred additional costs in professional fees associated with public company readiness beginning in 2018.
Liquidity and Capital Resources
Since inception, we have primarily financed our operations and capital expenditures through private sales of preferred stock, borrowings, as well as payments received from customers using our platform and services. As of April 30, 2018, our principal sources of liquidity were $43.8 million of cash and cash equivalents, which primarily consist of cash deposits and investments in money market funds.
In December 2014, we entered into a loan and security agreement, or the 2014 Loan Agreement with Silicon Valley Bank, consisting of a formula based revolving line of credit and a $5.0 million equipment term loan facility. Upon closing, we drew an equipment term loan in principal amount of $4.4 million. The equipment term loan matures on December 29, 2018. The equipment term loan bears interest at a floating annual rate of 0.75% above the prime rate, due monthly in arrears. All unpaid principal of the equipment term loan and accrued and unpaid interest, together with a final payment of 1.0% of the original principal amount of the equipment term loan is due on the maturity date.
72
Table of Contents
Under the 2014 Loan Agreement, the revolving line of credit was scheduled to mature on December 29, 2017. In December 2017, we entered into an amendment to the 2014 Loan Agreement with the lender to extend the maturity date from December 29, 2017 to March 29, 2018. On March 5, 2018, we entered into a further amendment of the 2014 Loan Agreement, which we refer to as the 2018 Amended Loan Agreement with Silicon Valley Bank. Under the 2018 Amended Loan Agreement, the maximum available amount of the revolving revenue line of credit is the lesser of (1) $25.0 million or (2) monthly recurring revenues as defined in the agreement, multiplied by four hundred percent, adjusted for our annualized customer retention rate. The revolving line of credit will mature on March 5, 2021.
Under the 2018 Amended Loan Agreement, the principal can be paid and re-borrowed during the term. The interest rate is based on the Wall Street Journal’s Prime Rate, or WSJ Prime, plus 0.25%. We are subject to minimum interest payments until the earlier of (1) the maturity date, (2) a liquidity event as defined in the agreement, (3) 12 months following effective date of the agreement and (4) the date that the 2018 Amended Loan Agreement is terminated.
In addition, there is a financial covenant to maintain a liquidity ratio equal to or greater than 1.75, measured on a monthly basis. The liquidity ratio is calculated as the ratio of the sum of unrestricted and unencumbered cash held at the lender plus accounts receivables, divided by the outstanding principal balance with the lender. We are also required to comply with customary affirmative and negative covenants and reporting requirements applicable to us and our subsidiaries. The negative covenants include restrictions on our ability to dispose of assets, enter into change of control transactions, merge with or acquire other entities, incur indebtedness, encumber our assets, pay dividends and enter into affiliate transactions. We are in compliance with these covenants. The 2018 Amended Loan Agreement includes customary events of default. The obligations under the 2014 Loan Amendment and all subsequent amendments are secured by a lien on substantially all of our assets. On March 5, 2018, we drew down $10.0 million from this revolving revenue line of credit.
In June 2017, we entered into a loan and security agreement, or the 2017 Loan Agreement, with Silver Lake Waterman Fund, L.P. for a $40.0 million term loan facility. The maturity date of the term loans is June 2, 2021. Under the 2017 Loan Agreement, we pay cash interest in arrears on the unpaid principal on a monthly basis at a fixed rate of 6.5% per annum. We also incur additional interest paid in kind on the unpaid principal at a fixed rate of 5.5% per annum, which amount is added to the outstanding principal balance monthly in arrears. The unpaid principal amount of the term loans is due in a single payment on the maturity date, together with any accrued and unpaid interest. If we elect to prepay all or any portion of the term loans, we will be required to pay a prepayment premium between 1.0% and 4.0% of the principal amount prepaid. We paid a commitment fee of $0.2 million at the closing of the 2017 Loan Agreement, and will be required to pay an additional commitment fee of 0.9% of the principal amount of any additional term loans funded. We incurred $0.1 million in debt issuance costs in connection with the 2017 Loan Agreement.
We drew down $25.0 million under the 2017 Loan Agreement on June 2, 2017. On March 6, 2018, we drew down the remaining $15.0 million. The 2017 Loan Agreement also includes customary affirmative and negative covenants and reporting requirements, applicable to us and our subsidiaries. The negative covenants include restrictions on our ability to dispose of assets, enter into change of control transactions, merge with or acquire other entities, incur indebtedness, encumber our assets, pay dividends and enter into affiliate transactions. We have been in compliance with these covenants since the initial drawdown. The 2017 Loan Agreement also includes customary events of default. The obligations under the 2017 Loan Agreement are secured by a lien on substantially all assets.
We believe our existing cash and cash equivalents, available revolving advances under the 2018 Amended Loan Agreement will be sufficient to meet our working capital needs, as well as capital expenditures and financing obligations for at least the next 12 months.
Our future capital requirements will depend on many factors, including our growth rate, the expansion of our direct sales force, strategic relationships and international operations, the timing and extent of spending to
73
Table of Contents
support research and development efforts and the continuing market acceptance of our solutions. We may require additional equity or debt financing. Sales of additional equity could result in dilution to our stockholders. If we raise funds by borrowing from third parties, the terms of those financing arrangements would require us to incur additional interest expense and may include negative covenants or other restrictions on our business that could impair our operating flexibility. We can provide no assurance that additional financing will be available at all or, if available, that we could be able to obtain financing on terms favorable to us. If we are unable to raise additional capital when needed, we would be required to curtail our operating activities and capital expenditures, and our business operating results and financial condition would be adversely affected.
Our existing credit facility and loan agreement contain, and any future indebtedness would likely contain, a number of restrictive covenants that impose significant operating and financial restrictions on us, including restrictions on our ability to take actions that may be in our best interests. Our credit facility and loan agreement require us to satisfy financial covenants as described above. Our ability to meet those financial covenants can be affected by events beyond our control, and we may not be able to continue to meet those covenants. A breach of any of these covenants or the occurrence of other events specified in the credit facility and in the loan agreement could result in an event of default. We have pledged all of our assets, including our intellectual property, as collateral under the credit facility and the loan agreement. See our Notes to the Consolidated Financial Statements for an additional description of our credit facility and loan agreement.
Cash Flows
The following table sets forth a summary of our cash flows for the periods indicated:
| Year Ended January 31, |
Three Months Ended April 30, |
|||||||||||||||||||
| 2016 | 2017 | 2018 | 2017 | 2018 | ||||||||||||||||
| (in thousands) | ||||||||||||||||||||
| Net cash used in operating activities |
$ | (40,811 | ) | $ | (34,394 | ) | $ | (15,197 | ) | $ | (5,898 | ) | $ | (10,601 | ) | |||||
| Net cash used in investing activities |
(4,702 | ) | (4,171 | ) | (4,851 | ) | (1,199 | ) | (1,224 | ) | ||||||||||
| Net cash (used in) provided by financing activities |
78,741 | (765 | ) | 27,473 | (196 | ) | 25,510 | |||||||||||||
|
|
|
|
|
|
|
|
|
|
|
|||||||||||
| Net increase (decrease) in cash and cash equivalents |
$ | 33,228 | $ | (39,330 | ) | $ | 7,425 | $ | (7,293 | ) | $ | 13,685 | ||||||||
|
|
|
|
|
|
|
|
|
|
|
|||||||||||
Net Cash Used in Operating Activities
Our cash used in operating activities is significantly influenced by our investments in headcount and infrastructure to support anticipated growth. In addition, our net loss in recent periods has generally been significantly greater than our use of cash for operating activities due to our subscription-based revenue model in which billings occur in advance of revenue recognition as well as a substantial amount of non-cash charges incurred by us. Non-cash charges primarily include depreciation and amortization and stock-based compensation.
Cash used in operating activities during the three months ended April 30, 2018 was $10.6 million resulting from our net loss of $11.0 million, plus net cash outflows through changes in our operating assets and liabilities of $2.9 million, offset by net non-cash expenses of $3.3 million, which included $1.1 million of depreciation and amortization expense, $1.3 million of stock-based compensation expense, $0.3 million of change in common stock warrant fair value, $0.5 million of interest paid-in-kind expense and $0.1 million of amortization of debt discount and debt issuance costs. The $2.9 million of net cash outflows used as a result of changes in our operating assets and liabilities reflected a $4.1 million increase in deferred revenues, offset by a $1.7 million increase in accounts receivable due to the growth of our customer base and expanded use by existing customers which are billed in advance of our revenue recognition, a $5.0 million net decrease in accounts payable and accrued expenses and other liabilities due to timing of payments, increased operating expenditures to support overall growth, increased payroll-related accruals, and a $0.3 million net increase in prepaid expenses and other assets in support of our operational expansion.
74
Table of Contents
Cash used in operating activities during the three months ended April 30, 2017 was $5.9 million resulting from our net loss of $10.0 million, which was partially offset by net cash flows provided through changes in our operating assets and liabilities of $1.8 million and net non-cash expenses of $2.3 million, including $1.3 million depreciation and amortization expense and $1.0 million of stock-based compensation expense. The $1.8 million of net cash flows provided as a result of changes in our operating assets and liabilities reflected a $1.3 million decrease in accounts receivable due to enhanced billing and collections, as well as a $2.0 million increase in accounts payable and accrued expenses and other liabilities, offset by a $0.6 million increase in prepaid expenses and other assets in support of our operational expansion and a $0.9 million decrease in deferred revenues.
Cash used in operating activities during fiscal 2018 was $15.2 million resulting from our net loss of $42.7 million, which was partially offset by net cash flows provided through changes in our operating assets and liabilities of $16.7 million and net non-cash expenses of $10.8 million, which included $4.9 million of depreciation and amortization expense, $4.2 million of stock-based compensation expense, $0.7 million of change in common stock warrant fair value, $0.9 million of interest paid-in-kind expense and $0.1 million of amortization of debt discount and accretion costs. The $16.7 million of net cash flows provided as a result of changes in our operating assets and liabilities reflected a $8.8 million increase in deferred revenues offset by a $3.3 million increase in accounts receivable due to the growth of our customer base and expanded use by existing customers which are billed in advance of our revenue recognition, a $12.0 million increase in accounts payable and accrued expenses and other liabilities due to timing of payments, increased operating expenditure to support overall growth, and increase in payroll-related accruals, and a $0.8 million net increase in prepaid expenses and other assets in support of our operational expansion.
Cash used in operating activities during fiscal 2017 was $34.4 million resulting from our net loss of $44.7 million, which was partially offset by net cash flows provided through changes in our operating assets and liabilities of $2.1 million and net non-cash expenses of $8.3 million, which included $5.2 million depreciation and amortization expense and $3.1 million of stock-based compensation expense. The $2.1 million of net cash flows provided as a result of changes in our operating assets and liabilities reflected a $9.5 million increase in deferred revenues offset by a $4.8 million increase in accounts receivable due to the growth of our customer base and expanded use by existing customers which are billed in advance of our revenue recognition, a $2.0 million increase in prepaid expenses and other assets in support of our operational expansion and a $0.6 million decrease in accounts payable and accrued expenses and other liabilities.
Cash used in operating activities during fiscal 2016 was $40.8 million resulting from our net loss of $59.1 million, partially offset by net cash flows provided through changes in our operating assets and liabilities of $11.2 million and non-cash expenses of $7.1 million, which included $4.8 million depreciation and amortization expense and $2.3 million of stock-based compensation expense. The $11.2 million of net cash flows provided as a result of changes in our operating assets and liabilities reflected a $12.2 million increase in deferred revenues offset by a $2.9 million increase in accounts receivables as a result of the growth of our customer base and expanded use by existing customers which are billed in advance of our revenue recognition, and a $2.3 million increase in accrued expenses and other liabilities primarily associated with increase in payroll-related accruals, offset by a $0.4 million decrease in accounts payable.
Net Cash Used in Investing Activities
Our investing activities consist primarily of capital expenditures for property and equipment and capitalized software development costs.
During the three months ended April 30, 2018, we used $1.2 million in investing activities including $1.0 million in capitalized software development and $0.2 million in purchases of property and equipment for expansion of our operations.
75
Table of Contents
During the three months ended April 30, 2017, we used $1.2 million in investing activities including $0.8 million in capitalized software development activities and $0.4 million in purchases of property and equipment for expansion of our operations.
For fiscal 2018, we used $4.9 million in investing activities including $3.5 million in capitalized software development and $1.4 million in purchases of property and equipment for expansion of our operations.
For fiscal 2017, we used $4.2 million in investing activities including $2.3 million in capitalized software development activities and $1.9 million in purchases of property and equipment for expansion of our operations.
For fiscal 2016, we used $4.7 million in investing activities including $2.0 million in capitalized software development costs, $2.4 million in purchases of property and equipment related to expansion of our operations and $0.2 million in acquisition of intangible assets
Net Cash (Used in) Provided By Financing Activities
During the three months ended April 30, 2018, we received $25.5 million in financing activities primarily as a result of $24.8 million from net proceeds from the issuance of long-term debt and $1.2 million from proceeds from the exercise of stock options, offset by $0.3 million principal repayment of long-term debt, and $0.2 million payments of deferred offering costs.
During the three months ended April 30, 2017, we used $0.2 million in financing activities primarily as a result of a $0.3 million principal repayment of long-term debt, which was offset by $0.1 million of proceeds received from the exercise of stock options.
For fiscal 2018, we received $27.5 million in financing activities primarily as a result of $24.7 million from net proceeds from the issuance of long-term debt and $3.9 million from proceeds from the exercise of stock options, offset by $1.1 million used in principal repayment of long-term debt.
For fiscal 2017, we used $0.8 million in financing activities primarily as a result of a $1.1 million principal repayment of long-term debt, which was offset by $0.3 million of proceeds received from exercise of stock options.
For fiscal 2016, financing activities provided $78.7 million primarily from $74.8 million from proceeds from the issuance of redeemable convertible preferred stock and $5.1 million from proceeds from exercise of stock options, offset by $1.1 million used in principal repayment of long-term debt.
Backlog
We enter into both single and multi-year subscription contracts for our solutions. The timing of our invoices to the customer is a negotiated term and thus varies among our subscription contracts. We may invoice an initial amount at contract signing prior to commencement of subscription period. In addition, for multi-year agreements, we may invoice an initial amount at contract signing followed by subsequent annual invoices. Until such time as these amounts are invoiced, they are not recorded in revenues, deferred revenues or elsewhere in our consolidated financial statements, and are considered by us to be backlog. As of January 31, 2017 and 2018, we had backlog of approximately $13.1 million and $35.6 million, respectively. Of the backlog of $35.6 million as of January 31, 2018, approximately $13.4 million is not reasonably expected to be filled in fiscal 2019. As of April 30, 2017 and 2018, we had backlog of approximately $18.1 million and $40.8 million, respectively. We expect backlog will change from period to period for several reasons, including the timing and duration of customer agreements, varying billing cycles of subscription agreements, and the timing and duration of customer renewals. Because revenues for any period are a function of revenues recognized from deferred revenues under contracts in existence at the beginning of the period, as well as contract renewals and new customer contracts during the period, backlog at the beginning of any period is not necessarily indicative of future revenue performance. We do not utilize backlog as a key management metric internally.
76
Table of Contents
Contractual Obligations and Commitments
The following table summarizes our contractual obligations as of January 31, 2018 (in thousands):
| Less Than | More than 5 Years |
|||||||||||||||||||
| Total | 1 Year | 1-3 Years | 3-5 Years | |||||||||||||||||
| (in thousands) | ||||||||||||||||||||
| Long-Term Debt Obligations(1) |
$ | 26,952 | $ | 1,014 | $ | — | $ | 25,938 | $ | — | ||||||||||
| Operating Lease Obligations(2) |
2,615 | 1,914 | 441 | 249 | 11 | |||||||||||||||
| Purchase Obligations(3) |
2,428 | 2,147 | 281 | — | — | |||||||||||||||
|
|
|
|
|
|
|
|
|
|
|
|||||||||||
| $ | 31,995 | $ | 5,075 | $ | 722 | $ | 26,187 | $ | 11 | |||||||||||
|
|
|
|
|
|
|
|
|
|
|
|||||||||||
| (1) | Long-term debt obligations includes principal due under the Equipment Term Loan and 2017 Loan Agreement. See Note 7 of the notes to our consolidated financial statements for additional information regarding the Equipment Term Loan and 2017 Loan Agreement. The long-term debt obligation presented here does not reflect the commitment under the 2018 Amended Loan Agreement. |
| (2) | Operating leases include total future minimum rent payments under non-cancelable operating lease agreements. |
| (3) | Purchase obligations include certain noncancelable arrangements for data hosting, software subscription agreements, marketing events and services. |
Off-Balance Sheet Arrangements
We did not have any relationships with unconsolidated organizations or financial partnerships, such as structured finance or special purpose entities, that would have been established for the purpose of facilitating off-balance sheet arrangements or other contractually narrow or limited purposes.
In the ordinary course of business, we may provide indemnification of varying scope and terms to customers, vendors, investors, directors and officers with respect to certain matters, including, but not limited to, losses arising out of our breach of such agreements, services to be provided by us, or from intellectual property infringement claims made by third parties. These indemnification provisions may survive termination of the underlying agreement and the maximum potential amount of future payments we could be required to make under these indemnification provisions may not be subject to maximum loss clauses. The maximum potential amount of future payments we could be required to make under these indemnification provisions is indeterminable. We have never paid a material claim, nor have we been sued in connection with these indemnification arrangements. As of January 31, 2018, we have not accrued a liability for these indemnification arrangements because the likelihood of incurring a payment obligation, if any, in connection with these indemnification arrangements is not probable or reasonably estimable.
Critical Accounting Policies and Estimates
Our financial statements and the related notes included elsewhere in this prospectus are prepared in accordance with generally accepted accounting principles, or GAAP, in the United States. The preparation of consolidated financial statements in conformity with GAAP requires management to make estimates and assumptions that affect the reported amounts of assets and liabilities and the disclosure of contingent assets and liabilities at the dates of the consolidated financial statements, and the reported amounts of revenues and expenses during the reporting period. We evaluate our estimates and assumptions on an ongoing basis. Our estimates are based on historical experience and various other assumptions that we believe to be reasonable under the circumstances. Actual results could differ from these estimates.
We believe that the following critical accounting policies involve a greater degree of judgment or complexity than our other accounting policies. Accordingly, these are the policies we believe are the most critical to a full understanding and evaluation of our consolidated financial condition and results of operations. See Note 2 of the notes to our consolidated financial statements for additional information.
77
Table of Contents
Revenue Recognition and Deferred Revenues
Subscription — Customers pay annual or multi-year subscription fees for the right to access our cloud-based software platform. Customers do not have the right to take possession of the cloud-based software platform at any time. We also offer downloadable software components with additional functionality that are installed on customers’ servers.
Fees are based on a number of factors, including the solutions subscribed for by the customer and the number of users having access to the solutions. Subscription fees are typically payable within 30 days after the execution of the arrangement, and thereafter upon renewal or subsequent installment. We initially record the subscription fees as deferred revenues and recognize revenues on a straight-line basis over the term of the agreement. At any time during the subscription period, customers may increase the number of their users or subscribe for additional solutions for additional subscription fees.
Professional Services and Other — We offer customers assistance in implementing and optimizing the use of our solutions, as well as training services. Professional services consist of implementation and consulting services. These services are billed on either a fixed fee or time and material basis. Revenues from time and material arrangements are recognized as services are performed and revenues from fixed fee arrangements are initially recorded as deferred revenues and recognized on a proportional performance basis as the services are rendered.
We recognize subscription and professional services revenues when: (i) persuasive evidence of an arrangement for the sale of our solutions or implementation and consulting services exists, (ii) the solutions have been made available or delivered, or services have been performed, (iii) the sales price is fixed or determinable, and (iv) collectability is reasonably assured. The timing and amount we recognize as revenues is determined based on the facts and circumstances of each customer’s arrangement. Evidence of an arrangement consists of a signed customer agreement. We consider that delivery of a solution has commenced once we provide the customer with log-in information. Fees are fixed based on stated rates specified in the customer agreement. We assess collectability based on a number of factors, including the creditworthiness of the customer, and transaction history. If collectability is not considered reasonably assured, revenues are deferred until the fees are collected.
The majority of customer arrangements include multiple deliverables such as subscriptions to our cloud-based software platform, downloadable software components, and professional services. We recognize revenues in accordance with the guidance for arrangements with multiple deliverables under Accounting Standards Codification, or ASC, Topic 605-25 – Multiple-Deliverable Revenue Arrangements. Subscription to the cloud-based software platform are outside the scope of software revenue recognition guidance as defined by ASC Topic 985-605, Software, because customers do not have the right to take possession of the software supporting the cloud-based software platform at any time and it is not feasible for the customer to either run the software on its own hardware or contract with another unrelated party to host the software. Only downloadable software components and related services included in the arrangement are recognized under the guidance of ASC Topic 985-605, Software. Generally, our agreements do not contain any refund provisions other than in the event of our non-performance or breach.
For multiple-deliverable revenue arrangements, we first assess whether each deliverable has value to the customer on a standalone basis. We have determined that the cloud-based software platform has standalone value, because, once access is given to the customer, the solutions are fully functional and do not require any additional development, modification, or customization.
Professional services have standalone value because third-party partners and customers themselves can perform these services without our involvement. The performance of these professional services generally does not require highly specialized or technologically skilled individuals and the professional services are not essential to the functionality of the solutions.
78
Table of Contents
We allocate revenues among the separate deliverables in an arrangement under the relative selling price method using the selling price hierarchy established in ASC 605-25. This hierarchy requires the selling price of each deliverable in a multiple deliverable arrangement to be based on, in descending order: (i) vendor-specific objective evidence of fair value, or VSOE, (ii) third-party evidence of fair value, or TPE, or (iii) management’s best estimate of the selling price, or BESP.
We establish VSOE of fair value for professional services sold on a time and material basis by analyzing historical discounting practices when these services are sold separately. Otherwise, we are not able to determine VSOE or TPE for our other deliverables, because the deliverables are typically bundled and infrequently sold separately within a consistent price range. Therefore, the fair values of all remaining deliverables are based on BESP. The determination of BESP requires us to make significant estimates and judgments. We consider numerous factors, including the nature of the deliverables themselves and historical discounting practices. We update our estimates of BESP on an ongoing basis as events and as circumstances may require. As our marketing strategies evolve, we may modify our pricing practices in the future, which could result in changes in relative selling prices and BESP.
The portion of the fee allocated to the downloadable software component and related services, which include implementation services and non-optional post-contract customer support, are within the scope of ASC 985-605, Software Revenue Recognition, and are accounted for ratably over the contract support period starting after the software related services have commenced under the combined services approach as we do not have VSOE of fair value for all of the undelivered software deliverables. Post-contract customer support includes technical support, unspecified software upgrades or bug fixes provided on a when-and-if available basis, and access to our online knowledge base, and is provided throughout the contract term.
We use resellers to complement our direct sales and marketing efforts. The resellers place an order with us after negotiating the order with an end customer. The resellers negotiate pricing with the end customer and are responsible for certain support levels directly with the end customer. We receive a percentage of the price paid by the end customer. Our contract is with the reseller and payment us is not contingent on the receipt of payment from the end customer. We recognize the contractual amount charged to the reseller as revenues ratably over the term of the arrangement, once access to our solution has been provided to the end customer, provided that the other revenue recognition criteria noted above have been met.
We also use channel partners who refer customers to us in exchange for a referral fee. We negotiate pricing and contracts directly with the end customer. We recognize revenues from the sales to the end customers, ratably over the term of the contract, once access to our solution has been provided to the end customer, provided that the other revenue recognition criteria noted above have been met. We record the referral fees paid to channel partners as sales commission expense as incurred.
Stock-based Compensation
We account for stock-based compensation awards granted to employees and directors based on the awards’ estimated grant date fair value. We estimate the fair value of our stock options using the Black-Scholes option-pricing model. The resulting fair value is recognized on a straight-line basis over the period during which an employee is required to provide service in exchange for the award, usually the vesting period, which is generally four years. On February 1, 2018, we adopted ASU2016-09 Compensation-Stock Compensation (Topic 718): Improvements to Employee Share-Based Payment Account (“ASU 2016-09”) and account for forfeitures as they occur in calculating compensation costs. The impact of adopting this ASU did not have a material impact on our financial statements.
Determining the grant date fair value of options using the Black-Scholes option pricing model requires management to make assumptions and judgments. These estimates involve inherent uncertainties and if different assumptions had been used, stock-based compensation expense could have been materially different from the amounts recorded.
79
Table of Contents
The Black-Scholes option-pricing model assumptions and estimates are as follows:
| • | Expected volatility. As we do not have a trading history for our common stock, the expected stock price volatility for our common stock is estimated by taking the average historical price volatility for industry peers over a period equivalent to the expected term of the stock option grants. We intend to continue to consistently apply this process until a sufficient amount of historical information regarding the volatility of our own common stock share price becomes available. |
| • | Expected term. We determine the expected term of awards using the simplified approach, in which the expected term of an award is presumed to be the mid-point between the vesting date and the expiration date of the award, as we do not have sufficient historical data relating to stock-option exercises. |
| • | Risk-free interest rate. The risk-free interest rate is based on the United States Treasury yield curve in effect during the period the options were granted corresponding to the expected term of the awards. |
| • | Estimated dividend yield. The estimated dividend yield is zero, as we do not currently intend to declare dividends in the foreseeable future. |
The following table summarizes the assumptions used to estimate the fair value of stock options granted during the periods presented:
| Years ended January 31, | Three Months Ended April 30, | |||||||||
| 2016 | 2017 | 2018 | 2017 | 2018 | ||||||
| Expected term (years) |
4.99 — 6.25 | 5.41 — 6.01 | 5.27 — 6.61 | 5.8 — 6.08 | 4.53 — 6.67 | |||||
| Volatility |
47.10% —50.20% | 46.05% — 48.45% | 39.67% — 47.43% | 44.14% | 43.49% — 45.11% | |||||
| Weighted average volatility |
50.17% | 47.14% | 41.38% | 44.14% | 44.33% | |||||
| Risk-free interest rate |
1.56% — 1.95% | 1.08% — 1.86% | 1.87% — 2.29% | 2.15% — 2.19% | 2.61% — 2.83% | |||||
| Dividend yield |
0% | 0% | 0% | 0% | 0% | |||||
The intrinsic value of all outstanding options as of April 30, 2018 was $ million based on the initial public offering price of $ per share, the midpoint of the price range set forth on the cover of this prospectus.
Fair Value of Common Stock
The fair value of the common stock underlying our stock options was historically determined by our board of directors with input from management based upon information available at the time of grant. Given the absence of a public trading market for our common stock and in accordance with the American Institute of Certified Public Accountants Accounting & Valuation Guide, Valuation of Privately-Held Company Equity Securities Issued as Compensation, our board of directors has exercised reasonable judgment and considered numerous objective and subjective factors to determine the best estimate of the fair value of our common stock at each grant date. These factors included the following:
| • | the prices, rights, preferences and privileges of our redeemable convertible preferred stock relative to the common stock; |
| • | our historical operating and financial performance; |
| • | current business conditions and projections; |
| • | our history and stage of development; |
80
Table of Contents
| • | hiring of key personnel and the experience of our management; |
| • | the likelihood of achieving different liquidity events, such as an initial public offering or a merger or acquisition given prevailing market conditions; |
| • | the market performance of comparable publicly traded companies; |
| • | the lack of an active public market for our common and preferred stock; and |
| • | U.S. and global capital market conditions. |
The per share estimated fair value of our common stock represents the determination by our board of directors of the fair value of our common stock as of the date of grant, taking into consideration the various objective and subjective factors described above, including the valuations of our common stock. There is inherent uncertainty in these estimates and, if we had made different assumptions than those described below, the fair value of the underlying common stock and amount of our stock-based compensation expense, net loss, and net loss per share amounts would have differed.
In determining the most recent fair value of our common stock, we estimated the enterprise value of our business primarily using a combination of the income approach and market approach. Under the income approach, forecast cash flows are discounted to the present value at a risk-adjusted discount rate. The valuation analyses determine discrete free cash flows over several years based on forecast financial information provided by our management and a terminal value for the residual period beyond the discrete forecast, which are discounted at our estimated weighted average cost of capital to estimate our enterprise value. Under the market approach, a group of guideline publicly traded companies with similar financial and operating characteristics as us is selected, and valuation multiples based on the guideline public companies’ financial information and market data are calculated. Based on the observed valuation multiples, an appropriate multiple was selected to apply to our historical and forecasted revenue results. The estimated enterprise value is then allocated to the common stock using a multi-scenario Option Pricing Method, or OPM. The concluded per-share value of common stock includes a discount for lack of marketability.
For stock awards after the completion of this offering, our board of directors intends to determine the fair value of each share of underlying common stock based on the closing price of our common stock as reported on the date of grant.
Capitalized Software Costs
We account for the costs of computer software obtained or developed for internal use in accordance with ASC 350 , Intangibles—Goodwill and Other, or ASC 350. We capitalize certain costs in the development of our cloud-based application suite when (i) the preliminary project stage is completed, (ii) management has authorized further funding for the completion of the project and (iii) it is probable that the project will be completed and performed as intended. These capitalized costs include personnel and related expenses for employees and costs of third-party contractors who are directly associated with and who devote time to internal-use software projects and, when material, interest costs incurred during the development. Capitalization of these costs ceases once the project is substantially complete and the software is ready for its intended purpose. Costs incurred for significant upgrades and enhancements to our cloud-based application suite are also capitalized. Costs incurred for training, maintenance and minor modifications or enhancements are expensed as incurred. Capitalized software development costs are amortized using the straight-line method over an estimated useful life of three years.
Income Taxes
We account for income taxes in accordance with ASC 740, Income Taxes, or ASC 740. ASC 740 requires the recognition of deferred tax assets and liabilities for the expected future tax consequences of temporary differences between the carrying amounts and the tax bases of assets and liabilities. Deferred income tax assets
81
Table of Contents
and liabilities are measured using enacted tax rates expected to apply to taxable income in the years in which those temporary differences are expected to be recovered or settled. The effect of a change in tax rates on deferred tax assets and liabilities is recognized in the consolidated statements of operations in the period that includes the enactment date. A valuation allowance is recorded when it is more likely than not that some of the deferred tax assets will not be realized.
We recognize the tax benefit from an uncertain tax position only if it is more likely than not that the tax position will be sustained on examination by the taxing authorities, based on the technical merits of the position. The tax benefits recognized in the consolidated financial statements from such positions are then measured based on the largest benefit that has a greater than 50% likelihood of being realized. We recognize interest and penalties accrued with respect to uncertain tax positions, if any, in the provision for income taxes in the consolidated statements of operations.
On December 22, 2017, the Tax Cuts and Jobs Act, or the Tax Act, was signed into law. The Tax Act includes a number of key tax provisions that affect us, including but not limited to, lowering the U.S. federal corporate tax rate from 35% to 21%, effective January 1, 2018, and the establishment of a territorial-style system for taxing foreign-source income of domestic multinational corporations. One December 22, 2017, the Securities and Exchange Commission issued Staff Accounting Bulletin No. 118, Income Tax Accounting Implications of the Tax Cuts and Jobs Act, or SAB 118, which provides guidance on accounting for the Tax Act’s impact and allows registrants to record provisional amounts during a measurement period not to extend beyond one year of the enactment date.
We have not completed our accounting assessment for the effects of the Tax Act; however, based on our initial assessment, we have determined that the Tax Act did not have a material impact to the financial statements in fiscal 2018, other than disclosures in our year-end financial statements. We currently maintain a full valuation allowance recorded against our U.S. federal deferred tax assets since we continue to incur losses in all fiscal years. As such, the remeasurement of the deferred tax assets and related valuation allowance is not expected to have a material impact to the financial statements in fiscal 2018, other than disclosures presented below. We expect to complete our assessment within the measurement period in accordance with SAB118. Our assessment of the impact of the Tax Act may materially differ from our provisional assessment during the measurement period due to, among other things, further refinement in our calculations, changes in interpretations and assumptions we have made, or guidance that may be issued.
JOBS Act Accounting Election
We are an emerging growth company, as defined in the Jumpstart Our Business Startups Act of 2012, or the JOBS Act. Under the JOBS Act, emerging growth companies can delay adopting new or revised accounting standards issued subsequent to the enactment of the JOBS Act until such time as those standards apply to private companies. We have elected to use this extended transition period for complying with new or revised accounting standards that have different effective dates for public and private companies until the earlier of the date we (i) are no longer an emerging growth company or (ii) affirmatively and irrevocably opt out of the extended transition period provided in the JOBS Act. As a result, our financial statements may not be comparable to companies that comply with new or revised accounting pronouncements as of public company effective dates.
Recent Accounting Pronouncements
In May 2014, the FASB issued ASU No. 2014-09, Revenue from Contracts with Customers, or ASU 2014-09, which provides guidance for revenue recognition. This ASU affects any entity that enters into contracts with customers to transfer goods or services. This ASU will supersede the revenue recognition requirements in Topic 605, Revenue Recognition, and most industry-specific guidance. Subsequently, the FASB has issued the following standards to amend ASU 2014-09: ASU 2015-14, Revenue from Contracts with Customers (Topic 606): Deferral of the Effective Date; ASU No. 2016-08, Revenue from Contracts with
82
Table of Contents
Customers (Topic 606): Principal versus Agent Considerations (Reporting Revenue Gross versus Net); ASU No. 2016-10, Revenue from Contracts with Customers (Topic 606): Identifying Performance Obligations and Licensing; ASU No. 2016-12, Revenue from Contracts with Customers (Topic 606): Narrow-Scope Improvements and Practical Expedients; and ASU 2016-20, Technical Corrections and Improvements to Topic 606, which clarifies narrow aspects of ASC 606 or corrects unintended application of the guidance. We must adopt ASU 2015-14, ASU 2016-08, ASU 2016-10, ASU 2016-12, and ASU 2016-20 with ASU 2014-09, which we refer to collectively as the “new revenue standards.” The guidance allows for the amendment to be applied either retrospectively to each prior reporting period presented or retrospectively as a cumulative-effect adjustment as of the date of adoption. The new revenue standards will be effective for us at the earlier of losing the emerging growth company status or in the first quarter of fiscal year 2020. We currently anticipate adopting the new revenue standards using the full retrospective transition method. As we continue to assess the new standard along with industry trends and internal progress, we may adjust our implementation plan and methodology accordingly.
The new revenue standards remove the requirement to have Vendor Specific Objective Evidence, or VSOE, to separate software and software related items. This will result in the acceleration of software-related professional services revenues for orders where the customers purchase downloadable software components and professional services. Under existing guidance, we recognize the license fees for the downloadable software component, including the non-optional post-contract customer support, and professional service fees ratably over the contract term once the professional services have commenced under the combined services approach as we do not have VSOE of fair value for all of the undelivered software deliverables. Under the new revenue standards, the downloadable software component will be recognized ratably once the customer is provided log-in information, and professional services will be recognized as the services are performed. The new revenue standards also remove the current limitation on contingent revenues, which will result in revenues being recognized earlier for certain contracts. In addition, the new revenue standards change the criteria for evaluating customer options to purchase products or services in the future to determine whether a material right exists and requires a deferral of such rights. This deferral will be recognized as revenues when the customer option expires unexercised, or if exercised, it will be recognized along with the additional purchases. In addition, the new revenue standards will require that we capitalize certain incremental costs of obtaining a contract, such as sales commissions paid to internal sales personnel and to channel partners, which are currently expensed as incurred. Under the new revenue standards, such capitalized costs will be amortized over an estimated customer life for the initial acquisition of a contract and over the contractual term for renewal contracts.
While we cannot reasonably estimate quantitative information related to the impact of the new revenue standards on our financial statements at this time and continue to assess the potential impacts of the new revenue standards, we expect that the impact on our total revenues will not be material and that the capitalization of sales commission expenses will have a material positive impact on our results of operations.
In February 2016, the FASB issued ASU 2016-02, Leases, or ASU 2016-02. The new standard establishes a right-of-use, or ROU, model that requires a lessee to record a ROU asset and a lease liability on the balance sheet for all leases with terms longer than 12 months. Leases will be classified as either finance or operating, with classification affecting the pattern of expense recognition in the income statement. The guidance is effective for us in the first quarter of fiscal year 2021. Early adoption is permitted. A modified retrospective transition approach is required for lessees for capital and operating leases existing at, or entered into after, the beginning of the earliest comparable period presented in the financial statements, with certain practical expedients available. We are currently evaluating the impact of adopting ASU 2016-02 on our consolidated financial statements.
In October 2016, the FASB issued ASU 2016-16, Income Taxes (Topic 740): Intra-entity Transfers of Assets other than Inventory, which requires recognition of current and deferred income taxes resulting from an intra-entity transfer of any asset other than inventory when the transfer occurs. The guidance is effective for us in the first quarter of fiscal year 2020. We are currently evaluating the impact this guidance will have on our consolidated financial statements.
83
Table of Contents
In August 2017, the FASB issued ASU 2017-12, Derivatives and Hedging (Topic 815): Targeted Improvements to Accounting for Hedging Activities, which expands and refines hedge accounting for both nonfinancial and financial risk components and align the recognition and presentation of the effects of the hedging instrument and the hedged item in the financial statements. The amendments are effective for us in the first quarter of fiscal year 2021. We do not expect this guidance to have a material impact on our consolidated financial statements.
In February 2018, the FASB issued ASU No. 2018-02, Reclassification of Certain Tax Effects from Accumulated Other Comprehensive Income (Topic 815) (ASU 2018-02), which allows a reclassification from accumulated other comprehensive income (loss) to retained earnings (accumulated deficit) for stranded income tax effects resulting from the 2017 Tax Cuts and Jobs Act. The amendments in this ASU also require certain disclosures about stranded income tax effects. We will adopt this guidance in the fiscal year 2020. We do not anticipate the adoption of this standard will have a material impact on our consolidated financial statements.
Quantitative and Qualitative Disclosures about Market Risk
We have operations both within the United States and internationally, and we are exposed to market risks in the ordinary course of our business. These risks primarily include interest rate, foreign exchange and inflation risks, as well as risks relating to changes in the general economic conditions in the countries where we conduct business. To reduce these risks, we monitor the financial condition of our clients and limit credit exposure as we deem appropriate. In addition, our investment strategy has historically been to invest in financial instruments that are highly liquid and readily convertible into cash and that mature within three months from the date of purchase. To date, we have not used derivative instruments to mitigate the impact of our market risk exposures. We have also not used, nor do we intend to use, derivatives for trading or speculative purposes.
Interest Rate Risk
We are exposed to market risk related to changes in interest rates.
Our investments are considered cash equivalents and primarily consist of money market funds. At January 31, 2018 and April 30, 2018, we had cash and cash equivalents of $30.1 million and $43.8 million, respectively. The carrying amount of our cash equivalents reasonably approximates fair value, due to the short maturities of these instruments. The primary objectives of our investment activities are the preservation of capital, the fulfillment of liquidity needs and the fiduciary control of cash and investments. We do not enter into investments for trading or speculative purposes. Our investments are exposed to market risk due to a fluctuation in interest rates, which may affect our interest income and the fair market value of our investments. Due to the short-term nature of our investment portfolio, however, we do not believe an immediate 10% increase or decrease in interest rates would have a material effect on the fair market value of our portfolio. We therefore do not expect our operating results or cash flows to be materially affected by a sudden change in market interest rates.
We do not believe our cash equivalents have significant risk of default or illiquidity. While we believe our cash equivalents do not contain excessive risk, we cannot provide absolute assurance that in the future our investments will not be subject to adverse changes in market value. In addition, we maintain significant amounts of cash and cash equivalents at one or more financial institutions that are in excess of federally insured limits. We cannot be assured that we will not experience losses on these deposits.
We are exposed to market risk from changes in interest rates on our revolving revenue line of credit and our Equipment Term Loan, which bear interest at the Wall Street Journal’s Prime Rate. As of January 31, 2018 and April 30, 2018, we had $1.0 million and $0.7 million, respectively, of principal outstanding under the Equipment Term Loan. As of April 30, 2017, we did not have a balance on our revolving line of credit. On March 5, 2018, we drew down $10.0 million under the revolving revenue line of credit. This balance was outstanding as of April 30, 2018. We have not used any derivative financial instruments to manage our interest rate risk exposure.
84
Table of Contents
Foreign Currency Risk
We have foreign currency risks related to our revenues and operating expenses denominated in currencies other than the U.S. Dollar. Our historical revenues have primarily been denominated in U.S. dollars, and a significant portion of our current revenues continues to be denominated in U.S. dollars. However, we expect an increasing portion of our future revenues to be denominated in currencies other than the U.S. dollar, primarily the Australian dollar, British pound, Canadian dollar, Euro and Japanese yen. The effect of an immediate 10% adverse change in foreign exchange rates on foreign-denominated cash and accounts receivable at January 31, 2018 would not be material to our financial condition or results of operations. Our operating expenses are generally denominated in the currencies of the countries in which our operations are located, primarily the United States and, to a much lesser extent, the United Kingdom, Canada, Australia, and Japan. Increases and decreases in our foreign-denominated revenues from movements in foreign exchange rates are partially offset by the corresponding decreases or increases in our foreign-denominated operating expenses.
As our international operations grow, our risks associated with fluctuation in currency rates will become greater, and we will continue to reassess our approach to managing this risk. In addition, currency fluctuations or a weakening U.S. Dollar can increase the costs of our international expansion. To date, we have not entered into any foreign currency hedging contracts, since exchange rate fluctuations have not had a material impact on our operating results and cash flows. Based on our current international structure, we do not plan on engaging in hedging activities in the near future.
Inflation Risk
We do not believe that inflation has had a material effect on our business, financial condition or results of operations. Nonetheless, if our costs were to become subject to significant inflationary pressures, we may not be able to fully offset such higher costs through price increases. Our inability or failure to do so could harm our business, financial condition and results of operations.
85
Table of Contents
Overview
We are a leading provider of cloud-based software to modernize business planning. Our platform—the Adaptive Insights Business Planning Cloud—transforms business planning into a strategic and competitive advantage by enabling organizations to respond to changing business conditions with confidence and agility. The Adaptive Insights Business Planning Cloud allows customers to rapidly and effectively model their businesses, monitor and analyze performance on an ongoing basis, share dashboards, and generate management reports. In addition, customers can use our Business Planning Cloud to evaluate actual performance versus plan, test alternative scenarios, and leverage insights from analytics to make informed, timely decisions that drive future business results.
Every organization plans. This includes small businesses, nonprofits, government agencies and Fortune 500 enterprises. Within these organizations, every function and department plans. We believe that the Adaptive Insights Business Planning Cloud is capable of transforming how all organizations plan.
Our Business Planning Cloud is:
| • | Easy—our intuitive, accessible user interface empowers all users within an organization to contribute to the planning and performance management process. |
| • | Powerful—our innovative, in-memory architecture scales to support very large and complex multi-dimensional models, enabling users to run and analyze virtually unlimited scenarios. |
| • | Fast—users can quickly access and update planning models utilizing data from numerous sources, allowing people across an organization to access real-time views of performance versus plan, and rapidly respond to change. |
Our Business Planning Cloud enables a continuous, comprehensive, and collaborative planning process across the organization—from business-wide planning to in-depth planning within specific business units and functions, such as sales, marketing and operations.
We believe that the market opportunity for our cloud-based planning platform is largely untapped because most organizations still rely on spreadsheets and other manual processes to plan. Our solutions are capable of addressing these opportunities and are also a modern replacement for legacy planning tools. Our platform is easy to use, has powerful modeling capabilities, enables insights from analytics, facilitates rapid iterative planning processes, and offers fast time-to-value and low total cost of ownership for customers. This allows us to address the needs of a wide range of organizations, whether they use legacy planning tools or spreadsheets and manual processes to plan. Our estimate of this opportunity is approximately $12.5 billion, based on our average revenues per customer and the more than 450,000 global organizations in developed markets with greater than 100 employees, all of which we believe could be potential customers. To capitalize on this opportunity, we have built both a direct sales force and a customer success team. We also have a global partner ecosystem, which includes over 150 software solution providers, enterprise resource planning vendors, systems integrators and regional consulting firms. We have been consistently recognized as a leader in the market and were positioned as a Leader in the 2017 Gartner Magic Quadrant for Cloud Strategic Corporate Performance Management Solutions for the second consecutive year. Additionally, we are positioned as a Leader by Forrester in its most recent Wave on this topic, the 2016 Forrester Enterprise Performance Management (EPM) Wave Report.
We believe that our customers are our greatest asset. As of April 30, 2018, we had over 3,800 customers located in more than 50 countries. Our powerful and scalable platform with an intuitive user interface is able to reach across the market spectrum, as low total cost of ownership makes it accessible to small and medium-sized business, or SMB, and mid-market customers. At the same time, our scalability enables us to serve large enterprise customers. Our solutions have broad applicability across all types of organizations, and our domain expertise in certain verticals enhances our market leadership.
86
Table of Contents
Our mission is to free people to do their best work and to empower teams to better manage their business. We do this in part by eliminating repetitive, manual tasks, enabling people to do higher value, more strategic work. Because of this, our customers are passionate about how our solutions have transformed their day-to-day jobs.
We initially created our Business Planning Cloud for financial planning and analysis teams. Over time, our customers have leveraged our platform’s flexible modeling capabilities to create solutions to address other use cases specific to their businesses. For example, a global airline extended their use of our platform to analyze route profitability, and a global software company expanded their use of our platform for integrated departmental budgeting and sales quota and capacity planning. We recently introduced a purpose-built solution for sales planning and analysis targeting sales teams, and we plan to continue to provide new solutions to address additional customer needs outside of finance and sales.
We have experienced significant platform adoption leading to revenue growth in recent periods. For our fiscal years ended January 31, 2016, 2017 and 2018, our total revenues were $61.7 million, $81.8 million and $106.5 million, respectively. For the three months ended April 30, 2017 and 2018, our total revenues were $24.2 million and $32.1 million, respectively. For our fiscal years ended January 31, 2016, 2017 and 2018, our subscription revenues were $49.4 million, $69.7 million and $93.9 million, respectively. For the three months ended April 30, 2017 and 2018, our subscription revenues were $21.2 million and $28.3 million, respectively. Our net losses were $59.1 million, $44.7 million and $42.7 million for the fiscal years ended January 31, 2016, 2017 and 2018, respectively. Our net losses were $10.0 million and $11.0 million for the three months ended April 30, 2017 and 2018, respectively.
Industry Background
Planning is a Universal, Mission-Critical Function
Every organization plans, from small businesses and nonprofits to government agencies and Fortune 500 enterprises. Within organizations, every function plans, including finance, sales, marketing and operations. An effective planning process democratizes participation across an organization, enabling managers to determine strategy, set priorities and allocate resources, while providing a real-time, single source of truth in order to monitor, evaluate and report on performance. Leveraging insights from this planning process, companies are able to make timely and better-informed decisions to drive future results.
Businesses Need to Adapt to Dynamic Markets Faster Than Ever Before
The global business environment is increasingly competitive and dynamic. The fast pace of technological development enables companies to launch and scale quickly, while requiring them to adapt to shortened product cycles and increased customer expectations. At the same time, with advances in technology, organizations of all sizes are now capturing more data than ever before. This data, however, is often locked away in siloed applications or systems of record within an organization. The relative speed with which an organization can utilize this data and adapt its plans to changing market dynamics is increasingly important as a competitive advantage.
Cloud-Based Software Has Significant Advantages
Mission-critical applications are increasingly being delivered reliably, securely and cost-effectively to customers via the cloud without the need to purchase and manage supporting hardware, or engage in costly upgrades or ongoing maintenance. More importantly, cloud-based solutions more readily facilitate real-time collaboration across the organization, which is particularly relevant to an effective planning process.
Limitations of Existing Planning Tools
Most organizations still use legacy tools, spreadsheets and manual processes for planning purposes. Existing planning tools do not allow organizations to democratize planning across the organization and give managers
87
Table of Contents
control of their direction and strategy. Legacy on-premise systems are time consuming and expensive to deploy, with only a few, highly trained users capable of using the system. These legacy systems are not easily integrated with enterprise analytics solutions, and may not be capable of providing users with real-time data and insights. In addition, spreadsheets and manual processes are error prone, do not enable collaborative planning, and are not scalable or secure. Corporate planning processes as a whole are inefficient and infrequent instead of seamless and continuous, and often result in inaccurate data being used to make strategic decisions. As a result, despite having access to more information and data, organizations are pre-occupied with a time-consuming, manual planning process and are not able to leverage the organization’s data to gain insights that can inform the strategic direction of the business.
Due to the limitations of these existing tools, businesses currently face numerous challenges with their planning processes.
| • | Business Planning is Episodic and Lacks Agility. Change is a constant in today’s business environment, and business agility is required to navigate change. To compete effectively, organizations need to have a continuous planning process in which plans are revised and adapted on an ongoing basis. However, due to the limitations of current planning tools, many organizations only engage in the planning process on an episodic basis, leading to plans that are out of date by the time they are completed. According to an Association of Finance Professionals Benchmarking Survey from October 2016, it takes a typical organization 75 days to complete its annual planning process. |
| • | Planning is Conducted in Silos with Stale Data. In order for organizations to plan effectively, teams and departments need to be able to collaborate with one another using assumptions and accurate data that are shared. However, due to the limitations of legacy tools, spreadsheets and manual processes, teams are often forced to plan in isolation, without access to a real-time, accurate or centralized source of data, leading to inconsistencies and lack of an organization-wide view. As a result, there is no single comprehensive model of the business that can be readily adjusted for the scenario analyses needed for informed, timely decision-making. |
| • | Existing Business Planning Processes are Error Prone. Legacy tools, spreadsheets and manual processes often introduce errors and delays into businesses planning processes. Multiple users operating in silos use different assumptions and different data, resulting in a lack of coordination across the organization. In addition, the often manual and time-consuming aggregation of disparate plans into an organization-wide view adds a further layer of complexity and risk to an already burdensome process. As a result, teams often need to choose between getting a plan right and getting it done. |
| • | Current Tools Do Not Effectively Provide Business Insights. Organizations need to be able to leverage their historical performance and key performance indicators, or KPIs, in order to develop informed assumptions that influence future business strategy. However, traditional legacy tools are too complicated for non-finance users, and spreadsheets and manual processes are too limited in capability. Neither of these legacy approaches provides widespread access to reliable data and analytics. As a result, businesses are unable to engage in thoughtful, informed, comprehensive planning that would continuously deliver insights across an organization. |
| • | Legacy Planning Tools are Costly and Burdensome. On-premise legacy tools typically used by enterprise customers require considerable support from dedicated IT resources or professional services for model changes, report creation, data integration and data management. Significant investments in costly professional services are also required to deploy, customize, maintain and update these legacy systems. Spreadsheets burden organizations of all sizes with manual processes that take critical business resources away from strategic tasks and focus them on low-value tasks, such as the aggregation of data. |
88
Table of Contents
The Adaptive Insights Business Planning Cloud
Our Business Planning Cloud is a flexible and scalable platform that enables and empowers planning processes, including modeling, scenario planning, monitoring, reporting and analysis. Our platform drives continuous, active planning across the organization—from business-wide financial planning and analysis, to in-depth planning for specific functions such as sales, marketing and operations. We have designed our Business Planning Cloud to enable our customers to build comprehensive models that capture the details of their businesses in real time and gain critical insights from this data, allowing them to rapidly adapt to changes in their environments. Our platform addresses the limitations of existing business planning tools and manual processes through the following key attributes:
| • | Easy. We employ a “click not code” approach as a central component of our intuitive user interface. This makes our solutions accessible for both “power” users, who use our solutions to build and maintain models, and for business users, who use our solutions to plan for their organization as well as to create and review reports and dashboards without the help of IT. We have designed our solutions to be easy to understand and use, which helps drive engagement with our platform throughout an organization. Business users are able to effectively present data and metrics directly from our visual analytics, instead of having to create cumbersome slide exhibits, and can more easily answer questions and run scenarios in real-time by drilling into the data with our data exploration capabilities. |
| • | Powerful. Our innovative, in-memory computing platform, which was built for the cloud from day one, includes a highly scalable modeling engine capable of supporting very large and complex multi-dimensional models with quintillions (1018) of cells. Our platform provides users with the flexibility to model nearly every aspect of their business and to simultaneously run virtually unlimited scenarios, enabling them to drive better decisions. Our solution combines these powerful underlying modeling capabilities with fully integrated reporting and analytics capabilities, unlocking insights for users across the organization. In addition, our platform securely integrates relevant data from across the organization, providing a comprehensive model that enables users to view and respond quickly to changes in the business. |
| • | Fast. Our platform provides rapid scenario planning allowing users to dynamically model and evaluate multiple scenarios in real time. Our solutions allow users to quickly access and utilize information from existing applications and information systems, including ERP, CRM and HCM systems, giving users a real-time view into changes in their business in order to react to change and course correct as necessary. Our self-service capabilities empower business users to schedule and manage integration from data sources across an organization without compromising data integrity or security. For example, our technology can calculate the impact of intraday changes in business metrics without batch processing, allowing users to access custom views of data to immediately understand nuanced and critical trends in the business on demand. Our cloud-based architecture enables our platform to rapidly deliver insights to all of the users within an organization. |
Key Benefits
Our solutions provide numerous benefits to our customers, including:
| • | Continuous Decision Making Through Active Planning. We enable organizations to make more informed decisions on a continuous basis, driving better business outcomes. We built our platform to facilitate active planning by utilizing centralized assumptions and drivers, and eliminating time-consuming manual processes. Through our integrated analytics engine, users can access and create ad hoc reports and analytical dashboards on an ongoing basis. The resulting insights can be used to test new scenarios and hypotheses, and take action to respond to changes in market dynamics. Our OfficeConnect product integrates with Microsoft Excel, Word and PowerPoint to enable highly formatted documents such as board presentations or quarterly reports to be updated by simply refreshing the documents with the data from Adaptive Insights with a single click, reducing the time to prepare for events, such as board meetings, from days to minutes. |
89
Table of Contents
| • | Collaborative Planning Across the Organization. We enable employees to collaborate with each other using real-time data, rather than conducting their planning processes in silos. Gartner estimates that by 2020, at least 75% of organizations will seek to improve the accuracy and actionability of financial planning and analysis by using operational data from multiple business domains. By providing ready access to accurate data, our solutions allow users to more effectively engage with stakeholders across the organization. When users no longer have to spend time debating the source or integrity of the data, they can focus on identifying critical insights and making better decisions. Additionally, our solutions include workflow and task management capabilities that facilitate a transparent, collaborative planning process, and also increase accountability across departments and business units. Within an organization, this accountability drives greater participation in and engagement with the planning process. When more users are planning, and planning in concert, the entire organization benefits. |
| • | Comprehensive Planning and Insights. Our platform enables users to build comprehensive, end-to-end financial and operational models based on their particular business drivers. These models allow users to easily adjust granular base-level assumptions such as sales headcount in a particular region or marketing expenses in a particular channel and see the real-time impact of these changes in financial outcomes and KPIs. A comprehensive planning process also must integrate relevant data from multiple systems of record, which is a key capability of our platform. Further, our platform automates the consolidation of plan inputs from different business units and pushes updated financial data and KPIs to users across the organization, enabling improved planning, reporting and collaboration. |
| • | Single Planning Platform with Unified Data. We built our cloud-based solutions to provide users with access to a single source for real-time plans and data. Our solutions eliminate manual data manipulation and aggregation, reduce errors and standardize data and assumptions across the organization. As a result, managers are able to drive strategy and insights across the organization, improving operational efficiency and effectiveness. |
| • | Eliminate Infrastructure Costs and Manual Processes. Our cloud-based architecture is simple and easy to deploy and manage, eliminating the need to install and maintain costly infrastructure hardware and software that would be necessary for an on-premise legacy deployment. In addition, our customers are able to eliminate time consuming and error prone manual processes utilized in spreadsheet-based planning approaches that create friction and waste resources during the planning cycle. |
Our Competitive Strengths
| • | Market Leadership. We are a pioneer and leader in cloud corporate performance management, or CPM, solutions. In its 2017 Magic Quadrant for Cloud Strategic Corporate Performance Management Solutions for the second consecutive year, Gartner recognized us as a Leader and positioned us the highest for Ability to Execute. We have also been named a Leader in the Forrester EPM Wave Report (2016). Additionally, we have been named a Leader in the 2017 and 2018 Nucleus Research Technology Value Matrix Reports. |
| • | Easy and Intuitive User Interface Enables Broad Applicability. Our Business Planning Cloud is a fast, powerful and scalable platform with an intuitive user interface. Our platform’s ease of use enables rapid time-to-value for our customers and collaboration between all the stakeholders involved in the planning process. We believe that our platform’s ease of use creates a competitive advantage by easing customer transition from Microsoft Excel-based processes, and driving user adoption across functions and in organizations of any size. |
| • | Large, Growing and Passionate Customer Base. With more than 3,800 customers as of April 30, 2018, we believe we have a significantly greater number of cloud customers than any of our competitors. Our customers, including our Torchbearers Community of over 2,000 members, are passionate about our solutions, which they frequently promote within their organizations and to prospective customers, and repurchase when they move to new organizations. We also gather insights from our large customer base to refine our offerings and expand use cases. |
90
Table of Contents
| • | Finance Expertise. We have developed deep domain expertise in meeting the needs of finance organizations through our initial solution, Adaptive Insights for Finance. Because finance teams are ultimately responsible for creating an integrated financial plan for the company, they play a critical and central role in the planning process. Our company was founded through the leadership of a former chief financial officer to provide a better planning solution to finance teams, and our deep expertise and credibility with finance makes us effective at meeting and anticipating the unique needs of this strategically important function. |
| • | Vertical Domain Expertise. While our solutions have broad applicability across all types of organizations, our domain expertise in certain verticals, such as software and nonprofits, increases our ability to understand industry-specific customer needs as well as to increase our sales velocity and productivity. Focused selling and tailored solutions enhance our leadership in these and other key verticals. For example, in the software vertical, 41 of the Forbes Cloud 100 companies use Adaptive Insights. We intend to offer tailored solutions for other key verticals in the future. |
| • | Independence and Interoperability. Our open architecture enables interoperability and integration with numerous software applications, back-end systems and other third-party offerings including ERP, CRM and HCM systems typically used by our customers. We offer our customers the flexibility either to use our application programming interfaces, or APIs, or our purpose-built integration framework to manage their own data integrations. These options enable seamless connections between our platform and our customers’ systems of record. |
| • | Partner Ecosystem. We have strong relationships with over 150 partners, including solution providers, systems integrators, ERP vendors and regional consulting firms. Our partnership strategy is tailored to extend our go-to-market reach and enhance our positioning in each market segment. For example, we partner with mid-market solution providers and ERP vendors to readily scale our implementation capacity and reach in a targeted manner. |
Our Market Opportunity
We believe that the market opportunity for our platform is largely untapped as we provide planning solutions for use cases where a cost-effective yet powerful solution has not been historically available. Our platform, through its ease of use, fast time to value, low total cost of ownership, capability to provide powerful insights and rapid iterative planning, uniquely addresses this greenfield opportunity. Due to the large number of companies that use spreadsheets and other manual processes today, we estimate that this opportunity is approximately $12.5 billion. We calculated this opportunity using the total number of global companies with more than 100 employees in 2017, based on independent data from S&P Global Market Intelligence, for developed countries in North America, Europe, Asia Pacific, and Latin America. We then multiplied the total number of companies by our average subscription revenues per customer for the year ended January 31, 2018. In addition, as we continue to expand our product offerings, including our Sales Planning solution, we believe that we have an opportunity to expand our addressable market by increasing the amount customers spend on their organization-wide planning capabilities.
According to IDC, the worldwide market for Enterprise Performance Management, or EPM, software is expected to grow from $4.2 billion in 2018 to $5.0 billion in 2021. We believe this generally captures the purchases by larger enterprises of legacy tools, but largely excludes the opportunity with mid-market and smaller organizations that cannot afford such tools. Within this market, the demand for on-premise software is shrinking as the acceptance of software-as-a-service, or SaaS, continues to grow. IDC estimates that the market for EPM products purchased as SaaS will be $830 million in 2018 and is expected to grow at a compound annual growth rate of 20% from 2018 to 2021. Given our cloud-based architecture, we believe that we are well-positioned to benefit from this shift to cloud-based, collaborative and integrated planning solutions.
Market opportunity estimates and growth forecasts are subject to significant uncertainty, and not every company covered by our market opportunity estimates will necessarily buy planning solutions offered by us or
91
Table of Contents
our competitors. Many of the companies used in our market opportunity estimates may choose to continue using legacy tools, spreadsheets, or manual processes in the future. Furthermore, we have historically focused our selling and marketing efforts on mid-market customers, and have focused on selling and marketing in the United States, Canada, the United Kingdom, the Nordics, Australia, New Zealand and Japan. In order for us to successfully address this broader market opportunity, we will need to successfully market and sell our planning solutions to more enterprise customers, where we have only recently made focused investments, as well as further expand our international presence. For further information regarding the limitations of our market opportunity estimates and growth forecasts, please see “Risk Factors—The estimates of market opportunity and forecasts of market growth included in this prospectus may prove to be inaccurate, and even if the market in which we compete achieves the forecasted growth, our business could fail to grow at similar rates, if at all.”
Our Growth Strategy
Our focus on democratizing planning and data access across organizations creates significant growth opportunities. Our growth strategy is focused on new customer acquisition, increasing the number of users and expanding use cases.
| • | Driving New Customer Acquisition. We have increased our customer base by more than 1,100 customers in the past two fiscal years. Even with our substantial customer base, we believe that we have a large underpenetrated opportunity with a $12.5 billion total addressable market, providing the opportunity for sustained growth. We plan to leverage our brand, innovation, ease of use and scalability to both extend our leadership position in the mid-market and to acquire new customers in international markets, the enterprise market and new verticals. |
| • | Continue International Expansion. We continue to focus on international markets as we believe there is a significant global opportunity for cloud CPM solutions. We have a direct sales presence in Australia, Canada, Ireland, Japan, New Zealand and the United Kingdom. We also offer our solutions worldwide through a network of partners. We intend to continue to grow our international revenues in the future. |
| • | Leverage Mid-Market Leadership to Grow in the Enterprise Market. We believe our leadership and experience in the mid-market, as well as the power and scalability of our platform, strongly positions us to expand our customer base more broadly in the enterprise market. For example, for fiscal 2017 and 2018, we had 420 and 468 enterprise customers that contributed $20.1 million and $24.7 million in total revenues, or 25% and 23% of our total revenues, respectively. We have formed a dedicated enterprise sales team and plan to continue to invest in our enterprise field sales to grow our share of the enterprise market. |
| • | Capitalize on Vertical Domain Expertise. While our solutions are widely applicable across all industries, we have benefited from developing a specialized go-to-market strategy for certain verticals, including software and nonprofit. In fiscal 2019, we are also focusing on business services and biotechnology. |
| • | Expanding Wallet Share of Existing Customers. We believe that we have the opportunity to expand the use of our platform within our large customer base of over 3,800 customers by increasing the number of users and use cases, as well as by introducing new solutions such as sales planning. We plan to leverage our strong customer relationships, product innovations and focused sales effort to expand wallet share within our existing customer base. |
| • | Sales Planning and Additional Solutions. Building on the success of Adaptive Insights for Finance, we recently launched Adaptive Insights for Sales, which allows sales teams to plan and optimize their territory assignments and sales capacity investment. We intend to leverage our industry experience, innovation and customer relationships to further invest in extending our platform to address additional customer use cases outside of finance and sales as we focus on democratizing actionable insights for planning across organizations. |
92
Table of Contents
| • | Expanding Footprint Across Existing Customers. We aim to increase the use of our platform by increasing the number of users and promoting additional use cases within our customers’ organizations. We capture additional revenues as our customers’ usage of our platform grows across departments and business units, providing us with an opportunity to increase the lifetime value of existing customers. We intend to continue investing in our sales team to drive increased adoption within and across our existing customers. |
Customers
Our customers include enterprise companies, both public and private, mid-market companies, and SMBs across all industries, as well as nonprofits and education and government entities. As of April 30, 2018, we had over 3,800 customers in over 50 countries. We define a customer as an entity with an active subscription agreement as of the measurement date. In situations where an organization has multiple subsidiaries, geographic locations or divisions, each group that is invoiced separately is treated as a separate customer. We consider enterprise customers as organizations with greater than 2,000 employees, mid-market customers as organizations with between 250 and 2,000 employees, and SMB customers as organizations with fewer than 250 employees.
The following table shows a representative list of our largest customers by industry category:
| Financial Services
Advance America Cash
American Family Mutual Insurance
First West Credit Union
The Guardian Life Insurance Company of America
Healthcare & Pharmaceuticals
Boston Scientific Corporation
Genesis Healthcare
Kindred at Home
Seattle Genetics, Inc.
Silverado Senior Living Holdings
Sound Physicians, Inc.
University Health Network
|
Manufacturing, Mining & Energy
Element Materials Technology Group Limited
Gulf Oil Limited Partnership
Mastercraft Boat Company, LLC
Polaris Industries
Roy Hill Holdings Pty Ltd
Sioux Steel Company
Nonprofits & Education
AAA Club Alliance
APICS
Montclair State University
Playworks Education Energized
The Leukemia & Lymphoma Society, Inc.
Retail & Hospitality
GovBerg Jewelers
Harry’s, Inc.
P.F. Chang’s China Bistro, Inc.
Steven Madden, Ltd.
The Coca-Cola Company |
Software & Technology
CarGurus, Inc.
comScore, Inc.
HubSpot, Inc.
Instructure, Inc.
Ivanti
Pegasystems Inc.
Spotify AB
Tieto Corporation
Transportation
Air Medical Group Holdings LLC
Arriva Plc
Etihad Airways P.J.S.C.
Jet Airways (India) Ltd.
Metropolitan Nashville Airport Authority
Transavia Airlines C.V. |
93
Table of Contents
Customer Case Studies
The following are representative examples of how some of our customers have benefited from deployments of our solutions:
P.F. Chang’s
Situation: With more than 400 locations, global restaurant chain P.F. Chang’s struggled with a cumbersome manual planning process that made it difficult for restaurant managers to synchronize individual restaurant plans and forecasts with those of corporate headquarters. With disjointed systems and data representing more than $1 billion in sales per year spread far and wide, an effort to implement rolling forecasts and reporting had stalled.
Solution and benefits: P.F. Chang’s implemented Adaptive Insights all the way from the corporate level down to each individual restaurant, making it easy for each location manager to use Adaptive Insights to manage their own restaurant’s budgeting, planning, and forecasting while providing the CFO visibility into the overall business. P.F. Chang’s reported the following benefits:
| • | Intuitive, accessible user interface allowed finance power users to build and maintain models while enabling managers of individual restaurants to maintain, manage, and report P&Ls through one centralized system. |
| • | Enabled a continuous planning process that reduced forecasting cycle times by 80% while creating an environment for more informed decisions. |
| • | Enabled planning models to incorporate both finance and operational KPIs. |
| • | Allowed board reports to include current, up-to-the-minute data. |
| • | Supported strategic what-if scenario planning so decision-makers could gauge success variables like promotion spend return on investment, or ROI, and the impact of changes in product availability on menu planning. |
| • | Provided self-service reporting to easily align restaurant managers, market partners, regional vice presidents, and others with a consistent set of metrics. |
Etihad Airways
Situation: Etihad Airways, the national airline of the United Arab Emirates with over $8 billion in revenues, struggled to manage its business using outdated financial planning and analysis, or FP&A, processes. Varied optimization requirements, high operational volatility, and a business structure stretching across multiple continents made its planning both complex and vital to the company’s success. Its existing systems lacked the easy business user engagement, speed of planning, and responsiveness to change the airline sought. With data stored in large, complex Excel spreadsheets or spread across Access databases, the FP&A team spent 90% of its time just gathering, validating, and reporting on data, leaving little time for the critical work of planning and analyzing, let alone making decisions.
Solution and benefits: Etihad Airways deployed Adaptive Insights to optimize its planning process, increase planning velocity, and make it easier to engage users across the organization. In addition, the airline was able to tap our cloud-native, in-memory computing platform and highly scalable multi-dimensional modeling engine to extend its use of Adaptive Insights for planning outside of finance, such as crew planning and competitive modeling. Etihad Airways reported the following benefits:
| • | Eliminated three months of data aggregation, validation, and reporting work annually. |
| • | Slashed errors in its reporting process by automating data collection. |
| • | Scaled planning across its international locations. |
94
Table of Contents
| • | Placed finance and operational planning in one centralized location to give users access to a single source for real-time, accurate data from across their organization. |
| • | Centralized rollup to quickly evaluate and incorporate changes in key macroeconomic assumptions like fuel, exchange rates, and inflation into the company’s operating plans on a rolling basis. |
| • | Created financial planning models that provide specific and detailed analysis of cost and profit drivers to increase the velocity of operational changes. |
| • | Extended use of Adaptive Insights beyond finance to examine routes, aircraft, and crew status to plan crews according to routes and number of passengers. Combined with modeling competitors’ ticket refund policies, Adaptive Insights helped identify over $30 million in savings. |
First West Credit Union
Situation: With 53 branches, approximately 225,000 members, and C$9.8 billion (US$7.5 billion) in assets, Canada-based First West Credit Union had outgrown a cumbersome, disjointed FP&A process that was the result of several mergers. Its finance team manually managed hundreds of spreadsheets, which was both time consuming and prone to errors. Monthly batch production of several hundred financial reports from its ERP system was difficult to deliver on a timely basis, impacting the ability of senior leadership and branch managers to gain visibility into business performance, make informed decisions, and take action.
Solution and benefits: The credit union turned to Adaptive Insights to eliminate manual spreadsheet planning, automate its FP&A process, and reduce budget cycle times. Automated budgeting, reporting, analytics, and data integration made its process faster and easier while enabling branch-level P&L planning. First West Credit Union reported the following benefits:
| • | Retired and replaced several hundred batch reports in the ERP system with just a few dozen reports in Adaptive Insights. |
| • | Eliminated the need to maintain and update hundreds of Excel spreadsheets for each department and location. |
| • | Cut weeks out of their planning cycle by eliminating time-consuming and error-prone manual processes. |
| • | Increased visibility into the business by being able to see sales ratios in the branches and track performance year over year. |
| • | Enabled use of treasury system data to calculate net income across all its financial products. |
| • | Provided the ability to drill into and filter transactions from its ERP system, including invoices and expense claims. |
| • | Enabled managers to generate self-service reports to proactively validate and monitor information, allowing them to course-correct early if they saw unexpected results. |
Kindred at Home
Situation: National home care provider Kindred at Home had built up a complex budget planning and reporting process due to numerous acquisitions and hundreds of locations around the country. End users were dissatisfied with an overly time-consuming budgeting process while new regulations only added complexity. Compounding matters, using Excel spreadsheets and Oracle Hyperion-based budgeting and planning software made it difficult to streamline the FP&A process without disrupting the focus on quality patient care.
Solution and benefits: Kindred at Home used Adaptive Insights to improve finance visibility, increase engagement of its budget managers, and rapidly deliver business insights while experiencing greater time-to-value. Kindred at Home reported the following benefits:
| • | Scaled adoption of Adaptive Insights throughout the company in just three months. |
95
Table of Contents
| • | Experienced an ROI of 751%, with payback in less than two months. |
| • | Realized an average annual savings of $900,000 by eliminating Oracle Hyperion license fees and consulting costs and reallocating staff to other projects. |
| • | Improved regional director productivity while reducing the corporate finance team’s time spent on consolidation and validation of company budgets. |
| • | Empowered nonfinancial managers to create forecasts specific to local markets. |
| • | Relied on Adaptive Insights’ healthcare vertical expertise to easily build acquisition models suited for the healthcare industry and quickly create financial statements. |
| • | Incorporated Adaptive Insights’ OfficeConnect to allow field finance users to generate regional monthly reports and budgets for leadership with a single click, reducing preparation time from days to minutes. |
Ivanti
Situation: Ivanti is a global provider of software for IT management with more than 2,000 employees across 36 offices in 23 countries. As a longtime Adaptive Insights for Finance customer, Ivanti successfully automated the departmental budgeting process. However, challenges on the sales planning side remained. With over 500 sales representatives, Ivanti’s sales operations team had difficulty defining and rolling up to a single quota and capacity model across its distributed business, and a lack of integration between the sales and financial models made running holistic “what-if” scenarios across multiple parts of the business next to impossible. These challenges drove Ivanti’s decision to bring the sales organization into the broader business planning fold.
Solution and benefits: Ivanti chose Adaptive Insights for Sales due to its ability to integrate sales and financial planning within one centralized, collaborative cloud-based system. Ivanti reported the following benefits:
| • | Eliminated the version control and data integrity problems associated with spreadsheets. |
| • | Reduced rollup processes from eight hours to two minutes. |
| • | Helped set balanced quotas designed to drive growth without risking attrition. |
| • | Used dashboards to see the impact to the forecast in real time of things like adding sales representatives, pushing out hire dates, and changing ramping and attrition assumptions. |
| • | Gained the ability to visually monitor coverage in real time to ensure enough quota has been deployed to hit targets. |
| • | Linked the sales capacity and personnel/operating expense model to manage both top-line growth and bottom-line profitability. |
Playworks
Situation: Playworks is a leading national nonprofit that leverages the power of play to improve children’s social and emotional health. Thus far in the 2017-2018 school year, Playworks has ensured over 800,000 kids in over 1,600 schools are experiencing safe and healthy play every day. Prior to using Adaptive Insights, the company primarily used Excel to track its various revenue streams, including government and city grants, earned income, and fundraising efforts. The complexity of planning for these disparate revenue sources and the size of the organization led to a planning process that was time-consuming, labor intensive, and episodic. Additionally, the fragile Excel-based budget process made it difficult for budget owners to collaborate and ensure accuracy.
96
Table of Contents
Solution and benefits: Playworks deployed Adaptive Insights to make planning and reporting for the nonprofit’s finance and non-finance users easier, more collaborative, and more insightful. Playworks reported the following benefits:
| • | Reduced the time required for each monthly accounting close by 5 days with rolling forecasts. |
| • | Enabled real-time forecasting and budgeting involving the corporate finance team and budget managers across 23 regions and 10 national teams. |
| • | Improved efficiency by giving the finance team the ability to quickly identify potential missing revenue or expenses. |
| • | Simplified the reporting process so finance staff can easily create custom reports within minutes. |
| • | Created reporting forecasts that could be shared with funders as a tool to secure additional future funding. |
| • | Allowed staff to quickly review forecasts and budgets over multiple years to better inform budget decisions. |
Element Materials Technology
Situation: With a global platform of laboratories and over 6,300 employees in nearly 200 facilities across over 30 countries, Element is a leading global provider of materials and product qualification testing, consulting, certification and calibration services to the aerospace, fire and building products, infrastructure, oil and gas, transportation, industrials and environmental sectors. Due to its rapid growth, Element had outgrown a planning process that involved the use of large Excel spreadsheet models to input financial plan data. This data was then loaded into its group consolidation system for reporting purposes. As the company grew, Element’s finance team found this process to be increasingly burdensome to centrally administer, and the users of the process found it less efficient. As a result, there was too much time spent preparing and consolidating data, with little time left to analyze data and add value at all levels of the organization. In addition, reporting of outputs took a significant amount of time to prepare and had to be repeatedly reconciled to ensure the data presented was the latest view.
Solution and benefits: Element has adopted Adaptive Insights for use across over 30 geographies, including all new acquisitions. This has helped unify its distributed business and scale its planning process to align with the growth of the company itself. Element reported the following key benefits:
| • | Increased cross-functional collaboration within the planning cycle. |
| • | Achieved a continuous planning and analysis process using monthly, quarterly and annual horizons to increase decision-making velocity. |
| • | Established more robust mechanics and easier central maintenance. |
| • | Created a more efficient end to end process—with significantly reduced time required to complete each cycle. |
| • | Elevated finance to become a more strategic partner in decision making for financial and operational business management by shifting focus from data collection to data review and analysis. |
| • | Gained a unified view of the organization’s financial and operational planning, along with performance measurement. |
| • | Achieved easier understanding of financial information and metrics by both finance and non-finance users through the use of the various reporting options (web reporting, OfficeConnect and Discovery dashboards). |
| • | Promoted user self-service and ad-hoc reporting due to the improved quality of reporting features. |
97
Table of Contents
| • | Enabled easy generation of automated reporting in board quality format using real-time data by utilizing Adaptive OfficeConnect. |
| • | Gained continual functionality enhancements via the quarterly update releases. |
| • | Obtained quick resolution of any issues if and when they do arise through Adaptive Support. |
Our Platform
The Adaptive Insights Business Planning Cloud addresses the challenges of today’s planning processes with an intuitive user experience that invites engagement in the planning process. The solutions built on our platform enable an active, dynamic planning process that allows organizations to monitor business and operational performance, analyze and report on performance, and use insights from analysis to drive models for projecting future performance. This active planning process provides an ongoing closed loop process for managing business performance that is more collaborative and efficient.
Our Business Planning Cloud is a scalable, in-memory platform designed to enable an active planning process for financial and operations teams across the enterprise. It enables the entire process from modeling and scenario planning to the reporting and analyses our customers need to make business decisions. Whether building a financial plan at a corporate level, the financial plans for a single division, or operational plans for a single function or department, we enable a collaborative and continuous planning process across the organization. Individual groups can plan and model their own aspects of the business at the needed level of detail, at their own cadences. These plans can then be integrated into a comprehensive model of the overall business orchestrated by finance.
We initially created our Business Planning Cloud for financial planning and analysis teams. In addition to focusing on their financial planning needs, many customers also use our flexible modeling capabilities to create models and solutions for other business problems. Examples include route profitability analysis by a major airline, marketing contract analysis by a large consumer goods manufacturer, sales and bookings planning and forecasts, and store level profitability by a restaurant chain. Building on this experience, in early 2018, we introduced a purpose-built solution on our platform for sales planning and analysis targeting sales teams.
While our platform offers customers the flexibility to build many types of models, the solutions we explicitly promote for finance and sales are bolstered by purpose-built software intelligence to make financial and sales modeling easier and faster. For example, the system natively handles common financial planning needs, such as allocating between accounts and reporting on variances, as well as displaying financial waterfalls. Over time we plan to package and promote new solutions on our platform for more customer use cases outside of finance and sales.
98
Table of Contents
Platform Components and Solutions
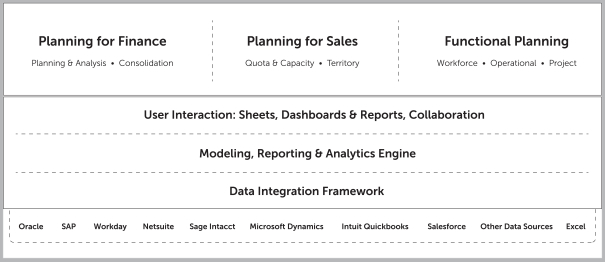
Our solutions consist of planning for finance, planning for sales and functional planning, which flexibly enables other types of business planning. Our platform has three key areas of functionality that enable all of our solutions. Our platform consists of: Data Integration Framework; Modeling, Reporting, and Analytics Engine; and the User Interaction layer for Sheets, Dashboards and Reports, and Collaboration.
Platform Components
| • | Data Integration Framework. Integrating data from systems across the organization is crucial to gaining business insights and informing models. Our platform’s Data Integration Framework offers two ways to automate data integration with ERP, CRM, HCM and other systems. We offer a purpose-built data integration user interface that enables business users to manage their data integrations themselves. We also offer open APIs so that customers can use their existing integration infrastructures. |
| • | Modeling, Reporting and Analytics Engine. The core of our platform is a highly scalable, flexible in-memory engine for modeling, reporting and analytics. With our in-memory technology, the latest data is available to customers on-demand without the need for the batch processing required by older multi-dimensional modeling technologies. Our engine enables customers to build and maintain very large and complex multi-dimensional models through the drag-and-drop user interface, and human-readable formulas without any of the scripting typically requiring IT expertise. Our platform scales to support very large and complex multi-dimensional models with quintillions (1018) of cells. Because our platform was designed to support the modeling and analytics needs in an active planning process, in addition to enabling classic multi-dimensional models, it natively enables modeling of tabular data to make workforce planning easy and intuitive. Our unique architecture enables end-user created drag-and-drop reports across multi-dimensional data without scripts or the other manual setup required by traditional architectures. |
| • | User Interaction: Sheets, Dashboards and Reports, and Collaboration |
The User Interaction layer of our platform allows our customers to interact with dashboards and reports for business insights, enter data, and collaborate with workflow and task management. For reporting and data entry, customers can access our solutions using either a web browser or Excel with our custom add-in as the user interface.
| • | Sheets. Users view and interact with their plans and models via sheets. Sheets are customer-defined for different purposes and are commonly used for planning by accounts across time |
99
Table of Contents
| periods; workforce planning by dimensions such as employee type, location or benefits plan; and planning across multiple dimensions such as products, sales regions or channels. |
| • | Comprehensive On-Demand Dashboards and Reports. End users can create, maintain and share operational and financial KPIs and insights via reports and visually intuitive dashboards. Reports and dashboards can be drilled into for deeper understanding and root cause analyses. We offer flexible ad hoc and formatted reporting on scenarios, actuals, metrics and other data with an easy-to-use, drag and drop interface that does not require script-writing. Our OfficeConnect product integrates with Microsoft Excel, Word, and PowerPoint to enable highly formatted documents such as board presentations or quarterly reports to be updated by simply refreshing the documents with the data from Adaptive Insights with a single click. |
| • | Collaboration. Our platform includes workflow and task management to enable a collaborative planning process across departments and business units. Workflow makes it easy for users to submit and approve budgets and forecasts. Task management gives teams visibility into planning and consolidation tasks and deadlines, provides visual indicators of completion, and keeps other users informed with threaded conversations. Process guides provide step-by-step walkthroughs of the planning process so occasional business users can quickly and confidently complete their planning, variance analysis, and forecasting tasks. Annotations on data cells, sheets, reports, and dashboard allow commentary connected to the data to be shared across teams. |
Solutions
| • | Planning for Finance |
| • | Financial Planning and Analysis. Our financial planning and analysis solution leverages all our platform capabilities along with purpose-built features to make financial modeling easy. This solution provides a full complement of capabilities needed to enable an active financial planning process. This includes integrated budgeting, forecasting, scenario planning, management and ad hoc reporting, dashboards and analytics, variance analysis, and process management. The purpose-built features include multiple currency management, allocation management, variance management and financial waterfalls. |
| • | Financial Consolidation. Our consolidation solution leverages all of our platform capabilities along with purpose-built features to make financial consolidation, management and highly formatted financial reporting, and process management easy. Purpose-built consolidation intelligence includes a drag and drop interface for intercompany elimination management, reclassifications, and journal entries. |
| • | Planning for Sales. Our sales solution leverages all of our platform capabilities along with purpose-built intelligence and templates to facilitate sales capacity, quota and territory planning and analysis. Quota and Capacity Planning uses purpose-built solution templates for top-down allocation of sales targets across time, regions, and segments; productivity modeling; and quota setting. Territory Planning eliminates manual manipulation of large volumes of data and includes the ability to assess and segment the market by factors like geography, company size, vertical and product. Sales plans can be integrated with financial and other functional plans for a comprehensive model of the overall business. |
| • | Functional Planning Capability. In addition to our solutions for finance and sales, our platform enables flexible modeling for additional organizational groups and use cases. For instance, we enable flexible modeling for operations, workforce, product, grant, project, marketing, facilities, profitability planning and more. All the platform capabilities, including integrated analytics, ad hoc analysis and reporting, highly formatted reporting using OfficeConnect and collaboration are available for functional planning. Functional planning models can be integrated with financial and sales plans for a comprehensive model of the overall business. |
100
Table of Contents
Our Technology
Our platform is designed to deliver a secure and high-performance experience to customers of varying sizes and complexity without sacrificing simplicity for business users. Our platform supports a high volume of client activity across diverse and globally distributed customers. Our system scales horizontally with customer and data growth. We designed our platform to handle usage spikes. Our persistent data store ensures data integrity as well as a high level of reliability. In June 2018, we plan to roll out the initial phase of our next generation technology, called Elastic Hypercube™ Technology, with release of further phases expected over the course of fiscal 2019. This patent-pending technology is expected to enhance our platform’s scalability by significantly reducing the amount of computation required and dynamically allocating resources, enabling us to support significantly larger and complex models with user-acceptable response times. We believe these capabilities are unique to our platform and will increase the value our customers derive from our products. We will continue to release new and innovative technology to differentiate our platform capabilities.
Security is integral to both the design of our platform and how we develop, test, and deploy software. As such, we maintain a robust security program in order to provide the necessary confidentiality and integrity of customer data. This program includes regular third-party examinations for security, including annual SOC 2 Type II audits. The SOC 2 report demonstrates our compliance with the AICPA’s trust service principles criteria for security, availability, confidentiality and processing integrity. In addition to such external audit activity, internal security assessments are performed on a daily basis, and we employ third-party penetration testing as part of each major release.
Our solutions are delivered on a single code base using industry standard practices and procedures to deliver a high quality and high-performance application. We utilize industry standard security and monitoring tools and procedures for the integrity and security of our infrastructure. We monitor load and system usage and intervene as necessary to maintain high performance and reliability.
We host our solutions for our customers in data centers located in the United States, Canada, Europe and Australia. All customer data is replicated between primary and secondary data centers for disaster recovery. During fiscal 2018, we maintained greater than 99.95% total availability.
Product Development
Our product development organization is responsible for the design, development and delivery of our platform. We invest heavily in research and development to continually enhance our existing solutions and rapidly bring new solutions to market. We are committed to hiring and retaining top technical talent. Our product development organization is primarily located in Palo Alto, California and Brisbane, Australia.
Our research and development expenses were $22.0 million, $23.5 million and $24.3 million in the fiscal years ended January 31, 2016, 2017 and 2018, respectively.
Our Services
We offer the following services to enable our customers’ rapid and successful implementation and adoption of our solutions:
| • | Implementation. Our implementation approach is designed for rapid and efficient deployments led by finance, sales operations, and functional experts, to help our customers manage our solutions self-sufficiently. We are focused on helping customers implement our solutions using best practices honed from our experience across our customer base. Typical projects involve configuring our solutions to address the customer’s current or desired processes, and coaching on best practices for processes, model building, and ongoing model management. Customers choose to either work with our professional services team, a regional consulting firm partner, or a software solution provider partner. |
101
Table of Contents
| • | Support. For the past five years, over 97% of customers responding to satisfaction surveys about their support issue resolution reported being satisfied with their experience. All customers have access to support resources by phone, email or through our portal as part of their subscription. We provide support principally from three support centers in North America, Europe and Asia Pacific. Software upgrades and maintenance are provided as a standard part of the subscription. |
| • | Training. We offer a variety of live, instructor-led and self-service web-based training options, and most customers elect to consume their training through our web-based learning environment. Courses cover all platform functionality and include the underlying concepts for modeling, reporting, analytics, and board reporting. |
Our Culture and Employees
At the foundation of our culture are five core values: service, innovation, collaboration, transparency and passion. Our values guide all aspects of our business operations from product development through the complete lifecycle of our relationship with our customers. Through our culture and values, we strive to create an environment where our employees can have a career-defining experience, are empowered to do their best work and serve our customers with care and integrity. In 2018, we were honored to be named as one of the Best Places to Work in the Bay Area in a survey by the San Francisco Business Times in conjunction with the Silicon Valley Business Journal and as one of the Best Workplaces in Inc.’s third annual Best Workplaces survey.
We have invested substantial time and resources in building our company’s culture, and take pride in living our values in a consistent and enduring fashion through our interactions with all members of the Adaptive Insights community—customers, partners, employees and shareholders. Our culture is built to enable customer success and serves as the foundation for the successful execution of our strategy and, as a result, is critical for our growth agenda.
As of April 30, 2018, we employed 521 people. We also engage temporary employees and consultants. None of our employees are represented by a labor union. We have not experienced any work stoppages, and we consider our relations with our employees to be very good.
Competition
The market for CPM software is competitive and rapidly evolving. Most organizations still rely on spreadsheets and manual processes. For organizations seeking a CPM solution, we compete with vendors of cloud planning software such as Anaplan, Inc., Host Analytics, Inc., Oracle Corporation (Oracle PBCS and EPBCS products) and Workday, Inc., and on-premise planning software vendors such as International Business Machines Corporation, Oracle Corporation (Oracle Hyperion) and SAP SE. We also compete in the SMB market with smaller vendors such as Centage Corporation, Prophix Software Inc. and Vena Solutions.
We believe the principal competitive factors in our market include:
| • | Ease of use |
| • | Rapid time to value |
| • | Flexible and powerful modeling |
| • | Integrated planning analytics |
| • | Large customer base and high customer satisfaction |
| • | Scalable platform built for the cloud |
| • | Integration with third party transaction systems of record |
| • | Total cost of ownership |
102
Table of Contents
| • | Innovation and responsiveness to customer needs |
| • | Brand recognition |
| • | Security |
| • | Finance and vertical domain expertise |
We believe that we compete favorably on the basis of each of these factors, as our Business Planning Cloud offers an intuitive, accessible user interface to facilitate wide adoption across the organization; a highly scalable modeling engine with integrated analytics; lower total cost of ownership and shorter deployment times than on-premise systems; and easy integration with systems from across the organization to provide real-time, accurate data. In addition, our base of over 3,800 customers spans many industries, through which we have acquired domain expertise in key industry verticals.
Sales and Marketing
We sell our solutions through our direct sales force and our partner network. We have separate sales teams dedicated to each of the markets we serve. Our mid-market sales team focuses on selling our solutions to mid-market businesses through a combination of inside and field sales, and our SMB team sells primarily through inside sales. Our recently-expanded enterprise field sales team focuses on selling our solutions to large organizations. We also focus on expanding the number of use cases and users within an organization and up-selling additional features through an account management team. Our direct sales force leverages our relationships with global and regional systems integrators, ERP providers and software implementation consultants, many of which have built practices around Adaptive Insights. In global regions without a direct sales presence, we sell our solutions solely through our partner network.
Our customer success and customer sales teams are committed to helping customers successfully extend their use of our platform. This includes helping customers define a roadmap for modeling additional aspects of their business, involving more people in the planning process, and helping customers use additional software features. The customer success team also facilitates the subscription renewal process.
Our marketing efforts are focused on creating sales leads, establishing and extending our brand proposition, generating brand and product awareness, and cultivating our community of users. We generate sales leads primarily through search engine marketing, outbound marketing programs, local direct and joint partner events, outbound lead generation, referrals, and our network of business services partners.
Our annual Adaptive Live user conference connects customers and prospects, disseminates best practices, helps customers further adopt our platform, reinforces our brand, and strengthens our user community. Our Torchbearers Community of more than 2,000 financial and business professionals is an active online forum in which users can access best practice resources, gain peer networking opportunities and offer feedback.
Intellectual Property
We rely on a combination of trade secrets, patents, copyrights and trademarks, as well as contractual protections, to establish and protect our intellectual property rights. While we have applied for patent protection for some of our intellectual property, and we actively seek patent protection covering inventions originating from our company, we do not believe that we are materially dependent on any one or more of our patents. We pursue the registration of domain names, trademarks and service marks in the United States and in various jurisdictions outside the United States.
We control access to and use of our proprietary technology and other confidential information through the use of internal and external controls, including contractual protections with employees, contractors, customers and partners, and our software is protected by U.S. and international intellectual property laws. We require our employees, consultants and other third parties to enter into confidentiality and proprietary rights agreements and
103
Table of Contents
control access to software, documentation and other proprietary information. Our policy is to require employees and independent contractors to sign agreements assigning to us any inventions, trade secrets, works of authorship, developments and other processes generated by them on our behalf and agreeing to protect our confidential information. In addition, we generally enter into confidentiality agreements with our vendors and customers.
Although we rely on intellectual property rights, including trade secrets, patents, copyrights and trademarks, as well as contractual protections to establish and protect our proprietary rights, we believe that factors such as the technological and creative skills of our personnel, creation of new modules, features and functionality, and frequent enhancements to our platform are more essential to establishing and maintaining our technology leadership position.
Facilities
Our corporate headquarters is located in Palo Alto, California, and consists of approximately 30,000 square feet of space under a lease that expires in October 2018.
We also have office locations in San Francisco, California; Texas; Florida; Massachusetts; Colorado; Illinois; Queensland, Australia; and Reading, United Kingdom. We expect to expand our facilities capacity, including at our corporate headquarters and in certain field locations, during the fiscal year ending January 31, 2019. We may further expand our facilities capacity beyond January 31, 2019. We believe that we will be able to obtain additional space on commercially reasonable terms.
Regulatory
The legal environment of cloud-based businesses is evolving rapidly in the United States and elsewhere. The manner in which existing laws and regulations are applied in this environment, and how they will relate to our business in particular, is often unclear, including with respect to such topics as data privacy and security, taxation and intellectual property ownership and infringement both in the United States and internationally.
Our customers, and those with whom they communicate using our applications, upload to and store customer data in our platform. This presents legal challenges to our business and operations, such as rights of privacy or intellectual property rights. Both in the United States and internationally, we must monitor and comply with a wide variety of laws and regulations regarding the data stored and processed on our platform as well as the operation of our business.
In particular, data privacy and security with respect to the collection of personal data continues to be the focus of worldwide legislation and regulation. In recent years, there have been a number of well-publicized data breaches involving the unauthorized use and disclosure of individuals’ personal data.
Many states have responded to these incidents by enacting laws requiring holders of personal data to maintain safeguards and to take certain actions in response to a data breach, such as providing prompt notification of the breach to affected individuals and state officials or amending existing laws to expand compliance obligations. Federal laws are also under consideration that may create additional compliance obligations and penalties. In the European Union, where companies must meet specified privacy and security standards, the Data Protection Directive and data protection laws of each of the European Member countries require comprehensive information privacy and security protections for consumers with respect to personal data collected about them. The European Union, or EU, and the United States recently agreed to a framework for data transferred from the EU to the United States, called the Privacy Shield, but this new framework has been challenged by private parties and may face additional challenges by national regulators or additional private parties. Additionally, in 2016 the EU adopted a new regulation governing data privacy called the General Data Protection Regulation, or GDPR, which became effective in May 2018. The GDPR establishes new requirements applicable to the handling of personal data and imposes penalties for non-compliance of up to 4% of worldwide annual turnover or 20 million euro, whichever is higher.
104
Table of Contents
Legal Proceedings
From time to time, we are involved in various legal proceedings arising from the normal course of business activities. We are not presently a party to any litigation the outcome of which, we believe, if determined adversely to us, would individually or taken together have a material adverse effect on our business, operating results, cash flows or financial condition.
105
Table of Contents
Executive Officers, Other Executive Management and Directors
The following table sets forth information for our executive officers, other executive management and directors as of May 29, 2018:
| Name |
Age |
Position | ||||
| Executive Officers |
||||||
| Thomas F. Bogan |
66 | Chief Executive Officer and Director | ||||
| Frederick M. Gewant |
54 | Chief Revenue Officer | ||||
| Bhaskar Himatsingka |
48 | Chief Product Officer | ||||
| James D. Johnson |
61 | Chief Financial Officer | ||||
| Other Executive Management |
||||||
| Constance A. DeWitt |
56 | Chief Marketing Officer | ||||
| Robert S. Hull |
51 | Co-Founder and Director | ||||
| Amy L. Reichanadter |
49 | Chief People Officer | ||||
| Melanie D. Vinson |
48 | General Counsel and Secretary | ||||
| Non-Employee Directors |
||||||
| Jean M. Halloran |
65 | Director | ||||
| James F. Kelliher |
58 | Director | ||||
| Terry L. Opdendyk |
70 | Director | ||||
| Mark B. Templeton |
65 | Chairman | ||||
| Jill A. Ward |
58 | Director | ||||
Executive Officers
Thomas F. Bogan. Mr. Bogan has served as our Chief Executive Officer and as a member of our board of directors since January 2015. Mr. Bogan has served as a member of the board of directors of Apptio, Inc., a developer of SaaS-based technology business management solutions, since November 2007, and as the Chairman since February 2012. Mr. Bogan also served as a member of the board of directors of Citrix Systems, Inc., a global provider of virtualization, mobility management, networking and SaaS solutions, from January 2003 to June 2016, as the Chairman from May 2005 to July 2015, and as the lead independent director from July 2015 to June 2016. Mr. Bogan served as a member of the board of directors of PTC, Inc., a product development software company, from August 2011 to June 2015 and as a member of the board of directors of Rally Software Development Corp., a provider of cloud-based solutions for managing agile software development, from December 2009 to July 2015. From May 2004 to December 2014, Mr. Bogan served as a Partner of Greylock Partners, a venture capital firm. Previously, Mr. Bogan served as President of Rational Software, an S&P 500 enterprise software company, as President and Chief Executive Officer of two early stage technology companies, as director of various privately held companies, and as a trustee of Stonehill College. Mr. Bogan holds a B.S.B.A. in Accounting from Stonehill College.
Mr. Bogan was selected to serve on our board of directors because of the experience and perspective he provides as our Chief Executive Officer, as well as his extensive experience with technology companies.
Frederick M. Gewant. Mr. Gewant has served as our Chief Revenue Officer since October 2016. From March 2015 to September 2016, Mr. Gewant served as Executive Vice President, Worldwide Sales at SugarCRM Inc., a customer relationship management solution provider. From August 2011 to March 2015, Mr. Gewant served as Vice President, West US, IBM Software Group of International Business Machines Corporation, a multinational technology company. Mr. Gewant holds a B.S. in Business Administration from San Diego State University.
106
Table of Contents
Bhaskar Himatsingka. Mr. Himatsingka has served as our Chief Product Officer since May 2016. From May 2014 to April 2016, Mr. Himatsingka served as Chief Technology Officer of Change Healthcare Corp., a healthcare technology company. From March 2007 to June 2013, Mr. Himatsingka served as Chief Technology Officer of Ariba Inc., a provider of cloud-based collaborative commerce applications that was acquired in October 2012 by SAP SE, an enterprise applications software company. Mr. Himatsingka holds a Bachelor of Technology in Computer Science from the Indian Institute of Technology, Kanpur and an M.S. in Computer Science from the University of Minnesota.
James D. Johnson. Mr. Johnson has served as our Chief Financial Officer since January 2016. From May 2014 to November 2015, Mr. Johnson served as Chief Financial Officer of TIBCO Software Inc., a provider of infrastructure and business intelligence software that was acquired in December 2014 by Vista Equity Partners, a private equity and venture capital firm. From March 2011 to April 2014, Mr. Johnson served as Chief Financial Officer of Japsersoft Corporation, a provider of business intelligence software that was acquired in April 2014 by TIBCO. Mr. Johnson holds a B.A. in English and Literature/Letters from the University of Minnesota and an M.B.A. from the University of Chicago.
Other Executive Management
Constance A. DeWitt. Ms. DeWitt has served as our Chief Marketing Officer since February 2018. From October 2017 to February 2018, Ms. DeWitt served as our Interim Chief Marketing Officer and our Vice President of Strategic Initiatives, Marketing, and from September 2011 to August 2016, Ms. DeWitt served in various product management leadership roles in our company. Ms. DeWitt holds a B.E.E., Bachelor of Electrical Engineering from the Georgia Institute of Technology.
Robert S. Hull. Mr. Hull is our co-founder, has served in multiple operational roles at the company, and has served on our board of directors since May 2003, including as Chairman of our board of directors from October 2003 to March 2005 and from July 2014 to April 2018. Prior to founding Adaptive Insights, Mr. Hull served as Chief Financial Officer of LoopNet, Inc., an online marketplace for commercial real estate sales and leasing. Mr. Hull holds a B.A. in Economics from Stanford University.
Mr. Hull was selected to serve on our board of directors because of the experience and perspective he provides as our co-founder and as a former chief financial officer.
Amy L. Reichanadter. Ms. Reichanadter has served as our Chief People Officer since December 2013. From April 2005 to November 2013, Ms. Reichanadter served as Senior Vice President, Human Resources of E2open Inc., a provider of cloud-based on-demand software for supply chains. Ms. Reichanadter holds a B.A. in Psychology from the University of California, Los Angeles, an M.A. in Counseling Psychology from Santa Clara University, and a PhD in Clinical Psychology from Palo Alto University.
Melanie D. Vinson. Ms. Vinson has served as our General Counsel and Secretary since October 2017. From January 2012 to October 2017, Ms. Vinson served as Deputy General Counsel of Workday, Inc., a provider of financial management and human capital management software. Ms. Vinson currently serves on the board of directors of the Law Foundation of Silicon Valley, a nonprofit organization. Ms. Vinson holds a B.A. in Economics and a J.D. from the University of California, Los Angeles and an M.B.A. from the University of California, Berkeley.
Non-Employee Directors
Jean Halloran. Ms. Halloran has served as a member of our board of directors since April 2018. Since October 2014, Ms. Halloran has served as a director of Keysight Technologies, Inc., an electronic test and measurement equipment company. From August 1999 through October 2014, Ms. Halloran served as Senior Vice President of Human Resources of Agilent Technologies, Inc., a global life sciences, diagnostics and applied
107
Table of Contents
chemical solutions provider. Prior to 1999, Ms. Halloran served as Director of Education and in various senior Human Resources roles at Hewlett-Packard Company, a global leader in enterprise technology. She also serves as a trustee of the Canterbury Shaker Village, a nonprofit organization, and is a director of the National Academy of Human Resources. Ms. Halloran holds a B.A. in Art History from Princeton University and an M.B.A. from Harvard Business School.
Ms. Halloran was selected to serve on our board of directors because of her operational experience and experience in the technology industry.
James F. Kelliher. Mr. Kelliher has served as a member of our board of directors since July 2014. Since January 2018, Mr. Kelliher has served as Chief Financial Officer of Drift.com, Inc., a conversational marketing and sales platform provider. From January 2015 to December 2017, Mr. Kelliher served as Chief Financial Officer of Actifio, Inc., an information technology firm. From June 2006 to January 2015, Mr. Kelliher served as Chief Financial Officer of LogMeIn, Inc., a provider of SaaS-based remote access, support, and collaboration solutions. From February 2012 until November 2016, Mr. Kelliher served on the board of directors of Fleetmatics Group PLC, a provider of mobile workforce solutions. Mr. Kelliher holds a B.S. in Accountancy from Bentley University.
Mr. Kelliher was selected to serve on our board of directors because of his experience in the technology industry and as a chief financial officer.
Terry L. Opdendyk. Mr. Opdendyk has served as a member of our board of directors since September 2003. Mr. Opdendyk co-founded ONSET Ventures, a venture capital firm, and has served as the managing director and/or general partner of all of its funds since ONSET’s formation in 1984. Since 2004, Mr. Opdendyk has been a member of the faculty at the University of California, Berkeley, Haas School of Business, teaching venture capital, entrepreneurship and innovation. Mr. Opdendyk currently serves on the boards of directors of a number of privately held companies. Mr. Opdendyk holds a B.S. in Computer Science from Michigan State University and an M.S. in Computer Science from Stanford University.
Mr. Opdendyk was selected to serve on our board of directors because of his decades of experience advising technology-based startup companies.
Mark B. Templeton. Mr. Templeton has served as a member of our board of directors since January 2016 and has served as the Chairman of our board of directors since April 2018. From June 2001 to October 2015, Mr. Templeton served as Chief Executive Officer of Citrix Systems, Inc., a global provider of virtualization, mobility management, networking and SaaS solutions, and as President and a member of the board of directors from January 1998 to October 2015. Mr. Templeton has served on the boards of directors of Equifax Inc., an information services company, since February 2008, KeySight Technologies, Inc., a manufacturer of electronics test and measurement equipment and software, since December 2015, and Arista Networks, Inc., a provider of software-driven cloud networking solutions, since June 2017. Mr. Templeton holds a B.A. in Product Design from North Carolina State University and an M.B.A. from the Darden School of Business at the University of Virginia.
Mr. Templeton was selected to serve on our board of directors because of his operating experience, leadership and perspective in business strategy and operations, as well as his experience serving on the boards of directors of technology companies.
Jill A. Ward. Ms. Ward has served as a member of our board of directors since May 2018. Ms. Ward served as President and Chief Operating Officer of Fleetmatics Group PLC, a provider of mobile workforce solutions, from April 2015 until Fleetmatics’ acquisition by Verizon in November 2016. At Verizon, she led Fleetmatics and then served as integration advisor until April 2017. Prior to Fleetmatics, from August 2001 to March 2014, Ms. Ward served as Vice President and then Senior Vice President and General Manager at Intuit Inc., a global
108
Table of Contents
provider of SaaS offerings for small businesses and consumers. From October 2017 to the present, Ms. Ward has served on the board of directors of HubSpot, Inc., a provider of CRM, marketing, sales, and customer experience solutions, and from December 2014 to the present, has served on the board of directors of the MicroLoan Foundation USA, a nonprofit organization. Ms. Ward holds a B.A. from Wellesley College and an M.B.A. from the Amos Tuck School of Business Administration at Dartmouth College.
Ms. Ward was selected to serve on our board of directors because of her operational experience and experience in the technology industry.
Composition of Our Board of Directors
Our business and affairs are managed under the direction of our board of directors. We currently have seven directors. Our current directors will continue to serve as directors until their resignation, removal or successor is duly elected.
Our board of directors may establish the authorized number of directors from time to time by resolution. In accordance with our amended and restated certificate of incorporation that will be in effect on the completion of this offering, immediately after this offering our board of directors will be divided into three classes with staggered three-year terms. At each annual general meeting of stockholders, the successors to directors whose terms then expire will be elected to serve from the time of election and qualification until the third annual meeting following election. Our directors will be divided among the three classes as follows:
| • | the Class I directors will be Terry L. Opdendyk and Mark B. Templeton, and their terms will expire at our first annual meeting of stockholders following this offering; |
| • | the Class II directors will be Jean M. Halloran and Robert S. Hull, and their terms will expire at our second annual meeting of stockholders following this offering; and |
| • | the Class III directors will be Thomas F. Bogan, James F. Kelliher and Jill A. Ward, and their terms will expire at our third annual meeting of stockholders following this offering. |
We expect that any additional directorships resulting from an increase in the number of directors will be distributed among the three classes so that, as nearly as possible, each class will consist of one third of the directors. The division of our board of directors into three classes with staggered three-year terms may delay or prevent a change of our management or a change in control.
Director Independence
Our board of directors has undertaken a review of the independence of each director. Based on information provided by each director concerning his background, employment and affiliations, our board of directors has determined that Ms. Halloran, Mr. Kelliher, Mr. Opdendyk, Mr. Templeton and Ms. Ward do not have relationships that would interfere with the exercise of independent judgment in carrying out the responsibilities of a director and that each of these directors is “independent” as that term is defined under the listing standards. In making these determinations, our board of directors considered the current and prior relationships that each non-employee director has with our company and all other facts and circumstances our board of directors deemed relevant in determining their independence, including the beneficial ownership of our shares by each non-employee director and the transactions described in the section titled “Certain Relationships and Related Party Transactions.”
Committees of Our Board of Directors
Our board of directors has established an audit committee, a compensation committee, and a nominating and governance committee. The composition and responsibilities of each of the committees of our board of directors
109
Table of Contents
are described below. Members serve on these committees until their resignation or until otherwise determined by our board of directors. Our board of directors may establish other committees as it deems necessary or appropriate from time to time.
Audit Committee
Our audit committee consists of Mr. Kelliher, Mr. Templeton and Ms. Ward. Our board of directors has determined that each member of the audit committee satisfies the independence requirements under the listing standards of the NYSE and Rule 10A-3(b)(1) of the Exchange Act. The chair of our audit committee is Mr. Kelliher. Our board of directors has determined that each of Mr. Kelliher and Mr. Templeton is an “audit committee financial expert” within the meaning of SEC regulations. Each member of our audit committee can read and understand fundamental financial statements in accordance with applicable requirements. In arriving at these determinations, our board of directors has examined each audit committee member’s scope of experience and the nature of their employment.
The primary purpose of the audit committee is to discharge the responsibilities of our board of directors with respect to our corporate accounting and financial reporting processes, systems of internal control and financial statement audits, and to oversee our independent registered public accounting firm. Specific responsibilities of our audit committee include:
| • | helping our board of directors oversee our corporate accounting and financial reporting processes; |
| • | managing the selection, engagement, qualifications, independence and performance of a qualified firm to serve as the independent registered public accounting firm to audit our financial statements; |
| • | discussing the scope and results of the audit with the independent registered public accounting firm, and reviewing, with management and the independent accountants, our interim and year-end operating results; |
| • | developing procedures for employees to submit concerns anonymously about questionable accounting or audit matters; |
| • | reviewing related person transactions; |
| • | obtaining and reviewing a report by the independent registered public accounting firm at least annually that describes our internal quality control procedures, any material issues with such procedures and any steps taken to deal with such issues when required by applicable law; |
| • | approving or, as permitted, pre-approving, audit and permissible non-audit services to be performed by the independent registered public accounting firm; |
| • | overseeing the design, implementation, organization and performance of our internal audit function, when applicable; |
| • | overseeing our compliance with legal and regulatory requirements; |
| • | reviewing reports or disclosures required by applicable rules and regulations of the SEC; and |
| • | reviewing major financial risk exposures and the steps management has taken to monitor and control those exposures. |
Our audit committee will operate under a written charter, to be effective prior to the completion of this offering, that satisfies the applicable listing standards of the NYSE.
Compensation Committee
Our compensation committee consists of Ms. Halloran, Mr. Opdendyk and Mr. Templeton. The chair of our compensation committee is Mr. Opdendyk. Our board of directors has determined that each member of the compensation committee is independent under the listing standards of the NYSE, and a “non-employee director” as defined in Rule 16b-3 promulgated under the Exchange Act.
110
Table of Contents
The primary purpose of our compensation committee is to discharge the responsibilities of our board of directors in overseeing our compensation policies, plans and programs and to review and determine the compensation to be paid to our executive officers, directors and other senior management, as appropriate. Specific responsibilities of our compensation committee include:
| • | reviewing and recommending to our board of directors the compensation of our chief executive officer and other executive officers; |
| • | reviewing and recommending to our board of directors the compensation of our directors; |
| • | appointing and overseeing the work of compensation advisors; |
| • | administering our equity incentive plans and other benefit programs; |
| • | reviewing, adopting, amending and terminating incentive compensation and equity plans, severance agreements, bonus plans, and any other compensatory arrangements for our executive officers and other senior management; |
| • | reviewing and establishing general policies relating to compensation and benefits of our employees, including our overall compensation philosophy; and |
| • | preparing the report of compensation committee as required by the rules and regulations of the SEC. |
Our compensation committee will operate under a written charter, to be effective prior to the completion of this offering, that satisfies the applicable listing standards of the NYSE.
Nominating and Governance Committee
Our nominating and governance committee consists of Ms. Halloran and Mr. Templeton. The chair of our nominating and governance committee is Mr. Templeton. Our board of directors has determined that each member of the nominating and governance committee is independent under the listing standards of the NYSE.
Specific responsibilities of our nominating and governance committee include:
| • | identifying and evaluating candidates, including the nomination of incumbent directors for reelection and nominees recommended by stockholders, to serve on our board of directors; |
| • | considering and making recommendations to our board of directors regarding the composition and chairmanship of the committees of our board of directors; |
| • | developing and making recommendations to our board of directors regarding corporate governance guidelines and matters; |
| • | overseeing periodic evaluations of the board of directors’ performance, including committees of the board of directors; and |
| • | reviewing the disclosure included in our proxy statement regarding our director nomination process and other corporate matters. |
Our nominating and governance committee will operate under a written charter, to be effective prior to the completion of this offering, that satisfies the applicable listing standards of the NYSE.
Code of Business Conduct and Ethics
We have adopted a code of business conduct and ethics that applies to our directors, officers and employees, including our principal executive officer, principal financial officer, principal accounting officer or controller, or persons performing similar functions. Upon the completion of this offering, our code of business conduct and ethics will be available under the Corporate Governance section of our website at www.adaptiveinsights.com. In
111
Table of Contents
addition, we intend to post on our website all disclosures that are required by law or the listing standards of the NYSE concerning any amendments to, or waivers from, any provision of the code. The reference to our website address does not constitute incorporation by reference of the information contained at or available through our website, and you should not consider it to be a part of this prospectus.
Compensation Committee Interlocks and Insider Participation
None of the members of the compensation committee is currently or has been at any time one of our officers or employees. None of our executive officers currently serves, or has served during the last year, as a member of the board of directors or compensation committee of any entity that has one or more executive officers serving as a member of our board of directors or compensation committee.
Director Compensation
The following table sets forth information regarding the compensation earned or paid to our directors during the year ended January 31, 2018, other than Thomas F. Bogan, our Chief Executive Officer, who is also a member of our board of directors but did not receive any additional compensation for service as a director. The compensation of Mr. Bogan as a named executive officer is set forth below under “Executive Compensation—Summary Compensation Table.” The table below also includes information regarding the compensation earned or paid to Robert Hull, our Co-Founder, who is an employee and also a member of our board of directors. Mr. Hull did not receive any additional compensation for service as a director.
| Name |
Fees Earned or Paid in Cash ($) |
Option Awards ($)(1) |
Non-Equity Incentive Plan Compensation ($)(2) |
Total ($) |
||||||||||||
| Robert Antoniades(3) |
— | — | — | — | ||||||||||||
| Byron B. Deeter(4) |
— | — | — | — | ||||||||||||
| Robert S. Hull(5) |
300,000 | 146,342 | 207,000 | 653,342 | ||||||||||||
| James F. Kelliher(6) |
25,000 | — | — | 25,000 | ||||||||||||
| Sergio J. Monsalve(7) |
— | — | — | — | ||||||||||||
| Terry L. Opdendyk |
— | — | — | — | ||||||||||||
| Mark B. Templeton(8) |
— | — | — | — | ||||||||||||
| (1) | The amounts reported represent the aggregate grant date fair value of the stock options granted to our director during 2017 under our 2013 Plan, computed in accordance with Financial Accounting Standard Board Accounting Standards Codification, Topic 718, or ASC Topic 718. The assumptions used in calculating the grant date fair value of the stock options reported in this column are set forth in Note 11 to the notes to our consolidated financial statements included elsewhere in this prospectus. This amount does not reflect the actual economic value that may be realized by the non-employee director. |
| (2) | The amounts disclosed represent the amounts earned in fiscal 2018 under our Fiscal Year 2018 Executive Incentive Plan. |
| (3) | Mr. Antoniades resigned from our board of directors on April 19, 2018. |
| (4) | Mr. Deeter resigned from our board of directors on April 19, 2018. |
| (5) | As of January 31, 2018, Mr. Hull held options to purchase a total of 638,542 shares of our common stock, which consisted of: (i) an option to purchase 125,000 shares at an exercise price of $0.76 per share, all of which are vested, and of which 91,145 shares have been exercised; (ii) an option to purchase 175,000 shares at an exercise price of $0.76 per share, all of which are vested, and of which 120,312 shares have been exercised; (iii) an option to purchase 50,000 shares at an exercise price of $0.92 per share, all of which are vested; (iv) an option to purchase 62,500 shares at an exercise price of $1.12 per share, all of which are vested; (v) an option to purchase 249,999 shares at an exercise price of $4.24 per share, 1/48 of which vested on August 1, 2014, and 1/48 of which vest monthly thereafter, subject to his continued service to us through each such date; (vi) an option to purchase 87,500 shares at an exercise price of $4.40 per share, 1/48 |
112
Table of Contents
| of which vested on August 1, 2015, and 1/48 of which vest monthly thereafter, subject to his continued service to us through each such date; (vii) an option to purchase 37,500 shares at an exercise price of $4.60 per share, 1/48 of which vested on August 1, 2016, and 1/48 of which vest monthly thereafter, subject to his continued service to us through each such date; (viii) an option to purchase 62,500 shares at an exercise price of $5.64 per share, 1/48 of which vested on August 1, 2017, and 1/48 of which vest monthly thereafter, subject to his continued service to us through each such date. |
| (6) | As of January 31, 2018, Mr. Kelliher held an option to purchase a total of 75,000 shares of our common stock at an exercise price of $3.40 per share, 1/48 of which vested on September 19, 2014, and 1/48 of which vest monthly thereafter, subject to his continued service to us through each such date. |
| (7) | Mr. Monsalve resigned from our board of directors on April 19, 2018. |
| (8) | As of January 31, 2018, Mr. Templeton held an option to purchase a total of 125,000 shares of our common stock at an exercise price of $4.40 per share, 1/48 of which vested on February 24, 2016, and 1/48 of which vest monthly thereafter, subject to his continued service to us through each such date. |
In May 2018, our board of directors approved a director compensation policy for non-employee directors, which will become effective in connection with this offering. Pursuant to this policy, our non-employee directors will receive the following compensation:
Cash Compensation
Each non-employee director will be entitled to receive the following cash compensation for services on our board and its committees as follows:
| • | $30,000 annual cash retainer for service as a member of our board of directors; |
| • | $20,000 annual cash retainer for service as chair of the audit committee and $8,000 annual cash retainer for service as a member of the audit committee; |
| • | $10,500 annual cash retainer for service as chair of the compensation committee and $5,000 annual cash retainer for service as a member of the compensation committee; |
| • | $7,500 annual cash retainer for service as chair of the nominating and governance committee and $3,500 annual cash retainer for service as a member of the nominating and governance committee; and |
| • | $20,000 annual cash retainer for service as chairman of our board of directors. |
Equity Compensation
In addition, any person who is elected or appointed as a non-employee director for the first time after this offering will receive an initial equity award with a target value of $300,000 in the form of restricted stock units, or RSUs, vesting annually over a three-year period. Further, each non-employee director will also receive an annual refresh RSU grant with a target value of $150,000, which we expect will vest in full prior to the annual meeting of stockholders following the grant date. All grants made to our non-employee directors under this policy will vest in full upon the completion of a change of control.
113
Table of Contents
Our named executive officers, consisting of our principal executive officer, the next two most highly compensated executive officers, and our principal financial and accounting officer, as of January 31, 2018, were:
| • | Thomas F. Bogan, our Chief Executive Officer; |
| • | Frederick M. Gewant, our Chief Revenue Officer; |
| • | Bhaskar Himatsingka, our Chief Product Officer; and |
| • | James D. Johnson, our Chief Financial Officer. |
Summary Compensation Table
The following table sets forth information concerning the compensation of our named executive officers during fiscal 2018:
| Name and Principal Position |
Fiscal Year | Salary ($) |
Option Awards ($)(1) |
Non-Equity Incentive Plan Compensation ($)(2) |
Total ($) |
|||||||||||||||
| Thomas F. Bogan |
2018 | 300,000 | — | 138,000 | 438,000 | |||||||||||||||
| Chief Executive Officer |
||||||||||||||||||||
| Frederick M. Gewant |
2018 | 300,000 | — | 379,500 | 679,500 | |||||||||||||||
| Chief Revenue Officer |
||||||||||||||||||||
| Bhaskar Himatsingka |
2018 | 320,000 | 182,628 | 176,640 | 679,268 | |||||||||||||||
| Chief Product Officer |
||||||||||||||||||||
| James D. Johnson |
2018 | 300,000 | — | 207,000 | 507,000 | |||||||||||||||
| Chief Financial Officer |
||||||||||||||||||||
| (1) | The amounts disclosed represent the aggregate grant date fair value of the stock options granted to our named executive officers during fiscal 2018 under our 2013 Plan, computed in accordance with ASC Topic 718. The assumptions used in calculating the grant date fair value of the stock options are set forth in the notes to our audited consolidated financial statements included elsewhere in this prospectus. This amount does not reflect the actual economic value that may be realized by the named executive officer. |
| (2) | The amounts disclosed represent the amounts earned in fiscal 2018 under our Fiscal Year 2018 Executive Incentive Plan. |
Nonqualified Deferred Compensation
Our named executive officers did not participate in, or earn any benefits under, a non-qualified deferred compensation plan sponsored by us during fiscal 2018.
Fiscal Year 2018 Executive Incentive Plan
We maintain the Fiscal Year 2018 Executive Incentive Plan, or the 2018 Incentive Plan, which provides for the opportunity to earn cash bonuses with respect to the performance period beginning on January 1, 2017 and ending on January 31, 2018. Such bonuses are paid based on achievement of corporate performance goals over the performance period, with payments scheduled to be made on March 30, 2018. The amounts shown in the column entitled “Non-Equity Incentive Plan Compensation” of the Summary Compensation Table above represent the amounts earned in fiscal 2018 under the 2018 Incentive Plan. A participant must be employed by us on such date to receive payment of a bonus under the 2018 Incentive Plan.
114
Table of Contents
Agreements with our Named Executive Officers and Potential Payments Upon Termination or Change of Control
Below are descriptions of our employment agreements with our named executive officers. The agreements generally provide for at-will employment and set forth the named executive officer’s initial base salary, eligibility for employee benefits and severance benefits upon a qualifying termination of employment. Furthermore, each of our named executive officers has executed a form of our standard proprietary information and inventions assignment agreement. The key terms of the employment agreements with our named executive officers, including potential payments upon termination or change of control, are described below.
Thomas F. Bogan
We have entered into a confirmatory employment agreement with Thomas F. Bogan, our Chief Executive Officer. The confirmatory employment agreement has no specific term and provides for at-will employment. Mr. Bogan’s current annual base salary is $300,000, and his current target annual bonus is $100,000.
Frederick M. Gewant
We have entered into a confirmatory employment agreement with Frederick Gewant, our Chief Revenue Officer. The confirmatory employment agreement has no specific term and provides for at-will employment. Mr. Gewant’s current annual base salary is $300,000, and his current target annual bonus is $275,000.
Bhaskar Himatsingka
We have entered into a confirmatory employment agreement with Bhaskar Himatsingka, our Chief Product Officer. The confirmatory employment agreement has no specific term and provides for at-will employment. Mr. Himatsingka’s current annual base salary is $320,000, and his current target annual bonus is $128,000.
James D. Johnson
We have entered into a confirmatory employment agreement with James Johnson, our Chief Financial Officer. The confirmatory employment agreement has no specific term and provides for at-will employment. Mr. Johnson’s current annual base salary is $300,000, and his current target annual bonus is $150,000.
Potential Payments upon Termination or Change of Control
Each of our named executive officers is eligible to receive the following severance benefits pursuant to our Executive Severance and Change in Control Policy, or severance policy, which is incorporated by reference into each executive’s confirmatory employment agreement. Upon a termination of employment by us without “cause” or by the executive for “good reason,” each as defined in the severance policy, the executive will receive six months of base salary; six months of health plan benefits under COBRA; and a pro rata target bonus. If the termination occurs within three months before or 12 months after a change in control (as defined in the severance policy), Mr. Bogan will receive nine months of salary and health plan benefits rather than six months, and all of the executives will receive full vesting of their unvested equity awards. Severance benefits are subject to the execution of a release of claims by the executive.
115
Table of Contents
Outstanding Equity Awards as of January 31, 2018
The following table presents the outstanding equity incentive plan awards held by each named executive officer as of January 31, 2018.
| Option Awards | ||||||||||||||||||||
| Name |
Grant Date | Number of Securities Underlying Unexercised Options (#) Exercisable |
Number of Securities Underlying Unexercised Options (#) Unexercisable |
Option Exercise Price ($) |
Option Expiration Date |
|||||||||||||||
| Thomas F. Bogan |
2/24/2015 | (1) | 524,999 | — | 4.24 | 2/23/2025 | ||||||||||||||
| 11/15/2016 | (2) | 250,000 | — | 4.60 | 11/14/2026 | |||||||||||||||
| Frederick M. Gewant |
11/15/2016 | (3) | 400,000 | — | 4.60 | 11/14/2026 | ||||||||||||||
| Bhaskar Himatsingka |
6/29/2016 | (4) | 449,999 | — | 4.40 | 6/28/2026 | ||||||||||||||
| 9/26/2017 | (5) | 74,999 | — | 5.64 | 9/25/2027 | |||||||||||||||
| James D. Johnson |
2/23/2016 | (6) | 249,999 | 250,000 | 4.40 | 2/22/2026 | ||||||||||||||
| (1) | 1/4 of the total shares subject to the option vested one year after the vesting commencement date, and 1/48 of the total shares vest monthly thereafter over the following three years, subject to Mr. Bogan’s continued service to us through each such date. The shares subject to this option are early exercisable by Mr. Bogan, subject to our right to repurchase unvested shares in the event Mr. Bogan’s employment terminates. Out of the unexercised options exercisable, 23,584 shares subject to the options were vested as of January 31, 2018. |
| (2) | 1/48 of the total shares subject to the option vest monthly after the vesting commencement date, subject to Mr. Bogan’s continued service to us through each such date. The shares subject to this option are early exercisable by Mr. Bogan, subject to our right to repurchase unvested shares in the event Mr. Bogan’s employment terminates. Out of the unexercised options exercisable, 93,750 shares were vested as of January 31, 2018. |
| (3) | 1/4 of the total shares subject to the option vested one year after the vesting commencement date, and 1/48 of the total shares vest monthly thereafter over the following three years, subject to Mr. Gewant’s continued service to us through each such date. The shares subject to this option are early exercisable by Mr. Gewant, subject to our right to repurchase unvested shares in the event Mr. Gewant’s employment terminates. Out of the unexercised options exercisable, 133,333 shares were vested as of January 31, 2018. |
| (4) | 1/4 of the total shares subject to the option vested one year after the vesting commencement date, and 1/48 of the total shares vest monthly thereafter over the following three years, subject to Mr. Himatsingka’s continued service to us through each such date. The shares subject to this option are early exercisable by Mr. Himatsingka, subject to our right to repurchase unvested shares in the event Mr. Himatsingka’s employment terminates. Out of the unexercised options exercisable, 187,499 shares were vested as of January 31, 2018. |
| (5) | 1/3 of the total shares subject to the option will vest on each of the second, third and fourth anniversaries of the vesting commencement date, subject to Mr. Himatsingka’s continued service to us through each such date. No shares were vested as of January 31, 2018. The shares subject to this option are early exercisable by Mr. Himatsingka, subject to our right to repurchase unvested shares in the event Mr. Himatsingka’s employment terminates. |
| (6) | 1/4 of the total shares subject to the option vested one year after the vesting commencement date, and 1/48 of the total shares vest monthly thereafter over the following three years, subject to Mr. Johnson’s continued service to us through each such date. 249,999 shares were vested as of January 31, 2018. |
Employee Benefit and Stock Plans
2018 Equity Incentive Plan
Our board of directors adopted our 2018 Equity Incentive Plan, or our 2018 Plan, on , 2018 and our stockholders approved our 2018 Plan on , 2018. The 2018 Plan became effective on the date of its
116
Table of Contents
adoption by our board of directors, but no stock award may be granted prior to the execution and delivery of the underwriting agreement related to this offering. Our 2018 Plan provides for the grant of incentive stock options to employees, including employees of any parent or subsidiary, and for the grant of nonstatutory stock options, stock appreciation rights, restricted stock awards, restricted stock unit awards, performance stock awards, performance cash awards and other forms of stock awards to employees, directors and consultants, including employees and consultants of our affiliates.
Authorized Shares. The maximum number of shares of our common stock that may be issued under our 2018 Plan is , which includes (a) newly reserved shares and (b) the shares remaining available for grant under the 2013 Plan and the shares that may return to the 2018 Plan upon the forfeiture of awards previously granted under our 2013 Plan and 2003 Plan, each of which is described below. In addition, the number of shares of our common stock reserved for issuance under our 2018 Plan will be increased as of the first day of each fiscal year, starting in 2019 and ending in 2028, by a number of shares of common stock that does not exceed 5% of the total number of shares of all classes of our common stock outstanding on the last day of the preceding fiscal year, unless our board of directors or compensation committee determines that there will be a lesser increase, or no increase. The maximum number of shares of our common stock that may be issued on the exercise of incentive stock options under our 2018 Plan is .
Shares subject to stock awards granted under our 2018 Plan that expire or terminate without being issued, or that are paid out in cash rather than in shares, do not reduce the number of shares available for issuance under our 2018 Plan. Additionally, shares become available for future grant under our 2018 Plan if they were issued under stock awards under our 2018 Plan if we repurchase them or they are forfeited due to failure to vest. This includes shares used to pay the exercise price of a stock award or to satisfy the tax withholding obligations related to a stock award.
Plan Administration. The compensation committee of our board of directors will administer our 2018 Plan. The compensation committee may also delegate to one or more of our officers the authority to (1) designate employees (other than executive officers) to receive specified stock awards and (2) determine the number of shares subject to such stock awards. Under our 2018 Plan, our board of directors or the compensation committee has the authority to determine and amend the terms of awards and underlying agreements, including but not limited to:
| • | recipients; |
| • | the exercise, purchase or strike price of stock awards, if any; |
| • | the number of shares subject to each stock award; |
| • | the vesting schedule applicable to the awards, together with any vesting acceleration; and |
| • | the form of consideration, if any, payable on exercise or settlement of the award. |
Under the 2018 Plan, the board of directors or the compensation committee also generally has the authority to effect, with the consent of any adversely affected participant:
| • | the reduction of the exercise, purchase or strike price of any outstanding award; |
| • | the cancellation of any outstanding award and the grant in substitution therefore of other stock awards, cash or other consideration; or |
| • | any other action that is treated as a repricing under generally accepted accounting principles. |
Non-Employee Director Limitation. The maximum number of shares of common stock subject to awards granted under the 2018 Plan or otherwise during any one calendar year to any non-employee director, taken together with any cash fees paid by us to the non-employee director during that year for service on the Board, will not exceed $750,000 in total value (calculating the value of the awards based on the grant date fair value for financial reporting purposes), or, with respect to the calendar year in which a non-employee director is first appointed or elected to the board of directors, $1,000,000.
117
Table of Contents
Stock Options. Incentive stock options and nonstatutory stock options are granted under stock option award agreements adopted by the plan administrator. The plan administrator determines the exercise price for stock options, within the terms and conditions of the 2018 Plan, provided that the exercise price of a stock option generally cannot be less than 100% of the fair market value of our common stock on the date of grant. Options granted under the 2018 Plan vest at the rate specified in the stock option award agreement as determined by the plan administrator.
Restricted Stock Unit Awards. RSUs are granted under restricted stock unit award agreements adopted by the plan administrator. RSUs may be granted in consideration for any form of legal consideration that may be acceptable to our board of directors or compensation committee and permissible under applicable law. An RSU may be settled by cash, delivery of stock, a combination of cash and stock as deemed appropriate by the plan administrator, or in any other form of consideration set forth in the RSU agreement. Additionally, dividend equivalents may be credited in respect of shares covered by an RSU. Except as otherwise provided in the applicable award agreement, RSUs that have not vested will be forfeited once the participant’s continuous service ends for any reason.
Restricted Stock Awards. Restricted stock awards are granted under restricted stock award agreements adopted by the plan administrator. A restricted stock award may be awarded in consideration for cash, check, bank draft or money order, past or future services to us, or any other form of legal consideration that may be acceptable to our board of directors or compensation committee and permissible under applicable law. The plan administrator determines the terms and conditions of restricted stock awards, including vesting and forfeiture terms. If a participant’s service relationship with us ends for any reason, we may receive any or all of the shares of common stock held by the participant that have not vested as of the date the participant terminates service with us through a forfeiture condition or a repurchase right.
Stock Appreciation Rights. Stock appreciation rights are granted under stock appreciation right award agreements adopted by the plan administrator. The plan administrator determines the purchase price or strike price for a stock appreciation right, which generally cannot be less than 100% of the fair market value of our common stock on the date of grant. A stock appreciation right granted under the 2018 Plan vests at the rate specified in the stock appreciation right award agreement as determined by the plan administrator.
Performance Awards. The 2018 Plan permits the grant of performance-based stock and cash awards. Our compensation committee may structure awards so that the stock or cash will be issued or paid only following the achievement of certain pre-established performance goals during a designated performance period.
Other Stock Awards. The plan administrator may grant other awards based in whole or in part by reference to our common stock. The plan administrator will set the number of shares under the stock award and all other terms and conditions of such awards.
Changes to Capital Structure. In the event there is a specified type of change in our capital structure, such as a stock split, reverse stock split or recapitalization, appropriate adjustments will be made to (1) the class and maximum number of securities reserved for issuance under the 2018 Plan, (2) the class and maximum number of securities by which the share reserve may increase automatically each year, (3) the class and maximum number of securities that may be issued on the exercise of incentive stock options, and (4) the class and number of securities and exercise price, strike price or purchase price, if applicable, of all outstanding stock awards.
Corporate Transactions. Our 2018 Plan provides that in the event of certain specified significant corporate transactions (as defined in the 2018 Plan), the administrator may take one or more of the following actions with respect to such stock awards:
| • | arrange for the assumption, continuation or substitution of a stock award by a successor or acquiring corporation; |
118
Table of Contents
| • | arrange for the assignment of any reacquisition or repurchase rights held by us to a successor or acquiring corporation; |
| • | accelerate the vesting, in whole or in part, of the stock award and provide for its termination upon or before the transaction; |
| • | arrange for the lapse, in whole or in part, of any reacquisition or repurchase rights held by us; |
| • | cancel or arrange for the cancellation of the stock award before the transaction in exchange for a cash payment, or no payment, as determined by our board of directors or compensation committee; or |
| • | make a payment, in the form determined by our board of directors or compensation committee, equal to the excess, if any, of the value of the property the participant would have received on exercise of the stock awards before the transaction over any exercise price payable by the participant in connection with the exercise. |
The plan administrator is not obligated to treat all stock awards or portions of stock awards, even those that are of the same type, in the same manner and is not obligated to treat all participants in the same manner.
In the event of a change in control (as defined in the 2018 Plan), stock awards granted under the 2018 Plan will not receive automatic acceleration of vesting and exercisability, although this treatment may be provided for in an award agreement.
Transferability. A participant may not transfer stock awards under our 2018 Plan other than by will, the laws of descent and distribution, or as otherwise provided under our 2018 Plan.
Plan Amendment or Termination. Our compensation committee has the authority to amend, suspend or terminate our 2018 Plan, provided that generally such action does not materially impair the existing rights of any participant without such participant’s written consent. Certain material amendments also require the approval of our stockholders. No incentive stock options may be granted after the tenth anniversary of the date our board of directors adopted our 2018 Plan. No stock awards may be granted under our 2018 Plan while it is suspended or after it is terminated.
2018 Employee Stock Purchase Plan
Prior to the effectiveness of this offering, our board of directors will adopt, and we expect our stockholders will approve, our 2018 Employee Stock Purchase Plan, or ESPP. Our ESPP will become effective immediately prior to and contingent upon the public trading date of our common stock.
Share Reserve. The maximum number of shares of our common stock that may be issued under our ESPP is shares. Additionally, the number of shares of our common stock reserved for issuance under our ESPP will automatically increase on February 1 of each year, beginning on February 1, 2019 and continuing through and including February 1, 2028, by the lesser of (1) 1% of the total number of shares of our common stock outstanding on January 31 of the preceding fiscal year, (2) shares of our common stock or (3) such lesser number of shares of common stock as determined by our board of directors or compensation committee. Shares subject to purchase rights granted under our ESPP that terminate without having been exercised in full will not reduce the number of shares available for issuance under our ESPP.
Administration. Our board of directors, or a duly authorized committee thereof, will administer our ESPP. Our board of directors will delegate its authority to administer our ESPP to our compensation committee under the terms of the compensation committee’s charter.
Limitations. Our employees, including executive officers, and the employees of any of our designated affiliates will be eligible to participate in our ESPP, provided they may have to satisfy one or more of the
119
Table of Contents
following service requirements before participating in our ESPP, as determined by the administrator: (1) customary employment with us or one of our designated affiliates for more than 20 hours per week and five or more months per calendar year or (2) continuous employment with us or one of our designated affiliates for a minimum period of time, not to exceed two years, prior to the first date of an offering. An employee may not be granted rights to purchase stock under our ESPP (a) if such employee immediately after the grant would own stock possessing 5% or more of the total combined voting power or value of all classes of our common stock or (b) to the extent that such rights would accrue at a rate that exceeds $25,000 worth of our stock for each calendar year that the rights remain outstanding.
Our ESPP is intended to qualify as an employee stock purchase plan under Section 423 of the Code. The administrator may specify offerings with a duration of not more than 27 months, and may specify one or more shorter purchase periods within each offering. Each offering will have one or more purchase dates on which shares of our common stock will be purchased for the employees who are participating in the offering. The administrator, in its discretion, will determine the terms of offerings under our ESPP.
A participant may not transfer purchase rights under our ESPP other than by will, the laws of descent and distribution or as otherwise provided under our ESPP.
Payroll Deductions. Our ESPP permits participants to purchase shares of our common stock through payroll deductions up to 15% of their earnings. Unless otherwise determined by the administrator, the purchase price of the shares will be 85% of the lower of the fair market value of our common stock on the first day of an offering or on the date of purchase. Participants may end their participation at any time during an offering and will be paid their accrued contributions that have not yet been used to purchase shares. Participation ends automatically upon termination of employment with us.
Corporate Transactions. In the event of certain specified significant corporate transactions, such as a merger or change in control, a successor corporation may assume, continue or substitute each outstanding purchase right. If the successor corporation does not assume, continue or substitute for the outstanding purchase rights, the offering in progress will be shortened and the participants’ purchase rights will be exercised within ten business days prior to the corporate transaction, and such purchase rights will terminate immediately thereafter.
Amendment and Termination. Our board of directors has the authority to amend, suspend or terminate our ESPP, at any time and for any reason; provided, however, that certain types of amendments will require the approval of our stockholders. Our ESPP will remain in effect until terminated by our board of directors in accordance with the terms of our ESPP.
2013 Equity Incentive Plan
Our board of directors adopted and our stockholders approved the 2013 Equity Incentive Plan, or the 2013 Plan, in May 2013 as the successor to the 2003 Equity Incentive Plan. The 2013 Plan has been periodically amended, most recently in December 2017. The 2013 Plan will be replaced by the 2018 Plan upon the completion of this offering.
Stock Awards. The 2013 Plan provides for the grant of incentive stock options, or ISOs, nonstatutory stock options, or NSOs, stock appreciation rights, restricted stock awards, restricted stock unit awards, and other stock awards, or collectively, stock awards. ISOs may be granted only to our employees, including officers, and the employees of our affiliates. All other stock awards may be granted to our employees, including officers, non-employee directors and consultants and the employees and consultants of our affiliates.
Share Reserve. We previously reserved 11,888,219 shares of our common stock for issuance under the 2013 Plan. Upon the effectiveness of the 2018 Plan, no further stock awards may be granted under the 2013 Plan. Any awards granted under the 2013 Plan will remain subject to the terms of the 2013 Plan and applicable award agreements, until such outstanding awards that are stock options are exercised, or until they terminate or expire by their terms, and until any restricted stock awards become vested, terminate or are forfeited.
120
Table of Contents
Administration. Our board of directors, or a duly authorized committee thereof, has the authority to administer the 2013 Plan. Subject to the terms of the 2013 Plan, our board of directors or the authorized committee, referred to herein as the administrator, determines recipients, dates of grant, the numbers and types of stock awards to be granted and the terms and conditions of the stock awards, including the exercise price, period of their exercisability and vesting schedule applicable to a stock award.
Repricing; Cancellation and Re-Grant of Stock Awards. The administrator has the authority to modify outstanding awards under the 2013 Plan. Subject to the terms of the 2013 Plan, the administrator has the authority to reduce the exercise, purchase or strike price of any outstanding stock award, cancel any outstanding stock award in exchange for new stock awards, cash or other consideration, or take any other action that is treated as a repricing under generally accepted accounting principles, with the consent of any adversely affected participant.
Corporate Transactions. The 2013 Plan provides that in the event of certain specified significant corporate transactions (as defined in the 2013 Plan), each outstanding award will be treated as the administrator determines. The administrator may (1) arrange for the assumption, continuation or substitution of a stock award by a successor corporation; (2) arrange for the assignment of any reacquisition or repurchase rights held by us to a successor corporation; (3) accelerate the vesting, in whole or in part, of the stock award and provide for its termination prior to the transaction; (4) arrange for the lapse, in whole or in part, of any reacquisition or repurchase rights held by us; (5) cancel or arrange for the cancellation of the stock award, to the extent not vested or not exercised prior to the effective date of the transaction, in exchange for such cash consideration, if any, as the board my consider appropriate; or (6) make a payment, in the form determined by the board, equal to the excess, if any, of the value of the property the participant would have received upon exercise of the awards prior to the effective time of the transaction over any exercise price payable by the participant in connection with the exercise. The plan administrator is not obligated to treat all stock awards, even those that are of the same type, or all participants in the same manner and may take different actions with respect to the vested and unvested portions of a stock award.
In the event of a change in control (as defined in the 2013 Plan), awards granted under the 2013 Plan will not receive automatic acceleration of vesting and exercisability, although this treatment may be provided for in an award agreement.
Transferability. Under the 2013 Plan, the board of directors may provide for limitations on the transferability of awards, in its sole discretion. Option awards are generally not transferable other than by will or the laws of descent and distribution, except as otherwise provided under the 2013 Plan.
Plan Amendment or Termination. Our board of directors has the authority to amend, suspend, or terminate the 2013 Plan, although certain material amendments require the approval of our stockholders, and amendments that would impair the rights of any participant require the consent of that participant.
2003 Equity Incentive Plan
Our board of directors adopted and our stockholders approved the 2003 Equity Incentive Plan, or the 2003 Plan, in October 2004. The 2003 Plan expired in accordance with its terms in September 2013 and no further stock awards may be granted under the 2003 Plan. Any awards granted under the 2003 Plan remain subject to the terms of the 2003 Plan and applicable award agreements, until such outstanding awards that are stock options are exercised, or until they terminate or expire by their terms, and until any restricted stock awards become vested, terminate or are forfeited.
Stock Awards. The 2003 Plan provides for the grant of ISOs to our employees and the employees of our affiliates, and for the grant of NSOs, stock bonuses and restricted stock awards to our employees, directors and consultants and the employees, directors and consultants of our affiliates. We have granted stock options and restricted stock awards under the 2003 Plan.
121
Table of Contents
Authorized Shares. We previously reserved 4,444,088 shares of our common stock for issuance under the 2003 Plan. Effective upon the expiration of the 2003 Plan, no further options or stock awards may be granted under the 2003 Plan, but all outstanding stock awards continue to be governed by their existing terms.
Plan Administration. Subject to the terms of the 2003 Plan, our board of directors, referred to herein as the 2003 Plan administrator, determines recipients, dates of grant, the numbers and types of stock awards granted and the terms and conditions of the stock awards, including exercise price, period of their exercisability and vesting schedule applicable to a stock award.
Corporate Transactions. The 2003 Plan provides that in the event of certain specified significant corporate transactions (as defined in the 2003 Plan), any or all outstanding stock awards may be assumed or continued by the successor or acquiring corporation. The successor or acquiring corporation may alternatively substitute equivalent awards or provide substantially similar consideration to participants as was provided to our stockholders. The successor or acquiring corporation may also substitute by issuing, in place of outstanding shares of the company held by the participant, substantially similar shares or other property subject to repurchase restrictions and other provisions no less favorable to the participant than those which applied to such outstanding shares immediately prior to such transaction. In the event such successor or acquiring corporation refuses to assume, continue or substitute awards, the vesting of stock awards held by participants who are providing services to us will accelerate and the stock awards will become exercisable in full prior to the consummation of such event at such times and on such conditions as the administrator determines, and if such stock awards are not exercised prior to the consummation of the corporate transaction, they shall terminate in accordance with the provisions of the 2003 Plan.
In the event of a change in control (as defined in the 2003 Plan), awards granted under the 2003 Plan will not receive automatic acceleration of vesting and exercisability, although this treatment may be provided for in an award agreement.
Transferability. Stock awards are generally not transferable other than by will or the laws of descent and distribution, except as otherwise provided under the 2003 Plan.
Plan Amendment or Termination. The administrator has the authority to amend, suspend, or terminate the 2003 Plan, although certain material amendments require the approval of our stockholders, and amendments that would impair the rights of any participant require the consent of that participant. As noted above, the 2003 Plan expired in accordance with its terms in September 2013.
401(k) Plan
We maintain a 401(k) plan that provides eligible U.S. employees with an opportunity to save for retirement on a tax advantaged basis. Eligible employees are able to defer eligible compensation up to certain Code limits, which are updated annually. We have the ability to make matching and discretionary contributions to the 401(k) plan. Currently, we do not make matching contributions or discretionary contributions to the 401(k) plan. The 401(k) plan is intended to be qualified under Section 401(a) of the Code, with the related trust intended to be tax exempt under Section 501(a) of the Code. As a tax-qualified retirement plan, contributions to the 401(k) plan are deductible by us when made, and contributions and earnings on those amounts are not generally taxable to the employees until withdrawn or distributed from the 401(k) plan.
Limitations of Liability and Indemnification Matters
On the completion of this offering, our amended and restated certificate of incorporation will contain provisions that limit the liability of our current and former directors for monetary damages to the fullest extent
122
Table of Contents
permitted by Delaware law. Delaware law provides that directors of a corporation will not be personally liable for monetary damages for any breach of fiduciary duties as directors, except liability for:
| • | any breach of the director’s duty of loyalty to the corporation or its stockholders; |
| • | any act or omission not in good faith or that involves intentional misconduct or a knowing violation of law; |
| • | unlawful payments of dividends or unlawful stock repurchases or redemptions; or |
| • | any transaction from which the director derived an improper personal benefit. |
Such limitation of liability does not apply to liabilities arising under federal securities laws and does not affect the availability of equitable remedies such as injunctive relief or rescission.
Our amended and restated certificate of incorporation that will be in effect on the completion of this offering will authorize us to indemnify our directors, officers, employees and other agents to the fullest extent permitted by Delaware law. Our amended and restated bylaws that will be in effect on the completion of this offering will provide that we are required to indemnify our directors and officers to the fullest extent permitted by Delaware law and may indemnify our other employees and agents. Our amended and restated bylaws that will be in effect on the completion of this offering will also provide that, on satisfaction of certain conditions, we will advance expenses incurred by a director or officer in advance of the final disposition of any action or proceeding, and permit us to secure insurance on behalf of any officer, director, employee or other agent for any liability arising out of his or her actions in that capacity regardless of whether we would otherwise be permitted to indemnify him or her under the provisions of Delaware law. We have entered and expect to continue to enter into agreements to indemnify our directors and senior executives. With certain exceptions, these agreements provide for indemnification for related expenses including attorneys’ fees, judgments, fines and settlement amounts incurred by any of these individuals in connection with any action, proceeding or investigation. We believe that these amended and restated certificate of incorporation and amended and restated bylaw provisions and indemnification agreements are necessary to attract and retain qualified persons as directors and officers. We also maintain customary directors’ and officers’ liability insurance.
The limitation of liability and indemnification provisions in our amended and restated certificate of incorporation and amended and restated bylaws may discourage stockholders from bringing a lawsuit against our directors for breach of their fiduciary duty. They may also reduce the likelihood of derivative litigation against our directors and officers, even though an action, if successful, might benefit us and other stockholders. Further, a stockholder’s investment may be adversely affected to the extent that we pay the costs of settlement and damage awards against directors and officers as required by these indemnification provisions.
Insofar as indemnification for liabilities arising under the Securities Act may be permitted for directors, executive officers or persons controlling us, we have been informed that, in the opinion of the SEC, such indemnification is against public policy as expressed in the Securities Act and is therefore unenforceable.
123
Table of Contents
CERTAIN RELATIONSHIPS AND RELATED PARTY TRANSACTIONS
Other than compensation arrangements for our directors and executive officers, which are described elsewhere in this prospectus, below we describe transactions since February 1, 2015 and each currently proposed transaction in which:
| • | we have been or are to be a participant; |
| • | the amounts involved exceeded or will exceed $120,000; and |
| • | any of our directors, executive officers or holders of more than 5% of our outstanding capital stock, or any immediate family member of, or person sharing the household with, any of these individuals or entities, had or will have a direct or indirect material interest. |
Equity Financing
In June 2015, we sold an aggregate of 5,915,193 shares of our Series G redeemable convertible preferred stock at a purchase price of $12.68 per share, for an aggregate purchase price of $74,999,994. The following table summarizes purchases of our Series G redeemable convertible preferred stock by related persons:
| Stockholder |
Shares of Series G Convertible Preferred Stock |
Total Purchase Price |
||||||
| JMI Equity Fund VII, L.P.(1) |
2,366,080 | $ | 30,000,002 | |||||
| Norwest Venture Partners XI, LP(2) |
1,025,301 | 13,000,000 | ||||||
| Entities affiliated with ONSET Ventures(3) |
826,550 | 10,480,002 | ||||||
| Entities affiliated with Bessemer Venture Partners(4) |
709,824 | 9,000,000 | ||||||
| CVP SBIC, L.P.(5) |
410,120 | 5,200,000 | ||||||
| Entities affiliated with Monitor Ventures(6) |
285,505 | 3,620,000 | ||||||
| Information Venture Partners I, L.P.(7) |
197,173 | 2,499,999 | ||||||
| (1) | JMI Equity Fund VII, L.P. holds more than 5% of our outstanding capital stock. |
| (2) | Sergio J. Monsalve, a former member of our board of directors, is a venture partner of Norwest Venture Partners XI, LP. |
| (3) | Terry L. Opdendyk, a member of our board of directors, is the co-founder, managing director and general partner of ONSET Ventures related funds. |
| (4) | Byron B. Deeter, a former member of our board of directors, is a partner of Bessemer Venture Partners. |
| (5) | CVP SBIC, L.P. holds more than 5% of our outstanding capital stock. |
| (6) | Affiliates of Monitor Ventures holding our securities whose shares are aggregated for purposes of reporting share ownership information are Monitor Venture Managers Fund I, LLC, Monitor Venture Managers Fund I-A, LLC, Monitor Venture Partners, LP, Monitor Venture Partners A, LP, Monitor Venture Partners A Annex, LLC, Monitor Venture Partners Annex, LP, Monitor Venture Partners I, LP, Monitor Venture Partners I-A, LP, Monitor Venture Partners I-A Annex, LLC, Monitor Venture Partners I Annex, LP, and Monitor Venture Partners I-B, LP. Entities affiliated with Monitor Ventures together hold more than 5% of our outstanding capital stock. |
| (7) | Robert Antoniades, a former member of our board of directors, is a co-founder and the general partner of Information Venture Partners I, L.P. |
Investors’ Rights Agreement
We are party to an amended and restated investors’ rights agreement, or IRA, with our affiliates ONSET IV, L.P., ONSET VI, L.P., Norwest Venture Partners XI, LP, Bessemer Venture Partners VIII, L.P., Bessemer Venture Partners VIII Institutional L.P., Information Venture Partners I, L.P., CVP SBIC, L.P., JMI Equity Fund VII, L.P., Monitor Ventures Managers Fund I, LLC, Monitor Venture Managers Fund I-A, LLC, Monitor Venture Partners, LP, Monitor Venture Partners A, LP, Monitor Venture Partners A Annex, LLC, Monitor
124
Table of Contents
Venture Partners Annex, LP, Monitor Venture Partners I, LP, Monitor Venture Partners I-A, LP, Monitor Venture Partners I-A Annex, LLC, Monitor Venture Partners I Annex, LP, and Monitor Venture Partners I-B, LP, as well as other holders of our preferred stock. The IRA provides the holders of our preferred stock with certain registration rights, including the right to demand that we file a registration statement or request that their shares be covered by a registration statement that we are otherwise filing. The IRA also provides these stockholders with information rights, which will terminate on the completion of this offering, and a right of first refusal with regard to certain issuances of our capital stock, which will not apply to, and will terminate on, the completion of, this offering. In connection with this offering, the holders of 30,271,273 shares of our common stock issuable on conversion of outstanding preferred stock, will be entitled to rights with respect to the registration of their shares of common stock under the Securities Act under this agreement. For a description of these registration rights, see the section titled “Description of Capital Stock—Registration Rights.”
Indemnification Agreements
Our amended and restated certificate of incorporation that will be in effect on the completion of this offering will contain provisions limiting the liability of directors, and our amended and restated bylaws that will be in effect on the completion of this offering will provide that we will indemnify each of our directors and officers to the fullest extent permitted under Delaware law. Our amended and restated certificate of incorporation and amended and restated bylaws that will be in effect on the completion of this offering will also provide our board of directors with discretion to indemnify our employees and other agents when determined appropriate by the board. In addition, we have entered into an indemnification agreement with each of our directors and executive officers, which requires us to indemnify them. For more information regarding these agreements, see the section titled “Executive Compensation—Limitations of Liability and Indemnification Matters.”
Policies and Procedures for Related Person Transactions
Our board of directors has adopted a related person transaction policy setting forth the policies and procedures for the identification, review and approval or ratification of related person transactions. This policy covers, with certain exceptions set forth in Item 404 of Regulation S-K under the Securities Act, any transaction, arrangement or relationship, or any series of similar transactions, arrangements or relationships, in which we and a related person were or will be participants and the amount involved exceeds $120,000, including purchases of goods or services by or from the related person or entities in which the related person has a material interest, indebtedness and guarantees of indebtedness. In reviewing and approving any such transactions, our audit committee will consider all relevant facts and circumstances as appropriate, such as the purpose of the transaction, the availability of other sources of comparable products or services, whether the transaction is on terms comparable to those that could be obtained in an arm’s length transaction, management’s recommendation with respect to the proposed related person transaction, and the extent of the related person’s interest in the transaction.
125
Table of Contents
The following table sets forth information with respect to the beneficial ownership of our common stock as of April 30, 2018 by:
| • | each of our named executive officers; |
| • | each of our directors; |
| • | all of our executive officers and directors as a group; and |
| • | each person or group of affiliated persons known by us to beneficially own more than 5% of our common stock. |
We have determined beneficial ownership in accordance with the rules and regulations of the SEC, and the information is not necessarily indicative of beneficial ownership for any other purpose. Except as indicated by the footnotes below, we believe, based on information furnished to us, that the persons and entities named in the table below have sole voting and sole investment power with respect to all shares that they beneficially own, subject to applicable community property laws.
Applicable percentage ownership before the offering is based on 36,984,914 shares of common stock outstanding as of April 30, 2018, assuming the automatic conversion of all outstanding shares of preferred stock into shares of common stock. Applicable percentage ownership after the offering is based on shares of common stock outstanding immediately after the completion of this offering, assuming no exercise by the underwriters of their over-allotment option. In computing the number of shares beneficially owned by a person and the percentage ownership of such person, we deemed to be outstanding all shares subject to options held by the person that are currently exercisable, or exercisable within 60 days of April 30, 2018. However, except as described above, we did not deem such shares outstanding for the purpose of computing the percentage ownership of any other person.
Unless otherwise indicated, the address of each beneficial owner listed below is c/o Adaptive Insights, Inc., 3350 W. Bayshore Road, Suite 200, Palo Alto, California 94303. We believe, based on information provided to us, that each of the stockholders listed below has sole voting and investment power with respect to the shares beneficially owned by the stockholder unless noted otherwise, subject to community property laws where applicable.
| Shares Beneficially Owned Prior to Offering |
Shares Beneficially Owned After Offering |
|||||||||||||||
| Name of Beneficial Owner |
Number | Percentage | Number | Percentage | ||||||||||||
| 5% Stockholders |
||||||||||||||||
| Entities affiliated with ONSET Ventures(1) |
6,627,484 | 17.9 | % | % | ||||||||||||
| Norwest Venture Partners XI, LP(2) |
6,089,296 | 16.5 | ||||||||||||||
| Entities affiliated with Bessemer Venture Partners(3) |
4,344,491 | 11.7 | ||||||||||||||
| Information Venture Partners I, L.P.(4) |
4,132,749 | 11.2 | ||||||||||||||
| CVP SBIC, L.P.(5) |
3,146,398 | 8.5 | ||||||||||||||
| JMI Equity Fund VII, L.P.(6) |
2,376,701 | 6.4 | ||||||||||||||
| Entities affiliated with Monitor Ventures(7) |
2,327,004 | 6.3 | ||||||||||||||
| Directors and Named Executive Officers |
||||||||||||||||
| Thomas F. Bogan(8) |
2,512,498 | 6.6 | ||||||||||||||
| Frederick M. Gewant(9) |
499,999 | 1.3 | ||||||||||||||
| Bhaskar Himatsingka(10) |
574,998 | 1.5 | ||||||||||||||
| James D. Johnson(11) |
352,082 | * | ||||||||||||||
| Jean M. Halloran(12) |
62,500 | * | ||||||||||||||
126
Table of Contents
| Shares Beneficially Owned Prior to Offering |
Shares Beneficially Owned After Offering |
|||||||||||||||
| Name of Beneficial Owner |
Number | Percentage | Number | Percentage | ||||||||||||
| Robert S. Hull(13) |
1,026,874 | 2.7 | % | |||||||||||||
| James F. Kelliher(14) |
100,000 | * | ||||||||||||||
| Terry L. Opdendyk(15) |
6,689,984 | 18.1 | ||||||||||||||
| Mark B. Templeton(16) |
100,520 | * | ||||||||||||||
| Jill A. Ward(17) |
62,500 | * | ||||||||||||||
| All directors and executive officers as a group(18) (10 persons) |
11,981,955 | 29.7 | % | |||||||||||||
| * | Represents beneficial ownership of less than 1%. |
| (1) | Consists of (i) 5,543,168 shares held of record by ONSET IV, L.P., or ONSET IV, and (ii) 1,084,316 shares held of record by ONSET VI, L.P., or ONSET VI, and together with ONSET IV, referred to herein as the ONSET Entities. ONSET IV Management, LLC is the general partner of ONSET IV, and ONSET VI Management, LLC is the general partner of ONSET VI. Mr. Opdendyk, a member of our board of directors, and Robert F. Kuhling, Jr. are managing directors of ONSET IV Management, LLC sharing voting and dispositive power with respect to the shares held by ONSET IV. Mr. Opdendyk, Robert F. Kuhling, Jr. and Shomit A. Ghose are managing directors of ONSET VI Management, LLC sharing voting and dispositive power with respect to the shares held by ONSET VI. The address for these entities is 2400 Sand Hill Road, Suite 150, Menlo Park, CA 94015. |
| (2) | Consists of 6,089,296 shares held of record by Norwest Venture Partners XI, LP, or NVP XI. NVP Associates, LLC, or NVP, is the managing member of Genesis VC Partners XI, LLC, or Genesis XI, the general partner of NVP XI. Promod Haque, Jeffrey Crowe and Jon Kossow are co-Chief Executive Officers of NVP, the managing member of Genesis XI and, as such, may be deemed to be beneficial owners and to have shared power to vote and dispose of shares held by NVP XI. The address for these entities is 525 University Avenue, Suite 800, Palo Alto, CA 94301. |
| (3) | Consists of (i) 2,372,093 shares held of record by Bessemer Venture Partners VIII Institutional L.P., or Bessemer Institutional, and (ii) 1,972,398 shares held of record by Bessemer Venture Partners VIII L.P., or Bessemer VIII, and together with Bessemer Institutional, the Bessemer Entities. Each of Deer VIII & Co. L.P., or Deer VIII L.P., the general partner of the Bessemer Entities, and Deer VIII & Co. Ltd., or Deer VIII Ltd., the general partner of Deer VIII L.P., has voting and dispositive power over the shares held by the Bessemer Entities. J. Edmund Colloton, David J. Cowan, Byron B. Deeter, a former member of our board of directors, Robert P. Goodman, Jeremy S. Levine and Robert M. Stavis are the directors of Deer VIII Ltd. Investment and voting decisions with respect to the shares held by the Bessemer Entities are made by the directors of Deer VIII Ltd. acting as an investment committee. The address for each of the Bessemer Entities is c/o Bessemer Venture Partners, 1865 Palmer Avenue, Suite 104, Larchmont, New York 10538. |
| (4) | Consists of 4,132,749 shares held of record by Information Venture Partners I, L.P., or IVP I. Information Venture Partners Inc., or IVP GP, is the general partner of IVP I. Mr. Antoniades, a former member of our board of directors, along with David Unsworth and Kerri Golden, are the directors of IVP GP and share voting and dispositive power with respect to the shares held by IVP I. The address for these entities is 1 University Avenue, Suite 1901, Toronto, ON, Canada M5J 2P1. |
| (5) | Consists of 3,146,398 shares held of record by CVP SBIC, L.P. The address for this entity is 1100 G Street N.W., 11th Floor, Washington, DC 20005. CV SBIC Inc. is a general partner of CVP SBIC, L.P. The U.S. Small Business Administration, pursuant to a Receivership Order, has investment and voting power with respect to the shares held by CVP SBIC, L.P., as Receiver for CVP SBIC, L.P. |
| (6) | Consists of 2,376,701 shares held of record by JMI Equity fund VII, L.P., or JMI VII. JMI Associates VII, L.L.C., or JMI GP, is the general partner of JMI VII and the managing members of JMI GP share voting and dispositive power with respect to the shares held by JMI VII. The managing members of JMI GP are Harry Gruner, Paul Barber, Peter Arrowsmith, Matt Emery, Brian Hersman, David Greenberg, Bob Nye, Suken Vakil, Kathy Fields and Randy Guttman. The address for these entities is 100 International Drive, Suite 19100, Baltimore, MD 21202. |
127
Table of Contents
| (7) | Consists of (i) 60,751 shares held of record by Monitor Venture Managers Fund I, LLC, or MVM I, (ii) 3,741 shares held of record by Monitor Venture Managers Fund I-A, LLC, or MVM I-A, (iii) 382,938 shares held of record by Monitor Venture Partners, LP, or MVP, (iv) 73,828 shares held of record by Monitor Venture Partners A, LP, or MVP A, (v) 82,418 shares held of record by Monitor Venture Partners A Annex, LLC, or MVP A Annex, (vi) 69,010 shares held of record by Monitor Venture Partners Annex, LP, or MVP Annex, (vii) 1,182,157 shares held of record by Monitor Venture Partners I, LP, or MVP I, (viii) 203,750 shares held of record by Monitor Venture Partners I-A, LP, or MVP I-A, (ix) 65,067 shares held of record by Monitor Venture Partners I-A Annex, LLC, or MVP I-A Annex, (x) 69,010 shares held of record by Monitor Venture Partners I Annex, LP, or MVP I Annex and (xi) 134,334 shares held of record by Monitor Venture Partners 1-B, LP, or MVP I-B. Monitor Venture Annex Management, LLC is the general partner of MVP Annex and MVP I Annex. Monitor Venture Annex Management, LLC is the managing member of MVP A Annex and MVP I-A Annex. Monitor Venture Management, LLC is the general partner of MVP and MVP I. Monitor Venture Management, LLC is the managing member of MVM I. Monitor Venture Management I-A, LLC is the general partner of MVP A and MVP I-A. Monitor Venture Management I-A, LLC is the managing member of MVM I-A. Monitor Venture Management 1-B, LLC is the general partner of MVP I-B. Teymour Boutros-Ghali, Jerome Engel, Fern Mandelbaum and Neal Bhadkamkar are members of the general partner entities listed above, and share voting and dispositive power with respect to the shares held by the funds listed above. The address for these entities is 5050 El Camino Real, Suite 228, Los Altos, CA 94022. |
| (8) | Consists of (i) 1,387,500 shares held of record by Mr. Bogan and (ii) 1,124,998 shares subject to options exercisable within 60 days of April 30, 2018, of which 349,477 are vested as of such date. |
| (9) | Consists of 499,999 shares subject to options exercisable within 60 days of April 30, 2018, of which 166,666 are vested as of such date. |
| (10) | Consists of (i) 233,355 shares held of record by Mr. Himatsingka and (ii) 341,643 shares subject to options exercisable within 60 days of April 30, 2018, of which 18,750 are vested as of such date. |
| (11) | Consists of 352,082 shares subject to options exercisable within 60 days of April 30, 2018, of which 302,082 are vested as of such date. |
| (12) | Consists of 62,500 shares subject to options exercisable within 60 days of April 30, 2018, of which 3,472 are vested as of such date. |
| (13) | Consists of (i) 338,333 shares held of record by The Hull Family Trust dated 12/16/09, for which Mr. Hull serves as a trustee and (ii) 688,541 shares subject to options exercisable within 60 days of April 30, 2018, of which 541,925 are vested as of such date. |
| (14) | Consists of 100,000 shares subject to options exercisable within 60 days of April 30, 2018, of which 73,263 are vested as of such date. |
| (15) | Consists of (i) the shares listed in footnote (1) above, which are held by the ONSET Entities and (ii) 62,500 shares subject to options exercisable within 60 days of April 30, 2018, none of which are vested as of such date. Mr. Opdendyk is a managing director of each of the ONSET Entities. Mr. Opdendyk shares voting and dispositive power with respect to the shares held by the ONSET Entities. |
| (16) | Consists of 100,520 shares subject to options exercisable within 60 days of April 30, 2018, of which 75,520 are vested as of such date. |
| (17) | Consists of 62,500 shares subject to options exercisable within 60 days of April 30, 2018, of which 1,736 are vested as of such date. |
| (18) | Consists of (i) 8,586,672 shares beneficially owned by our current executive officers and directors and (ii) 3,395,283 shares subject to options exercisable within 60 days of April 30, 2018, of which 1,532,891 shares are vested as of such date. |
128
Table of Contents
General
Following the completion of this offering, our authorized capital stock will consist of shares of common stock, $0.001 par value per share, and shares of preferred stock, $0.001 par value per share.
The following is a summary of the rights of our common and preferred stock and some of the provisions of our amended and restated certificate of incorporation and amended and restated bylaws, which will each become effective upon the closing of this offering, the investors’ rights agreement and relevant provisions of Delaware General Corporation Law. The descriptions herein are qualified in their entirety by our amended and restated certificate of incorporation, amended and restated bylaws and investors’ rights agreement, copies of which have been filed as exhibits to the registration statement of which this prospectus is a part, as well as the relevant provisions of Delaware General Corporation Law.
Common Stock
As of April 30, 2018, there were 36,984,914 shares of our common stock outstanding and held of record by 310 stockholders, assuming the automatic conversion of all outstanding shares of our redeemable convertible preferred stock into shares of common stock, which will automatically occur immediately prior to the completion of this offering.
Holders of our common stock are entitled to one vote for each share held on all matters submitted to a vote of stockholders, including the election of directors, and do not have cumulative voting rights. Accordingly, the holders of a majority of the outstanding shares of common stock entitled to vote in any election of directors can elect all of the directors standing for election, if they so choose, other than any directors that holders of any preferred stock we may issue may be entitled to elect. Subject to preferences that may be applicable to any then outstanding preferred stock, holders of common stock are entitled to receive ratably those dividends, if any, as may be declared by the board of directors out of legally available funds. In the event of our liquidation, dissolution or winding up, the holders of common stock will be entitled to share ratably in the assets legally available for distribution to stockholders after the payment of or provision for all of our debts and other liabilities, subject to the prior rights of any preferred stock then outstanding. Holders of common stock have no preemptive or conversion rights or other subscription rights and there are no redemption or sinking funds provisions applicable to the common stock. All outstanding shares of common stock are, and the common stock to be outstanding upon the completion of this offering will be, duly authorized, validly issued, fully paid and nonassessable. The rights, preferences and privileges of holders of common stock are subject to and may be adversely affected by the rights of the holders of shares of any series of preferred stock that we may designate and issue in the future.
Preferred Stock
Upon completion of this offering, all of our previously outstanding shares of redeemable convertible preferred stock will have been converted into common stock, there will be no authorized shares of our previously redeemable convertible preferred stock and we will have no shares of preferred stock outstanding. Under the terms of our amended and restated certificate of incorporation, which will become effective immediately prior to the completion of this offering, our board of directors has the authority, without further action by our stockholders, to issue up to shares of preferred stock in one or more series, to establish from time to time the number of shares to be included in each such series, to fix the dividend, voting and other rights, preferences and privileges of the shares of each wholly unissued series and any qualifications, limitations or restrictions thereon, and to increase or decrease the number of shares of any such series, but not below the number of shares of such series then outstanding.
Our board of directors may authorize the issuance of preferred stock with voting or conversion rights that could adversely affect the voting power or other rights of the holders of the common stock. The issuance of
129
Table of Contents
preferred stock, while providing flexibility in connection with possible acquisitions and other corporate purposes, could, among other things, have the effect of delaying, deferring or preventing a change in our control and may adversely affect the market price of the common stock and the voting and other rights of the holders of common stock. We have no current plans to issue any shares of preferred stock.
Options
As of April 30, 2018, we had outstanding options under our equity compensation plans to purchase an aggregate of 8,921,141 shares of our common stock, with a weighted-average exercise price of $5.72 per share.
Warrants
As of April 30, 2018, 427,131 shares of our common stock were issuable upon exercise of outstanding warrants to purchase common stock with a weighted average exercise price of $4.38 per share. One warrant is exercisable at any time on or before October 2, 2018, one is exercisable at any time on or before June 2, 2027, and the last is exercisable at any time on or before March 6, 2028.
Registration Rights
We are party to an amended and restated investor rights agreement that provides that certain holders of our preferred stock, including certain holders of at least 5% of our capital stock, have certain registration rights as set forth below. The registration of shares of our common stock by the exercise of registration rights described below would enable the holders to sell these shares without restriction under the Securities Act when the applicable registration statement is declared effective. We will pay the registration expenses, other than underwriting discounts and commissions, of the shares registered by the demand, piggyback and Form S-3 registrations described below.
Generally, in an underwritten offering, the managing underwriter, if any, has the right, subject to specified conditions, to limit the number of shares such holders may include. The demand, piggyback and Form S-3 registration rights described below will expire three years after the closing of this offering, of which this prospectus is a part, or with respect to any particular stockholder, such time after the closing of this offering that such stockholder can sell all of its shares entitled to registration rights under Rule 144 of the Securities Act during any 90-day period.
Demand Registration Rights
The holders of an aggregate of 30,271,273 shares of our common stock will be entitled to certain demand registration rights. At any time beginning 180 days after the completion of this offering, the holders of a majority of these shares may, on not more than one occasion, request that we register all or a portion of their shares. Such request for registration must cover shares with an anticipated aggregate offering price, net of underwriting discounts and commissions, of at least $10 million.
Piggyback Registration Rights
In connection with this offering, the holders of an aggregate of 30,271,273 shares of our common stock were entitled to, and the necessary percentage of holders waived, their rights to notice of this offering and to include their shares of registrable securities in this offering. After this offering, in the event that we propose to register any of our securities under the Securities Act, either for our own account or for the account of other security holders, the holders of these shares will be entitled to certain piggyback registration rights allowing the holder to include their shares in such registration, subject to certain marketing and other limitations. As a result, whenever we propose to file a registration statement under the Securities Act, other than with respect to a demand registration or a registration statement on Forms S-4 or S-8, the holders of these shares are entitled to notice of the registration and have the right to include their shares in the registration, subject to limitations that the underwriters may impose on the number of shares included in the offering.
130
Table of Contents
Form S-3 Registration Rights
The holders of an aggregate of 30,271,273 shares of common stock will be entitled to certain Form S-3 registration rights. The holders of these shares can make a request that we register their shares on Form S-3 if we are qualified to file a registration statement on Form S-3 and if the reasonably anticipated aggregate gross proceeds of the shares offered would equal or exceed $1 million. We will not be required to effect more than two registrations on Form S-3 within any 12-month period.
Anti-Takeover Effects of Delaware Law and Our Certificate of Incorporation and Bylaws
Some provisions of Delaware law, our amended and restated certificate of incorporation and our amended and restated bylaws contain or will contain provisions that could make the following transactions more difficult: an acquisition of us by means of a tender offer; an acquisition of us by means of a proxy contest or otherwise; or the removal of our incumbent officers and directors. It is possible that these provisions could make it more difficult to accomplish or could deter transactions that stockholders may otherwise consider to be in their best interest or in our best interests, including transactions which provide for payment of a premium over the market price for our shares.
These provisions, summarized below, are intended to discourage coercive takeover practices and inadequate takeover bids. These provisions are also designed to encourage persons seeking to acquire control of us to first negotiate with our board of directors. We believe that the benefits of the increased protection of our potential ability to negotiate with the proponent of an unfriendly or unsolicited proposal to acquire or restructure us outweigh the disadvantages of discouraging these proposals because negotiation of these proposals could result in an improvement of their terms.
Stockholder Meetings
Our amended and restated bylaws will provide that a special meeting of stockholders may be called only by our chairman of the board, chief executive officer or president, or by a resolution adopted by a majority of our board of directors.
Requirements for Advance Notification of Stockholder Nominations and Proposals
Our amended and restated bylaws will establish advance notice procedures with respect to stockholder proposals to be brought before a stockholder meeting and the nomination of candidates for election as directors, other than nominations made by or at the direction of the board of directors or a committee of the board of directors.
Elimination of Stockholder Action by Written Consent
Our amended and restated certificate of incorporation and amended and restated bylaws will eliminate the right of stockholders to act by written consent without a meeting.
Staggered Board
Our board of directors will be divided into three classes. The directors in each class will serve for a three-year term, one class being elected each year by our stockholders. For more information on the classified board, see “Management—Board Composition and Election of Directors.” This system of electing and removing directors may tend to discourage a third-party from making a tender offer or otherwise attempting to obtain control of us, because it generally makes it more difficult for stockholders to replace a majority of the directors.
Removal of Directors
Our amended and restated certificate of incorporation will provide that no member of our board of directors may be removed from office by our stockholders except for cause and, in addition to any other vote required by
131
Table of Contents
law, upon the approval of not less than two thirds of the total voting power of all of our outstanding voting stock then entitled to vote in the election of directors.
Stockholders Not Entitled to Cumulative Voting
Our amended and restated certificate of incorporation will not permit stockholders to cumulate their votes in the election of directors. Accordingly, the holders of a majority of the outstanding shares of our common stock entitled to vote in any election of directors can elect all of the directors standing for election, if they choose, other than any directors that holders of our preferred stock may be entitled to elect.
Delaware Anti-Takeover Statute
We are subject to Section 203 of the Delaware General Corporation Law, which prohibits persons deemed to be “interested stockholders” from engaging in a “business combination” with a publicly held Delaware corporation for three years following the date these persons become interested stockholders unless the business combination is, or the transaction in which the person became an interested stockholder was, approved in a prescribed manner or another prescribed exception applies. Generally, an “interested stockholder” is a person who, together with affiliates and associates, owns, or within three years prior to the determination of interested stockholder status did own, 15% or more of a corporation’s voting stock. Generally, a “business combination” includes a merger, asset or stock sale, or other transaction resulting in a financial benefit to the interested stockholder. The existence of this provision may have an anti-takeover effect with respect to transactions not approved in advance by the board of directors.
Choice of Forum
Our restated certificate of incorporation will provide that, unless we consent in writing to the selection of an alternative form, the Court of Chancery of the State of Delaware will be the sole and exclusive forum for: (1) any derivative action or proceeding brought on our behalf; (2) any action asserting a claim of breach of a fiduciary duty or other wrongdoing by any of our directors, officers, employees or agents to us or our stockholders; (3) any action asserting a claim against us arising pursuant to any provision of the Delaware General Corporation Law or our certificate of incorporation or bylaws; (4) any action to interpret, apply, enforce or determine the validity of our certificate of incorporation or bylaws; or (5) any action asserting a claim governed by the internal affairs doctrine. Our restated certificate of incorporation will further provide that the federal district courts of the United States of America will be the exclusive forum for resolving any complaint asserting a cause of action arising under the Securities Act. Our restated certificate of incorporation will also provide that any person or entity purchasing or otherwise acquiring any interest in shares of our capital stock will be deemed to have notice of and to have consented to these choice of forum provisions. It is possible that a court of law could rule that the choice of forum provisions to be contained in our restated certificate of incorporation are inapplicable or unenforceable if they are challenged in a proceeding or otherwise.
Amendment of Charter Provisions
The amendment of any of the above provisions, except for the provision making it possible for our board of directors to issue preferred stock, would require approval by holders of at least two-thirds of the total voting power of all of our outstanding voting stock.
The provisions of Delaware law, our amended and restated certificate of incorporation and our amended and restated bylaws could have the effect of discouraging others from attempting hostile takeovers and, as a consequence, they may also inhibit temporary fluctuations in the market price of our common stock that often result from actual or rumored hostile takeover attempts. These provisions may also have the effect of preventing changes in the composition of our board and management. It is possible that these provisions could make it more difficult to accomplish transactions that stockholders may otherwise deem to be in their best interests.
132
Table of Contents
Transfer Agent and Registrar
The transfer agent and registrar for our common stock will be .
Exchange Listing
Our common stock is currently not listed on any securities exchange. We have applied to have our common stock listed on the New York Stock Exchange under the symbol “ADIN.”
133
Table of Contents
SHARES ELIGIBLE FOR FUTURE SALE
Prior to this offering, there has been no public market for our common stock. Future sales of substantial amounts of common stock in the public market, or the perception that such sales may occur, could adversely affect the market price of our common stock. Although we have applied to have our common stock listed on the New York Stock Exchange, we cannot assure you that there will be an active public market for our common stock.
Based on the number of shares of our common stock outstanding as of April 30, 2018 and assuming (1) the issuance of shares in this offering, (2) the conversion of all outstanding shares of our redeemable convertible preferred stock into shares of our common stock, which will automatically occur immediately prior to the completion of the offering, and (3) no exercise of the underwriters’ over-allotment option, we will have outstanding an aggregate of approximately shares of common stock.
Of these shares, all shares sold in this offering will be freely tradable without restriction or further registration under the Securities Act, except for any shares purchased by our “affiliates,” as that term is defined in Rule 144 under the Securities Act. Shares purchased by our affiliates would be subject to the Rule 144 resale restrictions described below, other than the holding period requirement.
The remaining outstanding shares of common stock will be “restricted securities,” as that term is defined in Rule 144 under the Securities Act. These restricted securities are eligible for public sale only if they are registered under the Securities Act or if they qualify for an exemption from registration under Rule 144 or 701 under the Securities Act, each of which is summarized below. We expect that all of these shares will be subject to a 180-day lock-up period under the lock-up agreements and market stand-off agreements described below.
In addition, of the 8,921,141 shares of our common stock that were subject to stock options outstanding as of April 30, 2018, options to purchase 3,307,293 of such shares of common stock were vested as of such date and, upon exercise, these shares will be eligible for sale subject to the lock–up agreements described below and Rules 144 and 701 under the Securities Act.
Lock-Up Agreements
We, along with our directors, executive officers and substantially all of our other stockholders, optionholders and warrantholders, have agreed with the underwriters that for a period of 180 days, after the date of this prospectus, subject to specified exceptions as detailed further in “Underwriting” below, we or they will not offer, pledge, sell, contract to sell, sell any option or contract to purchase, purchase any option or contract to sell, grant any option, right or warrant to sale of, or otherwise dispose of or transfer any shares of common stock or any securities convertible into or exercisable or exchangeable for shares of common stock, request or demand that we file a registration statement related to our common stock or enter into any swap or other agreement that transfers to another, in whole or in part, directly or indirectly, the economic consequence of ownership of the common stock. All of our stockholders are subject to a market stand-off agreement with us which imposes similar restrictions.
Upon expiration of the lock-up period, certain of our stockholders and warrantholders will have the right to require us to register their shares under the Securities Act. See “—Registration Rights” below and “Description of Capital Stock—Registration Rights.”
Upon the expiration of the lock-up period, substantially all of the shares subject to such lock-up restrictions will become eligible for sale, subject to the limitations discussed above.
134
Table of Contents
Rule 144
Affiliate Resales of Restricted Securities
In general, beginning 90 days after the effective date of the registration statement of which this prospectus is a part, a person who is an affiliate of ours, or who was an affiliate at any time during the 90 days before a sale, who has beneficially owned shares of our common stock for at least six months would be entitled to sell in “broker’s transactions” or certain “riskless principal transactions” or to market makers, a number of shares within any three-month period that does not exceed the greater of:
| • | 1% of the number of shares of our common stock then outstanding, which will equal approximately shares immediately after this offering; or |
| • | the average weekly trading volume in our common stock on the during the four calendar weeks preceding the filing of a notice on Form 144 with respect to such sale. |
Affiliate resales under Rule 144 are also subject to the availability of current public information about us. In addition, if the number of shares being sold under Rule 144 by an affiliate during any three-month period exceeds 5,000 shares or has an aggregate sale price in excess of $50,000, the seller must file a notice on Form 144 with the Securities and Exchange Commission and the concurrently with either the placing of a sale order with the broker or the execution of a sale directly with a market maker.
Non-Affiliate Resales of Restricted Securities
In general, beginning 90 days after the effective date of the registration statement of which this prospectus is a part, a person who is not an affiliate of ours at the time of sale, and has not been an affiliate at any time during the three months preceding a sale, and who has beneficially owned shares of our common stock for at least six months but less than a year, is entitled to sell such shares subject only to the availability of current public information about us. If such person has held our shares for at least one year, such person can resell under Rule 144(b)(1) without regard to any Rule 144 restrictions, including the 90-day public company requirement and the current public information requirement.
Non-affiliate resales are not subject to the manner of sale, volume limitation or notice filing provisions of Rule 144.
Rule 701
In general, under Rule 701, any of our employees, directors, officers, consultants or advisors who purchases shares from us in connection with a compensatory stock or option plan or other written agreement before the effective date of a registration statement under the Securities Act is entitled to sell such shares 90 days after such effective date in reliance on Rule 144. Securities issued in reliance on Rule 701 are restricted securities and, subject to the contractual restrictions described above, beginning 90 days after the date of this prospectus, may be sold by persons other than “affiliates,” as defined in Rule 144, subject only to the manner of sale provisions of Rule 144 and by “affiliates” under Rule 144 without compliance with its one-year minimum holding period requirement.
Equity Plans
We intend to file one or more registration statements on Form S-8 under the Securities Act to register all shares of common stock subject to outstanding stock options and common stock issued or issuable under the 2018 Plan, the 2013 Plan, the 2003 Plan and the ESPP. We expect to file the registration statement covering shares offered pursuant to these stock plans shortly after the date of this prospectus, permitting the resale of such shares by non-affiliates in the public market without restriction under the Securities Act and the sale by affiliates in the public market subject to compliance with the resale provisions of Rule 144.
135
Table of Contents
Registration Rights
As of April 30, 2018, holders of 30,271,273 shares of our common stock, which includes all of the shares of common stock issuable upon the automatic conversion of our redeemable convertible preferred stock immediately prior to the completion of this offering, or their transferees, will be entitled to various rights with respect to the registration of these shares under the Securities Act upon the completion of this offering and the expiration of lock-up agreements. Registration of these shares under the Securities Act would result in these shares becoming fully tradable without restriction under the Securities Act immediately upon the effectiveness of the registration, except for shares purchased by affiliates. See “Description of Capital Stock—Registration Rights” for additional information. Shares covered by a registration statement will be eligible for sale in the public market upon the expiration or release from the terms of the lock-up agreement.
136
Table of Contents
MATERIAL U.S. FEDERAL INCOME TAX CONSEQUENCES TO NON-U.S. HOLDERS OF OUR
COMMON STOCK
The following is a summary of the material U.S. federal income tax consequences to non-U.S. holders (as defined below) of the acquisition, ownership and disposition of our common stock issued pursuant to this offering. This discussion is not a complete analysis of all potential U.S. federal income tax consequences relating thereto, does not address the potential application of the Medicare contribution tax on net investment income, and does not address any estate or gift tax consequences or any tax consequences arising under any state, local or foreign tax laws, or any other U.S. federal tax laws. This discussion is based on the U.S. Internal Revenue Code of 1986, as amended, or Code, Treasury Regulations promulgated thereunder, judicial decisions and published rulings and administrative pronouncements of the Internal Revenue Service, or IRS, all as in effect as of the date of this prospectus. These authorities are subject to differing interpretations and may change, possibly retroactively, resulting in U.S. federal income tax consequences different from those discussed below. We have not requested a ruling from the IRS with respect to the statements made and the conclusions reached in the following summary, and there can be no assurance that the IRS or a court will agree with such statements and conclusions.
This discussion is limited to non-U.S. holders who purchase our common stock pursuant to this offering and who hold our common stock as a “capital asset” within the meaning of Section 1221 of the Code (generally, property held for investment). This discussion does not address all of the U.S. federal income tax consequences that may be relevant to a particular holder in light of such holder’s particular circumstances. This discussion also does not consider any specific facts or circumstances that may be relevant to holders subject to special rules under the U.S. federal income tax laws, including:
| • | certain former citizens or long-term residents of the United States; |
| • | partnerships or other pass-through entities (and investors therein); |
| • | “controlled foreign corporations”; |
| • | “passive foreign investment companies”; |
| • | corporations that accumulate earnings to avoid U.S. federal income tax; |
| • | banks, financial institutions, investment funds, insurance companies, brokers, dealers or traders in securities; |
| • | tax-exempt organizations and governmental organizations; |
| • | tax-qualified retirement plans; |
| • | persons subject to the alternative minimum tax; |
| • | persons who hold or receive our common stock pursuant to the exercise of any employee stock option or otherwise as compensation; |
| • | persons that own, or have owned, actually or constructively, more than 5% of our common stock; |
| • | persons who have elected to mark securities to market; and |
| • | persons holding our common stock as part of a hedging or conversion transaction or straddle, or a constructive sale, or other risk reduction strategy or integrated investment. |
If an entity or arrangement that is classified as a partnership for U.S. federal income tax purposes holds our common stock, the U.S. federal income tax treatment of a partner in the partnership will generally depend on the status of the partner and the activities of the partnership. Partnerships holding our common stock and the partners in such partnerships are urged to consult their tax advisors about the particular U.S. federal income tax consequences to them of holding and disposing of our common stock.
137
Table of Contents
PROSPECTIVE INVESTORS SHOULD CONSULT THEIR TAX ADVISORS REGARDING THE PARTICULAR U.S. FEDERAL INCOME TAX CONSEQUENCES TO THEM OF ACQUIRING, OWNING AND DISPOSING OF OUR COMMON STOCK, AS WELL AS ANY TAX CONSEQUENCES ARISING UNDER ANY STATE, LOCAL OR FOREIGN TAX LAWS AND ANY OTHER U.S. FEDERAL TAX LAWS. IN ADDITION, SIGNIFICANT CHANGES IN U.S. FEDERAL TAX LAWS WERE RECENTLY ENACTED. PROSPECTIVE INVESTORS SHOULD ALSO CONSULT WITH THEIR TAX ADVISORS WITH RESPECT TO SUCH CHANGES IN U.S. TAX LAW AS WELL AS POTENTIAL CONFORMING CHANGES IN STATE TAX LAWS.
Definition of Non-U.S. Holder
For purposes of this discussion, a non-U.S. holder is any beneficial owner of our common stock that is not a “U.S. person” or a partnership (including any entity or arrangement treated as a partnership) for U.S. federal income tax purposes. A U.S. person is any person that, for U.S. federal income tax purposes, is or is treated as any of the following:
| • | an individual who is a citizen or resident of the United States; |
| • | a corporation (or entity treated as a corporation for U.S. federal income tax purposes) created or organized under the laws of the United States, any state thereof or the District of Columbia; |
| • | an estate, the income of which is subject to U.S. federal income tax regardless of its source; or |
| • | a trust (1) whose administration is subject to the primary supervision of a U.S. court and which has one or more U.S. persons who have the authority to control all substantial decisions of the trust or (2) that has a valid election in effect under applicable Treasury Regulations to be treated as a U.S. person. |
Distributions on Our Common Stock
As described under the section titled “Dividend Policy,” we have not paid and do not anticipate paying dividends. However, if we make cash or other property distributions on our common stock, such distributions will constitute dividends for U.S. federal income tax purposes to the extent paid from our current or accumulated earnings and profits, as determined under U.S. federal income tax principles. Amounts that exceed such current and accumulated earnings and profits and, therefore, are not treated as dividends for U.S. federal income tax purposes will constitute a return of capital and will first be applied against and reduce a holder’s tax basis in our common stock, but not below zero. Any excess will be treated as gain realized on the sale or other disposition of our common stock and will be treated as described under the section titled “—Gain On Disposition of Our Common Stock” below.
Subject to the discussion below regarding effectively connected income, backup withholding and FATCA, dividends paid to a non-U.S. holder of our common stock generally will be subject to U.S. federal withholding tax at a rate of 30% of the gross amount of the dividends or such lower rate specified by an applicable income tax treaty. To receive the benefit of a reduced treaty rate, a non-U.S. holder must furnish us or our withholding agent a valid IRS Form W-8BEN or IRS Form W-8BEN-E (or applicable successor form) including a taxpayer identification number and certifying such holder’s qualification for the reduced rate. This certification must be provided to us or our withholding agent before the payment of dividends and must be updated periodically. If the non-U.S. holder holds the stock through a financial institution or other agent acting on the non-U.S. holder’s behalf, the non-U.S. holder will be required to provide appropriate documentation to the agent, which then will be required to provide certification to us or our withholding agent, either directly or through other intermediaries.
Non-U.S. holders that do not provide the required certification on a timely basis, but that qualify for a reduced treaty rate, may obtain a refund of any excess amounts withheld by timely filing an appropriate claim for refund with the IRS.
138
Table of Contents
If a non-U.S. holder holds our common stock in connection with the conduct of a trade or business in the United States, and dividends paid on our common stock are effectively connected with such holder’s U.S. trade or business (and are attributable to such holder’s permanent establishment in the United States if required by an applicable tax treaty), the non-U.S. holder will be exempt from U.S. federal withholding tax. To claim the exemption, the non-U.S. holder must generally furnish a valid IRS Form W-8ECI (or applicable successor form) to the applicable withholding agent.
However, any such effectively connected dividends paid on our common stock generally will be subject to U.S. federal income tax on a net income basis at the regular graduated U.S. federal income tax rates in the same manner as if such holder were a resident of the United States. A non-U.S. holder that is a foreign corporation also may be subject to an additional branch profits tax equal to 30% (or such lower rate specified by an applicable income tax treaty) of its effectively connected earnings and profits for the taxable year, as adjusted for certain items. Non-U.S. holders should consult their tax advisors regarding any applicable income tax treaties that may provide for different rules.
Gain on Disposition of Our Common Stock
Subject to the discussion below regarding backup withholding and FATCA, a non-U.S. holder generally will not be subject to U.S. federal income tax on any gain realized on the sale or other disposition of our common stock, unless:
| • | the gain is effectively connected with the non-U.S. holder’s conduct of a trade or business in the United States, and if required by an applicable income tax treaty, is attributable to a permanent establishment maintained by the non-U.S. holder in the United States; |
| • | the non-U.S. holder is a nonresident alien individual present in the United States for 183 days or more during the taxable year of the disposition, and certain other requirements are met; or |
| • | our common stock constitutes a “United States real property interest” by reason of our status as a United States real property holding corporation, or USRPHC, for U.S. federal income tax purposes at any time within the shorter of the five-year period preceding the disposition or the non-U.S. holder’s holding period for our common stock, and our common stock is not regularly traded on an established securities market during the calendar year in which the sale or other disposition occurs. |
Determining whether we are a USRPHC depends on the fair market value of our U.S. real property interests relative to the fair market value of our other trade or business assets and our foreign real property interests. We believe that we are not currently and do not anticipate becoming a USRPHC for U.S. federal income tax purposes, although there can be no assurance we will not in the future become a USRPHC.
Gain described in the first bullet point above generally will be subject to U.S. federal income tax on a net income basis at the regular graduated U.S. federal income tax rates in the same manner as if such holder were a resident of the United States. A non-U.S. holder that is a foreign corporation also may be subject to an additional branch profits tax equal to 30% (or such lower rate specified by an applicable income tax treaty) of its effectively connected earnings and profits for the taxable year, as adjusted for certain items. Gain described in the second bullet point above will be subject to U.S. federal income tax at a flat 30% rate (or such lower rate specified by an applicable income tax treaty), but may be offset by certain U.S.-source capital losses (even though the individual is not considered a resident of the United States), provided that the non-U.S. holder has timely filed U.S. federal income tax returns with respect to such losses. Non-U.S. holders should consult their tax advisors regarding any applicable income tax treaties that may provide for different rules.
Information Reporting and Backup Withholding
Annual reports are required to be filed with the IRS and provided to each non-U.S. holder indicating the amount of dividends on our common stock paid to such holder and the amount of any tax withheld with respect
139
Table of Contents
to those dividends. These information reporting requirements apply even if no withholding was required because the dividends were effectively connected with the holder’s conduct of a U.S. trade or business, or withholding was reduced or eliminated by an applicable income tax treaty. This information also may be made available under a specific treaty or agreement with the tax authorities in the country in which the non-U.S. holder resides or is established. Backup withholding, currently at a 24% rate, generally will not apply to payments to a non-U.S. holder of dividends on or the gross proceeds of a disposition of our common stock provided the non-U.S. holder furnishes the required certification for its non-U.S. status, such as by providing a valid IRS Form W-8BEN, IRS Form W-8BEN-E or IRS Form W-8ECI (or applicable successor form), or certain other requirements are met. Backup withholding may apply if the payor has actual knowledge, or reason to know, that the holder is a U.S. person who is not an exempt recipient.
Backup withholding is not an additional tax. If any amount is withheld under the backup withholding rules, the non-U.S. holder should consult with a U.S. tax advisor regarding the possibility of and procedure for obtaining a refund or a credit against the non-U.S. holder’s U.S. federal income tax liability, if any.
Withholding on Foreign Entities
Sections 1471 through 1474 of the Code (commonly referred to as FATCA) impose a U.S. federal withholding tax of 30% on certain payments made to a “foreign financial institution” (as specially defined under these rules) unless such institution enters into an agreement with the U.S. government to withhold on certain payments and to collect and provide to the U.S. tax authorities substantial information regarding certain U.S. account holders of such institution (which includes certain equity and debt holders of such institution, as well as certain account holders that are foreign entities with U.S. owners) or an exemption applies. FATCA also generally will impose a U.S. federal withholding tax of 30% on certain payments made to a non-financial foreign entity unless such entity provides the withholding agent a certification identifying certain direct and indirect U.S. owners of the entity or an exemption applies. An intergovernmental agreement between the United States and an applicable foreign country may modify these requirements. Under certain circumstances, a non-U.S. holder might be eligible for refunds or credits of such taxes. FATCA currently applies to dividends paid on our common stock. FATCA will also apply to gross proceeds from sales or other dispositions of our common stock after December 31, 2018.
Prospective investors are encouraged to consult with their own tax advisors regarding the possible implications of FATCA on their investment in our common stock.
140
Table of Contents
Under the terms and subject to the conditions in an underwriting agreement dated the date of this prospectus, the underwriters named below, for whom Morgan Stanley & Co. LLC and Merrill Lynch, Pierce, Fenner & Smith Incorporated are acting as representatives, have severally agreed to purchase, and we have agreed to sell to them, severally, the number of shares indicated below:
| Name |
Number of Shares |
|||
| Morgan Stanley & Co. LLC |
||||
| Merrill Lynch, Pierce, Fenner & Smith Incorporated |
||||
| Jefferies LLC |
||||
| RBC Capital Markets LLC |
||||
| JMP Securities LLC |
||||
| Oppenheimer & Co. Inc. |
||||
|
|
|
|||
| Total: |
||||
|
|
|
|||
The underwriters and the representatives are collectively referred to as the “underwriters” and the “representatives,” respectively. The underwriters are offering the shares of common stock subject to their acceptance of the shares from us and subject to prior sale. The underwriting agreement provides that the obligations of the several underwriters to pay for and accept delivery of the shares of common stock offered by this prospectus are subject to the approval of certain legal matters by their counsel and to certain other conditions. The underwriters are obligated to take and pay for all of the shares of common stock offered by this prospectus if any such shares are taken. However, the underwriters are not required to take or pay for the shares covered by the underwriters’ over-allotment option described below.
The underwriters initially propose to offer part of the shares of common stock directly to the public at the offering price listed on the cover page of this prospectus and part to certain dealers at a price that represents a concession not in excess of $ per share under the public offering price. After the initial offering of the shares of common stock, the offering price and other selling terms may from time to time be varied by the representatives.
We have granted to the underwriters an option, exercisable for 30 days from the date of this prospectus, to purchase up to additional shares of common stock at the public offering price listed on the cover page of this prospectus, less underwriting discounts and commissions. The underwriters may exercise this option solely for the purpose of covering over-allotments, if any, made in connection with the offering of the shares of common stock offered by this prospectus. To the extent the option is exercised, each underwriter will become obligated, subject to certain conditions, to purchase about the same percentage of the additional shares of common stock as the number listed next to the underwriter’s name in the preceding table bears to the total number of shares of common stock listed next to the names of all underwriters in the preceding table.
The following table shows the per share and total public offering price, underwriting discounts and commissions, and proceeds before expenses to us. These amounts are shown assuming both no exercise and full exercise of the underwriters’ option to purchase up to an additional shares of common stock.
| Total | ||||||||||||
| Per Share |
No Exercise | Full Exercise |
||||||||||
| Public offering price |
$ | $ | $ | |||||||||
| Underwriting discounts and commissions to be paid by us |
$ | $ | $ | |||||||||
| Proceeds, before expenses, to us |
$ | $ | $ | |||||||||
141
Table of Contents
The estimated offering expenses payable by us, exclusive of the underwriting discounts and commissions, are approximately $ .
The underwriters have informed us that they do not intend sales to discretionary accounts to exceed 5% of the total number of shares of common stock offered by them.
Our common stock will be approved for listing on the New York Stock Exchange under the trading symbol “ADIN.”
We and all directors and officers and the holders of all of our outstanding stock and stock options have agreed that, without the prior written consent of Morgan Stanley & Co. LLC and Merrill Lynch, Pierce, Fenner & Smith Incorporated on behalf of the underwriters, we and they will not, during the period ending 180 days after the date of this prospectus, or the restricted period:
| • | offer, pledge, sell, contract to sell, sell any option or contract to purchase, purchase any option or contract to sell, grant any option, right or warrant to purchase, lend or otherwise transfer or dispose of, directly or indirectly, any shares of common stock or any securities convertible into or exercisable or exchangeable for shares of common stock; |
| • | file any registration statement with the Securities and Exchange Commission relating to the offering of any shares of common stock or any securities convertible into or exercisable or exchangeable for common stock; or |
| • | enter into any swap or other arrangement that transfers to another, in whole or in part, any of the economic consequences of ownership of the common stock. |
whether any such transaction described above is to be settled by delivery of common stock or such other securities, in cash or otherwise. In addition, we and each such person agrees that, without the prior written consent of Morgan Stanley & Co. LLC and Merrill Lynch, Pierce, Fenner & Smith Incorporated on behalf of the underwriters, we or such other person will not, during the restricted period, make any demand for, or exercise any right with respect to, the registration of any shares of common stock or any security convertible into or exercisable or exchangeable for common stock.
The restrictions described in the immediately preceding paragraph to do not apply to:
| • | transactions relating to shares of our common stock or other securities acquired in open market transactions after the completion of this offering, provided that no public reports or filings will be required or voluntarily made in connection with subsequent sales of the common stock or other securities acquired in such open market transactions during the restricted period; |
| • | the transfer, distribution or disposition of shares of our common stock or any security convertible into or exercisable or exchangeable for our common stock (i) to an immediate family member of the security holder or to a trust formed for the benefit of the security holder or of an immediate family member of the security holder, (ii) by bona fide gift, will or intestacy, (iii) if the security holder is a corporation, partnership, limited liability company or other business entity (A) to another corporation, partnership, limited liability company, trust or other business entity that is an affiliate of the security holder, or to any investment fund or other entity controlled or managed by the security holder or its affiliates, or (B) as part of a disposition, transfer or distribution by the security holder to its stockholders, current or former partners (general or limited), members, beneficiaries or other equity holders, or to the estates of any such stockholders, partners, beneficiaries or other equity holders, or (iv) if the security holder is a trust, to a trustee or beneficiary of the trust, provided that, in the case of any such transfer, distribution or disposition, each transferee, donee or distributee (A) shall sign and deliver a lock-up agreement and (B) for the first 90 days after the completion of this offering, no public reports or filings reporting the transfer will be required or voluntarily made during the restricted period, |
142
Table of Contents
| and thereafter, any filing required during the remainder of the restricted period shall clearly indicate in the footnotes thereto that (x) the filing relates to a transfer as described herein and (y) the shares transferred are subject to a lock-up agreement; |
| • | the receipt by the security holder of shares of our common stock upon the exercise of stock options pursuant to an employee benefit plan described in this prospectus, provided that such shares of common stock are subject to the restrictions described above and that any required public filing shall clearly indicate in the footnotes thereto that (i) the filing relates to an exercise of a stock option and (ii) the shares of our common stock received upon exercise of the stock option are subject to a lock-up agreement; |
| • | the receipt by the security holder of shares of our common stock upon the exercise of warrants described in this prospectus, provided that such shares of common stock are subject to the restrictions described above and that any required public filing shall clearly indicate in the footnotes thereto that (i) the filing relates to an exercise of a warrant and (ii) the shares of our common stock received upon exercise of the warrant are subject to a lock-up agreement; |
| • | the transfer by a security holder of shares of our common stock or any securities convertible into our common stock to us upon a vesting event of our securities or upon the exercise of options or warrants to purchase our securities on a “cashless,” “net exercise,” or “net issuance” basis to cover tax withholding obligations of the security holder, provided that for the first 90 days after the completion of this offering, no public reports or filings will be required or voluntarily made, and thereafter, any required filing shall clearly indicate in the footnotes thereto that the filing relates to securities being exercised on a “cashless,” “net exercise,” or “net issuance basis” to meet tax withholding obligations; |
| • | the transfer by a security holder of shares of our common stock or any security convertible into or exercisable or exchangeable for our common stock to us pursuant to agreements under which we have a repurchase right or a right of first refusal, provided that any required public filing indicates that the filing relates to our exercise of our repurchase right or right of first refusal; |
| • | the establishment of a trading plan pursuant to Rule 10b5-1 under the Exchange Act for the transfer of shares of our common stock, provided that (i) such plan does not provide for the transfer of common stock during the restricted period and (ii) no public announcement or filing is required or voluntarily made during the restricted period; |
| • | the conversion of outstanding shares of our preferred stock into common stock in connection with this offering, provided that such shares of common stock remain subject to the restrictions set forth above; |
| • | transfers of shares of our common stock or any securities convertible into or exercisable or exchangeable for our common stock that occur solely by operation of law pursuant to a qualified domestic order in connection with a divorce settlement or other court order, provided that (i) the transferee signs a lock-up agreement and (ii) any required public filing indicates that the shares transferred are subject to a lock-up agreement; and |
| • | the transfer of shares of our common stock or any security convertible into or exercisable or exchangeable for our common stock pursuant to a bona fide third-party tender offer, merger, consolidation, or other similar transaction approved by our board of directors after the completion of this offering, provided that if the tender offer, merger, consolidation or other such transaction is not completed, the common stock owned by the security holder shall remain subject to the restrictions set forth above. |
Morgan Stanley & Co. LLC and Merrill Lynch, Pierce, Fenner & Smith Incorporated, in their sole discretion, may release the common stock and other securities subject to the lock-up agreements described above in whole or in part at any time. In the event that any of our directors, executive officers or holders of more than 4% of our outstanding shares of securities are granted an early release from the restrictions set forth in the lock-up agreements, then certain persons or groups who have executed a lock-up agreement will automatically be
143
Table of Contents
granted an early release from their obligations under the lock-up agreement on a pro rata basis, subject to certain exceptions specified in their lock-up agreements.
In order to facilitate the offering of the common stock, the underwriters may engage in transactions that stabilize, maintain or otherwise affect the price of the common stock. Specifically, the underwriters may sell more shares than they are obligated to purchase under the underwriting agreement, creating a short position. A short sale is covered if the short position is no greater than the number of shares available for purchase by the underwriters under the over-allotment option. The underwriters can close out a covered short sale by exercising the over-allotment option or purchasing shares in the open market. In determining the source of shares to close out a covered short sale, the underwriters will consider, among other things, the open market price of shares compared to the price available under the over-allotment option. The underwriters may also sell shares in excess of the over-allotment option, creating a naked short position. The underwriters must close out any naked short position by purchasing shares in the open market. A naked short position is more likely to be created if the underwriters are concerned that there may be downward pressure on the price of the common stock in the open market after pricing that could adversely affect investors who purchase in this offering. As an additional means of facilitating this offering, the underwriters may bid for, and purchase, shares of common stock in the open market to stabilize the price of the common stock. These activities may raise or maintain the market price of the common stock above independent market levels or prevent or retard a decline in the market price of the common stock. The underwriters are not required to engage in these activities and may end any of these activities at any time.
We and the underwriters have agreed to indemnify each other against certain liabilities, including liabilities under the Securities Act.
A prospectus in electronic format may be made available on websites maintained by one or more underwriters, or selling group members, if any, participating in this offering. The representatives may agree to allocate a number of shares of common stock to underwriters for sale to their online brokerage account holders. Internet distributions will be allocated by the representatives to underwriters that may make Internet distributions on the same basis as other allocations.
The underwriters and their respective affiliates are full service financial institutions engaged in various activities, which may include securities trading, commercial and investment banking, financial advisory, investment management, investment research, principal investment, hedging, financing and brokerage activities. Certain of the underwriters and their respective affiliates have, from time to time, performed, and may in the future perform, various financial advisory and investment banking services for us, for which they received or will receive customary fees and expenses.
In addition, in the ordinary course of their various business activities, the underwriters and their respective affiliates may make or hold a broad array of investments and actively trade debt and equity securities (or related derivative securities) and financial instruments (including bank loans) for their own account and for the accounts of their customers and may at any time hold long and short positions in such securities and instruments. Such investment and securities activities may involve our securities and instruments. The underwriters and their respective affiliates may also make investment recommendations or publish or express independent research views in respect of such securities or instruments and may at any time hold, or recommend to clients that they acquire, long or short positions in such securities and instruments.
Pricing of the Offering
Prior to this offering, there has been no public market for our common stock. The initial public offering price was determined by negotiations between us and the representatives. Among the factors considered in determining the initial public offering price were our future prospects and those of our industry in general, our sales, earnings and certain other financial and operating information in recent periods, and the price-earnings
144
Table of Contents
ratios, price-sales ratios, market prices of securities, and certain financial and operating information of companies engaged in activities similar to ours.
Selling Restrictions
European Economic Area
In relation to each Member State of the European Economic Area which has implemented the Prospectus Directive (each, a “Relevant Member State”) an offer to the public of any shares of our common stock may not be made in that Relevant Member State, except that an offer to the public in that Relevant Member State of any shares of our common stock may be made at any time under the following exemptions under the Prospectus Directive, if they have been implemented in that Relevant Member State:
| (a) | to any legal entity which is a qualified investor as defined in the Prospectus Directive; |
| (b) | to fewer than 100 or, if the Relevant Member State has implemented the relevant provision of the 2010 PD Amending Directive, 150, natural or legal persons (other than qualified investors as defined in the Prospectus Directive), as permitted under the Prospectus Directive, subject to obtaining the prior consent of the representatives for any such offer; or |
| (c) | in any other circumstances falling within Article 3(2) of the Prospectus Directive, provided that no such offer of shares of our common stock shall result in a requirement for the publication by us or any underwriter of a prospectus pursuant to Article 3 of the Prospectus Directive. |
For the purposes of this provision, the expression an “offer to the public” in relation to any shares of our common stock in any Relevant Member State means the communication in any form and by any means of sufficient information on the terms of the offer and any shares of our common stock to be offered so as to enable an investor to decide to purchase any shares of our common stock, as the same may be varied in that Member State by any measure implementing the Prospectus Directive in that Member State, the expression “Prospectus Directive” means Directive 2003/71/EC (and amendments thereto, including the 2010 PD Amending Directive, to the extent implemented in the Relevant Member State), and includes any relevant implementing measure in the Relevant Member State, and the expression “2010 PD Amending Directive” means Directive 2010/73/EU.
United Kingdom
Each underwriter has represented and agreed that:
| (a) | it has only communicated or caused to be communicated and will only communicate or cause to be communicated an invitation or inducement to engage in investment activity (within the meaning of Section 21 of the Financial Services and Markets Act 2000, or FSMA, received by it in connection with the issue or sale of the shares of our common stock in circumstances in which Section 21(1) of the FSMA does not apply to us; and |
| (b) | it has complied and will comply with all applicable provisions of the FSMA with respect to anything done by it in relation to the shares of our common stock in, from or otherwise involving the United Kingdom. |
Japan
No registration pursuant to Article 4, paragraph 1 of the Financial Instruments and Exchange Law of Japan (Law No. 25 of 1948, as amended), or the FIEL, has been made or will be made with respect to the solicitation of the application for the acquisition of the shares of common stock.
Accordingly, the shares of common stock have not been, directly or indirectly, offered or sold and will not be, directly or indirectly, offered or sold in Japan or to, or for the benefit of, any resident of Japan (which term as
145
Table of Contents
used herein means any person resident in Japan, including any corporation or other entity organized under the laws of Japan) or to others for re-offering or re-sale, directly or indirectly, in Japan or to, or for the benefit of, any resident of Japan except pursuant to an exemption from the registration requirements, and otherwise in compliance with, the FIEL and the other applicable laws and regulations of Japan.
For Qualified Institutional Investors, or QII
Please note that the solicitation for newly-issued or secondary securities (each as described in Paragraph 2, Article 4 of the FIEL) in relation to the shares of common stock constitutes either a “QII only private placement” or a “QII only secondary distribution” (each as described in Paragraph 1, Article 23-13 of the FIEL). Disclosure regarding any such solicitation, as is otherwise prescribed in Paragraph 1, Article 4 of the FIEL, has not been made in relation to the shares of common stock. The shares of common stock may only be transferred to QIIs.
For Non-QII Investors
Please note that the solicitation for newly-issued or secondary securities (each as described in Paragraph 2, Article 4 of the FIEL) in relation to the shares of common stock constitutes either a “small number private placement” or a “small number private secondary distribution” (each as is described in Paragraph 4, Article 23-13 of the FIEL). Disclosure regarding any such solicitation, as is otherwise prescribed in Paragraph 1, Article 4 of the FIEL, has not been made in relation to the shares of common stock. The shares of common stock may only be transferred en bloc without subdivision to a single investor.
146
Table of Contents
The validity of the shares of common stock being offered by this prospectus will be passed upon for us by Cooley LLP, Palo Alto, California. The underwriters are being represented by Fenwick & West LLP.
The consolidated financial statements as of January 31, 2017 and 2018 and for each of the three years in the period ended January 31, 2018 included in this prospectus have been so included in reliance on the report of PricewaterhouseCoopers LLP, an independent registered public accounting firm, given on the authority of said firm as experts in auditing and accounting.
WHERE YOU CAN FIND MORE INFORMATION
We have filed with the SEC a registration statement on Form S-1, including exhibits and schedules, under the Securities Act, with respect to the shares of common stock being offered by this prospectus. This prospectus, which constitutes part of the registration statement, does not contain all of the information in the registration statement and its exhibits. For further information with respect to us and the common stock offered by this prospectus, we refer you to the registration statement and its exhibits. Statements contained in this prospectus as to the contents of any contract or any other document referred to are not necessarily complete, and in each instance, we refer you to the copy of the contract or other document filed as an exhibit to the registration statement. Each of these statements is qualified in all respects by this reference.
You can read our SEC filings, including the registration statement, over the Internet at the SEC’s website at www.sec.gov. You may also read and copy any document we file with the SEC at its public reference facilities at 100 F Street, NE, Washington, D.C. 20549. You may also obtain copies of these documents at prescribed rates by writing to the Public Reference Section of the SEC at 100 F Street, NE, Washington, D.C. 20549. Please call the SEC at 1-800-SEC-0330 for further information on the operation of the public reference facilities.
Upon the completion of this offering, we will be subject to the information reporting requirements of the Securities Exchange Act of 1934 and we will file reports, proxy statements and other information with the SEC. These reports, proxy statements and other information will be available for inspection and copying at the public reference room and web site of the SEC referred to above. We also maintain a website at www.adaptiveinsights.com, at which, following the completion of this offering, you may access these materials free of charge as soon as reasonably practicable after they are electronically filed with, or furnished to, the SEC. Information contained on or accessible through our website is not a part of this prospectus, and the inclusion of our website address in this prospectus is an inactive textual reference only.
147
Table of Contents
Table of Contents
Report of Independent Registered Public Accounting Firm
To the Board of Directors and Stockholders of Adaptive Insights, Inc.
Opinion on the Financial Statements
We have audited the accompanying consolidated balance sheets of Adaptive Insights, Inc. and its subsidiaries as of January 31, 2018 and January 31, 2017 and the related consolidated statements of operations, consolidated statements of redeemable convertible preferred stock and changes in stockholders’ deficit and consolidated statements of cash flows for each of the three years in the period ended January 31, 2018, including the related notes (collectively referred to as the “consolidated financial statements”). In our opinion, the consolidated financial statements present fairly, in all material respects, the financial position of the Company as of January 31, 2018 and January 31, 2017 and the results of its operations and its cash flows for each of the three years in the period ended January 31, 2018 in conformity with accounting principles generally accepted in the United States of America.
Basis for Opinion
These consolidated financial statements are the responsibility of the Company’s management. Our responsibility is to express an opinion on the Company’s consolidated financial statements based on our audits. We are a public accounting firm registered with the Public Company Accounting Oversight Board (United States) (“PCAOB”) and are required to be independent with respect to the Company in accordance with the U.S. federal securities laws and the applicable rules and regulations of the Securities and Exchange Commission and the PCAOB.
We conducted our audits of these consolidated financial statements in accordance with the standards of the PCAOB. Those standards require that we plan and perform the audit to obtain reasonable assurance about whether the consolidated financial statements are free of material misstatement, whether due to error or fraud.
Our audits included performing procedures to assess the risks of material misstatement of the consolidated financial statements, whether due to error or fraud, and performing procedures that respond to those risks. Such procedures included examining, on a test basis, evidence regarding the amounts and disclosures in the consolidated financial statements. Our audits also included evaluating the accounting principles used and significant estimates made by management, as well as evaluating the overall presentation of the consolidated financial statements. We believe that our audits provide a reasonable basis for our opinion.
/s/ PricewaterhouseCoopers LLP
San Jose, California
April 25, 2018, except for the effects of the reverse stock split discussed in Note 1 to the consolidated financial statements, as to which the date is May 25, 2018.
We have served as the Company’s auditor since 2016.
F-2
Table of Contents
Adaptive Insights, Inc.
(In thousands, except per share data)
| January 31, | April 30, 2018 |
Pro Forma April 30, 2018 |
||||||||||||||
| 2017 | 2018 | |||||||||||||||
| (unaudited) | ||||||||||||||||
| Assets |
||||||||||||||||
| Current assets |
||||||||||||||||
| Cash and cash equivalents |
$ | 22,709 | $ | 30,134 | $ | 43,819 | ||||||||||
| Accounts receivable, net |
15,428 | 18,629 | 20,335 | |||||||||||||
| Prepaid expenses and other current assets |
3,955 | 4,810 | 5,110 | |||||||||||||
|
|
|
|
|
|
|
|||||||||||
| Total current assets |
42,092 | 53,573 | 69,264 | |||||||||||||
| Capitalized software development costs, net |
3,653 | 5,299 | 5,705 | |||||||||||||
| Property and equipment, net |
4,118 | 2,608 | 2,642 | |||||||||||||
| Intangible assets, net |
357 | — | — | |||||||||||||
| Goodwill |
1,241 | 1,241 | 1,241 | |||||||||||||
| Other assets |
231 | 517 | 3,317 | |||||||||||||
|
|
|
|
|
|
|
|||||||||||
| Total assets |
$ | 51,692 | $ | 63,238 | $ | 82,169 | ||||||||||
|
|
|
|
|
|
|
|||||||||||
| Liabilities, Redeemable Convertible Preferred Stock and Stockholders’ Deficit |
||||||||||||||||
| Current liabilities |
||||||||||||||||
| Accounts payable |
$ | 3,162 | $ | 3,295 | $ | 3,065 | ||||||||||
| Accrued expenses and other current liabilities |
10,940 | 23,208 | 21,002 | |||||||||||||
| Deferred revenues |
56,358 | 70,189 | 75,008 | |||||||||||||
| Current portion of long-term debt |
1,106 | 1,014 | 737 | |||||||||||||
|
|
|
|
|
|
|
|||||||||||
| Total current liabilities |
71,566 | 97,706 | 99,812 | |||||||||||||
| Deferred revenues, non-current |
27,303 | 22,195 | 21,511 | |||||||||||||
| Long-term debt |
1,014 | 25,005 | 49,325 | |||||||||||||
| Common stock warrant liability |
— | 1,386 | — | |||||||||||||
| Other long-term liabilities |
1,090 | 1,530 | 1,938 | |||||||||||||
|
|
|
|
|
|
|
|||||||||||
| Total liabilities |
100,973 | 147,822 | 172,586 | |||||||||||||
|
|
|
|
|
|
|
|||||||||||
| Commitments and contingencies (Note 9) |
||||||||||||||||
| Redeemable Convertible Preferred Stock |
||||||||||||||||
| Redeemable convertible preferred stock, $0.001 par value; 121,181 shares authorized as of January 31, 2017 and 2018 and April 30, 2018 (unaudited); 30,278 shares issued and outstanding at January 31, 2017 and 2018 and April 30, 2018 (unaudited); aggregate liquidation preference of $180,172 at January 31, 2017 and 2018 and April 30, 2018 (unaudited); no shares authorized, issued and outstanding as of April 30, 2018, pro forma (unaudited) |
$ | 179,245 | $ | 179,245 | $ | 179,245 | $ | — | ||||||||
| Stockholders’ Deficit |
||||||||||||||||
| Common stock, $0.001 par value; 195,000 shares authorized at January 31, 2017 and 2018 and April 30, 2018 (unaudited), 5,301 shares, 6,419 shares and 6,707 shares issued and outstanding at January 31, 2017 and 2018 and April 30, 2018 (unaudited), respectively; 195,000 shares authorized, 36,985 shares issued and outstanding as of April 30, 2018, pro forma (unaudited) |
21 | 25 | 26 | 147 | ||||||||||||
| Additional paid-in capital |
16,776 | 24,142 | 29,354 | 208,478 | ||||||||||||
| Accumulated deficit |
(245,323 | ) | (287,996 | ) | (299,042 | ) | (299,042 | ) | ||||||||
|
|
|
|
|
|
|
|
|
|||||||||
| Total stockholders’ deficit |
(228,526 | ) | (263,829 | ) | (269,662 | ) | (90,417 | ) | ||||||||
|
|
|
|
|
|
|
|
|
|||||||||
| Total liabilities, redeemable convertible preferred stock and stockholders’ deficit |
$ | 51,692 | $ | 63,238 | $ | 82,169 | ||||||||||
|
|
|
|
|
|
|
|||||||||||
The accompanying notes are an integral part of these consolidated financial statements.
F-3
Table of Contents
Adaptive Insights, Inc.
Consolidated Statements of Operations
(In thousands, except per share data)
| Year Ended January 31, | Three Months Ended April 30, |
|||||||||||||||||||
| 2016 | 2017 | 2018 | 2017 | 2018 | ||||||||||||||||
| (unaudited) | ||||||||||||||||||||
| Revenues: |
||||||||||||||||||||
| Subscription |
$ | 49,365 | $ | 69,696 | $ | 93,888 | $ | 21,220 | $ | 28,290 | ||||||||||
| Professional services and other |
12,341 | 12,095 | 12,620 | 2,995 | 3,761 | |||||||||||||||
|
|
|
|
|
|
|
|
|
|
|
|||||||||||
| Total revenues |
61,706 | 81,791 | 106,508 | 24,215 | 32,051 | |||||||||||||||
|
|
|
|
|
|
|
|
|
|
|
|||||||||||
| Cost of revenues: |
||||||||||||||||||||
| Subscription |
9,104 | 11,628 | 14,684 | 3,526 | 4,240 | |||||||||||||||
| Professional services and other |
13,623 | 13,236 | 13,209 | 3,173 | 3,943 | |||||||||||||||
|
|
|
|
|
|
|
|
|
|
|
|||||||||||
| Total cost of revenues |
22,727 | 24,864 | 27,893 | 6,699 | 8,183 | |||||||||||||||
|
|
|
|
|
|
|
|
|
|
|
|||||||||||
| Gross profit |
38,979 | 56,927 | 78,615 | 17,516 | 23,868 | |||||||||||||||
|
|
|
|
|
|
|
|
|
|
|
|||||||||||
| Operating expenses |
||||||||||||||||||||
| Sales and marketing |
62,463 | 64,417 | 77,903 | 17,805 | 19,746 | |||||||||||||||
| Research and development |
22,024 | 23,514 | 24,342 | 5,768 | 6,876 | |||||||||||||||
| General and administrative |
12,718 | 13,669 | 16,993 | 3,753 | 6,124 | |||||||||||||||
|
|
|
|
|
|
|
|
|
|
|
|||||||||||
| Total operating expenses |
97,205 | 101,600 | 119,238 | 27,326 | 32,746 | |||||||||||||||
|
|
|
|
|
|
|
|
|
|
|
|||||||||||
| Loss from operations |
(58,226 | ) | (44,673 | ) | (40,623 | ) | (9,810 | ) | (8,878 | ) | ||||||||||
| Other expense (income), net |
596 | (100 | ) | 1,796 | 146 | 2,092 | ||||||||||||||
|
|
|
|
|
|
|
|
|
|
|
|||||||||||
| Loss before provision for income taxes |
(58,822 | ) | (44,573 | ) | (42,419 | ) | (9,956 | ) | (10,970 | ) | ||||||||||
| Provision for income taxes |
316 | 147 | 254 | 42 | 76 | |||||||||||||||
|
|
|
|
|
|
|
|
|
|
|
|||||||||||
| Net loss |
$ | (59,138 | ) | $ | (44,720 | ) | $ | (42,673 | ) | $ | (9,998 | ) | $ | (11,046 | ) | |||||
|
|
|
|
|
|
|
|
|
|
|
|||||||||||
| Net loss per share attributable to common stockholders, basic and diluted |
$ | (15.00 | ) | $ | (9.04 | ) | $ | (7.65 | ) | $ | (1.88 | ) | $ | (1.74 | ) | |||||
|
|
|
|
|
|
|
|
|
|
|
|||||||||||
| Weighted average shares used in computing net loss per share attributable to common stockholders, basic and diluted |
3,943 | 4,946 | 5,576 | 5,305 | 6,356 | |||||||||||||||
|
|
|
|
|
|
|
|
|
|
|
|||||||||||
| Pro forma net loss per share attributable to common stockholders, basic and diluted (unaudited) |
$ |
(1.19 |
) |
$ |
(0.30 |
) | ||||||||||||||
|
|
|
|
|
|||||||||||||||||
| Weighted average shares used in computing pro forma net loss per share, basic and diluted (unaudited) |
|
35,854 |
|
|
36,634 |
| ||||||||||||||
|
|
|
|
|
|||||||||||||||||
The accompanying notes are an integral part of these consolidated financial statements.
F-4
Table of Contents
Adaptive Insights, Inc.
Consolidated Statements of Redeemable Convertible Preferred Stock and Changes in Stockholders’ Deficit
(In thousands)
| Redeemable Convertible Preferred Stock |
Common Stock | Additional Paid-in Capital |
Accumulated Deficit |
Total Stockholders’ Deficit |
||||||||||||||||||||||||
| Shares | Amount | Shares | Amount | |||||||||||||||||||||||||
| Balance as of January 31, 2015 |
24,363 | $ | 104,436 | 3,718 | $ | 15 | $ | 5,996 | $ | (141,465 | ) | $ | (135,454 | ) | ||||||||||||||
| Issuance of Series G redeemable convertible |
5,915 | 74,809 | — | — | — | — | — | |||||||||||||||||||||
| Issuance of common stock upon exercise of stock options |
— | — | 291 | 1 | 373 | — | 374 | |||||||||||||||||||||
| Issuance of common stock related to early exercised stock options |
— | 1,150 | — | — | — | — | ||||||||||||||||||||||
| Stock repurchase |
— | — | (25 | ) | — | — | — | — | ||||||||||||||||||||
| Vesting of early exercise stock options |
— | — | — | 2 | 2,586 | — | 2,588 | |||||||||||||||||||||
| Stock-based compensation expense |
— | — | — | — | 2,319 | — | 2,319 | |||||||||||||||||||||
| Net loss |
— | — | — | — | — | (59,138 | ) | (59,138 | ) | |||||||||||||||||||
|
|
|
|
|
|
|
|
|
|
|
|
|
|
|
|||||||||||||||
| Balance as of January 31, 2016 |
30,278 | $ | 179,245 | 5,134 | $ | 18 | $ | 11,274 | $ | (200,603 | ) | $ | (189,311 | ) | ||||||||||||||
| Issuance of common stock upon exercise of stock options |
— | — | 167 | 1 | 340 | — | 341 | |||||||||||||||||||||
| Vesting of early exercise stock options |
— | — | — | 2 | 2,108 | — | 2,110 | |||||||||||||||||||||
| Stock-based compensation expense |
— | — | — | — | 3,054 | — | 3,054 | |||||||||||||||||||||
| Net loss |
— | — | — | — | — | (44,720 | ) | (44,720 | ) | |||||||||||||||||||
|
|
|
|
|
|
|
|
|
|
|
|
|
|
|
|||||||||||||||
| Balance as of January 31, 2017 |
|
30,278 |
|
$ | 179,245 | 5,301 | $ | 21 | $ | 16,776 | $ | (245,323 | ) | $ | (228,526 | ) | ||||||||||||
| Issuance of common stock upon exercise of stock options |
— | — | 862 | 3 | 2,639 | — | 2,642 | |||||||||||||||||||||
| Issuance of common stock related to early exercised stock options |
— | — | 256 | — | — | — | — | |||||||||||||||||||||
| Vesting of early exercise stock options |
— | — | — | 1 | 549 | — | 550 | |||||||||||||||||||||
| Stock-based compensation expense |
— | — | — | — | 4,178 | — | 4,178 | |||||||||||||||||||||
| Net loss |
— | — | — | — | — | (42,673 | ) | (42,673 | ) | |||||||||||||||||||
|
|
|
|
|
|
|
|
|
|
|
|
|
|
|
|||||||||||||||
| Balance as of January 31, 2018 |
30,278 | $ | 179,245 | 6,419 | $ | 25 | $ | 24,142 | $ | (287,996 | ) | $ | (263,829 | ) | ||||||||||||||
| Issuance of common stock upon exercise of stock options (unaudited) |
— | — | 271 | 1 | 1,077 | — | 1,078 | |||||||||||||||||||||
| Issuance of common stock related to early exercised stock options (unaudited) |
— | — | 17 | — | — | — | — | |||||||||||||||||||||
| Vesting of early exercise stock options (unaudited) |
— | — | — | — | 21 | — | 21 | |||||||||||||||||||||
| Stock-based compensation expense (unaudited) |
— | — | — | — | 1,269 | — | 1,269 | |||||||||||||||||||||
| Issuance of common stock warrant (unaudited) |
— | — | — | — | 1,120 | — | 1,120 | |||||||||||||||||||||
| Reclassification of common stock warrant liability to equity (unaudited) |
— | — | — | — | 1,725 | — | 1,725 | |||||||||||||||||||||
| Net loss (unaudited) |
— | — | — | — | — | (11,046 | ) | (11,046 | ) | |||||||||||||||||||
|
|
|
|
|
|
|
|
|
|
|
|
|
|
|
|||||||||||||||
| Balance as of April 30, 2018 (unaudited) |
30,278 | $ | 179,245 | 6,707 | $ | 26 | $ | 29,354 | $ | (299,042 | ) | $ | (269,662 | ) | ||||||||||||||
|
|
|
|
|
|
|
|
|
|
|
|
|
|
|
|||||||||||||||
The accompanying notes are an integral part of these consolidated financial statements.
F-5
Table of Contents
Adaptive Insights, Inc.
Consolidated Statements of Cash Flows
(In thousands)
| Year Ended January 31, |
Three Months Ended April 30, |
|||||||||||||||||||
| 2016 | 2017 | 2018 | 2017 | 2018 | ||||||||||||||||
| (unaudited) | ||||||||||||||||||||
| Cash flows from operating activities |
||||||||||||||||||||
| Net loss |
$ | (59,138 | ) | $ | (44,720 | ) | $ | (42,673 | ) | $ | (9,998 | ) | $ | (11,046 | ) | |||||
| Adjustments to reconcile net loss to cash used in operating activities |
||||||||||||||||||||
| Depreciation and amortization |
4,790 | 5,219 | 4,878 | 1,338 | 1,065 | |||||||||||||||
| Stock-based compensation expense |
2,319 | 3,054 | 4,178 | 978 | 1,269 | |||||||||||||||
| Change in fair value of common stock warrant liability |
— | — | 653 | — | 339 | |||||||||||||||
| Interest paid-in-kind |
— | — | 947 | — | 483 | |||||||||||||||
| Amortization of debt discount and accretion of debt issuance costs |
— | — | 111 | — | 105 | |||||||||||||||
| Changes in operating assets and liabilities |
||||||||||||||||||||
| Accounts receivable |
(2,887 | ) | (4,769 | ) | (3,308 | ) | 1,251 | (1,706 | ) | |||||||||||
| Prepaid expenses and other current assets |
48 | (2,003 | ) | (835 | ) | (588 | ) | (293 | ) | |||||||||||
| Other assets |
(48 | ) | (31 | ) | 8 | (8 | ) | — | ||||||||||||
| Accounts payable |
(448 | ) | (85 | ) | 144 | 559 | (240 | ) | ||||||||||||
| Accrued expenses and other liabilities |
2,318 | (512 | ) | 11,870 | 1,486 | (4,712 | ) | |||||||||||||
| Deferred revenues |
12,235 | 9,453 | 8,830 | (916 | ) | 4,135 | ||||||||||||||
|
|
|
|
|
|
|
|
|
|
|
|||||||||||
| Net cash used in operating activities |
(40,811 | ) | (34,394 | ) | (15,197 | ) | (5,898 | ) | (10,601 | ) | ||||||||||
|
|
|
|
|
|
|
|
|
|
|
|||||||||||
| Cash flows from investing activities |
||||||||||||||||||||
| Purchases of property and equipment |
(2,433 | ) | (1,894 | ) | (1,360 | ) | (381 | ) | (253 | ) | ||||||||||
| Capitalized software development costs |
(2,045 | ) | (2,277 | ) | (3,491 | ) | (818 | ) | (971 | ) | ||||||||||
| Acquisition of intangible asset |
(224 | ) | — | — | — | — | ||||||||||||||
|
|
|
|
|
|
|
|
|
|
|
|||||||||||
| Net cash used in investing activities |
(4,702 | ) | (4,171 | ) | (4,851 | ) | (1,199 | ) | (1,224 | ) | ||||||||||
|
|
|
|
|
|
|
|
|
|
|
|||||||||||
| Cash flows from financing activities |
||||||||||||||||||||
| Proceeds from issuance of redeemable convertible preferred stock |
74,809 | — | — | — | — | |||||||||||||||
| Proceeds from issuance of long-term debt, net |
— | — | 24,680 | — | 24,811 | |||||||||||||||
| Proceeds from exercise of stock options |
5,123 | 341 | 3,899 | 81 | 1,178 | |||||||||||||||
| Repayment of long-term debt |
(1,106 | ) | (1,106 | ) | (1,106 | ) | (277 | ) | (277 | ) | ||||||||||
| Repurchase of common stock |
(85 | ) | — | — | — | — | ||||||||||||||
| Payments of deferred offering costs |
— | — | — | — | (202 | ) | ||||||||||||||
|
|
|
|
|
|
|
|
|
|
|
|||||||||||
| Net cash (used in) provided by financing activities |
78,741 | (765 | ) | 27,473 | (196 | ) | 25,510 | |||||||||||||
|
|
|
|
|
|
|
|
|
|
|
|||||||||||
| Net increase (decrease) in cash and cash equivalents |
33,228 | (39,330 | ) | 7,425 | (7,293 | ) | 13,685 | |||||||||||||
| Cash and cash equivalents, beginning of period |
28,811 | 62,039 | 22,709 | 22,709 | 30,134 | |||||||||||||||
|
|
|
|
|
|
|
|
|
|
|
|||||||||||
| Cash and cash equivalents, end of period |
$ | 62,039 | $ | 22,709 | $ | 30,134 | $ | 15,416 | $ | 43,819 | ||||||||||
|
|
|
|
|
|
|
|
|
|
|
|||||||||||
| Supplemental disclosures of cash flow information |
||||||||||||||||||||
| Cash paid for interest |
$ | 189 | $ | 152 | $ | 1,062 | $ | 23 | $ | 582 | ||||||||||
| Cash paid for taxes |
143 | 292 | 288 | 38 | 32 | |||||||||||||||
| Non-cash financing and investing activities |
||||||||||||||||||||
| Vesting of early exercise stock options |
2,588 | 2,110 | 550 | 4 | 21 | |||||||||||||||
| Issuance of common stock warrant |
— | — | 733 | — | 1,120 | |||||||||||||||
| Net change in deferred offering costs, accrued but not paid included in accounts payable and accrued expenses and other current liabilities |
— | — | 314 | — | 2,565 | |||||||||||||||
| Net change in equipment included in accounts payable and accrued expenses |
155 | 236 | 42 | (106 | ) | 82 | ||||||||||||||
| Reclassification of common stock warrant liability to equity |
— | — | — | — | 1,725 | |||||||||||||||
| Capitalized leasehold improvement paid directly by landlord |
— | — | — | — | 199 | |||||||||||||||
The accompanying notes are an integral part of these consolidated financial statements.
F-6
Table of Contents
Adaptive Insights, Inc.
Notes to the Consolidated Financial Statements
1. Description of Business and Basis of Presentation
Description of Business
Adaptive Insights, Inc. (the “Company”) was incorporated in Delaware in May 2003, as Visus Technology, Inc. The Company subsequently changed its name to Adaptive Planning, Inc. in November 2003 and to Adaptive Insights, Inc. in January 2014, and conducts business worldwide with international locations in Australia, Canada, Japan and the United Kingdom. The Company provides cloud-based software to modernize business planning. Its platform—the Adaptive Insights Business Planning Cloud—transforms business planning into a strategic and competitive advantage by enabling organizations to respond to changing business conditions. The Adaptive Insights Business Planning Cloud allows customers to rapidly and effectively model their businesses, monitor and analyze performance on an ongoing basis and generate and share reports and dashboards. In addition, customers can use the Adaptive Insights Business Planning Cloud to evaluate actual performance versus plan, test alternative scenarios, and leverage insights from analytics to make informed, timely decisions that drive future results. The terms “Adaptive Insights”, “Company, “our”, “us”, and “we” in these notes to the consolidated financial statements refer to Adaptive Insights, Inc. and, where appropriate, its consolidated subsidiaries.
Basis of Presentation and Principles of Consolidation
The accompanying consolidated financial statements are prepared in accordance with U.S. generally accepted accounting principles (U.S. GAAP) and include the consolidated accounts of Adaptive Insights, Inc. and its wholly-owned subsidiaries. All intercompany accounts and transactions have been eliminated in consolidation.
Unaudited Pro Forma Balance Sheet
The accompanying pro forma balance sheet information as of April 30, 2018 has been prepared assuming conversion of all of the Company’s outstanding shares of redeemable convertible preferred stock into shares of its common stock upon the closing of a firm commitment underwritten initial public offering (IPO) for the sale of the Company’s common stock, provided that the per share price to the public is at least $14.14 (as adjusted for stock splits, dividends, recapitalizations and the like), the aggregate net cash proceeds to the Company are at least $50 million, and the Company’s common stock is traded on the New York Stock Exchange or the Nasdaq Stock Market. The shares of common stock issuable and the proceeds expected to be received upon the completion of the planned IPO are excluded from such pro forma financial information.
Unaudited Interim Consolidated Financial Information
The accompanying interim consolidated balance sheet as of April 30, 2018 and the consolidated statements of operations and cash flows for the three months ended April 30, 2017 and 2018, and the consolidated statements of redeemable convertible preferred stock and stockholders’ deficit for the three months ended April 30, 2018 and the related footnote disclosures are unaudited. These unaudited interim consolidated financial statements have been prepared in accordance with U.S. GAAP. In management’s opinion, the unaudited interim consolidated financial statements include all adjustments necessary to state fairly the Company’s financial position as of April 30, 2018 and the results of operations and cash flows for the three months ended April 30, 2017 and 2018. The financial data and the other information disclosed in these notes to the consolidated financial statements related to these three-month periods are unaudited. The results for the three months ended April 30, 2018 are not necessarily indicative of the operating results expected for the full fiscal year or any future period.
F-7
Table of Contents
Adaptive Insights, Inc.
Notes to the Consolidated Financial Statements
Fiscal Year
The Company’s fiscal year ends January 31. References to fiscal 2016, 2017, 2018 and 2019 refer to fiscal years ended January 31, 2016, 2017, 2018 and 2019, respectively.
Reverse Stock Split
On May 24, 2018, the Company’s Board of Directors and stockholders approved an amendment to the Company’s amended and restated certificate of incorporation effecting a 1-for-4 reverse stock split of the Company’s issued and outstanding shares of common stock and redeemable convertible preferred stock. The reverse stock split was effected on May 25, 2018. The par value of the common and redeemable convertible preferred stock was not adjusted as a result of the reverse stock split. All issued and outstanding share and per share amounts included in the accompanying consolidated financial statements have been adjusted to reflect this reverse stock split for all periods presented.
2. Significant Accounting Policies
Use of Estimates
The preparation of financial statements in conformity with U.S. GAAP requires management to make estimates and assumptions that affect the amounts stated in the consolidated financial statements and accompanying notes. These judgments, estimates and assumptions are used for, but not limited to the determination of the allowance for accounts receivables, fair values of acquired intangible assets and goodwill, useful lives of property and equipment and intangible assets, recoverability of goodwill and long-lived assets, best estimate of selling price and vendor specific objective evidence of fair values included in multiple-deliverable revenue arrangements, fair value of stock-based awards, fair value of the common stock warrant liability, and accounting for income taxes. The Company bases its estimates and judgments on historical experience and on various other assumptions that it believes are reasonable under the circumstances. However, future events are subject to change and the best estimates and judgments routinely require adjustment. Actual results could differ from those estimates.
Segments
Management has determined that the Company has one operating segment. The Company’s chief executive officer, who is the Company’s chief operating decision maker, reviews financial information on a consolidated and aggregate basis to make decisions about how to allocate resources and to measure the Company’s performance.
Concentration of Credit Risk and Significant Customers
Financial instruments that potentially subject the Company to a concentration of credit risk consist of cash and cash equivalents and accounts receivable. The Company’s policy is to place its cash and cash equivalents on deposit primarily in high credit quality instruments in financial institutions in the United States, United Kingdom, Canada, Australia and Japan. Cash deposits, may at times, exceed amounts insured by the Federal Deposit Insurance Corporation (“FDIC”) and the Securities Investor Protection Corporation (“SIPC”) in the United States. The Company invests its excess cash in money market funds. The Company has not experienced any losses on its deposits of cash and cash equivalents to date.
The Company provides unsecured credits to its customers in the normal course of business. The Company monitors the financial condition of its customers to reduce credit risk. As of January 31, 2017, NetSuite, Inc.
F-8
Table of Contents
Adaptive Insights, Inc.
Notes to the Consolidated Financial Statements
(“NetSuite”), a reseller of the Company’s products and services, accounted for 18% of total accounts receivable. As of January 31, 2018 and April 30, 2018 (unaudited), no individual reseller or customer accounted for 10% or more of total accounts receivable. For the year ended January 31, 2016, NetSuite accounted for 11% of total revenues. For the year ended January 31, 2017 and 2018, and for the three months ended April 30, 2017 and 2018 (unaudited), no individual reseller or customer accounted for 10% or more of total revenues.
In October 2016, Oracle Corporation (“Oracle”) acquired NetSuite and the Company terminated its reseller agreement with NetSuite effective February 28, 2017. Beginning March 1, 2017, all contract renewals for the Company’s solutions with Oracle/NetSuite customers have been contracted directly with the Company. The termination of the NetSuite agreement did not have a material impact on the Company’s results of operations. Under the terms of the Company’s agreement with Oracle, for renewal orders closed with Oracle/NetSuite customers between March 1, 2017 and February 28, 2018, the Company paid Oracle a commission fee of 45% of the first year’s subscription amount.
Foreign Currency Translations and Transactions
The Company’s reporting currency is the U.S. dollar. The functional currency of the Company’s foreign subsidiaries is the U.S. dollar. Foreign currency transactions are measured at the monthly average exchange rate, which approximates the exchange rate in effect on the date of the relevant transaction. All non-U.S. dollar denominated monetary asset and liability accounts are re-measured into U.S. dollars using current exchange rates in effect as of the balance sheet date. Non-monetary assets and liabilities are recorded at historical exchange rates. Foreign currency transaction gains and losses are included in the consolidated statement of operations for the period. During the year ended January 31, 2016, 2017 and 2018, the Company recognized a foreign exchange loss of $0.4 million, a foreign exchange gain of $0.1 million, and a foreign exchange gain of $1.0 million, respectively, in other expense (income), net, in the consolidated statements of operations. During the three months ended April 30, 2017 and 2018 (unaudited), the Company recognized a foreign exchange loss of $0.1 million and $0.6 million, respectively.
Revenue Recognition
The Company derives its revenues from the following sources:
Subscription – Customers pay annual or multi-year subscription fees for the right to access the Company’s cloud-based software platform. Customers do not have the right to take possession of the cloud-based software at any time. The Company also offers downloadable software components with additional functionality that are installed on customers’ servers. Fees are based on a number of factors, including the solutions subscribed for by the customer and the number of users having access to the solutions. The subscription fees are typically payable within 30 days after the execution of the arrangement, and thereafter upon renewal or subsequent installment. The Company initially records the subscription fees as deferred revenues and recognizes revenues on a straight-line basis over the term of the agreement. At any time during the subscription period, customers may increase the number of users or subscribe for additional products for additional subscription fees.
Professional services and other – The Company offers its customers assistance in implementing and optimizing the use of its solutions. Professional services include consulting and training that do not result in significant modification or customization of the subscription service. These services are billed on either a fixed fee or time and material basis. Revenues from time and material arrangements are recognized as services are performed and revenues from fixed fee arrangements are initially recorded as deferred revenues and recognized on a proportional performance basis as the services are rendered.
F-9
Table of Contents
Adaptive Insights, Inc.
Notes to the Consolidated Financial Statements
The Company recognizes subscription and professional services revenues when: (i) persuasive evidence of an arrangement for the sale of the Company’s solutions or consulting services exists, (ii) the solutions have been made available or delivered, or services have been rendered, (iii) the sales price is fixed or determinable, and (iv) collectability is reasonably assured. The timing and amount the Company recognizes as revenues is determined based on the facts and circumstances of each customer’s arrangement. Evidence of an arrangement consists of a signed customer agreement. The Company considers that delivery of a solution has commenced once it provides the customer with log-in information. Fees are fixed based on stated rates specified in the customer agreement. The Company assesses collectability based on a number of factors, including the creditworthiness of the customer and transaction history. If collectability is not considered reasonably assured, revenues are deferred until the fees are collected.
The majority of customer arrangements include multiple deliverables such as subscriptions to the Company’s cloud-based platform, downloadable software components, and professional services. The Company recognizes revenues in accordance with the guidance for arrangements with multiple deliverables under Accounting Standards Codification (“ASC”) Topic 605-25, Multiple-Deliverable Revenue Arrangements. Subscription to the cloud-based application suite and related services are outside the scope of software revenue recognition guidance as defined by ASC Topic 985-605, Software, because customers do not have the right to take possession of the software supporting the cloud-based platform at any time and it is not feasible for the customer to either run the software on its own hardware or contract with another unrelated party to host the software. Only downloadable software components and related services included in the arrangement are recognized under the guidance of ASC Topic 985-605, Software. Generally, the Company’s agreements do not contain any refund provisions other than in the event of the Company’s non-performance or breach.
For multiple-deliverable revenue arrangements, the Company first assesses whether each deliverable has value to the customer on a standalone basis. The Company has determined that the cloud-based platform has standalone value, because, once access is given to the customer, the solutions are fully functional and do not require any additional development, modification, or customization.
Professional services have standalone value because third-party partners and customers themselves can perform these services without the Company’s involvement. The performance of these professional services generally does not require highly specialized or technologically skilled individuals and the professional services are not essential to the functionality of the solutions.
The Company allocates revenues among the separate deliverables in an arrangement under the relative selling price method using the selling price hierarchy established in ASC 605-25. This hierarchy requires the selling price of each deliverable in a multiple deliverable arrangement to be based on, in descending order: (i) vendor-specific objective evidence of fair value (“VSOE”), (ii) third-party evidence of fair value (“TPE”) or (iii) management’s best estimate of the selling price (“BESP”).
The Company establishes VSOE of fair value for professional services sold on a time and materials basis by analyzing historical discounting practices when these services are sold separately. The Company is not able to determine VSOE or TPE for its other deliverables because these deliverables are typically bundled and infrequently sold separately within a consistent price range. Additionally, management has determined that there are no third-party offerings reasonably comparable to the Company’s solutions or competitors’ pricing is unavailable. Therefore, the fair values of all remaining deliverables are based on BESP. The determination of BESP requires the Company to make significant estimates and judgments. The Company considers numerous factors, including the nature of the deliverables themselves and historical discounting practices. The Company updates its estimates of BESP on an ongoing basis as events and as circumstances may require. As the
F-10
Table of Contents
Adaptive Insights, Inc.
Notes to the Consolidated Financial Statements
Company’s marketing strategies evolve, the Company may modify its pricing practices in the future, which could result in changes in relative selling prices and BESP.
The portion of the fee allocated to the downloadable software component and related services, which include implementation services and non-optional post-contract customer support, are within the scope of ASC 985-605, Software Revenue Recognition, and are accounted for ratably over the contract support period starting after the software related services have commenced under the combined services approach as the Company does not have VSOE of fair value for all of the undelivered software deliverables. Post-contract customer support includes technical support, unspecified software upgrades or bug fixes provided on a when-and-if available basis, and access to the Company’s online knowledge base, and is provided throughout the contract term.
The Company uses resellers to complement its direct sales and marketing efforts. The resellers place an order with the Company after negotiating the order with an end customer. The resellers negotiate pricing with the end customer and are responsible for certain support levels directly with the end customer. The Company receives a percentage of the price paid by the end customer. The Company’s contract is with the reseller and payment to the Company is not contingent on the receipt of payment from the end customer. The Company recognizes the contractual amount charged to the reseller as revenues ratably over the term of the arrangement, once access to the Company’s solution has been provided to the end customer provided that the other revenue recognition criteria noted above have been met.
The Company also uses channel partners who refer customers to the Company in exchange for a referral fee. The Company negotiates pricing and contracts directly with the end customer. The Company recognizes revenues from the sales to the end customers ratably over the term of the contract, once access to its solution has been provided to the end customer, provided that the other revenue recognition criteria noted above have been met. The Company records the referral fees paid to channel partners as sales commission expense as incurred.
Sales and other taxes collected from customers to be remitted to government authorities are excluded from revenues.
Cost of Revenues
Cost of subscription revenues consists primarily of expenses related to the hosting of the Company’s subscription and the supporting of its customers. These expenses include third-party cloud hosting costs, costs directly associated with the Company’s cloud infrastructure and operations, including amortization of acquired developed technology costs and internally developed software, personnel-related costs of its customer support organization, including salaries, bonuses, benefits, and stock-based compensation. Overhead associated with facilities, information technology and depreciation is allocated to the cost of revenues and operating expenses based on headcount by cost center.
Cost of professional services and other revenues consist primarily of personnel costs directly associated with providing services for deployment of the Company’s solution, including salaries, benefits, bonuses and stock-based compensation, travel costs, cost of subcontractors to supplement the Company’s staff levels, and allocated overhead.
Deferred Revenues
Deferred revenues consist of billings on contracts where performance has commenced or payments received in advance of revenue recognition and is recognized as revenues as the revenue recognition criteria are met. The
F-11
Table of Contents
Adaptive Insights, Inc.
Notes to the Consolidated Financial Statements
Company typically invoices its customers at the beginning of the term, or in some instances, such as in multi-year arrangements, in installments. Professional services are either invoiced up front, invoiced in installments, or invoiced as the services are performed. Accordingly, the Company’s deferred revenue balance does not include revenues for future years of multi-year non-cancellable contracts that have not yet been billed.
Cash and Cash Equivalents
The Company considers all highly liquid investments with maturities of three months or less at the date of purchase to be cash equivalents. The Company maintains the majority of its cash balances with commercial banks in non-interest bearing accounts which exceed the FDIC insured limits. Cash and cash equivalents include cash held in checking and savings accounts, and highly liquid money market funds. The Company had cash equivalents of $17.9 million, $19.2 million and $33.4 million as of January 31, 2017, January 31, 2018 and April 30, 2018 (unaudited), respectively. The carrying amount of its cash equivalent approximates their fair value due to the short maturities of these instruments.
Fair Value of Financial Instruments
The carrying value of the Company’s financial instruments, including cash equivalents, accounts receivables and accounts payable, approximates their fair value due to their short-term nature. Based on borrowing rates that are available to the Company for loans with similar terms and consideration of the Company’s credit risk, the carrying value of the Company’s debt approximates its fair value.
Accounts Receivables and Allowance for Doubtful Accounts
The Company extends credit to its customers in the normal course of business, and generally does not require collateral for any of its accounts receivable. The Company estimates its allowance for doubtful accounts by evaluating specific accounts where information indicates the Company’s customers may have an inability to meet financial obligations, such as bankruptcy and significantly aged receivables outstanding. The allowance for doubtful accounts was $0.1 million as of January 31, 2017, January 31, 2018 and April 30, 2018 (unaudited). The change in the allowance for doubtful accounts was not material for each of the years ended January 31, 2016, 2017 and 2018 and for each of the three-month periods ended April 30, 2017 and 2018 (unaudited).
Property and Equipment
Property and equipment are stated at cost less accumulated depreciation. Depreciation is charged to operations on a straight-line basis over the estimated useful lives of the assets. The estimated useful life of each asset category is as follows:
| Computer equipment |
3 years | |
| Software licenses |
3 years | |
| Office equipment |
3 – 5 years | |
| Leasehold improvements |
Lesser of 5 years or remaining lease term |
When assets are retired or otherwise disposed of, the cost and accumulated depreciation and amortization are removed from the accounts and any resulting gain or loss is reflected in operating expense in the period realized. Maintenance and repairs are charged to operations as incurred.
Capitalized Software Development Costs
The Company accounts for the costs of computer software obtained or developed for internal use in accordance with ASC 350, Intangibles—Goodwill and Other (“ASC 350”). The Company capitalizes certain
F-12
Table of Contents
Adaptive Insights, Inc.
Notes to the Consolidated Financial Statements
costs incurred in the development of its cloud-based platform when (i) the preliminary project stage is completed, (ii) management has authorized further funding for the completion of the project and (iii) it is probable that the project will be completed and performed as intended. These capitalized costs include personnel and related expenses for employees and costs of third-party contractors who are directly associated with and who devote time to internal-use software projects and, when material, interest costs incurred during the development. Capitalization of these costs ceases once the project is substantially complete and the software is ready for its intended purpose. Costs incurred for significant upgrades and enhancements to the Company’s cloud-based platform are also capitalized. Costs incurred for training, maintenance and minor modifications or enhancements are expensed as incurred. Capitalized software development costs are amortized using the straight-line method over an estimated useful life of three years.
During the years ended January 31, 2016, 2017 and 2018 and the three months ended April 30, 2017 and 2018 (unaudited), the Company capitalized $2.0 million, $2.3 million, $3.5 million, $0.8 million and $1.0 million, respectively, of internal-use software development costs and amortized $0.6 million, $1.1 million, $1.8 million, $0.4 million and $0.6 million, respectively, of internal-use software development costs to subscription revenues.
Based on the Company’s capitalized internal-use software costs, net, at January 31, 2018, future estimated amortization expense is as follows:
| Years Ending January 31, |
||||
| (in thousands) | ||||
| 2019 |
$ | 2,381 | ||
| 2020 |
1,819 | |||
| 2021 |
945 | |||
| Thereafter |
154 | |||
|
|
|
|||
| Total |
$ | 5,299 | ||
|
|
|
|||
Intangible Assets
Intangible assets, which consist of acquired finite-lived developed technology, are initially recorded at fair value. They are amortized on a straight-line basis over the estimated useful lives of the assets, which is generally two to five years.
Impairment of Long-lived Assets
Management evaluates the recoverability of the Company’s property and equipment, finite-lived intangible assets and capitalized internal-software costs, when events or changes in circumstances indicate a potential impairment exists. Events and changes in circumstances considered by the Company in determining whether the carrying value of long-lived assets may not be recoverable include, but are not limited to: significant changes in performance relative to expected operating results; significant changes in the use of the assets; significant negative industry or economic trends and changes in the Company’s business strategy. Impairment testing is performed at an asset level that represents the lowest level for which identifiable cash flows are largely independent of the cash flows of other assets and liabilities (an “asset group”). In determining if impairment exists, the Company estimates the undiscounted cash flows to be generated from the use and ultimate disposition of the asset group. If impairment is indicated based on a comparison of the assets’ carrying values and the undiscounted cash flows, the impairment loss is measured as the amount by which the carrying amount of the assets exceeds the fair value of the assets. The Company determined that there were no events or changes in
F-13
Table of Contents
Adaptive Insights, Inc.
Notes to the Consolidated Financial Statements
circumstances that potentially indicated that the Company’s long-lived assets were impaired during the years ended January 31, 2016, 2017 and 2018 and for the three months ended April 30, 2017 and 2018 (unaudited).
Goodwill
Goodwill represents the excess of the purchase price in a business combination over the fair value of net tangible and intangible assets acquired. The Company tests goodwill for impairment annually as of November 1, or whenever events or changes in circumstances indicate that goodwill may be impaired. The Company initially assesses qualitative factors to determine whether the existence of events or circumstances leads to a determination that it is more-likely-than-not that the fair value of its sole reporting unit is less than its carrying amount. If, after assessing the totality of events or circumstances, the Company determines it is more-likely-than-not that the fair value of the reporting unit is less than its carrying amount, then the Company performs the first step of a two-step analysis by comparing the book value of net assets to the fair value of the reporting unit. If the fair value is determined to be less than the book value, the second step analysis is performed to compute the amount of impairment as the difference between the estimated fair value of goodwill and the carrying value. In assessing the qualitative factors, the Company considers the impact of certain key factors including macroeconomic conditions, industry and market considerations, management turnover, changes in regulation, litigation matters, changes in enterprise value and overall financial performance.
The Company operates in one segment, which is also considered the sole reporting unit. As of January 31, 2018 and April 30, 2018 (unaudited), the Company has not recorded any impairment of its goodwill balance since its inception.
Research and Development Costs
Research and development expenses are comprised primarily of salaries, benefits, and stock-based compensation associated with the Company’s engineering, product and quality assurance personnel. Research and development expenses also include third-party contractors and supplies and allocated overhead. Other than software development costs that qualify for capitalization, discussed above, research and development costs are expensed as incurred.
Advertising Costs
Advertising costs, including costs related to print, broadcast and digital advertising, are expensed as incurred and are included in sales and marketing expenses in the accompanying consolidated statements of operations. Advertising expenses totaled $1.5 million, $1.3 million, $1.6 million, $0.4 million and $0.6 million for the years ended January 31, 2016, 2017 and 2018 and for the three months ended April 30, 2017 and 2018 (unaudited), respectively.
Income Taxes
The Company accounts for income taxes in accordance with ASC 740, Income Taxes (“ASC 740”). ASC 740 requires the recognition of deferred tax assets and liabilities for the expected future tax consequences of temporary differences between the carrying amounts and the tax bases of assets and liabilities. Deferred income tax assets and liabilities are measured using enacted tax rates expected to apply to taxable income in the years in which those temporary differences are expected to be recovered or settled. The effect of a change in tax rates on deferred tax assets and liabilities is recognized in the consolidated statements of operations in the period that includes the enactment date. A valuation allowance is recorded when it is more likely than not that some of the deferred tax assets will not be realized.
F-14
Table of Contents
Adaptive Insights, Inc.
Notes to the Consolidated Financial Statements
The Company recognizes the tax benefit from an uncertain tax position only if it is more likely than not that the tax position will be sustained on examination by the taxing authorities, based on the technical merits of the position. The tax benefits recognized in the consolidated financial statements from such positions are then measured based on the largest benefit that has a greater than 50% likelihood of being realized. The Company recognizes interest and penalties accrued with respect to uncertain tax positions, if any, in the provision for income taxes in the consolidated statements of operations.
Stock-Based Compensation
The Company accounts for stock-based compensation awards granted to employees and directors based on the awards’ estimated grant date fair value. The Company estimates the fair value of its stock options using the Black-Scholes option-pricing model. The resulting fair value, net of forfeitures, is recognized on a straight-line basis over the period during which an employee is required to provide service in exchange for the award, usually the vesting period, which is generally four years. Estimated forfeitures are based upon the Company’s historical experience and the Company revises its estimates, if necessary, in subsequent periods if actual forfeitures differ from initial estimates.
On February 1, 2018, the Company adopted ASU 2016-09 Compensation-Stock Compensation (Topic 718): Improvements to Employee Share-Based Payment Account (“ASU 2016-09”) and elected to account for forfeitures as they occur in calculating compensation costs on a modified retrospective basis (unaudited).
Determining the grant date fair value of options using the Black-Scholes option pricing model requires management to make assumptions and judgments. These estimates involve inherent uncertainties and if the assumptions used differ significantly from the actual outcome, stock-based compensation expense may be materially different from the amounts recorded.
The Company accounts for equity instruments issued to nonemployees in accordance with the provisions of ASC 718, Accounting for Stock Compensation, and ASC 505, Accounting for Equity Instruments that are Issued to Other than Employees for Acquiring, or in Conjunction with Selling, Good or Services. Compensation expense for equity instruments granted to nonemployees is measured on the date of performance at the fair value of the consideration received or the fair value of the equity instruments issued, whichever is more reliably measured. Compensation expense for equity instruments granted to nonemployees is periodically re-measured as the underlying instruments vest.
Legal Contingencies
The Company may be subject to claims and other legal matters from time to time. The Company records a liability when it believes that it is both probable that a loss has been incurred and the amount can be reasonably estimated. The Company expects to periodically evaluate developments in the legal matters that could affect the amount of liability that the Company accrues, if any, and adjusts as appropriate. Until the final resolution of any such matter for which the Company may record a liability, there may be a loss exposure in excess of the liability recorded and such amount could be significant. Legal fees are expensed as incurred.
Comprehensive Income (Loss)
ASC 220, Comprehensive Income, establishes standards for the reporting and display of comprehensive income or loss and its components in the financial statements. For the years ended January 31, 2016, 2017 and 2018 and for the three months ended April 30, 2017 and 2018 (unaudited), the Company had no other comprehensive income (loss) items and therefore, comprehensive loss equaled net loss. Accordingly, a separate statement of comprehensive loss has not been presented.
F-15
Table of Contents
Adaptive Insights, Inc.
Notes to the Consolidated Financial Statements
Net Loss per Share Attributable to Common Stockholders
The Company computes basic and diluted net loss per share attributable to common stockholders in conformity with the two-class method required for participating securities. The Company considers all series of redeemable convertible preferred shares to be participating securities. Under the two-class method, basic net loss per share attributable to common stockholders is calculated by dividing the net loss attributable to common stockholders by the weighted-average number of shares of common stock outstanding during the period, less shares subject to repurchase. The net loss attributable to common stockholders is not allocated to the redeemable convertible preferred shares as the holders of redeemable convertible preferred shares do not have a contractual obligation to share in the Company’s losses. The diluted net loss per share attributable to common stockholders is computed giving effect to all potential dilutive common stock equivalents outstanding for the period. For purposes of this calculation, options to purchase common stock, shares subject to repurchase from early exercised options, and warrants are considered potentially dilutive securities but have been excluded from the calculation of diluted net loss per share attributable to common stockholders as the effect is antidilutive.
Unaudited Pro Forma Net Loss per Share
The unaudited pro forma basic and diluted net loss per share for the year ended January 31, 2018 and for the three months ended April 30, 2018 has been computed to give effect to the automatic conversion of the shares of redeemable convertible preferred stock into common stock as if such conversion had occurred at the beginning of the period. Unaudited pro forma net loss per share does not include the shares to be sold and related proceeds to be received from the Company’s planned IPO.
Deferred Offering Costs
Deferred offering costs, which consist of direct incremental legal, consulting, banking and accounting fees relating to anticipated equity offerings, are capitalized and will be offset against proceeds upon the consummation of the offerings. In the event an anticipated offering is terminated, deferred offering costs will be expensed. As of January 31, 2017, the Company had not incurred such costs. As of January 31, 2018 and April 30, 2018 (unaudited), the Company capitalized $0.3 million and $3.1 million of deferred offering costs, respectively, which are included in other assets in the consolidated balance sheet.
Recently Adopted Accounting Standards
In May 2017, the FASB issued Accounting Standard Update 2017-04, Intangibles—Goodwill and Other (Topic 350): Simplifying the Test for Goodwill Impairment (“ASU 2017-04”), which simplifies the subsequent measurement of goodwill by eliminating step 2 from the goodwill impairment test. Under the new guidance, an entity should perform its annual, or interim, goodwill impairment test by comparing the fair value of a reporting unit with its carrying amount. An entity should recognize an impairment charge for the amount by which the carrying amount exceeds the reporting unit’s fair value; however, the loss recognized should not exceed the total amount of goodwill allocated to that reporting unit. Additionally, an entity should consider income tax effects from any tax deductible goodwill on the carrying amount of the reporting unit when measuring the goodwill impairment loss, if applicable. The requirement to perform a qualitative assessment for any reporting unit with zero or negative carrying amount is eliminated. This guidance is to be applied on a prospective basis. The Company adopted this guidance in fiscal year 2018, and the adoption did not have a material impact on its consolidated financial statements.
In July 2017, the FASB issued ASU 2017-11, Earnings Per Share (Topic 260); Distinguishing Liabilities from Equity (Topic 480) (“ASU 2017-11”), which changes the classification analysis of certain equity-linked
F-16
Table of Contents
Adaptive Insights, Inc.
Notes to the Consolidated Financial Statements
financial instruments (or embedded features) with down round features. When determining whether certain financial instruments should be classified as liabilities or equity instruments, a down round feature no longer precludes equity classification when assessing whether the instrument is indexed to an entity’s own stock. For freestanding equity classified financial instruments, the amendments require entities that present earnings per share (“EPS”) in accordance with Topic 260 to recognize the effect of the down round feature when it is triggered. That effect is treated as a dividend and as a reduction of income available to common shareholders in basic EPS. In addition, redeemable convertible instruments with embedded conversion options that have down round features are now subject to the specialized guidance for contingent beneficial conversion features (in Subtopic 470-20, Debt—Debt with Conversion and Other Options), including related EPS guidance (in Topic 260). The Company adopted this guidance in fiscal year 2018, and the adoption did not have a material impact on its consolidated financial statements.
In March 2016, the FASB issued ASU No. 2016-09, Compensation-Stock Compensation (Topic 718): Improvements to Employee Share-Based Payment Accounting (“ASU 2016-09”). ASU 2016-09 simplifies several aspects of the accounting for share-based payments, including allowing an entity-wide accounting policy election to either estimate the number of awards that are expected to vest or account for forfeitures as they occur and immediate recognition of excess tax benefits in the income statement. The Company adopted ASU 2016-09 in the first quarter of fiscal year 2019 and elected to account for forfeitures as they occur in calculating compensation costs. The adoption of this guidance did not have a material impact on the Company’s financial statements (unaudited).
In April 2017, the FASB issued ASU 2017-09, Compensation—Stock Compensation (Topic 718): Scope of Modification Accounting (“ASU 2017-09”), which provides guidance on which changes to the terms or conditions of a share-based payment award require an entity to apply modification accounting in Topic 718. The Company adopted this guidance in the first quarter of fiscal year 2019, and the adoption of this guidance did not have a material impact on its consolidated financial statements (unaudited).
Recently Issued Accounting Standards
Under the Jumpstart Our Business Startups Act (“JOBS Act”), the Company meets the definition of an emerging growth company. The Company has elected to use the extended transition period for complying with new or revised accounting standards pursuant to Section 107(b) of the JOBS Act.
In May 2014, the FASB issued ASU No. 2014-09, Revenue from Contracts with Customers (“ASU 2014-09”), which provides guidance for revenue recognition. This ASU affects any entity that enters into contracts with customers to transfer goods or services. This ASU will supersede the revenue recognition requirements in Topic 605, Revenue Recognition, and most industry-specific guidance. Subsequently, the FASB has issued the following standards to amend ASU 2014-09: ASU 2015-14, Revenue from Contracts with Customers (Topic 606): Deferral of the Effective Date; ASU No. 2016-08, Revenue from Contracts with Customers (Topic 606): Principal versus Agent Considerations (Reporting Revenue Gross versus Net); ASU No. 2016-10, Revenue from Contracts with Customers (Topic 606): Identifying Performance Obligations and Licensing; ASU No. 2016-12, Revenue from Contracts with Customers (Topic 606): Narrow-Scope Improvements and Practical Expedients; and ASU 2016-20, Technical Corrections and Improvements to Topic 606, which clarifies narrow aspects of ASC 606 or corrects unintended application of the guidance. The Company must adopt ASU 2015-14, ASU 2016-08, ASU 2016-10, ASU 2016-12, and ASU 2016-20 with ASU 2014-09 (collectively, the “new revenue standards”). The guidance allows for the amendment to be applied either retrospectively to each prior reporting period presented or retrospectively as a cumulative-effect adjustment as of the date of adoption. The new revenue standards will be effective for the Company at the earlier of losing the emerging growth company status or in the first quarter of fiscal year 2020. The Company currently anticipates
F-17
Table of Contents
Adaptive Insights, Inc.
Notes to the Consolidated Financial Statements
adopting the new standard using the full retrospective transition method. As the Company continues to assess the new revenue standards along with industry trends and internal progress, the Company may adjust its implementation plan and methodology accordingly.
The new revenue standards remove the requirement to have Vendor Specific Objective Evidence (“VSOE”) to separate software and software related items. This will result in the acceleration of software-related professional services revenues for orders where the customers purchase downloadable software components and professional services. Under existing guidance, the Company recognizes the license fees for the downloadable software component, including the non-optional post-contract customer support, and professional service fees ratably over the contract term once the professional services have commenced under the combined services approach as the Company does not have VSOE of fair value for all of the undelivered software deliverables. Under the new revenue standards, the downloadable software component will be recognized ratably once the customer is provided log-in information, and professional services will be recognized as the services are performed. The new revenue standards also remove the current limitation on contingent revenues, which will result in revenues being recognized earlier for certain contracts. In addition, the new revenue standards change the criteria for evaluating customer options to purchase products or services in the future to determine whether a material right exists and requires a deferral of such rights. This deferral will be recognized as revenues when the customer option expires unexercised, or if exercised, it will be recognized along with the additional purchases. In addition, the new revenue standards will require that the Company capitalize certain incremental costs of obtaining a contract, such as sales commissions paid to internal sales personnel and to channel partners, which are currently expensed as incurred. Under the new revenue standards, such capitalized costs will be amortized over an estimated customer life for the initial acquisition of a contract and over the contractual term for renewal contracts.
While the Company cannot reasonably estimate quantitative information related to the impact of the new revenue standards on its financial statements at this time and continues to assess the potential impacts of the new revenue standards, it expects that the impact on its total revenues will not be material and that the capitalization of sales commission expenses will have a material positive impact on its results of operations.
In February 2016, the FASB issued ASU 2016-02, Leases (“ASU 2016-02”). The new standard establishes a right-of-use (“ROU”) model that requires a lessee to record a ROU asset and a lease liability on the balance sheet for all leases with terms longer than 12 months. Leases will be classified as either finance or operating, with classification affecting the pattern of expense recognition in the income statement. The guidance is effective for the Company in the first quarter of fiscal year 2021. Early adoption is permitted. A modified retrospective transition approach is required for lessees for capital and operating leases existing at, or entered into after, the beginning of the earliest comparative period presented in the financial statements, with certain practical expedients available. The Company is currently evaluating the impact of adopting ASU 2016-02 on its consolidated financial statements.
In March 2016, the FASB issued ASU 2016-09, Stock Compensation (Topic 718): Improvements to Employee Share-Based Payment Accounting (“ASU 2016-09”), which simplifies several aspects of the accounting for employee share-based payment transactions, including the accounting for income taxes, forfeitures, and statutory tax withholding requirements, as well as classification in the statement of cash flows. The Company will adopt this guidance in the first quarter of fiscal year 2019. The Company anticipates that the adoption of this guidance will not have a material impact on its consolidated financial statements.
In October 2016, the FASB issued ASU 2016-16, Income Taxes (Topic 740): Intra-entity Transfers of Assets other than Inventory (“ASU 2016-16”), which requires recognition of current and deferred income taxes resulting from an intra-entity transfer of any asset other than inventory when the transfer occurs. The guidance is
F-18
Table of Contents
Adaptive Insights, Inc.
Notes to the Consolidated Financial Statements
effective for the Company in the first quarter of fiscal year 2020. The Company is currently evaluating the impact this guidance will have on the Company’s consolidated financial statements.
In April 2017, the FASB issued ASU 2017-09, Compensation—Stock Compensation (Topic 718): Scope of Modification Accounting (“ASU 2017-09”), which provides guidance on which changes to the terms or conditions of a share-based payment award require an entity to apply modification accounting in Topic 718. The Company will adopt this guidance in the first quarter of fiscal year 2019, and the adoption of this guidance will not have a material impact on its consolidated financial statements.
In August 2017, the FASB issued ASU 2017-12, Derivatives and Hedging (Topic 815): Targeted Improvements to Accounting for Hedging Activities (“ASU 2017-12”), which expands and refines hedge accounting for both nonfinancial and financial risk components and align the recognition and presentation of the effects of the hedging instrument and the hedged item in the financial statements. The amendments are effective for the Company in the first quarter of fiscal year 2021. The Company does not expect this guidance to have a material impact on its consolidated financial statements.
In February 2018, the FASB issued ASU No. 2018-02, Reclassification of Certain Tax Effects from Accumulated Other Comprehensive Income (Topic 815) (“ASU 2018-02”), which allows a reclassification from accumulated other comprehensive income (loss) to retained earnings (accumulated deficit) for stranded income tax effects resulting from the 2017 Tax Cuts and Jobs Act. The amendments in this ASU also require certain disclosures about stranded income tax effects. The Company will adopt this guidance in the fiscal year 2020. The Company does not anticipate the adoption of this standard will have a material impact on its consolidated financial statements.
3. Property and Equipment
Property and equipment consisted of the following (in thousands):
| January 31, | ||||||||
| 2017 | 2018 | |||||||
| Computer equipment |
$ | 9,131 | $ | 8,183 | ||||
| Software licenses |
2,070 | 1,982 | ||||||
| Leasehold improvements |
2,033 | 1,715 | ||||||
| Office equipment |
767 | 682 | ||||||
|
|
|
|
|
|||||
| Total property and equipment |
14,001 | 12,562 | ||||||
| Less: Accumulated depreciation and amortization |
(9,883 | ) | (9,954 | ) | ||||
|
|
|
|
|
|||||
| Property and equipment, net |
$ | 4,118 | $ | 2,608 | ||||
|
|
|
|
|
|||||
Depreciation and amortization expense for property and equipment for the years ended January 31, 2016, 2017 and 2018 and the three months ended April 30, 2017 and 2018 (unaudited) was $3.5 million, $3.3 million, $2.7 million, $0.8 million and $0.5 million, respectively.
4. Goodwill and Intangible Assets
There was no change in the Company’s goodwill balance during fiscal 2016, 2017 and 2018 and the three months ended April 30, 2017 and 2018 (unaudited).
F-19
Table of Contents
Adaptive Insights, Inc.
Notes to the Consolidated Financial Statements
The Company’s intangible assets consisted of the following (in thousands):
| January 31, | ||||||||
| 2017 | 2018 | |||||||
| Acquired developed technology |
$ | 3,090 | $ | 3,090 | ||||
| Less: Accumulated amortization |
(2,733 | ) | (3,090 | ) | ||||
|
|
|
|
|
|||||
| Intangible assets, net |
$ | 357 | $ | — | ||||
|
|
|
|
|
|||||
Intangible asset amortization expense was $0.6 million, $0.7 million, $0.4 million and $0.2 million for the years ended January 31, 2016, 2017 and 2018 and for the three months ended April 30, 2017 (unaudited), respectively. There was no amortization expense recorded for the three months ended April 30, 2018 (unaudited).
Amortization of acquired developed technology is included in cost of subscription revenues in the consolidated statements of operations. As of January 31, 2018, all acquired intangible assets have been fully amortized.
5. Accrued Expenses and Other Current Liabilities
The Company’s accrued expenses and other current liabilities are comprised of the following (in thousands):
| January 31, | ||||||||
| 2017 | 2018 | |||||||
| Accrued salary and employee benefits |
$ | 4,984 | $ | 8,489 | ||||
| Accrued bonus |
2,395 | 5,850 | ||||||
| Taxes payable |
116 | 103 | ||||||
| Customer deposit |
573 | 1,031 | ||||||
| Sales tax payable |
970 | 1,604 | ||||||
| Deferred rent |
331 | 196 | ||||||
| Other accrued expenses |
1,571 | 5,935 | ||||||
|
|
|
|
|
|||||
| $ | 10,940 | $ | 23,208 | |||||
|
|
|
|
|
|||||
6. Fair Value Measurements
ASC 820, Fair Value Measurements (“ASC 820”) requires entities to disclose the fair value of financial instruments, both assets and liabilities recognized and not recognized on the balance sheet, for which it is practicable to estimate fair value. Fair value is defined as the exchange price that would be received for an asset or paid to transfer a liability (an exit price) in the principal or most advantageous market for the asset or liability in an orderly transaction between market participants on the measurement date.
Assets and liabilities recorded at fair value in the financial statements are categorized based upon the level of judgment associated with the inputs used to measure their fair value. Hierarchical levels which are directly related to the amount of subjectivity associated with the inputs to the valuation of these assets or liabilities are as follows:
| Level 1 Observable inputs, such as quoted prices in active markets for identical assets or liabilities. |
| Level 2 Observable inputs other than Level 1 prices such as quoted prices for similar assets or liabilities, quoted prices in markets that are not active, or other inputs that are observable or can be corroborated by observable market data for substantially the full term of the assets or liabilities. |
F-20
Table of Contents
Adaptive Insights, Inc.
Notes to the Consolidated Financial Statements
| Level 3 Unobservable inputs that are supported by little or no market activity and that are significant to the fair value of the assets or liabilities. |
There have been no transfers between fair value measurement levels during the periods presented. The following table represents the Company’s financial assets measured at fair value on a recurring basis categorized by the fair value hierarchy (in thousands):
| January 31, 2017 | ||||||||||||||||
| Level 1 | Level 2 | Level 3 | Fair Value | |||||||||||||
| Financial Assets: |
||||||||||||||||
| Money market funds |
$ | 17,857 | $ | — | $ | — | $ | 17,857 | ||||||||
|
|
|
|
|
|
|
|
|
|||||||||
| Total assets measured at fair value |
$ | 17,857 | $ | — | $ | — | $ | 17,857 | ||||||||
|
|
|
|
|
|
|
|
|
|||||||||
| Financial Liabilities: |
||||||||||||||||
| Common stock warrant liability |
$ | — | $ | — | $ | — | $ | — | ||||||||
|
|
|
|
|
|
|
|
|
|||||||||
| Total liabilities measured at fair value |
$ | — | $ | — | $ | — | $ | — | ||||||||
|
|
|
|
|
|
|
|
|
|||||||||
| January 31, 2018 | ||||||||||||||||
| Level 1 | Level 2 | Level 3 | Fair Value | |||||||||||||
| Financial Assets: |
||||||||||||||||
| Money market funds |
$ | 19,160 | $ | — | $ | — | $ | 19,160 | ||||||||
|
|
|
|
|
|
|
|
|
|||||||||
| Total assets measured at fair value |
$ | 19,160 | $ | — | $ | — | $ | 19,160 | ||||||||
|
|
|
|
|
|
|
|
|
|||||||||
| Financial Liabilities: |
||||||||||||||||
| Common stock warrant liability |
$ | — | $ | — | $ | 1,386 | $ | 1,386 | ||||||||
|
|
|
|
|
|
|
|
|
|||||||||
| Total liabilities measured at fair value |
$ | — | $ | — | $ | 1,386 | $ | 1,386 | ||||||||
|
|
|
|
|
|
|
|
|
|||||||||
| April 30, 2018 | ||||||||||||||||
| Level 1 | Level 2 | Level 3 | Fair Value | |||||||||||||
| (unaudited) |
||||||||||||||||
| Financial Assets: |
||||||||||||||||
| Money market funds |
$ | 33,370 | $ | — | $ | — | $ | 33,370 | ||||||||
|
|
|
|
|
|
|
|
|
|||||||||
| Total assets measured at fair value |
$ | 33,370 | $ | — | $ | — | $ | 33,370 | ||||||||
|
|
|
|
|
|
|
|
|
|||||||||
| Financial Liabilities: |
||||||||||||||||
| Common stock warrant liability |
$ | — | $ | — | $ | — | $ | — | ||||||||
|
|
|
|
|
|
|
|
|
|||||||||
| Total liabilities measured at fair value |
$ | — | $ | — | $ | — | $ | — | ||||||||
|
|
|
|
|
|
|
|
|
|||||||||
The warrant to purchase common stock issued in conjunction with the 2017 Loan Agreement is classified as a liability and is measured at fair value each period. The fair value is determined using a monte carlo simulation valuation approach. The fair value includes significant inputs not observable in the market, which represents a Level 3 measurement within the fair value hierarchy. The valuation of common stock warrants uses assumptions management believes would be made by a market participant. Management assesses these estimates on an ongoing basis as additional data impacting the assumptions becomes available. Changes in the fair value of the
F-21
Table of Contents
Adaptive Insights, Inc.
Notes to the Consolidated Financial Statements
common stock warrant liability related to updated assumptions and estimates are recognized within other expense (income), net in the consolidated statements of operations. The significant inputs used in the fair value measurement of the common stock warrant are the estimated fair value of the Company’s common stock and the probability of a change in control, which impacts the expected term, expected stock volatility and risk-free interest rate. Significant increases or decreases in the estimated fair value of the Company’s common stock would significantly impact the fair value of the common stock warrant liability.
On March 6, 2018, the terms of the warrant agreement were amended resulting in the removal of the exercise price reset feature. As a result, the warrant has been reclassified from liability to equity. See Note 8 for further details on the accounting impact resulting from the amendment to the warrant agreement (unaudited).
The following table summarizes the changes in the common stock warrant liability (in thousands):
| Common Stock Warrant Liability |
||||
| Balance as of January 31, 2017 |
$ | — | ||
| Issuance of common stock warrant on June 2, 2017 |
733 | |||
| Change in fair value of common stock warrant liability |
653 | |||
|
|
|
|||
| Balance as of January 31, 2018 |
$ | 1,386 | ||
|
|
|
|||
| Change in fair value of common stock warrant liability (unaudited) |
339 | |||
| Reclassification from liability to equity (unaudited) |
(1,725 | ) | ||
|
|
|
|||
| Balance as April 30, 2018 (unaudited) |
$ | — | ||
|
|
|
|||
Certain assets, including goodwill and long-lived assets, are also subject to measurement at fair value on a non-recurring basis if they are deemed to be impaired as a result of an impairment review. For the years ended January 31, 2016, 2017 and 2018 and the three months ended April 30, 2017 and 2018 (unaudited), no impairments were identified on those assets required to be measured at fair value on a non-recurring basis.
7. Borrowing Arrangements
2014 Loan Agreement
On December 29, 2014 the Company entered into loan and security agreement (the “2014 Loan Agreement”) with Silicon Valley Bank consisting of three-year revolving revenue line of credit and a $5.0 million four-year equipment term loan with a lender. The maximum amount that the Company can draw from the revolving revenue line of credit is the lesser of (1) $17 million or (2) monthly recurring revenues as defined in the Agreement multiplied by four. The equipment term loan from the lender was available for draw down until December 28, 2015. At the closing of this debt financing, $4.4 million of the equipment term loan and $0 of the revolving revenue line of credit were drawn down.
Under the 2014 Loan Agreement, the revolving revenue line of credit was scheduled to mature on December 29, 2017. On December 22, 2017, the Company and the lender entered into an amendment to the 2014 Loan Agreement to extend the maturity date from December 29, 2017 to March 29, 2018. The principal can be paid and re-borrowed during the term. The interest rate is based on the Wall Street Journal’s Prime Rate (“WSJ Prime”), which was 3.75% and 4.50% as of January 31, 2017 and 2018, respectively, plus 0.25%. The Company will also pay 20 basis points on the maximum available amount under the line of credit facility per annum in loan commitment fees, due at closing and on the first and second anniversary of the closing. Each installment of the
F-22
Table of Contents
Adaptive Insights, Inc.
Notes to the Consolidated Financial Statements
loan commitment fee is $34 thousand. The loan commitment fees are amortized over the duration the revolving line of credit is available to the Company on a straight-line basis. As of January 31, 2018, the Company has not drawn down from this revolving revenue line of credit.
The equipment term loan matures on December 29, 2018. The interest rate is based on the WSJ Prime plus 0.75%. For the funds drawn at the initial close, the equipment term loan has scheduled monthly payments due on the first day of each month in 48 equal principal amounts plus interest. The monthly principal repayment for the initial equipment advance drawn is $92 thousand. For all other advances, the advanced amount will be repaid in 36 equal monthly payments of principal plus interest and due on the first day of each month. The Company has not made any additional advances since the initial closing date of the 2014 Loan Agreement. The Company will pay a fee equal to 1% of the initial equipment term loan advance, or $44 thousand, upon maturity of the loan. The net carrying value of the term loan was $2.1 million and $1.0 million as of January 31, 2017 and 2018, respectively. The equipment loan is collateralized by certain property and equipment of the Company.
Under the 2014 Loan Agreement, any distributions on the Company’s equity as well as additional borrowings by the Company require consent by the lender. The 2014 Loan Agreement also contains customary representations and warranties and customary affirmative and negative covenants applicable to the Company and its subsidiaries. Financial covenants require cash to be held at the lender, plus availability on the recurring revenue line of credit, in excess of $10.0 million. If cash held at the lender falls below $10.0 million, the Company must maintain certain minimum trailing six month bookings. In July 2016, the Company and the lender amended the 2014 Loan Agreement and specified that the Company must maintain minimum trailing six-month bookings of $34.1 million, $38.5 million, $47.2 million and $50.4 million for the six months ending March 31, 2016, June 30, 2016, September 30, 2016 and December 31, 2016, respectively. For calendar year 2017 and beyond, the minimum trailing six-month bookings will remain the same as the original agreement. In June 2017, the Company and the lender further amended the 2014 Loan Agreement (the “Second Amendment”) and specified that the Company must maintain minimum trailing six-month bookings of $39.9 million, $46.2 million, $49.8 million and $51.6 million for the six months ending April 31, 2017, July 31, 2017, October 31, 2017 and January 31, 2018, respectively. Subsequent to January 31, 2018, the minimum trailing six month bookings will be set at 80% of the Company’s projected bookings for such period as set forth in the 2018 business plan, provided that the bookings covenant requirement is not based on year-over-year growth less than 20%. In the Second Amendment, the Company agreed to add certain intellectual property as collateral to its obligations with the lender.
In addition, there is a covenant relating to delivery of audited financial statements 270 days after fiscal year end. In the third quarter of fiscal year 2016, the Company did not comply with this debt covenant. The Company received a waiver for not complying with the covenant and accordingly did not change the classification of the related debt to short term at January 31, 2016. The Company was in compliance with this covenant for fiscal year 2017 and 2018.
Further Amendment to the 2014 Loan Agreement (Unaudited)
On March 5, 2018, the Company further amended the 2014 Loan Agreement (the “2018 Amended Loan Agreement”). Under the 2018 Amended Loan Agreement, the maximum available amount of the revolving revenue line of credit is the lesser of (1) $25.0 million or (2) monthly recurring revenues as defined in the Agreement multiplied by four hundred percent adjusted for the Company’s annualized customer retention rate. The revolving line of credit will mature on March 5, 2021.
Under the 2018 Amended Loan Agreement, the principal can be paid and re-borrowed during the term. The interest rate is based on the Wall Street Journal’s Prime Rate (“WSJ Prime”) plus 0.25%. The Company is
F-23
Table of Contents
Adaptive Insights, Inc.
Notes to the Consolidated Financial Statements
subject to interest on $10.0 million for a minimum period commencing on the first month beginning after the effective date of the 2018 Amended Loan Agreement until the earlier of (1) the maturity date, (2) a liquidity event as defined in the agreement, (3) 12 months following the effective date of the agreement and (4) the termination of the agreement.
In addition, the financial covenants noted in the 2014 Loan Agreement and subsequent amendments were replaced with a requirement to maintain a liquidity ratio equal to or greater than 1.75, measured on a monthly basis. The liquidity ratio is calculated as the ratio of the sum of unrestricted and unencumbered cash held at the lender plus accounts receivables, divided by the outstanding principal balance with the lender. The Company was in compliance with this covenant for the three months ended April 30, 2018 (unaudited).
The Company paid an annual commitment fee of $50 thousand at closing and will pay $50 thousand on the first and second anniversary of the closing. On March 5, 2018, the Company drew down $10.0 million from this revolving revenue line of credit.
2017 Loan Agreement
In June 2017, the Company entered into a loan and security agreement (the “2017 Loan Agreement”) with SilverLake Waterman Fund, L.P. for a $40.0 million term loan facility. The maturity date of the term loans is June 2, 2021. Under the 2017 Loan Agreement, the Company pays cash interest in arrears on the unpaid principal on a monthly basis at a fixed rate of 6.5% per annum. The Company also incurs additional interest paid in kind on the unpaid principal at a fixed rate of 5.5% per annum, which amount is added to the outstanding principal balance monthly in arrears. The unpaid principal amount of the term loans is due in a single payment on the maturity date, together with any accrued and unpaid interest. If the Company elects to prepay all or any portion of the term loans, it will be required to pay a prepayment premium in an amount equal to the principal amount of the term loan prepaid multiplied by 4.0% if the prepayment is during the first year after the funding date of the principal amount of the term loan prepaid, 3.0% if the prepayment is during the second year after the funding date of the term loan prepaid, 2.0% if the prepayment is during the third year after the funding date of the term loan prepaid and 1.0% if the prepayment is during the fourth year after the funding date of the term loan prepaid (but prior to the maturity date), except that if any term loan is prepaid within 30 days after the effective date of the initial registration statement for a public offering of the Company’s capital stock or in connection with an acquisition by another entity of all or substantially all of our assets or of more than 50% of the Company’s capital stock for aggregate consideration of at least $600.0 million, then, the prepayment premium will be the lesser of 1.5% of the principal amount of the term loan prepaid and the prepayment premium that would otherwise apply. The Company paid a commitment fee of $0.2 million at the closing of the 2017 Loan Agreement, and will be required to pay an additional commitment fee of 0.9% of the principal amount of any additional term loans funded. The Company incurred $0.1 million in debt issuance costs in connection with the 2017 Loan Agreement.
The Company drew down $25.0 million under the 2017 Loan Agreement at closing (the “Initial Drawdown”). The remaining $15.0 million was available for drawdown subject to customary conditions. The 2017 Loan Agreement also includes customary affirmative and negative covenants and reporting requirements applicable to the Company and its subsidiaries. The negative covenants include restrictions on the Company’s ability to dispose of assets, enter into change of control transactions, merge with or acquire other entities, incur indebtedness, encumber its assets, pay dividends and enter into affiliate transactions. The Company has been in compliance with these covenants since the Initial Drawdown. The 2017 Loan Agreement also includes customary events of default. The obligations under the 2017 Loan Agreement are collateralized by a lien on substantially all assets.
F-24
Table of Contents
Adaptive Insights, Inc.
Notes to the Consolidated Financial Statements
Second Drawdown of the 2017 Loan Agreement (Unaudited)
On March 6, 2018, the Company drew down the second tranche amounting to $15.0 million (the “Second Drawdown”) under the 2017 Loan Agreement. The Second Drawdown is subject to the same terms and conditions as the Initial Drawdown.
The net carrying value of the Company’s long-term debt as of January 31, 2018 consists of the following (in thousands):
| January 31, 2018 |
||||
| Principal amount (including interest paid in kind) |
$ | 26,952 | ||
| Unamortized debt issuance costs and debt discount |
(933 | ) | ||
|
|
|
|||
| Net carrying value |
$ | 26,019 | ||
|
|
|
|||
The repayment schedule relating to the Company’s long-term debt as of January 31, 2018 is as follows (in thousands):
| Year ending January 31, |
||||
| 2019 |
$ | 1,014 | ||
| 2020 |
— | |||
| 2021 |
— | |||
| 2022 |
25,938 | |||
| Thereafter |
— | |||
|
|
|
|||
| Total |
$ | 26,952 | ||
|
|
|
|||
The net carrying value of the Company’s long-term debt as of April 30, 2018 consists of the following (in thousands):
| April 30, 2018 |
||||
| (unaudited) | ||||
| Principal amount (including interest paid in kind) |
$ | 52,167 | ||
| Unamortized debt issuance costs and debt discount |
(2,105 | ) | ||
|
|
|
|||
| Net carrying value |
$ | 50,062 | ||
|
|
|
|||
The repayment schedule relating to the Company’s long-term debt as of April 30, 2018 is as follows (in thousands):
| Year ending January 31, (unaudited) |
||||
| 2019 (remaining nine months) |
$ | 737 | ||
| 2020 |
— | |||
| 2021 |
— | |||
| 2022 |
51,430 | |||
| Thereafter |
— | |||
|
|
|
|||
| Total |
$ | 52,167 | ||
|
|
|
|||
F-25
Table of Contents
Adaptive Insights, Inc.
Notes to the Consolidated Financial Statements
8. Issuance of Common Stock Warrant
In conjunction with the 2017 Loan Agreement and the Initial Drawdown, the Company issued a warrant to purchase 223,582 shares of common stock on June 2, 2017. The warrant was fully vested upon initial issuance and is exercisable in whole or in part, at any time and from time to time from the date of grant through the tenth anniversary of the date of grant. The exercise price of the warrant is the lesser of $5.00, which represents the fair value of the Company’s common stock as of January 31, 2017, and the lowest fair value of a share of the Company’s common stock as determined by a subsequent 409A valuation report.
For any future additional drawdown under the 2017 Loan Agreement, the number of shares of common stock exercisable pursuant to the warrant will be adjusted as necessary to equal the product of (1) the principal amount of additional drawdown divided by $10,000,000 and (2) a number of shares necessary to provide the holder with ownership of 0.2% of the Company on a fully diluted basis. This warrant is liability classified under ASC 815-40, Contracts in Entity’s Own Equity, as it contains an exercise price reset feature that is not considered indexed to the Company’s own equity and the feature does not qualify as a down round feature under ASU 2017-11 Earnings Per Share (Topic 260); Distinguishing Liabilities from Equity (Topic 480). The terms of the warrant state that the strike price of the warrant will be reduced if a subsequent valuation indicates that the fair value of the Company’s common stock is below the current strike price. The warrant is measured at fair value each period with changes in fair value recorded in other expense (income), net in the consolidated statements of operations. The warrant will continue to be measured at fair value each period until the earlier of exercise or termination. The initial carrying value of the debt was reduced by the fair value of the warrant. The resulting debt discount will be amortized to interest expense over the life of the debt using the effective interest method.
Amendment to the Terms of the Existing Common Stock Warrant and Issuance of Additional Common Stock Warrant (Unaudited)
On March 6, 2018, in conjunction with the Second Drawdown of the 2017 Loan Agreement, the terms of the existing warrant agreement were amended to remove the exercise price reset feature. As a result, the common stock warrant is no longer considered indexed to the Company’s own equity. The warrant was remeasured at fair value on March 6, 2018 and was reclassified from liability to additional paid-in capital on the consolidated balance sheets. As a result of the change in classification, the warrant is no longer remeasured at fair value each period.
In conjunction with the Second Drawdown of the 2017 Loan Agreement, the Company issued an additional common stock warrant to purchase 141,050 shares of common stock at an exercise price of $5.00 per share. The warrant was fully vested upon initial issuance and exercisable, in whole or in part, at any time and from time to time from the date of the grant through the tenth anniversary of the date of grant. The common stock warrant is measured at its estimated fair value upon issuance using the Black-Scholes pricing model amounting to $1.1 million and is recorded in additional paid in capital on the consolidated balance sheet.
9. Commitments and Contingencies
Leases
The Company leases office facilities under non-cancelable operating leases, which have expirations through July 2023. Rent expense, which is being recognized on a straight-line basis over the lease term, was $2.8 million, $2.8 million, $2.9 million, $0.7 million and $0.6 million during the years ended January 31, 2016, 2017 and 2018 and the three months ended April 30, 2017 and 2018 (unaudited), respectively. The difference between the lease payments made and the lease expense recognized to date using the straight-line method is recorded as deferred rent. As of January 31, 2017 and 2018 and April 30, 2018 (unaudited), $0.3 million, $0.2 million and
F-26
Table of Contents
Adaptive Insights, Inc.
Notes to the Consolidated Financial Statements
$0.1 million, respectively, in deferred rent was included within accrued expenses and other current liabilities, and $0.2 million, $0.1 million and $0.3 million, respectively, was included in other long-term liabilities.
The Company has $0.2 million $0.2 million and $0.3 million held as deposits and included in prepaid expenses and other current assets as of January 31, 2017, January 31, 2018 and April 30, 2018 (unaudited), respectively, and $0.2 million, $34 thousand and $0.1 million, respectively, in deposits related to leases that were included in long-term other assets as of January 31, 2017, January 31, 2018 and April 30, 2018 (unaudited), respectively.
Future minimum lease payments required under these agreements as of January 31, 2018 are as follows (in thousands):
| Year Ending January 31, |
||||
| 2019 |
$ | 1,914 | ||
| 2020 |
243 | |||
| 2021 |
198 | |||
| 2022 |
123 | |||
| 2023 |
126 | |||
| Thereafter |
11 | |||
|
|
|
|||
| Total |
$ | 2,615 | ||
|
|
|
|||
In December 2016, the Company issued a letter of credit with a bank for $0.8 million to serve as a guarantee for an operating lease. This letter of credit matures in November 2018, but does not extend beyond the corresponding lease agreements for which such letter of credit has been obtained.
During the three months ended April 30, 2018 (unaudited), the Company issued two letters of credit with a bank totaling $0.6 million to serve as a guarantee for operating leases. The letters of credit mature in March and April 2019, but do not extend beyond the corresponding lease agreements for which such letters of credit were obtained.
Other Commitments
The Company has certain noncancelable arrangements for data hosting, software subscription agreements, internet and marketing services. As of January 31, 2018, future minimum payments under these arrangements are as follows (in thousands):
| Year Ending January 31, |
||||
| 2019 |
$ | 2,147 | ||
| 2020 |
272 | |||
| 2021 |
9 | |||
| Thereafter |
— | |||
|
|
|
|||
| Total |
$ | 2,428 | ||
|
|
|
|||
Indemnification
The Company enters into standard indemnification arrangements in the ordinary course of business. Pursuant to these arrangements, the Company indemnifies, holds harmless, and agrees to reimburse the
F-27
Table of Contents
Adaptive Insights, Inc.
Notes to the Consolidated Financial Statements
indemnified parties for losses suffered or incurred by the indemnified party, in connection with any trade secret, copyright, patent or other intellectual property infringement claim by any third-party with respect to its technology. The term of these indemnification agreements is generally perpetual any time after the execution of the agreement. The maximum potential amount of future payments the Company could be required to make under these agreements is not determinable because it involves claims that may be made against the Company in the future, but have not yet been made.
The Company includes service level commitments to its customers warranting certain levels of uptime reliability and performance and permitting those customers to receive credits in the event that the Company fails to meet those levels.
The Company has not incurred any costs as a result of these arrangements and commitments and has not accrued any liabilities related to such obligations in the consolidated financial statements as of January 31, 2017, January 31, 2018 and April 30, 2018 (unaudited).
10. Redeemable Convertible Preferred Stock
On June 22, 2015, the Company issued 5,915,193 shares of Series G Preferred Stock at a price of $12.68 per share for gross proceeds of $75 million. Associated transaction costs were $0.2 million and were recorded against the balance of the Series G Preferred Stock.
The following table summarizes the authorized, issued and outstanding redeemable convertible preferred stock of the Company as of January 31, 2017, January 31, 2018 and April 30, 2018 (unaudited) (in thousands, except per share data):
| Class |
Issue Price per Share |
Shares Authorized |
Shares Issued and Outstanding |
Net Carrying Value |
Liquidation Preference |
|||||||||||||||
| Series A |
$ | 4.00 | 4,576 | 1,144 | $ | 4,536 | $ | 4,576 | ||||||||||||
| Series B |
$ | 4.00 | 7,175 | 1,794 | 7,121 | 7,175 | ||||||||||||||
| Series C |
$ | 2.33 | 12,876 | 3,219 | 7,434 | 7,500 | ||||||||||||||
| Series D |
$ | 2.89 | 19,375 | 4,844 | 13,863 | 14,016 | ||||||||||||||
| Series E |
$ | 3.78 | 23,500 | 5,857 | 22,032 | 22,127 | ||||||||||||||
| Series E-1 |
$ | 3.78 | 4,000 | 1,000 | 3,680 | 3,778 | ||||||||||||||
| Series F |
$ | 7.07 | 26,018 | 6,505 | 45,770 | 46,000 | ||||||||||||||
| Series G |
$ | 12.68 | 23,661 | 5,915 | 74,809 | 75,000 | ||||||||||||||
|
|
|
|
|
|
|
|
|
|||||||||||||
| Total |
121,181 | 30,278 | $ | 179,245 | $ | 180,172 | ||||||||||||||
|
|
|
|
|
|
|
|
|
|||||||||||||
The rights, preferences and privileges of the preferred stock are as follows:
Dividends
Holders of Series A, B, C, D, E, E-1, F and G preferred stock are entitled to receive noncumulative dividends in preference to the common stockholders at the rate of 8% per share of the original issue price, per annum, on each outstanding share of preferred stock payable when and as declared by the Board of Directors. Holders of Series G are entitled to receive dividends in preference to the other preferred stockholders, holders of Series F are entitled to receive dividends in preference to holders of Series A, B, C, D, E-1 and E, holders of Series E-1 and E are entitled to receive dividends in preference to holders of Series A, B, C, and D, holders of Series D are entitled to receive dividends in preference to holders of Series A, B, and C, and holders of Series A,
F-28
Table of Contents
Adaptive Insights, Inc.
Notes to the Consolidated Financial Statements
B and C are entitled to receive dividends in preference to holders of common stock. Holders of Series A, B, C, D, E, E-1, F and G are also entitled to receive dividends on an equal basis with common stock, when and as declared by the Board. So long as any shares of Series G preferred stock are outstanding, the Company shall not pay or declare any dividend, whether in cash or property, or make any other distribution on the Series F, E-1, E, D, C, B, or A preferred stock or common stock, or purchase, redeem, or otherwise acquire for value any shares of Series F, E-1, E, D, C, B, or A preferred stock or common stock until all dividends as set forth above on the Series G preferred stock shall have been paid or declared and set apart. This limitation also applies to the dividend preferences of the Series F, E-1, E, D, C, B, and A as set forth above. No dividends have been declared to date.
Voting rights
Holders of preferred stock are entitled to the number of votes equal to the number of common stock into which they can be converted. Holders of preferred stock, voting separately as a class, are entitled to elect four members of the Board of Directors. Holders of common stock, voting as a separate class, are entitled to elect two members of the board, one of which shall be the Company’s then-serving Chief Executive Officer. Holders of preferred and common stock, voting together as a single class on an as-converted basis, jointly vote on the remaining board member seats.
Conversion
Holders of preferred stock have the option to convert each share of preferred stock held by such stockholder into one share of common stock (subject to adjustment for events of dilution such as stock splits, dividends, recapitalizations and the like) at any time. Each share of preferred stock shall automatically be converted into common stock upon the earlier of (i) in the case of the Series G, E-1, E, D, C, B, and A, the affirmative election of the holders of at least 66 2/3% of the shares of Series G, E-1, E, D, C, B, and A then outstanding, provided that, in the case of the Series G, if such conversion is not effective and conditioned upon the closing of an initial public offering, a separate affirmative election of the holders of at least 66 2/3% of the shares of Series G then outstanding is required; (ii) in the case of the Series F, the affirmative election of the holders of a majority of the shares of Series F preferred stock then outstanding; or (iii) an initial public offering in which: (1) the per share price to the public is at least $14.14 (as adjusted for stock splits, dividends, recapitalizations and the like), (2) the aggregate net cash proceeds to the Company are at least $50.0 million, and (3) the Company’s common stock is traded on the New York Stock Exchange or the Nasdaq Stock Market.
Antidilution Provisions
The conversion price of each series of preferred stock shall be subject to a broad-based weighted-average adjustment to reduce dilution in the event that the Company issues additional equity securities with an effective price less than (1) in the case of the Series G, the then applicable conversion price of the Series G, (2) in the case of the Series F, the then applicable conversion price of the Series F, (3) in the case of the Series A, B, E, and E-1, the then applicable conversion price of the Series E, (4) in the case of the Series D, the then applicable conversion price of the Series D, and (5) in the case of the Series C, the then applicable conversion price of the Series C, in each case other than additional equity securities issued pursuant to customary exclusions including reserved employee options and in connection with certain strategic transactions.
Other Rights
In the event that (i) the holders of at least 66 2/3% of the outstanding shares of preferred stock propose to sell their shares of capital stock or approve a merger, consolidation, sale of all or substantially all of the Company’s assets, or such other change of control transaction in which stockholders of the Company
F-29
Table of Contents
Adaptive Insights, Inc.
Notes to the Consolidated Financial Statements
immediately prior to such transaction hold or own less than a majority of the voting power of the Company immediately after such transaction and (ii) the Board of Directors of the Company approves such transaction, then all stockholders of the Company that are parties to the Company’s amended and restated voting agreement dated as of June 22, 2015, as amended, shall be required to sell their shares of capital stock and/or vote their shares in favor of such transaction, provided that, among other things, (1) such stockholders will receive proceeds at least equal to the amount that would have been distributed in accordance with the liquidation preference set forth in the Company’s then effective certificate of incorporation, (2) such stockholders are not required to execute or modify a non-compete, non-solicitation or any agreement with similar restrictions, and (3) any representations and warranties made by such stockholders are limited to capital stock ownership, authorization, delivery, and the absence conflicts with respect to the performance of such stockholders obligations.
Liquidation
In the event of liquidation, dissolution, or winding-up of the Company, the holders of Series G preferred stock are entitled to receive payment in preference to the holders of Series A, B, C, D, E, E-1 or F preferred stock or common stock. Holders of Series F preferred stock are entitled to receive payment in preference to the holders of Series A, B, C, D, E, or E-1 preferred stock or common stock. Holders of Series E-1 and E are entitled to receive payment in preference to the holders of Series A, B, C, or D or common stock. Holders of Series D are entitled to receive payment in preference to the holders of Series A, B, or C or common stock, and holders of Series A, B, and C are entitled to receive payment in preference to the holders of common stock. Holders of preferred stock are entitled to receive an amount equal to their original issue price per share, plus any declared but unpaid dividends in the preference order set forth above. After payment to the holders of preferred stock, any remaining assets and funds are to be distributed ratably among the holders of common stock and preferred stock (except for Series E-1) based on the number of shares of common stock held by each stockholder (assuming full conversion of all such preferred stock) until the holders of Series E have received an aggregate of three times their original issue price, the holders of Series A, B, C, D, and F have received an aggregate of two times their original issue price and the holders of Series G have received an aggregate of one time their original issue price. After payment has been made to the holders of common stock and preferred stock of the full amounts to which they are entitled, any remaining assets and surplus are to be distributed ratably among the holders of common stock based upon the number of shares of common stock then held by them. Series E-1 is non-participating and will not receive amounts in excess of the original issue price per share, plus any declared but unpaid dividends as noted above.
As mentioned in the significant terms above, the Company’s preferred stockholders, voting as a class, are entitled to elect four members to the Company’s Board of Directors. Preferred stock can be redeemed in the event of liquidation, an event that can be approved by the Company’s Board. Accordingly, the preferred stockholders are entitled to redemption features that are not solely within the control of the Company. The preferred stock is recorded as temporary equity in the mezzanine section, outside of permanent equity, on the consolidated balance sheet.
11. Common Stock
On March 12, 2015, the Company amended its Certificate of Incorporation and increased the number of common stock it is authorized to issue from 126,500,000 shares to 175,000,000. The par value of each common share remains at $0.001 per share.
On June 22, 2015, the Company further increased the number of shares of common stock authorized to 195,000,000 shares. The par value of each common share remains the same.
F-30
Table of Contents
Adaptive Insights, Inc.
Notes to the Consolidated Financial Statements
Each share of common stock has the right to one vote. The holders of the common stock are also entitled to receive dividends whenever funds are legally available and when declared by the Board of Directors, subject to the prior rights of holders of all classes of stock outstanding having priority rights as to dividends. No dividends have been declared or paid since inception. The common stockholders voting as a class are entitled to elect two members to the Company’s Board of Directors.
The Company has reserved shares of common stock for issuance as follows (in thousands):
| January 31, | April 30, | |||||||||||
| 2017 | 2018 | 2018 | ||||||||||
| (unaudited) | ||||||||||||
| Conversion of redeemable convertible preferred stock |
30,278 | 30,278 | 30,278 | |||||||||
| Options outstanding under stock option plan |
7,265 | 7,449 | 8,921 | |||||||||
| Options available for grant under stock option plan |
1,587 | 2,410 | 649 | |||||||||
| Stock awards issued under stock option plan |
8 | 8 | 8 | |||||||||
| Common stock warrants |
63 | 286 | 427 | |||||||||
|
|
|
|
|
|
|
|||||||
| Total |
39,201 | 40,431 | 40,283 | |||||||||
|
|
|
|
|
|
|
|||||||
As of January 31, 2017, January 31, 2018 and April 30, 2018 (unaudited), the Company has a warrant outstanding whereby the holder of the warrant can exercise the warrant to purchase 62,500 shares of the common stock at $0.76 per share. This warrant expires on October 3, 2018.
As of January 31, 2018, the Company has a second warrant outstanding whereby the holder of the warrant can exercise the warrant to purchase 223,582 shares of common stock at $5.00 per share or the lowest fair value of a share of the Company’s common stock as determined by a subsequent 409A valuation report. The warrant expires on June 1, 2027.
On March 6, 2018, the Company amended the terms of the second warrant to remove the exercise price reset feature. In conjunction with the Second Drawdown, the Company also issued a third warrant to purchase 141,050 shares of common stock at $5.00 per share. This warrant expires on March 6, 2028 (unaudited).
12. Stock Option Plan
In May 2013, the Board of Directors and stockholders of the Company approved the 2013 Equity Incentive Plan (the “Plan”) as a successor to and continuation of the 2003 Equity Incentive Plan. At its adoption, the total number of shares of common stock authorized for issuance under the Plan was 4,999,661 shares. As of January 31, 2016, the Company reserved 5,834,162 shares of common stock for issuance under the Plan. On June 29, 2016, the Board of Directors approved the increase of shares of common stock reserved for issuance under the Plan by 3,875,000 shares. On December 19, 2017, the Board of Directors approved a further increase of 2,125,000 shares of common stock reserved for issuance.
The Plan provides for the granting of Incentive Stock Options, Nonstatutory Stock Options, Stock Appreciation Rights, Restricted Stock awards, Restricted Stock Unit Awards, and other stock awards to employees, directors and consultants at the fair value per share on the date of grant as determined by the Board of Directors. Options and other awards may be granted at not less than 100% of the fair value of the common stock on the date of grant unless they are granted pursuant to an assumption of or substitution for another option or stock appreciation right pursuant to a Corporate Transaction (as defined in the Plan) and in a manner consistent with the provisions of Section 409A of the Internal Revenue Code of 1986 (the “Code”) and, if applicable, Section 424(a) of the Code. Options granted to a 10% stockholder shall be at not less than 110% of the fair value and expire five years from the date of grant.
F-31
Table of Contents
Adaptive Insights, Inc.
Notes to the Consolidated Financial Statements
As of January 31, 2017, January 31, 2018 and April 30, 2018 (unaudited), the Company has only granted options under the Plan. Options generally vest over a 48-month period and are generally exercisable for up to 10 years after the date of grant.
Activity under the Plan is set forth in the table below (in thousands, except for exercise price and contractual life):
| Options Outstanding | ||||||||||||||||
| Shares Subject to Outstanding Stock Options |
Weighted- Average Exercise Price |
Weighted Average Remaining Contractual Life (years) |
Aggregate Intrinsic Value |
|||||||||||||
| Balance, January 31, 2015 |
2,841 | $ |
1.98 |
|
6.07 | $ | 6,429 | |||||||||
|
|
|
|||||||||||||||
| Option granted |
3,517 | 4.28 | ||||||||||||||
| Option exercised |
(1,441 | ) | 3.56 | |||||||||||||
| Option forfeited/expired |
(723 | ) | 2.97 | |||||||||||||
|
|
|
|||||||||||||||
| Balance, January 31, 2016 |
4,194 | 3.19 | 8.43 | $ | 4,073 | |||||||||||
|
|
|
|||||||||||||||
| Option granted |
3,604 | 4.49 | ||||||||||||||
| Option exercised |
(167 | ) | 2.05 | |||||||||||||
| Option forfeited/expired |
(366 | ) | 3.64 | |||||||||||||
|
|
|
|||||||||||||||
| Balance, January 31, 2017 |
7,265 | 3.84 | 8.47 | $ | 8,389 | |||||||||||
|
|
|
|||||||||||||||
| Option granted |
2,123 | 5.62 | ||||||||||||||
| Option exercised |
(1,118 | ) | 3.49 | |||||||||||||
| Option forfeited/expired |
(821 | ) | 4.24 | |||||||||||||
|
|
|
|||||||||||||||
| Balance, January 31, 2018 |
7,449 | 4.36 | 8.11 | $ | 34,873 | |||||||||||
|
|
|
|||||||||||||||
| Option granted (unaudited) |
1,794 | 11.09 | ||||||||||||||
| Option exercised (unaudited) |
(288 | ) | 4.08 | |||||||||||||
| Option forfeited/expired (unaudited) |
(34 | ) | 5.17 | |||||||||||||
|
|
|
|||||||||||||||
| Balance, April 30, 2018 (unaudited) |
8,921 | 5.72 | 8.29 | $ | 54,609 | |||||||||||
|
|
|
|||||||||||||||
| Vested and expected to vest, April 30, 2018 (unaudited) |
9,063 | 5.72 | 8.31 | $ | 55,488 | |||||||||||
|
|
|
|
|
|||||||||||||
| Exercisable, April 30, 2018 (unaudited) |
5,553 | 5.21 | 7.79 | $ | 36,808 | |||||||||||
|
|
|
|
|
|||||||||||||
The intrinsic value of the stock options exercised is the difference between the fair value of the underlying common stock as of the exercise date and the exercise price. The aggregate intrinsic value of exercised stock options was approximately $0.9 million, $0.4 million, $2.5 million, $0.1 million and $2.1 million for the years ended January 31, 2016, 2017 and 2018, and for the three months ended April 30, 2017 and 2018 (unaudited), respectively. The weighted-average grant date fair value of options granted during the years ended January 31, 2016, 2017 and 2018, and during the three months ended April 30, 2017 and 2018 (unaudited) was $2.02, $2.02, $2.39, $2.25 and $4.81 per share, respectively.
F-32
Table of Contents
Adaptive Insights, Inc.
Notes to the Consolidated Financial Statements
Early Exercises of Stock Options
Certain option grants are allowed to be exercised prior to vesting. The unvested shares of common stock exercised are subject to the Company’s right to repurchase at the lower of the original exercise price or the fair market value of the share at the time the repurchase right is exercised. Early exercises of options are not deemed to be substantive exercises for accounting purposes and accordingly, amounts received for early exercises are initially recorded in liability and reclassified to additional paid-in capital as the underlying shares vest. In fiscal 2016, the Company issued 1,150,000 shares of common stock and received $4.8 million as a result of early exercise of stock options. There was no early exercise of stock option in fiscal 2017. During fiscal 2018, the Company issued 255,510 shares of common stock and received $1.3 million as a result of early exercises of stock options. During the three months ended April 30, 2018 (unaudited), the Company issued 17,730 shares of common stock and received $0.1 million as a result of the early exercise. During fiscal 2016, the Company repurchased 25,000 shares of common stock resulting from the early exercise of stock options for $0.1 million. There was no repurchase in fiscal 2017, fiscal 2018 and the three months ended April 30, 2018 (unaudited). As of January 31, 2017 and 2018 and April 30, 2018 (unaudited), the number of shares of common stock subject to repurchase was 10,937, 129,468, and 141,843, respectively, with an aggregate price of $14 thousand, $0.7 million and $0.8 million, respectively.
Stock-Based Compensation Expense
The Company estimates the fair value of stock options using the Black Scholes option-pricing model. The fair value of employee stock options is being amortized on a straight-line basis over the requisite service period of the awards. The fair value of the employee stock options was estimated using the following weighted-average assumptions:
| Years Ended January 31, | Three Months Ended April 30, | |||||||||
| 2016 | 2017 | 2018 | 2017 | 2018 | ||||||
| (unaudited) | ||||||||||
| Expected term (years) |
4.99 – 6.25 | 5.41 –6.01 | 5.27 – 6.61 | 5.8 – 6.08 | 4.53 – 6.67 | |||||
| Volatility |
47.10% - 50.20% | 46.05% - 48.45% | 39.67% - 47.43% | 44.14% | 43.49% – 45.11% | |||||
| Weighted average volatility |
50.17% | 47.14% | 41.38% | 44.14% | 44.33% | |||||
| Risk-free interest rate |
1.56% – 1.95% | 1.08% – 1.86% | 1.87% – 2.29% | 2.15% –2.19% | 2.61% – 2.83% | |||||
| Dividend yield |
0% | 0% | 0% | 0% | 0% | |||||
Value per share of the Company’s common stock
Due to the lack of public market for the Company’s common stock, the Company’s management, with the assistance of a third-party valuation specialist, determined the common stock fair value at the time of the grant of stock options by considering a number of objective and subjective factors, including the Company’s actual operating and financial performance, market conditions and performance of comparable publicly traded companies, developments and milestones in the Company, the likelihood of achieving a liquidity event and transactions involving the Company’s common stock, among other factors. The fair value of the Company’s common stock has been determined in accordance with applicable elements of the practice aid issued by the American Institute of Certified Public Accountants, Valuation of Privately Held Company Equity Securities Issued as Compensation. The fair value of the underlying common stock will be determined by the board of directors until such time as its common stock is listed on a stock exchange.
F-33
Table of Contents
Adaptive Insights, Inc.
Notes to the Consolidated Financial Statements
Expected volatility
The Company determines the expected volatility based on historical average volatilities of similar publicly traded companies corresponding to the expected term of the awards.
Expected term
The Company determines the expected term of awards using the simplified approach, in which the expected term of an award is presumed to be the mid-point between the vesting date and the expiration date of the award, as the Company does not have sufficient historical data relating to stock-option exercises.
Risk-free interest rate
The risk-free interest rate is based on the United States Treasury yield curve in effect during the period the options were granted corresponding to the expected term of the awards.
Estimated dividend yield.
The estimated dividend yield is zero, as the Company does not currently intend to declare dividends in the foreseeable future.
On February 1, 2018, the Company adopted ASU No. 2016-09, Compensation-Stock Compensation (Topic 718): Improvements to Employee Share-Based Payment Accounting (“ASU 2016-09”) and elected to account for forfeitures as they occur in calculating stock compensation costs. Adoption of this guidance did not result in a material impact on the Company’s financial statements (unaudited).
Stock-based compensation expense related to options granted to employees and nonemployees was recognized as follows (in thousands):
| Year Ended January 31, | Three Months Ended April 30, |
|||||||||||||||||||
| 2016 | 2017 | 2018 | 2017 | 2018 | ||||||||||||||||
| (unaudited) | ||||||||||||||||||||
| Cost of revenues |
$ | 78 | $ | 146 | $ | 274 | $ | 47 | $ | 109 | ||||||||||
| Research and development |
204 | 462 | 766 | 168 | 257 | |||||||||||||||
| Sales and marketing |
513 | 633 | 1,138 | 282 | 350 | |||||||||||||||
| General and administrative |
1,524 | 1,813 | 2,000 | 481 | 553 | |||||||||||||||
|
|
|
|
|
|
|
|
|
|
|
|||||||||||
| Total |
$ | 2,319 | $ | 3,054 | $ | 4,178 | $ | 978 | $ | 1,269 | ||||||||||
|
|
|
|
|
|
|
|
|
|
|
|||||||||||
As of January 31, 2017, January 31, 2018 and April 30, 2018 (unaudited), $8.6 million, $8.3 million and $16.7 million, respectively, of unrecognized compensation costs related to these stock options is expected to be recognized over a weighted-average period of 2.8 years, 2.6 years and 2.2 years, respectively.
13. Income Taxes
On December 22, 2017, the Tax Cuts and Jobs Act (the “Tax Act”) was signed into law. The Tax Act includes a number of key tax provisions that affect the Company, including but not limited to, lowering the U.S. federal corporate tax rate from 35% to 21%, effective January 1, 2018, and the establishment of a territorial-style system for taxing foreign-source income of domestic multinational corporations. On December 22, 2017, the Securities and Exchange Commission issued Staff Accounting Bulletin No. 118, Income Tax Accounting
F-34
Table of Contents
Adaptive Insights, Inc.
Notes to the Consolidated Financial Statements
Implications of the Tax Cuts and Jobs Act (“SAB 118”), which provides guidance on accounting for the Tax Act’s impact and allows registrants to record provisional amounts during a measurement period not to extend beyond one year of the enactment date.
The Company has not completed its accounting assessment for the effects of the Tax Act; however, based on its initial assessment, the Company has determined that the Tax Act did not have a material impact to the financial statements in fiscal 2018, other than disclosures in the Company’s year-end financial statements. The Company currently maintains a full valuation allowance recorded against its U.S. federal deferred tax assets since the Company continues to incur losses in all fiscal years. As such, the remeasurement of the deferred tax assets and related valuation allowance is not expected to have a material impact to the financial statements in fiscal 2018, other than disclosures presented below. The Company expects to complete its assessment within the measurement period in accordance with SAB118. The Company’s assessment of the impact of the Tax Act may materially differ from its provisional assessment during the measurement period due to, among other things, further refinement in its calculations, changes in interpretations and assumptions the Company has made, or guidance that may be issued.
The Company has not provided U.S. income taxes for the unremitted earnings of foreign subsidiaries because such earnings are intended to be reinvested in the foreign jurisdictions. The Company has accumulated deficits in its foreign subsidiaries such that no transition tax is expected to be due as a result of the Tax Act.
The components of profit/(loss) before provision for income taxes were as follows (in thousands):
| Year Ended January 31, | Three Months Ended April 30, |
|||||||||||||||||||
| 2016 | 2017 | 2018 | 2017 | 2018 | ||||||||||||||||
| (unaudited) | ||||||||||||||||||||
| United States |
$ | (60,139 | ) | $ | (45,067 | ) | $ | (43,100 | ) | $ | (10,097 | ) | $ | (11,193 | ) | |||||
| Foreign |
1,317 | 494 | 681 | 141 | 223 | |||||||||||||||
|
|
|
|
|
|
|
|
|
|
|
|||||||||||
| Total |
$ | (58,822 | ) | $ | (44,573 | ) | $ | (42,419 | ) | $ | (9,956 | ) | $ | (10,970 | ) | |||||
|
|
|
|
|
|
|
|
|
|
|
|||||||||||
The components of the provision for income taxes were as follows (in thousands):
| Year Ended January 31, | Three Months Ended April 30, |
|||||||||||||||||||
| 2016 | 2017 | 2018 | 2017 | 2018 | ||||||||||||||||
| (unaudited) | ||||||||||||||||||||
| Current: |
||||||||||||||||||||
| Federal |
$ | — | $ | — | $ | — | $ | — | $ | — | ||||||||||
| State |
— | — | — | — | — | |||||||||||||||
| Foreign |
316 | 182 | 263 | 42 | 76 | |||||||||||||||
|
|
|
|
|
|
|
|
|
|
|
|||||||||||
| Total |
316 | 182 | 263 | 42 | 76 | |||||||||||||||
| Deferred: |
||||||||||||||||||||
| Federal |
— | — | — | — | — | |||||||||||||||
| State |
— | — | — | — | — | |||||||||||||||
| Foreign |
— | (35 | ) | (9 | ) | — | — | |||||||||||||
|
|
|
|
|
|
|
|
|
|
|
|||||||||||
| Total |
— | (35 | ) | (9 | ) | — | — | |||||||||||||
|
|
|
|
|
|
|
|
|
|
|
|||||||||||
| Provision for income taxes |
$ | 316 | $ | 147 | $ | 254 | $ | 42 | $ | 76 | ||||||||||
|
|
|
|
|
|
|
|
|
|
|
|||||||||||
F-35
Table of Contents
Adaptive Insights, Inc.
Notes to the Consolidated Financial Statements
The items accounting for the difference between income taxes computed at the federal statutory income tax rate of 34% for the years ended January 31, 2016 and 2017, and 32.9% for the year ended January 31, 2018, and the provision for income taxes consisted of the following (in thousands):
| Year Ended January 31, | ||||||||||||
| 2016 | 2017 | 2018 | ||||||||||
| Income tax benefit at statutory rate |
$ | (20,000 | ) | $ | (15,155 | ) | $ | (13,956 | ) | |||
| State taxes, net of federal benefit |
(2,014 | ) | (1,560 | ) | (1,828 | ) | ||||||
| Foreign tax rate differential |
316 | 147 | 30 | |||||||||
| Non-deductible expenses |
478 | 617 | 965 | |||||||||
| Change in valuation allowance |
21,536 | 16,098 | (18,804 | ) | ||||||||
| Effect of rate change as a result of Tax Act |
— | — | 33,846 | |||||||||
|
|
|
|
|
|
|
|||||||
| Provision for income taxes |
$ | 316 | $ | 147 | $ | 254 | ||||||
|
|
|
|
|
|
|
|||||||
During the years ended January 31, 2016, 2017 and 2018 and the three months ended April 30, 2017 and 2018 (unaudited), the Company recorded income tax expense of $0.3 million, $0.1 million, $0.3 million, $42 thousand and $76 thousand, respectively, all of which is related to income taxes in foreign jurisdictions.
Deferred income taxes reflect the net effects of temporary differences between the carrying amounts of assets and liabilities for financial reporting purposes and the amounts used for income taxes purposes.
As a result of the adoption of ASU 2016-09 on February 1, 2018, the Company recognized a total U.S. federal and state deferred tax asset of $0.1 million for such previously unrecognized excess tax benefits which is offset by the Company’s U.S. federal and state valuation allowance. Under ASU 2016-09, the excess tax benefits and deficiencies are recognized in the period in which they occur (unaudited).
Significant components of the Company’s deferred tax assets for federal and state income taxes are as follows (in thousands):
| January 31, | ||||||||
| 2017 | 2018 | |||||||
| Deferred tax assets: |
||||||||
| Net operating losses and tax credits carryforward |
$ | 77,223 | $ | 62,759 | ||||
| Deferred revenues |
11,101 | 6,921 | ||||||
| Other liabilities, reserves and accruals |
5,564 | 4,821 | ||||||
| Depreciable assets |
1,237 | 806 | ||||||
|
|
|
|
|
|||||
| Gross deferred tax assets |
95,125 | 75,307 | ||||||
| Valuation allowance |
(93,670 | ) | (73,921 | ) | ||||
|
|
|
|
|
|||||
| Total deferred tax assets, net of valuation allowance |
1,455 | 1,386 | ||||||
|
|
|
|
|
|||||
| Deferred tax liability: |
||||||||
| Intangibles |
(1,420 | ) | (1,341 | ) | ||||
|
|
|
|
|
|||||
| Total deferred tax liability |
(1,420 | ) | (1,341 | ) | ||||
|
|
|
|
|
|||||
| Net deferred tax assets |
$ | 35 | $ | 45 | ||||
|
|
|
|
|
|||||
The Company has deferred tax assets totaling approximately $95.1 million and $75.3 million at January 31, 2017 and January 31, 2018, respectively, which consist primarily of net operating loss carryforwards. The
F-36
Table of Contents
Adaptive Insights, Inc.
Notes to the Consolidated Financial Statements
Company does not believe that the assets are realizable on a more-likely-than-not basis. As a result, the net deferred tax assets have been offset by a valuation allowance, except for certain foreign jurisdictions. The valuation allowance increased by $24.0 million and $16.6 million during the years ended January 31, 2016 and 2017, respectively. The valuation allowance decreased by $19.7 million during the year ended January 31, 2018. The decrease in valuation allowance relates primarily to the reduction of the corporate tax rate, partially offset by the current year loss.
The Company has federal and state net operating loss carryforwards of $314.7 million and $379.0 million as of January 31, 2017 and 2018, respectively. The federal net operating loss carryforwards expire at various dates beginning 2023 through 2037. The state net operating loss carryforwards will expire at various dates beginning in 2017 through 2037. The Company has federal and state research credit carryforwards of $2.6 million and $2.8 million as at January 31, 2017, respectively. The Company also has federal and state research carryforwards of $3.2 million and $3.5 million as of January 31, 2018, respectively. The federal credits begin to expire in 2024 and the state credits have no expiration. At January 31, 2017 and 2018, except for certain foreign jurisdictions, the net deferred tax assets have been fully reserved due to the uncertainty surrounding the realization of such benefits.
The Company accounts for income taxes pursuant to FASB ASC 740, Income Taxes. As of January 31, 2017 and 2018, the total amount of gross unrecognized tax benefits was approximately $1.6 million and $2.7 million, respectively, all of which, net of the federal benefit on certain deferred tax items, represented a reduction in the deferred tax asset and a corresponding reduction in the valuation allowance. As a result, future recognition of any of the unrecognized tax benefits would not affect the Company’s effective tax rate. The Company’s policy is to classify interest accrued or penalties related to unrecognized tax benefits as a component of income tax expense. Interest and penalty expense amounting to $14 thousand, $15 thousand and $9 thousand has been recorded by the Company for the years ended January 31, 2016, 2017 and 2018, respectively.
The activity within the Company’s unrecognized gross tax benefits was as follows (in thousands):
| Year Ended January 31, | ||||||||||||
| 2016 | 2017 | 2018 | ||||||||||
| Unrecognized tax benefits at beginning of year |
$ | 1,043 | $ | 1,346 | $ | 1,647 | ||||||
| Additions based on tax positions in the current year |
303 | 301 | 1,009 | |||||||||
|
|
|
|
|
|
|
|||||||
| Unrecognized tax benefits at end of year |
$ | 1,346 | $ | 1,647 | $ | 2,656 | ||||||
|
|
|
|
|
|
|
|||||||
Section 382 of the Internal Revenue Code (the Code) limits the use of net operating loss and tax credit carryforwards in certain situations where changes occur in the stock ownership of a company. If the Company should have an ownership change of more than 50% of the value of the Company’s capital stock, utilization of these carryforwards could be restricted.
The Company files income tax returns in the U.S. federal jurisdiction and various state jurisdictions. As Company expands its global operations in the normal course of business, the Company could be subject to examination by taxing authorities through the world. These audits could include questioning the timing and amount of deductions; the nexus of income among various tax jurisdictions; and compliance with federal, state, local, and foreign tax laws. The Company is not currently under audit by the Internal Revenue Service or other similar state, local, and foreign authorities. All tax years remain open to examination by major taxing jurisdictions to which the Company is subject.
F-37
Table of Contents
Adaptive Insights, Inc.
Notes to the Consolidated Financial Statements
14. Employee Benefit Plan
The Company has a 401(k) savings plan that covers substantially all employees of the Company. The plan provides for voluntary salary reduction contributions in an amount not to exceed the Internal Revenue Service annual allowable deduction. The Company has not provided matching contributions for any of the periods presented.
15. Net Loss Per Share Attributable to Common Stockholders
The Company considers all series of redeemable convertible preferred shares to be participating securities. Under the two-class method, basic and net loss per share attributable to common stockholders is calculated by dividing the net loss attributable to common stockholders by the weighted-average number of shares of common stock outstanding during the period, less shares subject to repurchase. The net loss attributable to common stockholders is not allocated to the redeemable convertible preferred shares as the holders of redeemable convertible preferred shares do not have a contractual obligation to share in the Company’s losses.
The following table sets forth the calculation of basic and diluted net loss per share attributable to common stockholders during the periods presented (in thousands, except per share data):
| Year Ended January 31, | Three Months Ended April 30, |
|||||||||||||||||||
| 2016 | 2017 | 2018 | 2017 | 2018 | ||||||||||||||||
| (unaudited) | ||||||||||||||||||||
| Net loss attributable to common stockholders |
$ | (59,138 | ) | $ | (44,720 | ) | $ | (42,673 | ) | $ | (9,998 | ) | $ | (11,046 | ) | |||||
|
|
|
|
|
|
|
|
|
|
|
|||||||||||
| Weighted-average shares used to compute net loss per share attributable to common stockholders, basic and diluted |
3,943 | 4,946 | 5,576 | 5,305 | 6,356 | |||||||||||||||
|
|
|
|
|
|
|
|
|
|
|
|||||||||||
| Net loss per share attributable to common stockholders, basic and diluted |
$ | (15.00 | ) | $ | (9.04 | ) | $ | (7.65 | ) | $ | (1.88 | ) | $ | (1.74 | ) | |||||
|
|
|
|
|
|
|
|
|
|
|
|||||||||||
The following outstanding shares of potentially dilutive securities were excluded from the computation of the diluted net loss per share attributable to common stockholders for the periods presented because their effect would have been anti-dilutive (in thousands):
| January 31, | April 30, 2018 |
|||||||||||||||
| 2016 | 2017 | 2018 | ||||||||||||||
| (unaudited) | ||||||||||||||||
| Redeemable convertible preferred stock on an as-converted basis |
30,278 | 30,278 | 30,278 | 30,278 | ||||||||||||
| Options to purchase stock |
4,194 | 7,265 | 7,449 | 8,921 | ||||||||||||
| Warrant to purchase common stock |
63 | 63 | 286 | 427 | ||||||||||||
| Unvested early exercised common shares |
517 | 11 | 129 | 142 | ||||||||||||
|
|
|
|
|
|
|
|
|
|||||||||
| Total shares excluded from net loss per share |
35,052 | 37,617 | 38,142 | 39,768 | ||||||||||||
|
|
|
|
|
|
|
|
|
|||||||||
F-38
Table of Contents
Adaptive Insights, Inc.
Notes to the Consolidated Financial Statements
16. Unaudited Pro Forma Net Loss Per Share
The following table sets forth the computation of the Company’s unaudited pro forma basic and diluted net loss per share (in thousands, except per share data):
| Year Ended January 31, 2018 |
Three Months Ended April 30, 2018 |
|||||||
| (Unaudited) | ||||||||
| Net loss attributable to common stockholders |
$ | (42,673 | ) | $ | (11,046 | ) | ||
|
|
|
|
|
|||||
| Weighted-average shares used to compute net loss per share attributable to common stockholders, basic and diluted |
5,576 | 6,356 | ||||||
| Pro forma adjustment to reflect conversion of redeemable convertible preferred stock |
30,278 | 30,278 | ||||||
|
|
|
|
|
|||||
| Weighted-average shares used to compute pro forma net loss per share attributable to common stockholders, basic and diluted |
35,854 | 36,634 | ||||||
|
|
|
|
|
|||||
| Pro forma net loss per share attributable to common stockholders, basic and diluted |
$ | (1.19 | ) | $ | (0.30 | ) | ||
|
|
|
|
|
|||||
17. Geographic Information
Revenues by country from customers, based on the customer’s location, was as follows (in thousands):
| Year Ended January 31, | Three Months Ended April 30, |
|||||||||||||||||||
| 2016 | 2017 | 2018 | 2017 | 2018 | ||||||||||||||||
| (unaudited) | ||||||||||||||||||||
| United States |
$ | 48,951 | $ | 61,472 | $ | 79,359 | $ | 17,825 | $ | 24,127 | ||||||||||
| International |
12,755 | 20,319 | 27,149 | 6,390 | 7,924 | |||||||||||||||
|
|
|
|
|
|
|
|
|
|
|
|||||||||||
| Total |
$ | 61,706 | $ | 81,791 | $ | 106,508 | $ | 24,215 | $ | 32,051 | ||||||||||
|
|
|
|
|
|
|
|
|
|
|
|||||||||||
No individual countries outside the United States represented 10% or more of total revenues.
Substantially all of the Company’s property and equipment is located in the United States.
Note 18. Other Expense (Income), Net
The components of other expense (income), net are as follows (in thousands):
| Year Ended January 31 |
Three Months Ended April 30, |
|||||||||||||||||||
| 2016 | 2017 | 2018 | 2017 | 2018 | ||||||||||||||||
| (unaudited) | ||||||||||||||||||||
| Interest expense |
$ | 216 | $ | 142 | $ | 2,272 | $ | 25 | $ | 1,250 | ||||||||||
| Foreign currency (gain) loss |
434 | (100 | ) | (969 | ) | 148 | 585 | |||||||||||||
| Change in fair value of common stock warrant liability |
— | — | 653 | — | 339 | |||||||||||||||
| Other |
(54 | ) | (142 | ) | (160 | ) | (27 | ) | (82 | ) | ||||||||||
|
|
|
|
|
|
|
|
|
|
|
|||||||||||
| Total |
$ | 596 | $ | (100 | ) | $ | 1,796 | $ | 146 | $ | 2,092 | |||||||||
|
|
|
|
|
|
|
|
|
|
|
|||||||||||
F-39
Table of Contents
Adaptive Insights, Inc.
Notes to the Consolidated Financial Statements
| 19. | Related Party Transactions |
All contracts with related parties are executed in the ordinary course of business. The Company did not have any material related party balances as of January 31, 2017, January 31, 2018, and April 30, 2018 (unaudited). The Company did not have any material related party transactions for the years ended January 31, 2016, 2017 and 2018, and for the three months ended April 30, 2017 and 2018 (unaudited).
| 20. | Subsequent Events |
The Company has evaluated subsequent events through April 25, 2018, the date the audited consolidated financial statements were available to be issued. In connection with the reissuance of the audited consolidated financial statements to reflect the 1-for-4 reverse stock split as described in Note 1, the Company has evaluated subsequent events through May 29, 2018, the date the audited consolidated financial statements were available to be reissued.
Further Amendment to the 2014 Loan Agreement
On March 5, 2018, the Company further amended the 2014 Loan Agreement (the “2018 Amended Loan Agreement”). Under the 2018 Amended Loan Agreement, the maximum available amount of the revolving revenue line of credit is the lesser of (1) $25.0 million or (2) monthly recurring revenues as defined in the Agreement multiplied by four hundred percent adjusted for the Company’s annualized customer retention rate. The revolving line of credit will mature on March 5, 2021.
Under the 2018 Amended Loan Agreement, the principal can be paid and re-borrowed during the term. The interest rate is based on the Wall Street Journal’s Prime Rate (“WSJ Prime”) plus 0.25%. The Company is subject to interest on $10.0 million for a minimum period commencing on the first month beginning after the effective date of the 2018 Amended Loan Agreement until the earlier of (1) the maturity date, (2) a liquidity event as defined in the agreement, (3) 12 months following effective date of the agreement and (4) the termination of the agreement.
In addition, the financial covenants noted in the 2014 Loan Agreement and subsequent amendments were replaced with a requirement to maintain a liquidity ratio equal to or greater than 1.75, measured on a monthly basis. The liquidity ratio is calculated as the ratio of the sum of unrestricted and unencumbered cash held at the lender plus accounts receivables, divided by the outstanding principal balance with the lender.
The Company paid an annual commitment fee of $50 thousand due at closing and will pay $50 thousand on the first and second anniversary of the closing. On March 5, 2017, the Company drew down $10.0 million from this revolving revenue line of credit.
Second Drawdown of the 2017 Loan Agreement and Related Common Stock Warrant Issuance
On March 6, 2018, the Company drew down the second tranche amounting to $15.0 million (the “Second Drawdown”) under the 2017 Loan Agreement. The Second Drawdown is subject to the same terms and conditions as the Initial Drawdown.
In addition, the Company issued a warrant to purchase 141,050 shares of common stock at an exercise price of $5.00 per share. The warrant was fully vested upon initial issuance and exercisable, in whole or in part, at any time and from time to time from the date of the grant through the tenth anniversary of the date of grant.
F-40
Table of Contents
Adaptive Insights, Inc.
Notes to the Consolidated Financial Statements
Amendment to the Terms of the Existing Warrant
In conjunction with the Second Drawdown, the terms of the existing warrant agreement were amended to remove the exercise price reset feature and the exercise price of the warrant was amended to $5.00 per share.
Issuance of Stock Options
Subsequent to January 31, 2018, the Company’s Board of Directors granted stock options to purchase an aggregate of 1.8 million shares of common stock with a weighted-average exercise price of $11.09 per share. These stock options have a grant date fair value of approximately $10.0 million which is expected to be recognized over a weighted-average vesting period of four years. Out of the total stock options granted, stock options to purchase an aggregate of 0.8 million shares of common stock have a vesting commencement date contingent upon a successful IPO or a change in control. The grant date fair value for these stock options is $4.7 million.
21. Subsequent Events (Unaudited)
In preparing the unaudited interim consolidated financial statements as of April 30, 2018 and for the three months then ended, the Company has evaluated subsequent events through May 29, 2018, the date the unaudited interim consolidated financial statements were issued.
Subsequent to April 25, 2018, the Company’s Board of Directors granted stock options to purchase an aggregate of 137,000 shares of common stock with an exercise price of $13.50 per share. These stock options have a grant date fair value of approximately $0.9 million which is expected to be recognized over a weighted-average vesting period of 3.4 years. Out of the total stock options, stock options to purchase 25,000 shares of common stock have a vesting commencement date contingent upon a successful IPO. The grant date fair value for these stock options is $0.2 million.
On May 24, 2018, the Company’s Board of Directors and stockholders approved an amendment to the Company’s amended and restated certificate of incorporation effecting a 1-for-4 reverse stock split of the Company’s issued and outstanding shares of common stock and redeemable convertible preferred stock. The reverse stock split was effected on May 25, 2018. The par value of the common and redeemable convertible preferred stock was not adjusted as a result of the reverse stock split. All issued and outstanding share and per share amounts included in the accompanying consolidated financial statements have been adjusted to reflect this reverse stock split for all periods presented.
In May 2018, the Company entered into non-cancellable commitments with a hosting infrastructure vendor for a total value of $11.2 million over the next four years.
F-41
Table of Contents

Business Planning Cloud.For smarter decisions, faster. Our Mission To free people to do their best work and empower teams to better manage their business. Our Business Planning Cloud frees CFO Tom Low and his team to better support national nonprofit Playworks’ mission of advocating play for children.
Table of Contents

Table of Contents
Part II
INFORMATION NOT REQUIRED IN PROSPECTUS
Item 13. Other Expenses of Issuance and Distribution.
The following table indicates the expenses to be incurred in connection with the offering described in this registration statement, other than underwriting discounts and commissions, all of which will be paid by us. All amounts are estimated except the SEC registration fee, the Financial Industry Regulatory Authority, Inc., or FINRA, filing fee and the exchange listing fee.
| Amount | ||||
| SEC registration fee |
$ | * | ||
| FINRA filing fee |
* | |||
| Exchange listing fee |
* | |||
| Accountants’ fees and expenses |
* | |||
| Legal fees and expenses |
* | |||
| Blue Sky fees and expenses |
* | |||
| Transfer Agent’s fees and expenses |
* | |||
| Printing and engraving expenses |
* | |||
| Miscellaneous |
* | |||
|
|
|
|||
| Total expenses |
$ | * | ||
|
|
|
|||
| * | To be provided by amendment. |
Item 14. Indemnification of Directors and Officers.
Section 145 of the Delaware General Corporation Law authorizes a court to award, or a corporation’s board of directors to grant, indemnity to directors and officers in terms sufficiently broad to permit such indemnification under certain circumstances for liabilities, including reimbursement for expenses incurred, arising under the Securities Act. Our amended and restated certificate of incorporation that will be in effect on the completion of this offering permits indemnification of our directors, officers, employees and other agents to the maximum extent permitted by the Delaware General Corporation Law, and our amended and restated bylaws that will be in effect on the completion of this offering provide that we will indemnify our directors and officers and permit us to indemnify our employees and other agents, in each case to the maximum extent permitted by the Delaware General Corporation Law.
We have entered into indemnification agreements with our directors and officers, whereby we have agreed to indemnify our directors and officers to the fullest extent permitted by law, including indemnification against expenses and liabilities incurred in legal proceedings to which the director or officer was, or is threatened to be made, a party by reason of the fact that such director or officer is or was a director, officer, employee or agent of Adaptive Insights, Inc., provided that such director or officer acted in good faith and in a manner that the director or officer reasonably believed to be in, or not opposed to, the best interest of Adaptive Insights, Inc. At present, there is no pending litigation or proceeding involving a director or officer of Adaptive Insights, Inc. regarding which indemnification is sought, nor is the registrant aware of any threatened litigation that may result in claims for indemnification.
We maintain insurance policies that indemnify our directors and officers against various liabilities arising under the Securities Act and the Exchange Act that might be incurred by any director or officer in his capacity as such.
II-1
Table of Contents
Item 15. Recent Sales of Unregistered Securities.
Since January 1, 2015, we have issued the following unregistered securities:
| (1) | In June 2015, we sold an aggregate of 5,915,193 shares of our Series G redeemable convertible preferred stock to a total of 16 accredited investors at a purchase price of $12.68 per share for an aggregate purchase price of $74,999,994. |
| (2) | From January 1, 2015 through May 28, 2018, we granted to certain employees, consultants and directors options to purchase an aggregate of 11,175,400 shares of our common stock under our 2013 Equity Incentive Plan at exercise prices ranging from $4.24 to $13.50 per share. |
| (3) | From January 1, 2015 through May 28, 2018, we issued and sold an aggregate of 3,258,422 shares of our common stock upon the exercise of options under our 2003 Equity Plan and 2013 Equity Incentive Plan, at exercise prices ranging from $0.40 to $11.84 per share, for an aggregate exercise price of $11,319,552. |
None of the foregoing transactions involved any underwriters, underwriting discounts or commissions, or any public offering. Unless otherwise stated, the sales of the above securities were deemed to be exempt from registration under the Securities Act in reliance on Section 4(a)(2) of the Securities Act (and Regulation D or Regulation S promulgated thereunder) or Rule 701 promulgated under Section 3(b) of the Securities Act as transactions by an issuer not involving any public offering or pursuant to benefit plans and contracts relating to compensation as provided under Rule 701. The recipients of the securities in each of these transactions represented their intentions to acquire the securities for investment only and not with a view to or for sale in connection with any distribution thereof, and appropriate legends were placed on the share certificates issued in these transactions. All recipients had adequate access, through their relationships with us, to information about us. The sales of these securities were made without any general solicitation or advertising.
Item 16. Exhibits and Financial Statement Schedules.
(a) Exhibits.
II-2
Table of Contents
| * | To be filed by amendment. |
| ** | Previously filed. |
(b) Financial Statement Schedules.
All financial statement schedules are omitted because the information required to be set forth therein is not applicable or is shown in the consolidated financial statements or the notes thereto.
Item 17. Undertakings.
The undersigned registrant hereby undertakes to provide to the underwriters at the closing specified in the underwriting agreement certificates in such denominations and registered in such names as required by the underwriters to permit prompt delivery to each purchaser.
II-3
Table of Contents
Insofar as indemnification for liabilities arising under the Securities Act may be permitted to directors, officers and controlling persons of the registrant under the foregoing provisions or otherwise, the registrant has been advised that in the opinion of the SEC such indemnification is against public policy as expressed in the Securities Act and is, therefore, unenforceable. In the event that a claim for indemnification against such liabilities (other than the payment by the registrant of expenses incurred or paid by a director, officer or controlling person of the registrant in the successful defense of any action, suit or proceeding) is asserted by such director, officer or controlling person in connection with the securities being registered, the registrant will, unless in the opinion of its counsel the matter has been settled by controlling precedent, submit to a court of appropriate jurisdiction the question whether such indemnification by it is against public policy as expressed in the Securities Act and will be governed by the final adjudication of such issue.
The undersigned registrant hereby undertakes that:
(1) For purposes of determining any liability under the Securities Act, the information omitted from the form of prospectus filed as part of this registration statement in reliance upon Rule 430A and contained in a form of prospectus filed by the registrant under Rule 424(b)(1) or (4) or 497(h) under the Securities Act shall be deemed to be part of this registration statement as of the time it was declared effective.
(2) For the purpose of determining any liability under the Securities Act, each post-effective amendment that contains a form of prospectus shall be deemed to be a new registration statement relating to the securities offered therein, and the offering of such securities at that time shall be deemed to be the initial bona fide offering thereof.
II-4
Table of Contents
SIGNATURES
Pursuant to the requirements of the Securities Act of 1933, the registrant has duly caused this registration statement to be signed on its behalf by the undersigned, thereunto duly authorized, in the City of Palo Alto, State of California, on May 29, 2018.
| ADAPTIVE INSIGHTS, INC. | ||
| By: | /s/ Thomas F. Bogan | |
| Thomas F. Bogan | ||
| Chief Executive Officer | ||
II-5
Table of Contents
Pursuant to the requirements of the Securities Act of 1933, this registration statement has been signed by the following persons in the capacities and on the dates indicated.
| Signature |
Title |
Date | ||
| /s/ Thomas F. Bogan Thomas F. Bogan |
Chief Executive Officer (Principal Executive Officer) |
May 29, 2018 | ||
| /s/ James D. Johnson James D. Johnson |
Chief Financial Officer (Principal Financial and Accounting Officer) |
May 29, 2018 | ||
| * Jean M. Halloran |
Director | May 29, 2018 | ||
| * Robert S. Hull |
Director | May 29, 2018 | ||
| * James F. Kelliher |
Director | May 29, 2018 | ||
| * Terry L. Opdendyk |
Director | May 29, 2018 | ||
| * Mark B. Templeton |
Director | May 29, 2018 | ||
| * Jill A. Ward |
Director |
May 29, 2018 | ||
| *By: | /s/ Melanie D. Vinson | |
| Melanie D. Vinson | ||
| Attorney-in-fact |
II-6