Attached files
| file | filename |
|---|---|
| EX-99.1 - EXHIBIT 99.1 - Medtronic plc | exhibit991-fy18q4earningsr.htm |
| 8-K - 8-K - Medtronic plc | q4fy18earningsrelease.htm |
Exhibit 99.2 MEDTRONIC PLC Q4 FY18 EARNINGS PRESENTATION MAY 24, 2018 • Q4 FY18 CONSOLIDATED RESULTS & GROUP REVENUE HIGHLIGHTS • FY18 FINANCIAL HIGHLIGHTS • FREE CASH FLOW • FY18 DIVESTITURE IMPACT • FY19 GUIDANCE & OTHER ASSUMPTIONS
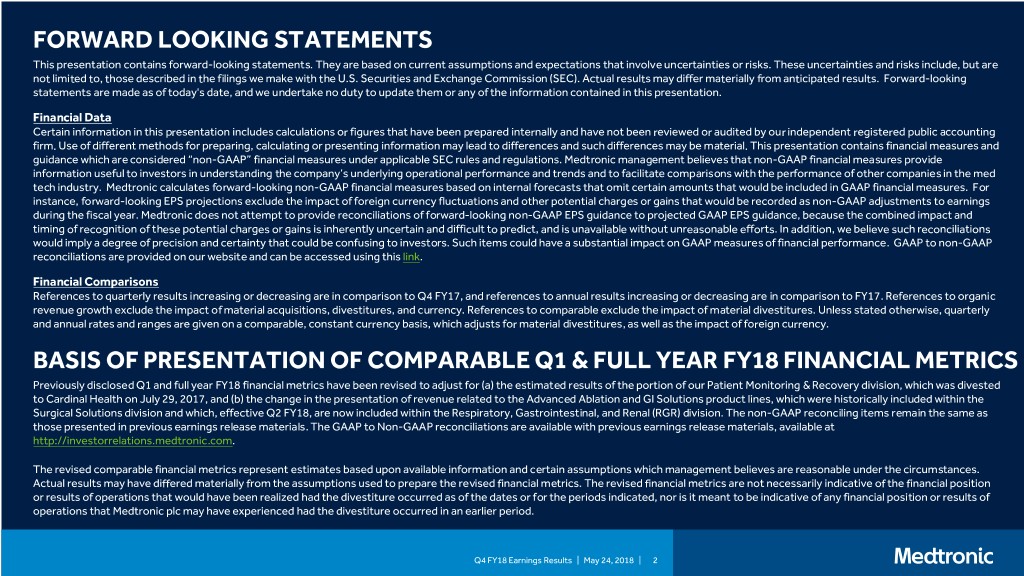
FORWARD LOOKING STATEMENTS This presentation contains forward-looking statements. They are based on current assumptions and expectations that involve uncertainties or risks. These uncertainties and risks include, but are not limited to, those described in the filings we make with the U.S. Securities and Exchange Commission (SEC). Actual results may differ materially from anticipated results. Forward-looking statements are made as of today's date, and we undertake no duty to update them or any of the information contained in this presentation. Financial Data Certain information in this presentation includes calculations or figures that have been prepared internally and have not been reviewed or audited by our independent registered public accounting firm. Use of different methods for preparing, calculating or presenting information may lead to differences and such differences may be material. This presentation contains financial measures and guidance which are considered “non-GAAP” financial measures under applicable SEC rules and regulations. Medtronic management believes that non-GAAP financial measures provide information useful to investors in understanding the company’s underlying operational performance and trends and to facilitate comparisons with the performance of other companies in the med tech industry. Medtronic calculates forward-looking non-GAAP financial measures based on internal forecasts that omit certain amounts that would be included in GAAP financial measures. For instance, forward-looking EPS projections exclude the impact of foreign currency fluctuations and other potential charges or gains that would be recorded as non-GAAP adjustments to earnings during the fiscal year. Medtronic does not attempt to provide reconciliations of forward-looking non-GAAP EPS guidance to projected GAAP EPS guidance, because the combined impact and timing of recognition of these potential charges or gains is inherently uncertain and difficult to predict, and is unavailable without unreasonable efforts. In addition, we believe such reconciliations would imply a degree of precision and certainty that could be confusing to investors. Such items could have a substantial impact on GAAP measures of financial performance. GAAP to non-GAAP reconciliations are provided on our website and can be accessed using this link. Financial Comparisons References to quarterly results increasing or decreasing are in comparison to Q4 FY17, and references to annual results increasing or decreasing are in comparison to FY17. References to organic revenue growth exclude the impact of material acquisitions, divestitures, and currency. References to comparable exclude the impact of material divestitures. Unless stated otherwise, quarterly and annual rates and ranges are given on a comparable, constant currency basis, which adjusts for material divestitures, as well as the impact of foreign currency. BASIS OF PRESENTATION OF COMPARABLE Q1 & FULL YEAR FY18 FINANCIAL METRICS Previously disclosed Q1 and full year FY18 financial metrics have been revised to adjust for (a) the estimated results of the portion of our Patient Monitoring & Recovery division, which was divested to Cardinal Health on July 29, 2017, and (b) the change in the presentation of revenue related to the Advanced Ablation and GI Solutions product lines, which were historically included within the Surgical Solutions division and which, effective Q2 FY18, are now included within the Respiratory, Gastrointestinal, and Renal (RGR) division. The non-GAAP reconciling items remain the same as those presented in previous earnings release materials. The GAAP to Non-GAAP reconciliations are available with previous earnings release materials, available at http://investorrelations.medtronic.com. The revised comparable financial metrics represent estimates based upon available information and certain assumptions which management believes are reasonable under the circumstances. Actual results may have differed materially from the assumptions used to prepare the revised financial metrics. The revised financial metrics are not necessarily indicative of the financial position or results of operations that would have been realized had the divestiture occurred as of the dates or for the periods indicated, nor is it meant to be indicative of any financial position or results of operations that Medtronic plc may have experienced had the divestiture occurred in an earlier period. Q4 FY18 Earnings Results | May 24, 2018 | 2
Q4 FY18 CONSOLIDATED RESULTS & GROUP REVENUE HIGHLIGHTS
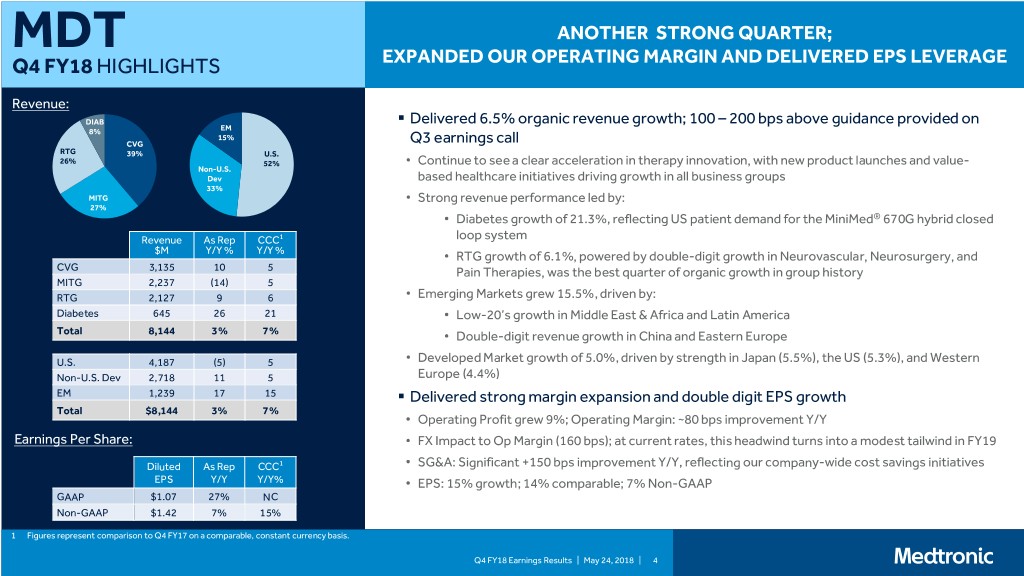
MDT ANOTHER STRONG QUARTER; Q4 FY18 HIGHLIGHTS EXPANDED OUR OPERATING MARGIN AND DELIVERED EPS LEVERAGE Revenue: DIAB . Delivered 6.5% organic revenue growth; 100 – 200 bps above guidance provided on 8% EM 15% CVG Q3 earnings call RTG 39% U.S. 26% 52% • Continue to see a clear acceleration in therapy innovation, with new product launches and value- Non-U.S. Dev based healthcare initiatives driving growth in all business groups 33% MITG • Strong revenue performance led by: 27% • Diabetes growth of 21.3%, reflecting US patient demand for the MiniMed® 670G hybrid closed Revenue As Rep CCC1 loop system $M Y/Y % Y/Y % • RTG growth of 6.1%, powered by double-digit growth in Neurovascular, Neurosurgery, and CVG 3,135 10 5 Pain Therapies, was the best quarter of organic growth in group history MITG 2,237 (14) 5 RTG 2,127 9 6 • Emerging Markets grew 15.5%, driven by: Diabetes 645 26 21 • Low-20’s growth in Middle East & Africa and Latin America Total 8,144 3% 7% • Double-digit revenue growth in China and Eastern Europe U.S. 4,187 (5) 5 • Developed Market growth of 5.0%, driven by strength in Japan (5.5%), the US (5.3%), and Western Non-U.S. Dev 2,718 11 5 Europe (4.4%) EM 1,239 17 15 . Delivered strong margin expansion and double digit EPS growth Total $8,144 3% 7% • Operating Profit grew 9%; Operating Margin: ~80 bps improvement Y/Y Earnings Per Share: • FX Impact to Op Margin (160 bps); at current rates, this headwind turns into a modest tailwind in FY19 Diluted As Rep CCC1 • SG&A: Significant +150 bps improvement Y/Y, reflecting our company-wide cost savings initiatives EPS Y/Y Y/Y% • EPS: 15% growth; 14% comparable; 7% Non-GAAP GAAP $1.07 27% NC Non-GAAP $1.42 7% 15% 1 Figures represent comparison to Q4 FY17 on a comparable, constant currency basis. Q4 FY18 Earnings Results | May 24, 2018 | 4
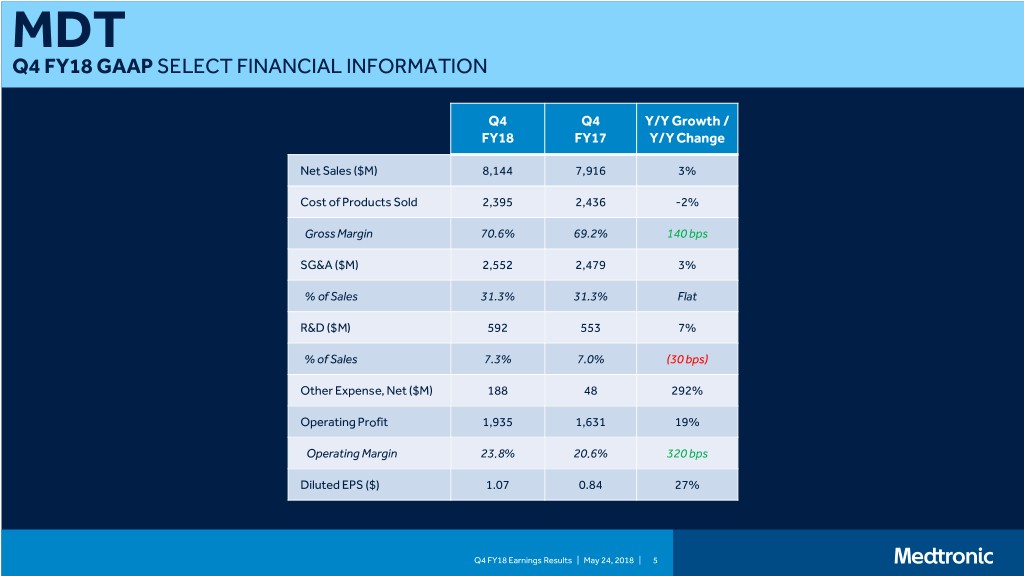
MDT Q4 FY18 GAAP SELECT FINANCIAL INFORMATION Q4 Q4 Y/Y Growth / FY18 FY17 Y/Y Change Net Sales ($M) 8,144 7,916 3% Cost of Products Sold 2,395 2,436 -2% Gross Margin 70.6% 69.2% 140 bps SG&A ($M) 2,552 2,479 3% % of Sales 31.3% 31.3% Flat R&D ($M) 592 553 7% % of Sales 7.3% 7.0% (30 bps) Other Expense, Net ($M) 188 48 292% Operating Profit 1,935 1,631 19% Operating Margin 23.8% 20.6% 320 bps Diluted EPS ($) 1.07 0.84 27% Q4 FY18 Earnings Results | May 24, 2018 | 5
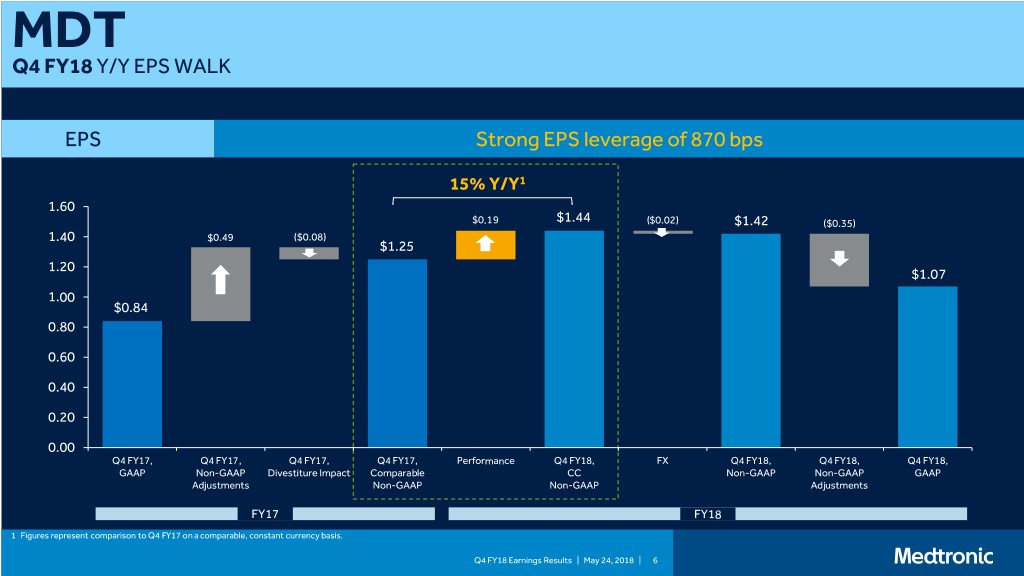
MDT Q4 FY18 Y/Y EPS WALK EPS Strong EPS leverage of 870 bps 15% Y/Y1 1.60 $0.19 $1.44 ($0.02) $1.42 ($0.35) 1.40 $0.49 ($0.08) $1.25 1.20 $1.07 1.00 $0.84 0.80 0.60 0.40 0.20 0.00 Q4 FY17, Q4 FY17, Q4 FY17, Q4 FY17, Performance Q4 FY18, FX Q4 FY18, Q4 FY18, Q4 FY18, GAAP Non-GAAP Divestiture Impact Comparable CC Non-GAAP Non-GAAP GAAP Adjustments Non-GAAP Non-GAAP Adjustments FY17 FY18 1 Figures represent comparison to Q4 FY17 on a comparable, constant currency basis. Q4 FY18 Earnings Results | May 24, 2018 | 6
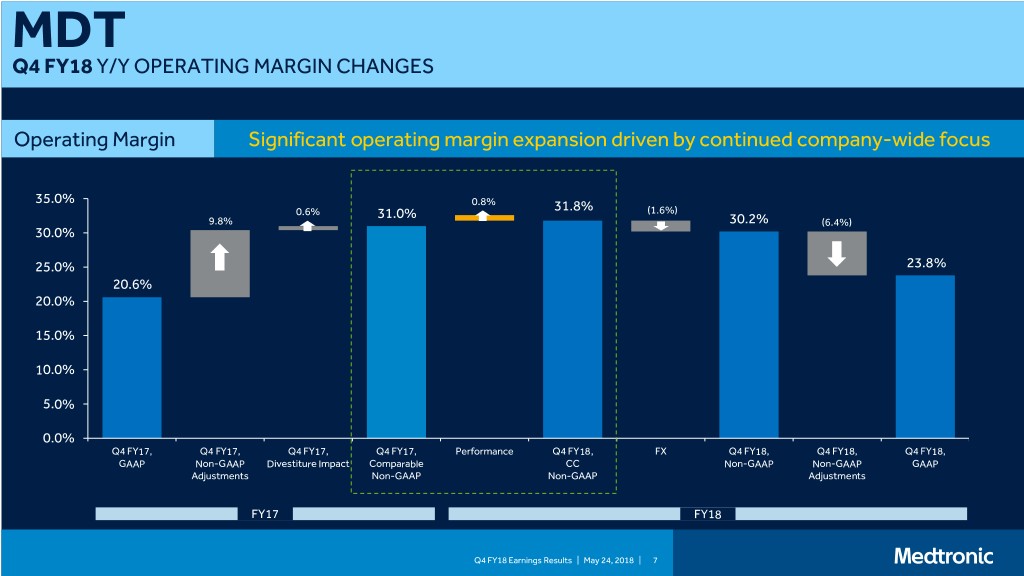
MDT Q4 FY18 Y/Y OPERATING MARGIN CHANGES Operating Margin Significant operating margin expansion driven by continued company-wide focus 35.0% 0.8% 31.8% 0.6% 31.0% (1.6%) 9.8% 30.2% (6.4%) 30.0% 25.0% 23.8% 20.6% 20.0% 15.0% 10.0% 5.0% 0.0% Q4 FY17, Q4 FY17, Q4 FY17, Q4 FY17, Performance Q4 FY18, FX Q4 FY18, Q4 FY18, Q4 FY18, GAAP Non-GAAP Divestiture Impact Comparable CC Non-GAAP Non-GAAP GAAP Adjustments Non-GAAP Non-GAAP Adjustments FY17 FY18 Q4 FY18 Earnings Results | May 24, 2018 | 7
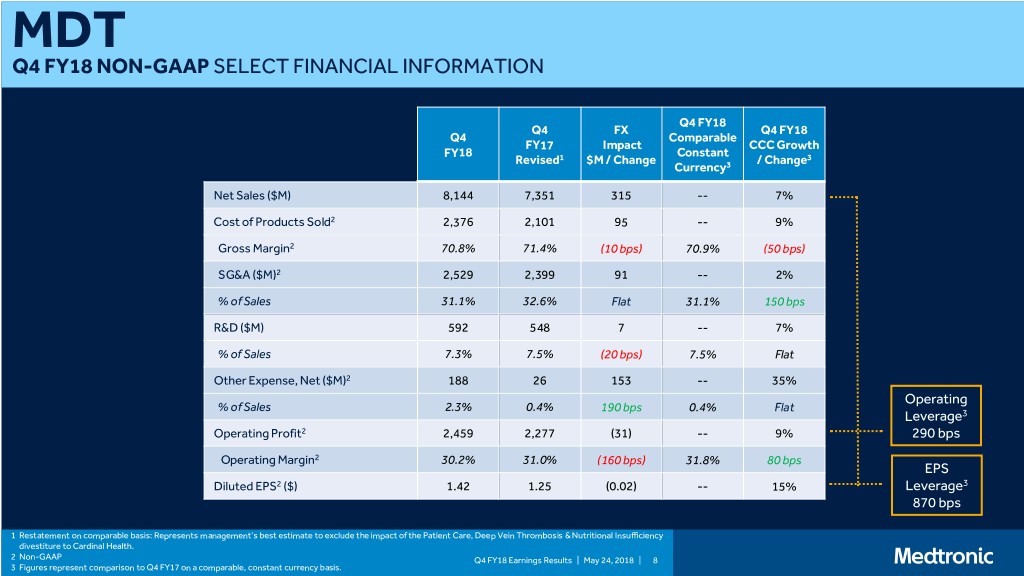
MDT Q4 FY18 NON-GAAP SELECT FINANCIAL INFORMATION Q4 FY18 Q4 FX Q4 FY18 Q4 Comparable FY17 Impact CCC Growth FY18 Constant Revised1 $M / Change / Change3 Currency3 Net Sales ($M) 8,144 7,351 315 -- 7% Cost of Products Sold2 2,376 2,101 95 -- 9% Gross Margin2 70.8% 71.4% (10 bps) 70.9% (50 bps) SG&A ($M)2 2,529 2,399 91 -- 2% % of Sales 31.1% 32.6% Flat 31.1% 150 bps R&D ($M) 592 548 7 -- 7% % of Sales 7.3% 7.5% (20 bps) 7.5% Flat Other Expense, Net ($M)2 188 26 153 -- 35% Operating % of Sales 2.3% 0.4% 190 bps 0.4% Flat Leverage3 Operating Profit2 2,459 2,277 (31) -- 9% 290 bps Operating Margin2 30.2% 31.0% (160 bps) 31.8% 80 bps EPS Diluted EPS2 ($) 1.42 1.25 (0.02) -- 15% Leverage3 870 bps 1 Restatement on comparable basis: Represents management’s best estimate to exclude the impact of the Patient Care, Deep Vein Thrombosis & Nutritional Insufficiency divestiture to Cardinal Health. 2 Non-GAAP Q4 FY18 Earnings Results | May 24, 2018 | 8 3 Figures represent comparison to Q4 FY17 on a comparable, constant currency basis.
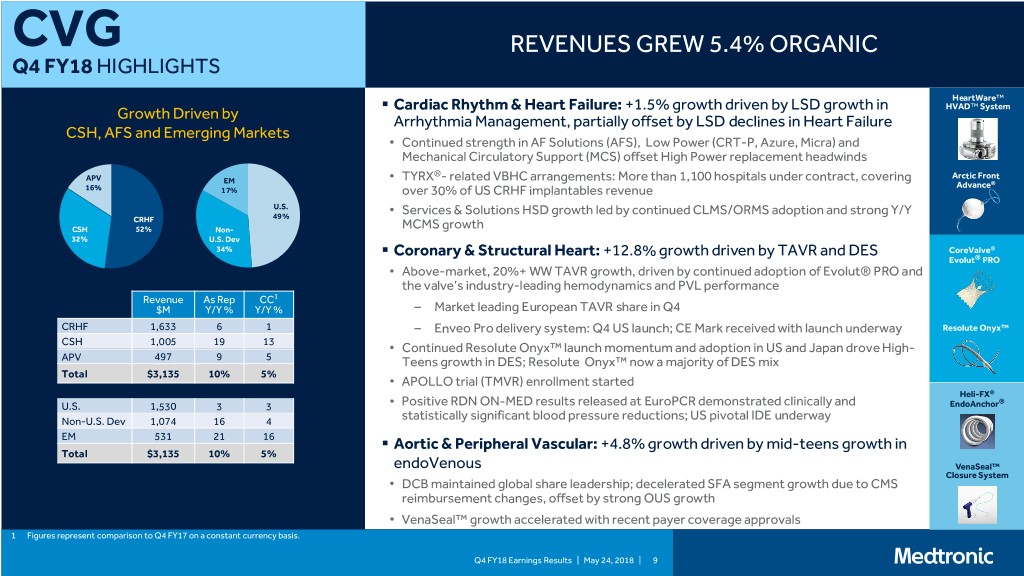
CVG REVENUES GREW 5.4% ORGANIC Q4 FY18 HIGHLIGHTS HeartWare™ . Cardiac Rhythm & Heart Failure: +1.5% growth driven by LSD growth in HVAD™ System Growth Driven by Arrhythmia Management, partially offset by LSD declines in Heart Failure CSH, AFS and Emerging Markets • Continued strength in AF Solutions (AFS), Low Power (CRT-P, Azure, Micra) and Mechanical Circulatory Support (MCS) offset High Power replacement headwinds ® APV • TYRX - related VBHC arrangements: More than 1,100 hospitals under contract, covering Arctic Front EM Advance® 16% 17% over 30% of US CRHF implantables revenue U.S. • Services & Solutions HSD growth led by continued CLMS/ORMS adoption and strong Y/Y CRHF 49% CSH 52% Non- MCMS growth 32% U.S. Dev 34% . Coronary & Structural Heart: +12.8% growth driven by TAVR and DES CoreValve® Evolut® PRO • Above-market, 20%+ WW TAVR growth, driven by continued adoption of Evolut® PRO and the valve’s industry-leading hemodynamics and PVL performance Revenue As Rep CC1 $M Y/Y % Y/Y % – Market leading European TAVR share in Q4 CRHF 1,633 6 1 – Enveo Pro delivery system: Q4 US launch; CE Mark received with launch underway Resolute Onyx™ CSH 1,005 19 13 • Continued Resolute Onyx™ launch momentum and adoption in US and Japan drove High- APV 497 9 5 Teens growth in DES; Resolute Onyx™ now a majority of DES mix Total $3,135 10% 5% • APOLLO trial (TMVR) enrollment started Heli-FX® U.S. 1,530 3 3 • Positive RDN ON-MED results released at EuroPCR demonstrated clinically and EndoAnchor® Non-U.S. Dev 1,074 16 4 statistically significant blood pressure reductions; US pivotal IDE underway EM 531 21 16 . Aortic & Peripheral Vascular: +4.8% growth driven by mid-teens growth in Total $3,135 10% 5% endoVenous VenaSeal™ Closure System • DCB maintained global share leadership; decelerated SFA segment growth due to CMS reimbursement changes, offset by strong OUS growth • VenaSeal™ growth accelerated with recent payer coverage approvals 1 Figures represent comparison to Q4 FY17 on a constant currency basis. Q4 FY18 Earnings Results | May 24, 2018 | 9
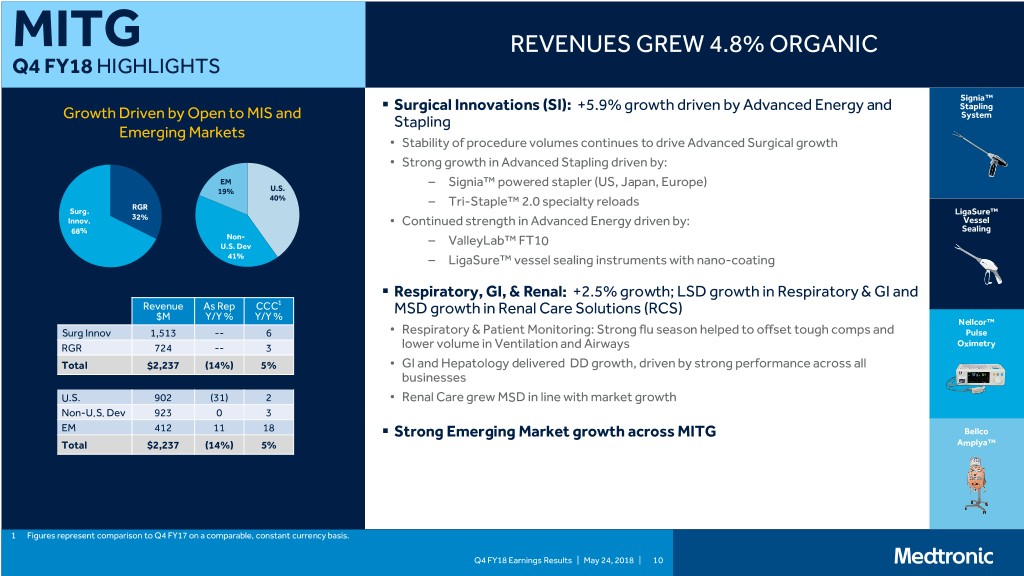
MITG REVENUES GREW 4.8% ORGANIC Q4 FY18 HIGHLIGHTS Signia™ . Surgical Innovations (SI): +5.9% growth driven by Advanced Energy and Stapling Growth Driven by Open to MIS and System Stapling Emerging Markets • Stability of procedure volumes continues to drive Advanced Surgical growth • Strong growth in Advanced Stapling driven by: EM – Signia™ powered stapler (US, Japan, Europe) 19% U.S. 40% RGR – Tri-Staple™ 2.0 specialty reloads Surg. LigaSure™ 32% Innov. • Continued strength in Advanced Energy driven by: Vessel 68% Sealing Non- U.S. Dev – ValleyLab™ FT10 41% – LigaSure™ vessel sealing instruments with nano-coating . Respiratory, GI, & Renal: +2.5% growth; LSD growth in Respiratory & GI and Revenue As Rep CCC1 $M Y/Y % Y/Y % MSD growth in Renal Care Solutions (RCS) Nellcor™ Surg Innov 1,513 -- 6 • Respiratory & Patient Monitoring: Strong flu season helped to offset tough comps and Pulse RGR 724 -- 3 lower volume in Ventilation and Airways Oximetry Total $2,237 (14%) 5% • GI and Hepatology delivered DD growth, driven by strong performance across all businesses U.S. 902 (31) 2 • Renal Care grew MSD in line with market growth Non-U.S. Dev 923 0 3 EM 412 11 18 . Strong Emerging Market growth across MITG Bellco Total $2,237 (14%) 5% Amplya™ 1 Figures represent comparison to Q4 FY17 on a comparable, constant currency basis. Q4 FY18 Earnings Results | May 24, 2018 | 10
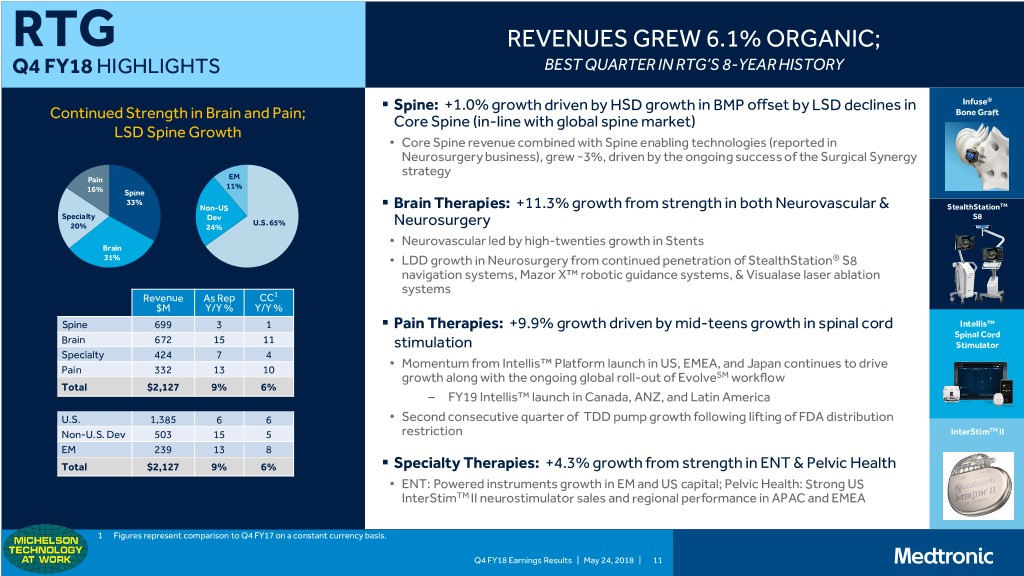
RTG REVENUES GREW 6.1% ORGANIC; Q4 FY18 HIGHLIGHTS BEST QUARTER IN RTG’S 8-YEAR HISTORY . Spine: +1.0% growth driven by HSD growth in BMP offset by LSD declines in Infuse® Continued Strength in Brain and Pain; Bone Graft Core Spine (in-line with global spine market) LSD Spine Growth • Core Spine revenue combined with Spine enabling technologies (reported in Neurosurgery business), grew ~3%, driven by the ongoing success of the Surgical Synergy strategy Pain EM 11% 16% Spine 33% Non-US . Brain Therapies: +11.3% growth from strength in both Neurovascular & StealthStationTM Specialty Dev S8 U.S. 65% 20% 24% Neurosurgery Neurovascular led by high-twenties growth in Stents Brain • 31% • LDD growth in Neurosurgery from continued penetration of StealthStation® S8 navigation systems, Mazor X™ robotic guidance systems, & Visualase laser ablation systems Revenue As Rep CC1 $M Y/Y % Y/Y % Spine 699 3 1 . Pain Therapies: +9.9% growth driven by mid-teens growth in spinal cord Intellis™ Brain 672 15 11 Spinal Cord stimulation Stimulator Specialty 424 7 4 Pain 332 13 10 • Momentum from Intellis™ Platform launch in US, EMEA, and Japan continues to drive growth along with the ongoing global roll-out of EvolveSM workflow Total $2,127 9% 6% – FY19 Intellis™ launch in Canada, ANZ, and Latin America U.S. 1,385 6 6 • Second consecutive quarter of TDD pump growth following lifting of FDA distribution Non-U.S. Dev 503 15 5 restriction InterStimTM II EM 239 13 8 Total $2,127 9% 6% . Specialty Therapies: +4.3% growth from strength in ENT & Pelvic Health • ENT: Powered instruments growth in EM and US capital; Pelvic Health: Strong US InterStimTM II neurostimulator sales and regional performance in APAC and EMEA 1 Figures represent comparison to Q4 FY17 on a constant currency basis. Q4 FY18 Earnings Results | May 24, 2018 | 11
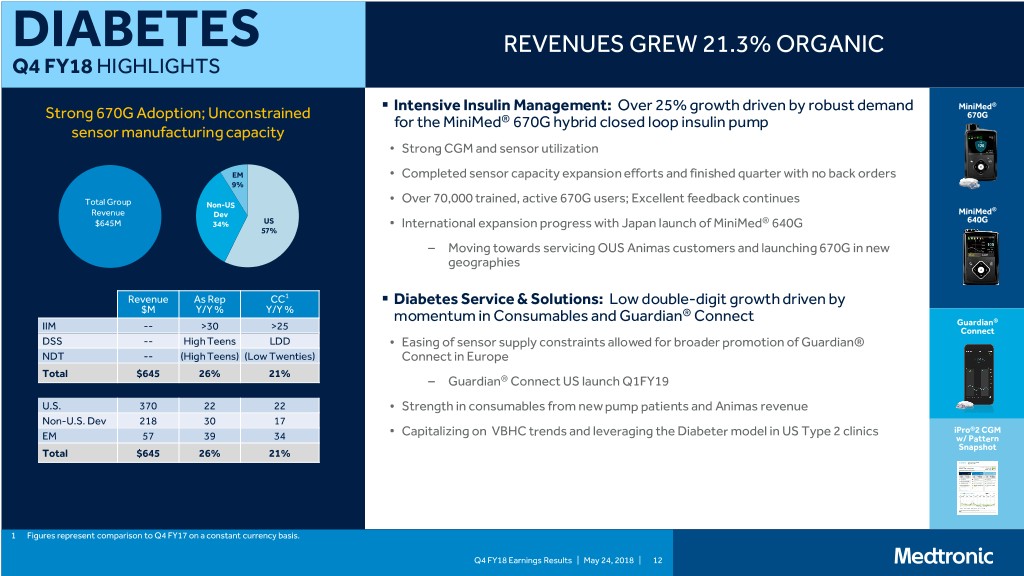
DIABETES REVENUES GREW 21.3% ORGANIC Q4 FY18 HIGHLIGHTS . Intensive Insulin Management: Over 25% growth driven by robust demand MiniMed® Strong 670G Adoption; Unconstrained 670G for the MiniMed® 670G hybrid closed loop insulin pump sensor manufacturing capacity • Strong CGM and sensor utilization EM • Completed sensor capacity expansion efforts and finished quarter with no back orders 9% Over 70,000 trained, active 670G users; Excellent feedback continues Total Group Non-US • ® Revenue Dev MiniMed 640G $645M 34% US International expansion progress with Japan launch of MiniMed® 640G 57% • – Moving towards servicing OUS Animas customers and launching 670G in new geographies Revenue As Rep CC1 . Diabetes Service & Solutions: Low double-digit growth driven by $M Y/Y % Y/Y % ® momentum in Consumables and Guardian Connect Guardian® IIM -- >30 >25 Connect DSS -- High Teens LDD • Easing of sensor supply constraints allowed for broader promotion of Guardian® NDT -- (High Teens) (Low Twenties) Connect in Europe Total $645 26% 21% – Guardian® Connect US launch Q1FY19 U.S. 370 22 22 • Strength in consumables from new pump patients and Animas revenue Non-U.S. Dev 218 30 17 Capitalizing on VBHC trends and leveraging the Diabeter model in US Type 2 clinics iPro®2 CGM EM 57 39 34 • w/ Pattern Snapshot Total $645 26% 21% 1 Figures represent comparison to Q4 FY17 on a constant currency basis. Q4 FY18 Earnings Results | May 24, 2018 | 12

FY18 FINANCIAL HIGHLIGHTS
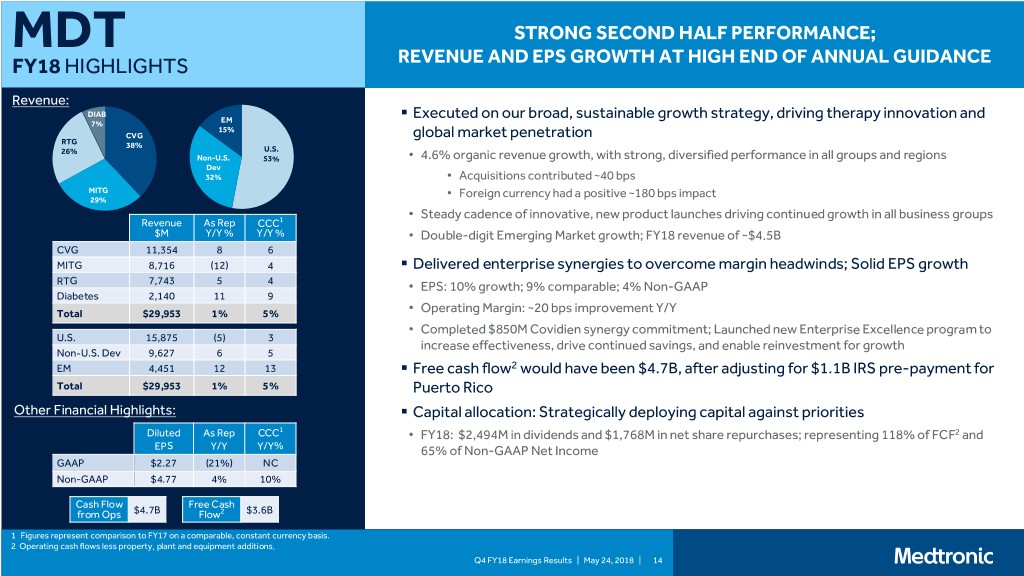
MDT STRONG SECOND HALF PERFORMANCE; FY18 HIGHLIGHTS REVENUE AND EPS GROWTH AT HIGH END OF ANNUAL GUIDANCE Revenue: DIAB . Executed on our broad, sustainable growth strategy, driving therapy innovation and 7% EM 15% CVG global market penetration RTG 38% 26% U.S. Non-U.S. 53% • 4.6% organic revenue growth, with strong, diversified performance in all groups and regions Dev 32% • Acquisitions contributed ~40 bps MITG Foreign currency had a positive ~180 bps impact 29% • • Steady cadence of innovative, new product launches driving continued growth in all business groups Revenue As Rep CCC1 $M Y/Y % Y/Y % • Double-digit Emerging Market growth; FY18 revenue of ~$4.5B CVG 11,354 8 6 MITG 8,716 (12) 4 . Delivered enterprise synergies to overcome margin headwinds; Solid EPS growth RTG 7,743 5 4 • EPS: 10% growth; 9% comparable; 4% Non-GAAP Diabetes 2,140 11 9 Total $29,953 1% 5% • Operating Margin: ~20 bps improvement Y/Y • Completed $850M Covidien synergy commitment; Launched new Enterprise Excellence program to U.S. 15,875 (5) 3 increase effectiveness, drive continued savings, and enable reinvestment for growth Non-U.S. Dev 9,627 6 5 EM 4,451 12 13 . Free cash flow2 would have been $4.7B, after adjusting for $1.1B IRS pre-payment for Total $29,953 1% 5% Puerto Rico Other Financial Highlights: . Capital allocation: Strategically deploying capital against priorities 1 Diluted As Rep CCC • FY18: $2,494M in dividends and $1,768M in net share repurchases; representing 118% of FCF2 and EPS Y/Y Y/Y% 65% of Non-GAAP Net Income GAAP $2.27 (21%) NC Non-GAAP $4.77 4% 10% Cash Flow Free Cash from Ops $4.7B Flow2 $3.6B 1 Figures represent comparison to FY17 on a comparable, constant currency basis. 2 Operating cash flows less property, plant and equipment additions. Q4 FY18 Earnings Results | May 24, 2018 | 14
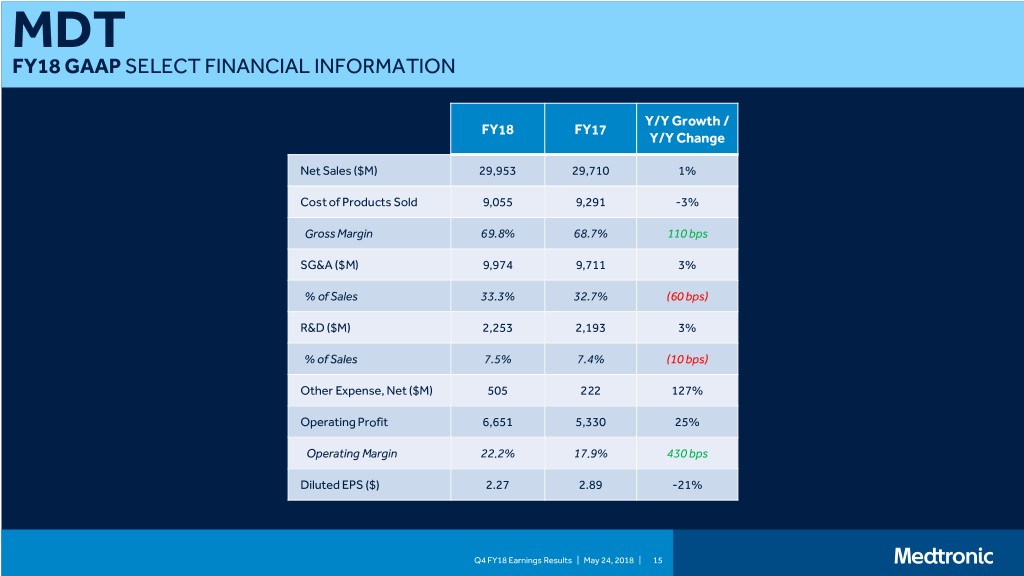
MDT FY18 GAAP SELECT FINANCIAL INFORMATION Y/Y Growth / FY18 FY17 Y/Y Change Net Sales ($M) 29,953 29,710 1% Cost of Products Sold 9,055 9,291 -3% Gross Margin 69.8% 68.7% 110 bps SG&A ($M) 9,974 9,711 3% % of Sales 33.3% 32.7% (60 bps) R&D ($M) 2,253 2,193 3% % of Sales 7.5% 7.4% (10 bps) Other Expense, Net ($M) 505 222 127% Operating Profit 6,651 5,330 25% Operating Margin 22.2% 17.9% 430 bps Diluted EPS ($) 2.27 2.89 -21% Q4 FY18 Earnings Results | May 24, 2018 | 15
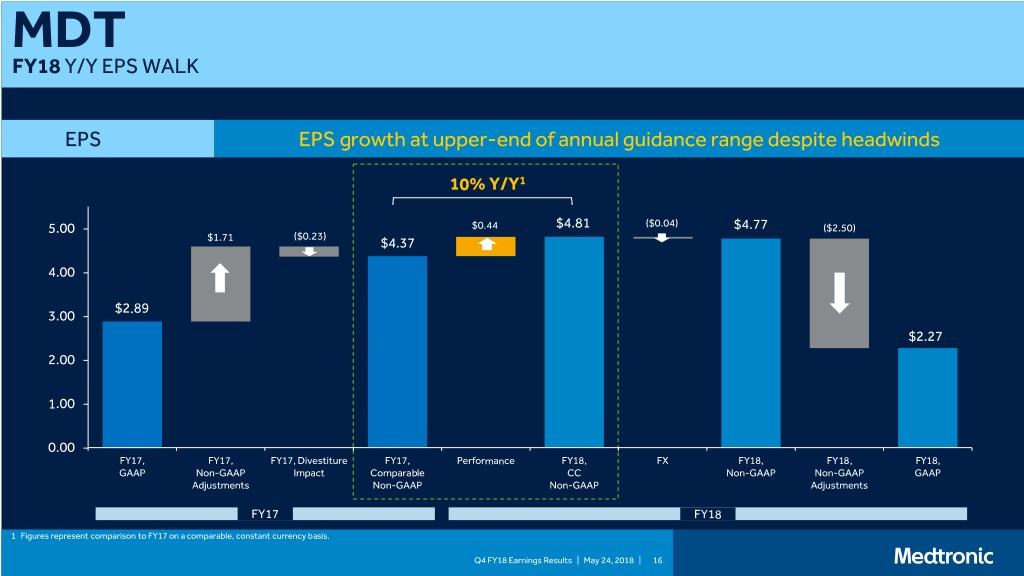
MDT FY18 Y/Y EPS WALK EPS EPS growth at upper-end of annual guidance range despite headwinds 10% Y/Y1 5.00 $0.44 $4.81 ($0.04) $4.77 ($2.50) $1.71 ($0.23) $4.37 4.00 $2.89 3.00 $2.27 2.00 1.00 0.00 FY17, FY17, FY17, Divestiture FY17, Performance FY18, FX FY18, FY18, FY18, GAAP Non-GAAP Impact Comparable CC Non-GAAP Non-GAAP GAAP Adjustments Non-GAAP Non-GAAP Adjustments FY17 FY18 1 Figures represent comparison to FY17 on a comparable, constant currency basis. Q4 FY18 Earnings Results | May 24, 2018 | 16
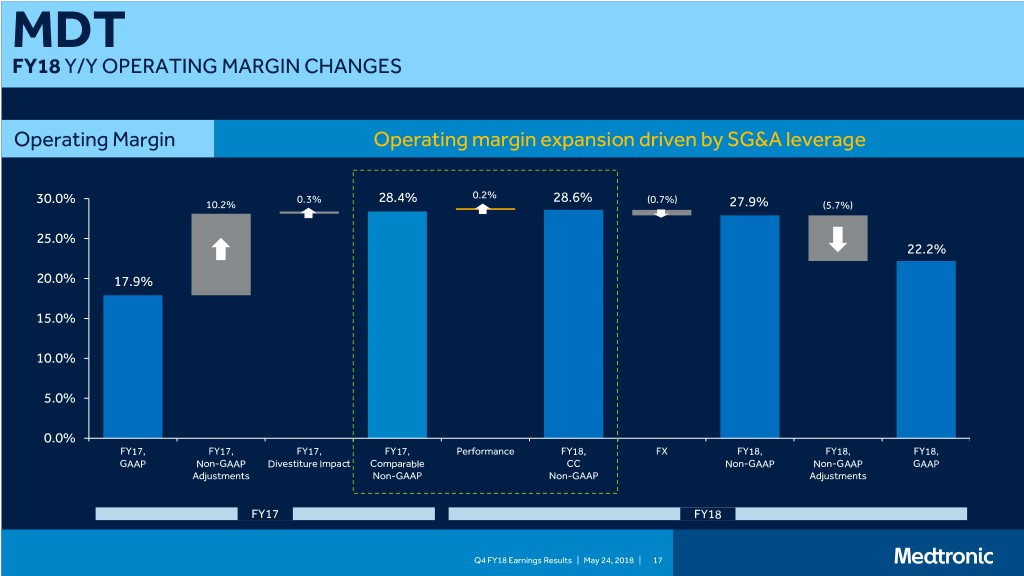
MDT FY18 Y/Y OPERATING MARGIN CHANGES Operating Margin Operating margin expansion driven by SG&A leverage 0.3% 28.4% 0.2% 28.6% (0.7%) 30.0% 10.2% 27.9% (5.7%) 25.0% 22.2% 20.0% 17.9% 15.0% 10.0% 5.0% 0.0% FY17, FY17, FY17, FY17, Performance FY18, FX FY18, FY18, FY18, GAAP Non-GAAP Divestiture Impact Comparable CC Non-GAAP Non-GAAP GAAP Adjustments Non-GAAP Non-GAAP Adjustments FY17 FY18 Q4 FY18 Earnings Results | May 24, 2018 | 17
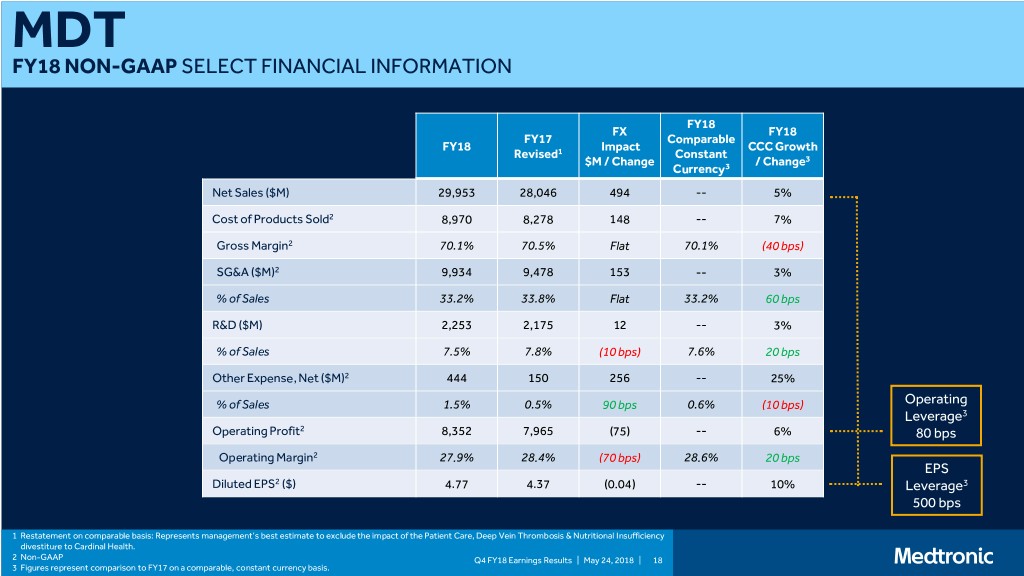
MDT FY18 NON-GAAP SELECT FINANCIAL INFORMATION FY18 FX FY18 FY17 Comparable FY18 Impact CCC Growth Revised1 Constant $M / Change / Change3 Currency3 Net Sales ($M) 29,953 28,046 494 -- 5% Cost of Products Sold2 8,970 8,278 148 -- 7% Gross Margin2 70.1% 70.5% Flat 70.1% (40 bps) SG&A ($M)2 9,934 9,478 153 -- 3% % of Sales 33.2% 33.8% Flat 33.2% 60 bps R&D ($M) 2,253 2,175 12 -- 3% % of Sales 7.5% 7.8% (10 bps) 7.6% 20 bps Other Expense, Net ($M)2 444 150 256 -- 25% % of Sales 1.5% 0.5% 90 bps 0.6% (10 bps) Operating Leverage3 Operating Profit2 8,352 7,965 (75) -- 6% 80 bps Operating Margin2 27.9% 28.4% (70 bps) 28.6% 20 bps EPS Diluted EPS2 ($) 4.77 4.37 (0.04) -- 10% Leverage3 500 bps 1 Restatement on comparable basis: Represents management’s best estimate to exclude the impact of the Patient Care, Deep Vein Thrombosis & Nutritional Insufficiency divestiture to Cardinal Health. 2 Non-GAAP Q4 FY18 Earnings Results | May 24, 2018 | 18 3 Figures represent comparison to FY17 on a comparable, constant currency basis.

FREE CASH FLOW
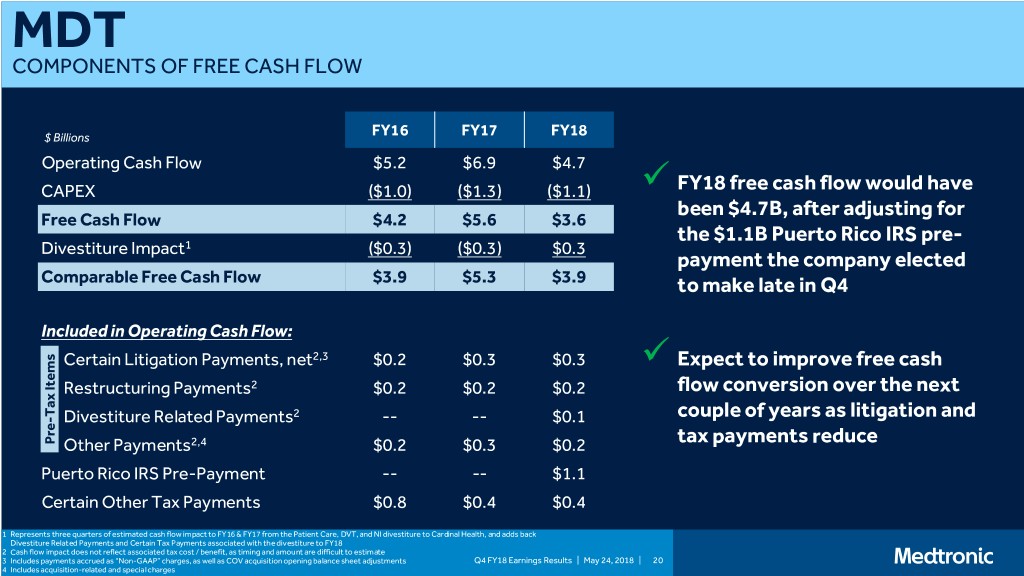
MDT COMPONENTS OF FREE CASH FLOW $ Billions FY16 FY17 FY18 Operating Cash Flow $5.2 $6.9 $4.7 CAPEX ($1.0) ($1.3) ($1.1) FY18 free cash flow would have been $4.7B, after adjusting for Free Cash Flow $4.2 $5.6 $3.6 the $1.1B Puerto Rico IRS pre- Divestiture Impact1 ($0.3) ($0.3) $0.3 payment the company elected Comparable Free Cash Flow $3.9 $5.3 $3.9 to make late in Q4 Included in Operating Cash Flow: Certain Litigation Payments, net2,3 $0.2 $0.3 $0.3 Expect to improve free cash Restructuring Payments2 $0.2 $0.2 $0.2 flow conversion over the next Tax ItemsTax 2 couple of years as litigation and - Divestiture Related Payments -- -- $0.1 Pre Other Payments2,4 $0.2 $0.3 $0.2 tax payments reduce Puerto Rico IRS Pre-Payment -- -- $1.1 Certain Other Tax Payments $0.8 $0.4 $0.4 1 Represents three quarters of estimated cash flow impact to FY16 & FY17 from the Patient Care, DVT, and NI divestiture to Cardinal Health, and adds back Divestiture Related Payments and Certain Tax Payments associated with the divestiture to FY18 2 Cash flow impact does not reflect associated tax cost / benefit, as timing and amount are difficult to estimate 3 Includes payments accrued as “Non-GAAP” charges, as well as COV acquisition opening balance sheet adjustments Q4 FY18 Earnings Results | May 24, 2018 | 20 4 Includes acquisition-related and special charges
FY18 DIVESTITURE IMPACT
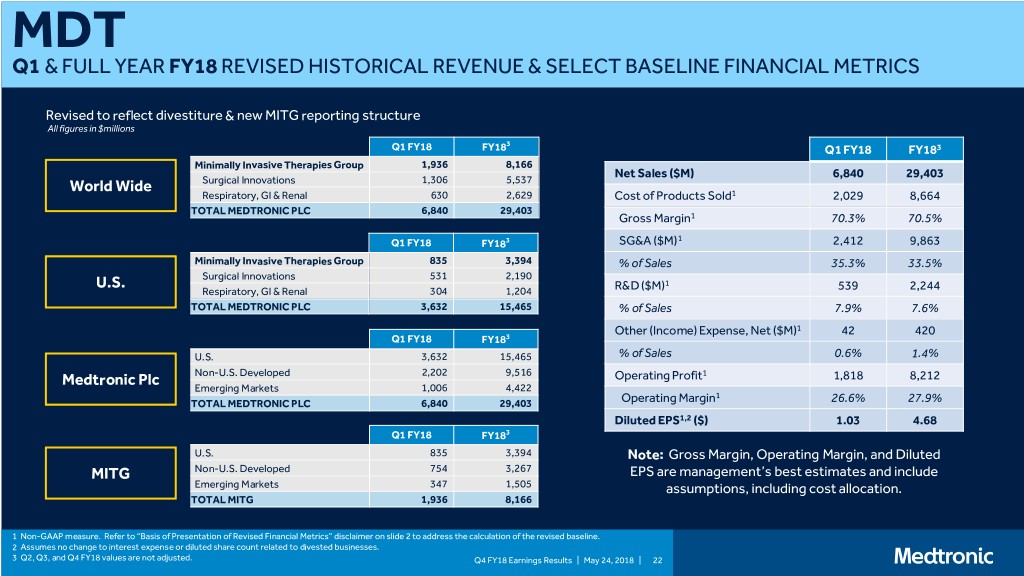
MDT Q1 & FULL YEAR FY18 REVISED HISTORICAL REVENUE & SELECT BASELINE FINANCIAL METRICS Revised to reflect divestiture & new MITG reporting structure All figures in $millions 3 Q1 FY18 FY18 Q1 FY18 FY183 Minimally Invasive Therapies Group 1,936 8,166 Net Sales ($M) 6,840 29,403 World Wide Surgical Innovations 1,306 5,537 Respiratory, GI & Renal 630 2,629 Cost of Products Sold1 2,029 8,664 TOTAL MEDTRONIC PLC 6,840 29,403 Gross Margin1 70.3% 70.5% 1 Q1 FY18 FY183 SG&A ($M) 2,412 9,863 Minimally Invasive Therapies Group 835 3,394 % of Sales 35.3% 33.5% Surgical Innovations 531 2,190 U.S. 1 Respiratory, GI & Renal 304 1,204 R&D ($M) 539 2,244 TOTAL MEDTRONIC PLC 3,632 15,465 % of Sales 7.9% 7.6% Other (Income) Expense, Net ($M)1 42 420 Q1 FY18 FY183 U.S. 3,632 15,465 % of Sales 0.6% 1.4% Medtronic Plc Non-U.S. Developed 2,202 9,516 Operating Profit1 1,818 8,212 Emerging Markets 1,006 4,422 1 TOTAL MEDTRONIC PLC 6,840 29,403 Operating Margin 26.6% 27.9% Diluted EPS1,2 ($) 1.03 4.68 Q1 FY18 FY183 U.S. 835 3,394 Note: Gross Margin, Operating Margin, and Diluted MITG Non-U.S. Developed 754 3,267 EPS are management’s best estimates and include Emerging Markets 347 1,505 assumptions, including cost allocation. TOTAL MITG 1,936 8,166 1 Non-GAAP measure. Refer to “Basis of Presentation of Revised Financial Metrics” disclaimer on slide 2 to address the calculation of the revised baseline. 2 Assumes no change to interest expense or diluted share count related to divested businesses. 3 Q2, Q3, and Q4 FY18 values are not adjusted. Q4 FY18 Earnings Results | May 24, 2018 | 22

FY19 GUIDANCE & OTHER ASSUMPTIONS
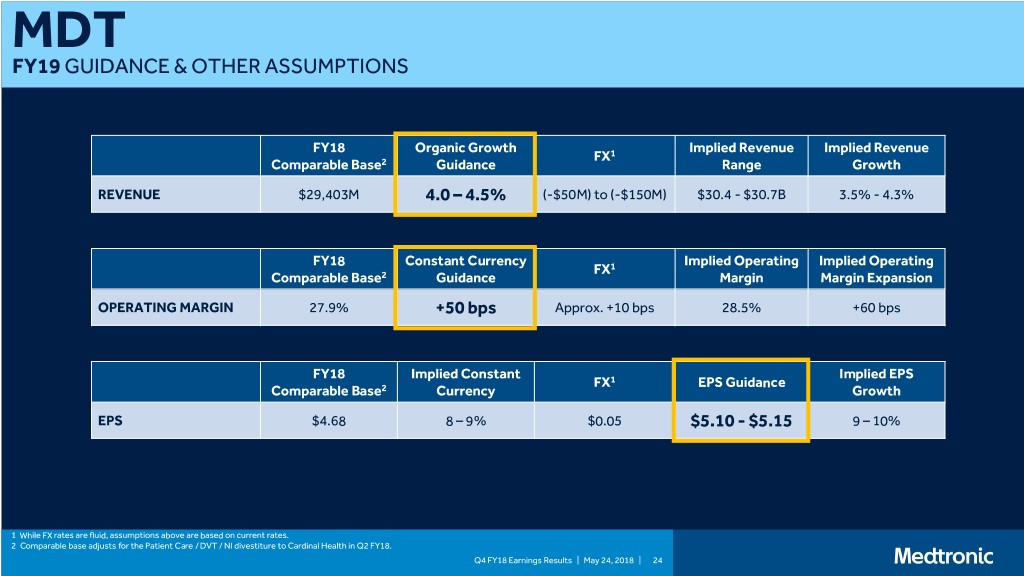
MDT FY19 GUIDANCE & OTHER ASSUMPTIONS FY18 Organic Growth Implied Revenue Implied Revenue FX1 Comparable Base2 Guidance Range Growth REVENUE $29,403M 4.0 – 4.5% (-$50M) to (-$150M) $30.4 - $30.7B 3.5% - 4.3% FY18 Constant Currency Implied Operating Implied Operating FX1 Comparable Base2 Guidance Margin Margin Expansion OPERATING MARGIN 27.9% +50 bps Approx. +10 bps 28.5% +60 bps FY18 Implied Constant Implied EPS FX1 EPS Guidance Comparable Base2 Currency Growth EPS $4.68 8 – 9% $0.05 $5.10 - $5.15 9 – 10% 1 While FX rates are fluid, assumptions above are based on current rates. 2 Comparable base adjusts for the Patient Care / DVT / NI divestiture to Cardinal Health in Q2 FY18. Q4 FY18 Earnings Results | May 24, 2018 | 24
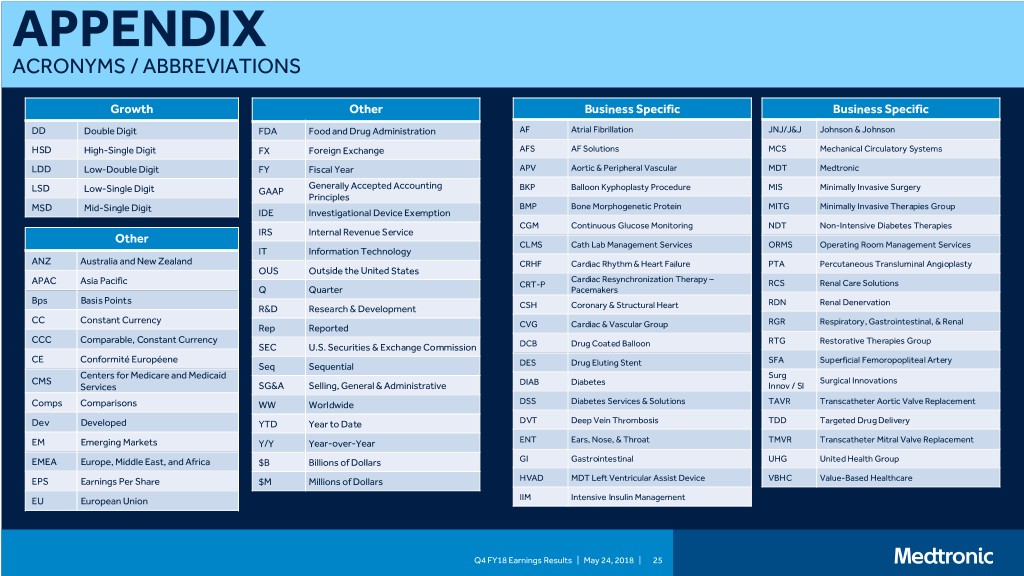
APPENDIX ACRONYMS / ABBREVIATIONS Growth Other Business Specific Business Specific DD Double Digit FDA Food and Drug Administration AF Atrial Fibrillation JNJ/J&J Johnson & Johnson HSD High-Single Digit FX Foreign Exchange AFS AF Solutions MCS Mechanical Circulatory Systems LDD Low-Double Digit FY Fiscal Year APV Aortic & Peripheral Vascular MDT Medtronic Generally Accepted Accounting LSD Low-Single Digit GAAP BKP Balloon Kyphoplasty Procedure MIS Minimally Invasive Surgery Principles MSD Mid-Single Digit BMP Bone Morphogenetic Protein MITG Minimally Invasive Therapies Group IDE Investigational Device Exemption CGM Continuous Glucose Monitoring NDT Non-Intensive Diabetes Therapies IRS Internal Revenue Service Other CLMS Cath Lab Management Services ORMS Operating Room Management Services IT Information Technology ANZ Australia and New Zealand CRHF Cardiac Rhythm & Heart Failure PTA Percutaneous Transluminal Angioplasty OUS Outside the United States Cardiac Resynchronization Therapy – APAC Asia Pacific CRT-P RCS Renal Care Solutions Q Quarter Pacemakers Bps Basis Points RDN Renal Denervation R&D Research & Development CSH Coronary & Structural Heart CC Constant Currency RGR Respiratory, Gastrointestinal, & Renal Rep Reported CVG Cardiac & Vascular Group CCC Comparable, Constant Currency RTG Restorative Therapies Group SEC U.S. Securities & Exchange Commission DCB Drug Coated Balloon CE Conformité Européene SFA Superficial Femoropopliteal Artery Seq Sequential DES Drug Eluting Stent Centers for Medicare and Medicaid Surg CMS DIAB Diabetes Surgical Innovations Services SG&A Selling, General & Administrative Innov / SI Comps Comparisons WW Worldwide DSS Diabetes Services & Solutions TAVR Transcatheter Aortic Valve Replacement Dev Developed YTD Year to Date DVT Deep Vein Thrombosis TDD Targeted Drug Delivery EM Emerging Markets Y/Y Year-over-Year ENT Ears, Nose, & Throat TMVR Transcatheter Mitral Valve Replacement EMEA Europe, Middle East, and Africa $B Billions of Dollars GI Gastrointestinal UHG United Health Group EPS Earnings Per Share $M Millions of Dollars HVAD MDT Left Ventricular Assist Device VBHC Value-Based Healthcare EU European Union IIM Intensive Insulin Management Q4 FY18 Earnings Results | May 24, 2018 | 25
