Attached files
| file | filename |
|---|---|
| 8-K - 8-K - HomeStreet, Inc. | a8-kshareholderpresentation.htm |

Annual Meeting of Shareholders Seattle, WA May 24, 2018 Nasdaq: HMST

Items of Business I. The election of Scott M. Boggs, Mark R. Patterson and Douglas I. Smith as Class I directors to serve on the Company’s board of directors (the “Board”) until the 2021 annual meeting of shareholders, or until their respective successors are elected and qualified; II. The approval on an advisory (non-binding) basis of the compensation of the Company’s named executive officers; III. The approval on an advisory (non-binding) basis of the frequency of future advisory (non-binding) shareholder votes on executive compensation; and IV. The ratification on an advisory (non-binding) basis of the appointment of Deloitte & Touche LLP as the Company’s independent registered public accounting firm for the year ending December 31, 2018. p. 1

Report on 2017 Mark K. Mason Chairman, President, & CEO p. 2

Important Disclosures Forward-Looking Statements This presentation includes forward-looking statements, as that term is defined for purposes of applicable securities laws, about our industry, our future financial performance and business plans and expectations. These statements are, in essence, attempts to anticipate or forecast future events, and thus subject to many risks and uncertainties. These forward-looking statements are based on our management's current expectations, beliefs, projections, future plans and strategies, anticipated events or trends, and similar expressions concerning matters that are not historical facts, as well as a number of assumptions concerning future events. Forward- looking statements in this presentation include, among other matters, statements regarding our business plans and strategies, general economic trends (particularly those that affect mortgage origination and refinance activity) and growth scenarios and performance targets. Readers should note, however, that all statements in this presentation other than assertions of historical fact are forward-looking in nature. These statements are subject to risks, uncertainties, assumptions and other important factors set forth in our filings with the U.S. Securities and Exchange Commission (the “SEC”), including but not limited to our annual report on Form 10-K for the year ended December 31, 2017. Many of these factors and events that affect the volatility in our stock price and shareholders’ response to those factors and events are beyond our control. Such factors could cause actual results to differ materially from the results discussed or implied in the forward-looking statements. These risks include, without limitation, changes in general political and economic conditions that impact our markets and our business, actions by the Federal Reserve Board and financial market conditions that affect monetary and fiscal policy, regulatory and legislative findings or actions that may increase capital requirements or otherwise constrain our ability to do business, including restrictions that could be imposed by our regulators on certain aspects of our operations or on our growth initiatives and acquisition activities, risks related to our ability to: realize the expected cost savings from our recent restructuring activities and cost containment measures, continue to expand our commercial and consumer banking operations, grow our franchise and capitalize on market opportunities, cost-effectively manage our overall growth efforts to attain the desired operational and financial outcomes, manage the losses inherent in our loan portfolio, make accurate estimates of the value of our non-cash assets and liabilities, maintain electronic and physical security of customer data, respond to restrictive and complex regulatory environment, and attract and retain key personnel. In addition, the volume of our mortgage banking business as well as the ratio of loan lock to closed loan volume may fluctuate due to challenges our customers may face in meeting current underwriting standards, a change in interest rates, an increase in competition for such loans, changes in general economic conditions, including housing prices and inventory levels, the job market, consumer confidence and spending habits either nationally or in the regional and local market areas in which we do business, and legislative or regulatory actions or reform that may affect our business or the banking or mortgage industries more generally. Actual results may fall materially short of our expectations and projections, and we may change our plans or take additional actions that differ in material ways from our current intentions. Accordingly, we can give no assurance of future performance, and you should not rely unduly on forward-looking statements. All forward-looking statements are based on information available to us as of the date hereof, and except as required by law we do not undertake to update or revise any forward-looking statements, for any reason. Basis of Presentation of Financial Data Unless noted otherwise in this presentation, all reported financial data is being presented as of the period ending March 31, 2018, and is unaudited, although certain information related to the year ended December 31, 2017, has been derived from our audited financial statements. All financial data should be read in conjunction with the notes to our consolidated financial statements. Non-GAAP Financial Measures and Targets Information on any non-GAAP financial measures such as core measures or tangible measures referenced in this presentation, including a reconciliation of those measures to GAAP measures, may also be found in the appendix, our SEC filings, and in the earnings release available on our web site. p. 3

Who is HomeStreet? Retail deposit branches (62) As of March 31, 2018 Primary stand-alone lending centers (51) Primary stand-alone insurance office (1) • Seattle-based diversified commercial bank – Seattle Metro company founded in 1921 Washington • Franchise with locations in all of the major coastal markets in the Western U.S. and Hawaii • 114 bank branches and primary lending Oregon (1) offices Idaho • Market leading mortgage originator and servicer • Total assets $6.9 billion Hawaii Utah California Southern Arizona California (1) The number of offices listed above does not include satellite offices with a limited number of staff who report to a manager located in a separate primary office. p. 4

2017 Growth Activity • Opened three de novo retail deposit branches in Baldwin Park, California and Strategic Growth Spokane and Redmond, Washington Activity • Acquisition of a retail deposit branch and related deposits in El Cajon, California • Total asset growth: 8% – Growth in total loans held for investments: 18% Organic Growth Activity – Growth in commercial and industrial loans: 30% • Total deposit growth: 7% – Growth in noninterest bearing checking accounts: 7% – Growth in total transaction and savings accounts: 9% • Mitigated the impact of rising interest rates and historically low housing inventory on mortgage loan volume by reducing the Mortgage Banking Segment’s capacity and cost structure • We completed the implementation of a new mortgage loan origination system Recent Developments improving efficiency • Launched a newly designed website that makes online banking with HomeStreet easier and more accessible • The enactment of tax reform resulted in the recognition of a onetime, non-cash tax benefit of $23.3 million for 2017; 2018 estimated consolidated effective tax rate between 21% and 22% – Increased minimum wage to $15.00 / hour p. 5

Strategy Expand Commercial & Consumer Banking Segment • Grow and diversify loan portfolio with focus on expanding commercial lending • Grow core deposits to improve deposit mix and support asset growth • Improve efficiency through operating leverage and process improvements • Expand product offerings and be a technology fast follower • Grow market share in highly attractive metropolitan markets p. 6
Strategy (cont.) Optimize Single Family Mortgage Banking & Servicing Segment • Committed to being a leading mortgage originator and servicer in our markets with a retail origination focus, broad product mix, and superior customer service • Focus on optimizing mortgage banking capacity and rationalize home loan centers to markets with attractive product mix • Leverage mortgage customer distribution by marketing bank products and services p. 7

Strategy (cont.) Disciplined Expense Management • Mitigate cost of growth through operating leverage and disciplined expense control • Long-term target consolidated efficiency ratio <70% • Segment efficiency ratio targets – Commercial and Consumer <60% – Mortgage Banking <85% p. 8

Significant Progress in HMST’s Transformation • We have grown tremendously, which has 12/31/11 12/31/17 CAGR been reflected in our total shareholder Total Assets $2.3B $6.7B 20% return since our IPO Loans Held for $1.3B $4.5B 23% Investment • Total assets have grown from $2.3 billion to $6.7 billion, a 20% CAGR Deposits $2.0B $4.8B 15% Retail Branches 20 59 • Our loans held for investment have grown from $1.3 billion to $4.5 billion, a 23% Average Annual Return on Average Equity CAGR 2012 – 2017 • Our deposit base has grown from $2.0 18% 16% billion to $4.8 billion, a 15% CAGR 16% 15% 14% 14% 12% 11% • Our retail branch footprint has expanded 12% Median ROAE: 8.9% 9% 9% 9% from 20 to 59 10% 8% 8% 8% 8% 8% 8% 6% 6% • We were ranked the 4th largest bank 6% headquartered in Washington State by 4% 12/31/17 assets 2% 0% • Placed 80th on Fortune Magazine’s 2017 “100 Fastest Growing Companies” list Banks with Mortgage Banking Operations Note: Banks with Mortgage Banking Operations include companies with more than 10% mortgage revenue to revenue or defined as a mortgage bank by KBW Research in the report titled, “1Q18 Preview: Universals, Large Regional, and SMID-Cap” published on April 5, 2018. Excludes banks with less than $3 billion in assets. Sources: SNL Financial; http://fortune.com/100-fastest-growing-companies/homestreet/. p. 9
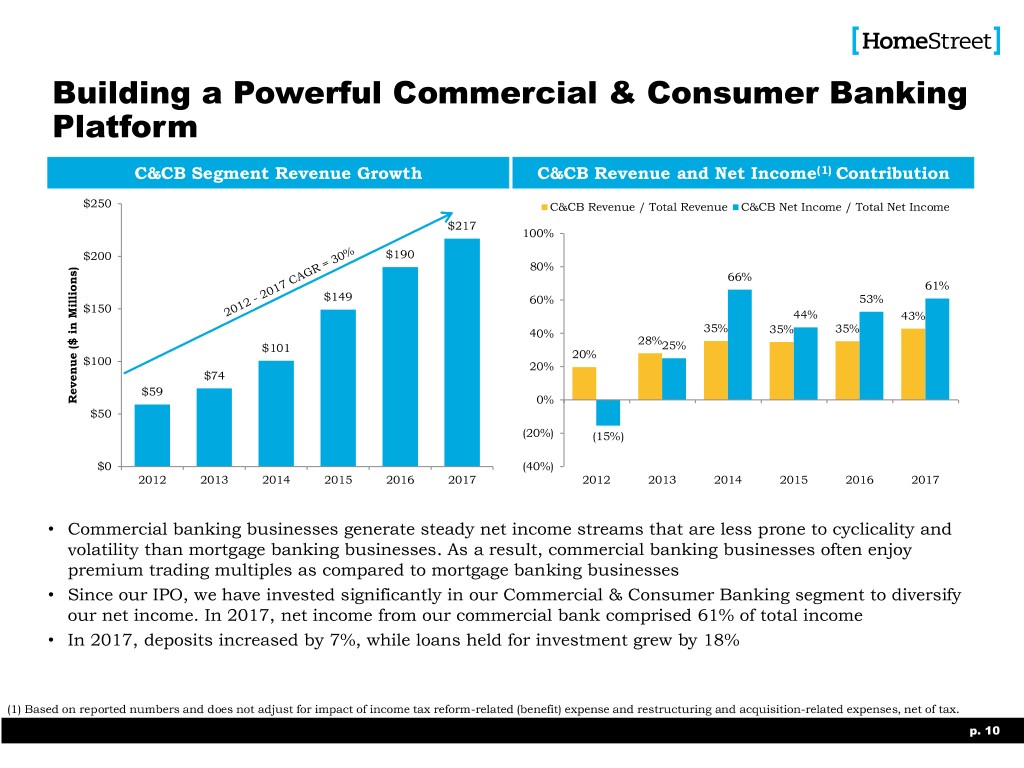
Building a Powerful Commercial & Consumer Banking Platform C&CB Segment Revenue Growth C&CB Revenue and Net Income(1) Contribution $250 C&CB Revenue / Total Revenue C&CB Net Income / Total Net Income $217 100% $200 $190 80% 66% 61% $149 60% 53% $150 44% 43% 40% 35% 35% 35% 28% $101 25% 20% $100 20% $74 $59 Revenue ($ in Millions) in ($ Revenue 0% $50 (20%) (15%) $0 (40%) 2012 2013 2014 2015 2016 2017 2012 2013 2014 2015 2016 2017 • Commercial banking businesses generate steady net income streams that are less prone to cyclicality and volatility than mortgage banking businesses. As a result, commercial banking businesses often enjoy premium trading multiples as compared to mortgage banking businesses • Since our IPO, we have invested significantly in our Commercial & Consumer Banking segment to diversify our net income. In 2017, net income from our commercial bank comprised 61% of total income • In 2017, deposits increased by 7%, while loans held for investment grew by 18% (1) Based on reported numbers and does not adjust for impact of income tax reform-related (benefit) expense and restructuring and acquisition-related expenses, net of tax. p. 10

Growth Driven by High Quality Assets Commercial Loan Growth ($ in Millions) (1) Loan Quality $3,000 2.50% 3.00% $2,695 (2) 2.05% 2.50% $2,500 $2,406 89% Decline in 2.00% NPAs / Assets 2.00% $2,000 $1,765 1.50% 1.26% 1.50% 1.60% $1,500 $1,094 1.00% 1.00% loans averageto offs - $1,000 $858 0.72% 0.50% $530 0.50% 0.50% 0.41% $500 0.24% 0.23% 0.00% Net charge Net Nonperforming assets to assetsto assets Nonperforming 0.02% (0.06%) (0.01%) (0.06%) $0 0.00% (0.50%) 2012 2013 2014 2015 2016 2017 2012 2013 2014 2015 2016 2017 NPAs / Assets Net Charge Offs / Average Loans • Growth in our commercial bank has been driven by very high quality assets • Asset quality has improved consistently every year since our IPO, reaching record low levels as of 12/31/17 • Non-performing assets to total assets ratio was 89% lower than 2012 (1) Includes commercial real estate and commercial and industrial loans. (2) Nonperforming assets include nonaccrual loans, loans 90+ days past due and still accruing and other real estate owned (OREO). p. 11

Mortgage Banking 2017 Mortgage Banking Revenue / Revenue Comparison Mortgage Banking Revenue / Revenue 100% 100% Banks with Mortgage Banking Operations (1) 80% 80% 80% 72% 65% 65% 65% 57% 57% 60% 60% 37% 39% 39% 40% 34% 40% 17% 18% 20% 13% 13% 13% 14% 10% 10% 11% 12% 20% 0% 0% 2012 2013 2014 2015 2016 2017 • At the time of our IPO, mortgage banking comprised 80% of our total revenue, and we still currently generate a meaningful percentage of our revenue from mortgage banking • Over the last six years, however, we have built a significant Commercial & Consumer Banking franchise in highly attractive markets • This has reduced our reliance on the mortgage banking business while allowing us to benefit from periods of strong mortgage performance; our mortgage banking revenue / total revenue ratio has been declining since our IPO in 2012 (1) Banks with Mortgage Banking Operations include companies with more than 10% mortgage revenue to revenue or defined as a mortgage bank by KBW Research in the report titled, “1Q18 Preview: Universals, Large Regional, and SMID-Cap” published on April 5, 2018. Excludes banks with less than $3 billion in assets. (2) Mortgage income includes spread revenue from the warehouse and mortgage correspondent aggregation businesses, in addition to fee income from the warehouse. p. 12
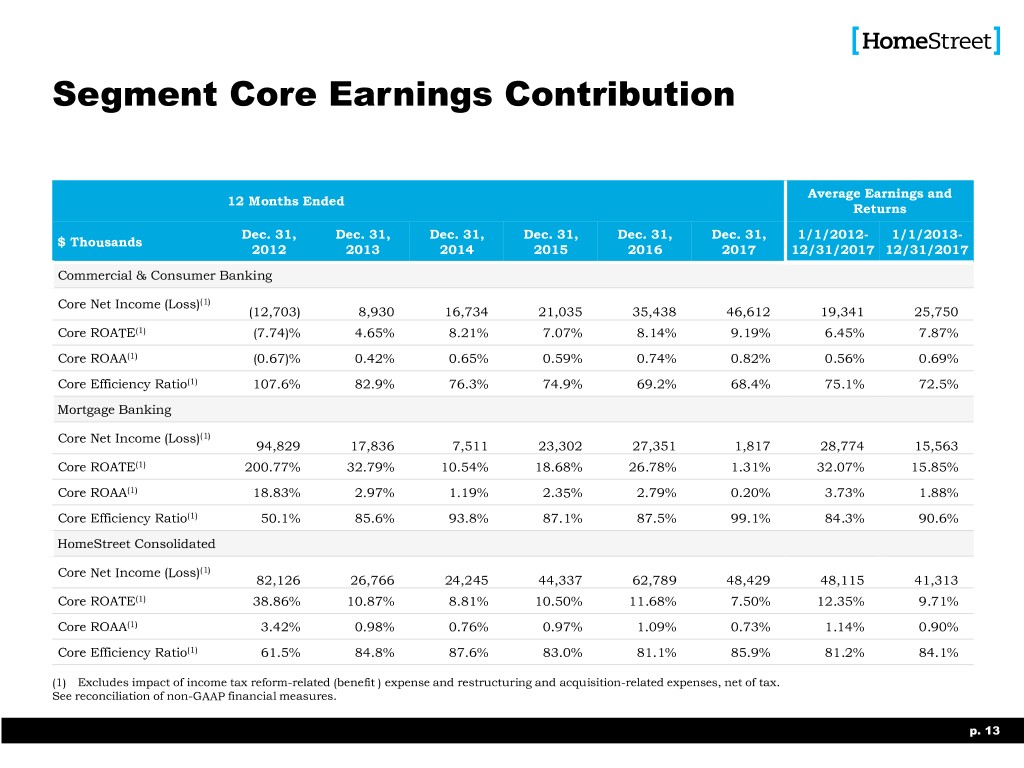
Segment Core Earnings Contribution Average Earnings and 12 Months Ended Returns Dec. 31, Dec. 31, Dec. 31, Dec. 31, Dec. 31, Dec. 31, 1/1/2012- 1/1/2013- $ Thousands 2012 2013 2014 2015 2016 2017 12/31/2017 12/31/2017 Commercial & Consumer Banking Core Net Income (Loss)(1) (12,703) 8,930 16,734 21,035 35,438 46,612 19,341 25,750 Core ROATE(1) (7.74)% 4.65% 8.21% 7.07% 8.14% 9.19% 6.45% 7.87% Core ROAA(1) (0.67)% 0.42% 0.65% 0.59% 0.74% 0.82% 0.56% 0.69% Core Efficiency Ratio(1) 107.6% 82.9% 76.3% 74.9% 69.2% 68.4% 75.1% 72.5% Mortgage Banking Core Net Income (Loss)(1) 94,829 17,836 7,511 23,302 27,351 1,817 28,774 15,563 Core ROATE(1) 200.77% 32.79% 10.54% 18.68% 26.78% 1.31% 32.07% 15.85% Core ROAA(1) 18.83% 2.97% 1.19% 2.35% 2.79% 0.20% 3.73% 1.88% Core Efficiency Ratio(1) 50.1% 85.6% 93.8% 87.1% 87.5% 99.1% 84.3% 90.6% HomeStreet Consolidated Core Net Income (Loss)(1) 82,126 26,766 24,245 44,337 62,789 48,429 48,115 41,313 Core ROATE(1) 38.86% 10.87% 8.81% 10.50% 11.68% 7.50% 12.35% 9.71% Core ROAA(1) 3.42% 0.98% 0.76% 0.97% 1.09% 0.73% 1.14% 0.90% Core Efficiency Ratio(1) 61.5% 84.8% 87.6% 83.0% 81.1% 85.9% 81.2% 84.1% (1) Excludes impact of income tax reform-related (benefit ) expense and restructuring and acquisition-related expenses, net of tax. See reconciliation of non-GAAP financial measures. p. 13

Historical Stock Price Since IPO 250% HMST KBW Regional Bank Index (KRX) SNL U.S. Thrift Index 200% 166% 137% 150% 118% 100% 50% 0% (50%)(50%) JanFeb 1, 9, 2012 2012 Jan 1, 2013 Jan 1, 2014 Jan 1, 2015 Jan 1, 2016 Jan 1, 2017 Jan 1, 2018 • HMST significantly outperformed the KBW Regional Bank and SNL U.S. Thrift indexes from the IPO date through the Total Return through 1 – Year 3 – Year 5 – Year end of 2013 due to the cyclically strong returns of the November 17, 2017: mortgage business during this period. HMST’s consolidated ROE in 2012 was 39%, which was driven by a 200% ROE in HMST 2.1% 79.2% 27.8% the Mortgage Banking segment KBW Regional Bank 6.1% 46.1% 126.1% • From the IPO to March 29,2018, HMST outperformed the SNL U.S. Thrift 3.6% 37.1% 96.2% SNL U.S. Thrift Index by 48 percentage points and the KRX by 29 percentage points Sources: Bloomberg Finance LP and SNL Financial. Total return includes stock price appreciation and dividends from February 9, 2012 to March 29, 2018. KBW Regional Bank Index is comprised of 50 publicly traded, regionally diversified midcap banking institutions, and is calculated using equal float-adjusted market-capitalization weighted methodology. SNL U.S. Thrift includes all Major Exchange-traded (NYSE, NYSE MKT, NASDAQ) Thrifts in SNL Financial’s coverage universe. p. 14

Consolidated Results of Operations For the Year Ended ($ in thousands) Dec. 31, 2017 Dec. 31, 2016 Net interest income $194,438 $180,049 Provision for loan losses 750 4,100 Noninterest income 312,154 359,150 Noninterest expense 439,653 444,322 Net income before taxes 66,189 90,777 Income taxes (benefit) expense (2,757) 32,626 Net income $68,946 $58,151 Diluted EPS $2.54 $2.34 Core net income $48,429 $62,789 Core diluted EPS $1.79 $2.53 Core ROAA 0.73% 1.09% Core ROAE 7.17% 11.09% Core ROATE 7.50% 11.68% Net Interest Margin 3.31% 3.45% Core efficiency ratio 85.93% 81.08% p. 15

Segment Results of Operations For the Year Ended Commercial and Consumer Banking Mortgage Banking ($ in thousands) Dec. 31, 2017 Dec. 31, 2016 Dec. 31, 2017 Dec. 31, 2016 Net interest income $174,542 $154,015 $19,896 $26,034 Provision for loan losses 750 4,100 - - Noninterest income 42,360 35,682 269,794 323,468 Noninterest expense 148,977 138,385 290,676 305,937 Net income before taxes 67,175 47,212 (986) 43,565 Income taxes 25,114 16,412 (27,871) 16,214 Net income $42,061 $30,800 $26,885 $27,351 Core net income $46,612 $35,438 $1,817 $27,351 Core ROAA 0.82% 0.74% 0.20% 2.79% Core ROAE 8.65% 7.64% 1.31% 26.78% Core ROATE 9.16% 8.14% 1.31% 26.78% Core efficiency ratio 68.4% 69.2% 99.1% 87.5% p. 16

Looking Ahead • Opportunities / Strengths – Headquartered and operating in the best markets in the United States – Loan and deposit growth above industry averages due in part to our locations, but also to the results of investments in growth we have made – Superior credit quality by strategy as we compete on price and not on credit terms – Strong reputation as a best in class originator and servicer of single family and commercial real estate mortgages – Uniquely situated as a $7 billion asset full service commercial and consumer bank with locations in Western United States, including Hawaii • Challenges / Risks – Mortgage banking is cyclical and seasonal, which produces earnings volatility and impacts valuation • Increased interest rates and a lack of supply of resale housing are adversely impacting the mortgage banking industry – Flat yield curve is negatively impacting margins – Safely converting the company from a troubled thrift into a commercial bank is a long process • Growth of commercial banking is challenged by the highly competitive nature of this business, recruitment of high quality bankers, investments in technology, and cultural change – Uncertain regulatory environment • Timing of Basel III capital relief • Additional cost of complying with changing consumer compliance regulations p. 17

Questions? p. 18

Thank You for Attending HomeStreet, Inc. NASDAQ:HMST http://ir.homestreet.com (Electronic copies of this presentation available upon request) p. 19

Appendix p. 20

Non-GAAP Financial Measures $ Thousands, 12 Months Ended Except Share Data Dec. 31, 2017 Dec. 31, 2016 Shareholders’ Equity $704,380 $629,284 Less: Goodwill and Other Intangibles (29,661) (30,789) Tangible Shareholders’ Equity $674,719 $598,495 Common Shares Outstanding 26,888,288 26,800,183 Book Value Per Share $26.20 $23.48 Impact of Goodwill and Other Intangibles ($1.11) ($1.15) Tangible Book Value Per Share $25.09 $22.33 Average Shareholders’ Equity 675,877 566,148 Less: Average Goodwill and Other Intangibles (30,081) (28,580) Average Tangible Shareholders’ Equity 645,796 537,568 Return on Average Shareholders’ Equity 10.20% 10.27% Impact of Goodwill and Other Intangibles 0.48% 0.55% Return on Average Tangible Shareholders’ Equity 10.68% 10.82% p. 21
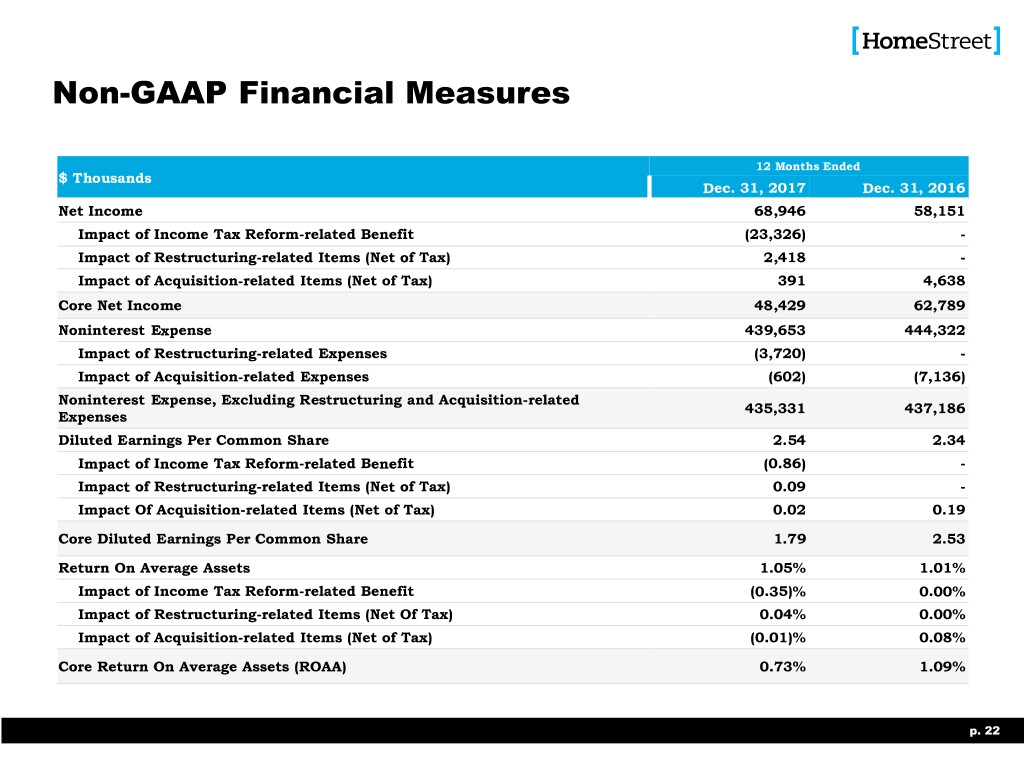
Non-GAAP Financial Measures 12 Months Ended $ Thousands Dec. 31, 2017 Dec. 31, 2016 Net Income 68,946 58,151 Impact of Income Tax Reform-related Benefit (23,326) - Impact of Restructuring-related Items (Net of Tax) 2,418 - Impact of Acquisition-related Items (Net of Tax) 391 4,638 Core Net Income 48,429 62,789 Noninterest Expense 439,653 444,322 Impact of Restructuring-related Expenses (3,720) - Impact of Acquisition-related Expenses (602) (7,136) Noninterest Expense, Excluding Restructuring and Acquisition-related 435,331 437,186 Expenses Diluted Earnings Per Common Share 2.54 2.34 Impact of Income Tax Reform-related Benefit (0.86) - Impact of Restructuring-related Items (Net of Tax) 0.09 - Impact Of Acquisition-related Items (Net of Tax) 0.02 0.19 Core Diluted Earnings Per Common Share 1.79 2.53 Return On Average Assets 1.05% 1.01% Impact of Income Tax Reform-related Benefit (0.35)% 0.00% Impact of Restructuring-related Items (Net Of Tax) 0.04% 0.00% Impact of Acquisition-related Items (Net of Tax) (0.01)% 0.08% Core Return On Average Assets (ROAA) 0.73% 1.09% p. 22

Non-GAAP Financial Measures (cont.) 12 Months Ended $ Thousands Dec. 31, 2017 Dec. 31, 2016 Return On Average Shareholders' Equity 10.20% 10.27% Impact of Income Tax Reform-related Benefit (3.45)% 0.00% Impact of Restructuring-related Items (Net of Tax) 0.36% 0.00% Impact of Acquisition-related Items (Net of Tax) 0.06% 0.82% Core Return On Average Shareholders' Equity (ROAE) 7.17% 11.09% Return On Average Tangible Shareholders’ Equity 10.68% 10.82% Impact of Income Tax Reform-related Benefit (3.61)% 0.00% Impact of Restructuring-related Items (Net of Tax) 0.37% 0.00% Impact of Acquisition-related Items (Net of Tax) 0.06% 0.86% Core Return On Average Tangible Shareholders' Equity (ROATE) 7.50% 11.68% Efficiency Ratio 86.79% 82.40% Impact of Restructuring-related Items (0.73)% 0.00% Impact of Acquisition-related Items (0.13)% (1.32)% Core Efficiency Ratio 85.93% 81.08% p. 23
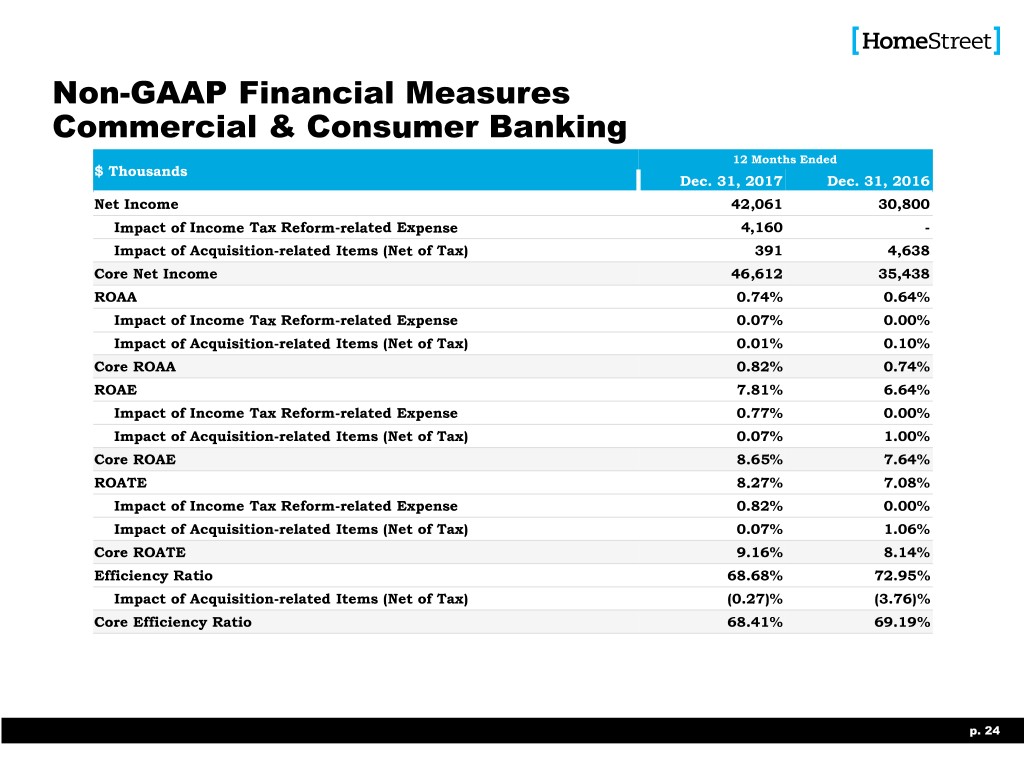
Non-GAAP Financial Measures Commercial & Consumer Banking 12 Months Ended $ Thousands Dec. 31, 2017 Dec. 31, 2016 Net Income 42,061 30,800 Impact of Income Tax Reform-related Expense 4,160 - Impact of Acquisition-related Items (Net of Tax) 391 4,638 Core Net Income 46,612 35,438 ROAA 0.74% 0.64% Impact of Income Tax Reform-related Expense 0.07% 0.00% Impact of Acquisition-related Items (Net of Tax) 0.01% 0.10% Core ROAA 0.82% 0.74% ROAE 7.81% 6.64% Impact of Income Tax Reform-related Expense 0.77% 0.00% Impact of Acquisition-related Items (Net of Tax) 0.07% 1.00% Core ROAE 8.65% 7.64% ROATE 8.27% 7.08% Impact of Income Tax Reform-related Expense 0.82% 0.00% Impact of Acquisition-related Items (Net of Tax) 0.07% 1.06% Core ROATE 9.16% 8.14% Efficiency Ratio 68.68% 72.95% Impact of Acquisition-related Items (Net of Tax) (0.27)% (3.76)% Core Efficiency Ratio 68.41% 69.19% p. 24

Non-GAAP Financial Measures Mortgage Banking 12 Months Ended $ Thousands Dec. 31, 2017 Dec. 31, 2016 Net Income $26,885 $27,351 Impact of Income Tax Reform-related Benefit (27,486) - Impact of Restructuring-related Items (Net of Tax) 2,418 - Core Net Income $1,817 $27,351 ROAA 2.91% 2.79% Impact of Income Tax Reform-related Benefit (2.97)% 0.00% Impact of Restructuring-related Items (Net of Tax) 0.26% 0.00% Core ROAA 0.20% 2.79% ROATE 19.45% 26.78% Impact of Income Tax Reform-related Benefit (19.89)% 0.00% Impact of Restructuring-related Items (Net of Tax) 1.75% 0.00% Core ROATE 1.31% 26.78% Efficiency Ratio 100.34% 87.54% Impact of Restructuring-related Items (1.28)% 0.00% Core Efficiency Ratio 99.06% 87.54% p. 25

Non-GAAP Financial Measure Segment Core Earnings Contribution For the twelve months ended For the twelve months ended (dollars in thousands, except share data) Dec. 31, 2012 Dec. 31, 2013 Dec. 31, 2014 Dec. 31, 2015 Dec. 31, 2016 Dec. 31, 2017 (dollars in thousands, except share data) Dec. 31, 2012 Dec. 31, 2013 Dec. 31, 2014 Dec. 31, 2015 Dec. 31, 2016 Dec. 31, 2017 Commercial and Consumer Banking Segment: HomeStreet, Consolidated Net income (loss) (12,703) 5,973 14,748 18,017 30,800 42,061 Net income (loss) 82,126 23,809 22,259 41,319 58,151 68,946 Impact of income tax reform-related expense - - - - - 4,160 Impact of income tax reform-related expense - - - - - (23,326) Impact of acquisition-related items (net of tax) and bargain Impact of restructuring-related items (net of tax) - - - - - 2,418 purchase gain - 2,957 1,986 3,018 4,638 391 Impact of acquisition-related items (net of tax) and bargain Core Net income (loss), excluding income tax reform-related expense purchase gain - 2,957 1,986 3,018 4,638 391 (12,703) 8,930 16,734 21,035 35,438 46,612 and acquisition-related items (net of tax) Core Net income (loss), excluding income tax reform-related expense 82,126 26,766 24,245 44,337 62,789 48,429 and acquisition-related items (net of tax) ROATE (7.74)% 3.11% 6.86% 6.09% 7.08% 8.27% Impact of income tax reform-related expense 0.00% 0.00% 0.00% 0.00% 0.00% 0.82% ROATE 38.86% 9.67% 8.09% 9.78% 10.82% 10.68% Impact of acquisition-related items (net of tax) and bargain Impact of income tax reform-related expense 0.00% 0.00% 0.00% 0.00% 0.00% (3.61)% 0.00% 1.54% 1.35% 0.98% 1.06% 0.10% purchase gain Impact of restructuring-related items (net of tax) 0.00% 0.00% 0.00% 0.00% 0.00% 0.37% Core ROATE, excluding income tax reform-related expense and Impact of acquisition-related items (net of tax) and bargain (7.74)% 4.65% 8.21% 7.07% 8.14% 9.19% 0.00% 1.20% 0.72% 0.72% 0.86% 0.06% acquisition-related items (net of tax) purchase gain Core ROATE, excluding income tax reform-related expense and 38.86% 10.87% 8.81% 10.50% 11.68% 7.50% ROAA (0.67)% 0.27% 0.57% 0.51% 0.64% 0.74% acquisition-related items (net of tax) Impact of income tax reform-related expense 0.00% 0.00% 0.00% 0.00% 0.00% 0.07% Impact of acquisition-related items (net of tax) and bargain ROAA 3.42% 0.88% 0.69% 0.91% 1.01% 1.05% 0.00% 0.15% 0.08% 0.08% 0.10% 0.01% purchase gain Impact of income tax reform-related expense 0.00% 0.00% 0.00% 0.00% 0.00% (0.35)% Core ROAA, excluding income tax reform-related expense and Impact of restructuring-related items (net of tax) 0.00% 0.00% 0.00% 0.00% 0.00% 0.04% (0.67)% 0.42% 0.65% 0.59% 0.74% 0.82% acquisition-related items (net of tax) Impact of acquisition-related items (net of tax) and bargain 0.00% 0.10% 0.07% 0.06% 0.08% (0.01)% purchase gain Efficiency ratio 107.65% 89.06% 79.29% 82.07% 72.95% 68.68% Core ROAA, excluding income tax reform-related expense and 3.42% 0.98% 0.76% 0.97% 1.09% 0.73% Impact of acquisition-related items (net of tax) and bargain acquisition-related items (net of tax) 0.00% (6.12)% (3.03)% (7.22)% (3.76)% (0.27)% purchase gain Core Efficiency ratio, excluding income tax reform-related expense and Efficiency ratio 61.45% 86.54% 88.63% 85.33% 82.40% 86.79% 107.65% 82.94% 76.26% 74.85% 69.19% 68.41% acquisition-related items Impact of restructuring-related items 0.00% 0.00% 0.00% 0.00% 0.00% (0.73)% Impact of acquisition-related items (net of tax) and bargain 0.00% (1.72)% (1.07)% (2.36)% (1.32)% (0.13)% purchase gain Mortgage Banking Segment: Core Efficiency ratio, excluding income tax reform-related expense and 61.45% 84.82% 87.56% 82.97% 81.08% 85.93% Net income (loss) 94,829 17,836 7,511 23,302 27,351 26,885 acquisition-related items Impact of income tax reform-related expense - - - - - (27,486) Impact of restructuring-related items (net of tax) - - - - - 2,418 Core Net income (loss), excluding income tax reform-related expense 94,829 17,836 7,511 23,302 27,351 1,817 and acquisition-related items (net of tax) ROATE 200.77% 32.79% 10.54% 18.68% 26.78% 19.45% Impact of income tax reform-related expense 0.00% 0.00% 0.00% 0.00% 0.00% (19.89)% Impact of restructuring-related items (net of tax) 0.00% 0.00% 0.00% 0.00% 0.00% 1.75% Core ROATE, excluding income tax reform-related expense and 200.77% 32.79% 10.54% 18.68% 26.78% 1.31% acquisition-related items (net of tax) ROAA 18.83% 2.97% 1.19% 2.35% 2.79% 2.91% Impact of income tax reform-related expense 0.00% 0.00% 0.00% 0.00% 0.00% (2.97)% Impact of restructuring-related items (net of tax) 0.00% 0.00% 0.00% 0.00% 0.00% 0.26% Core ROAA, excluding income tax reform-related expense and 18.83% 2.97% 1.19% 2.35% 2.79% 0.20% acquisition-related items (net of tax) Efficiency ratio 50.06% 85.56% 93.75% 87.07% 87.54% 100.34% Impact of restructuring-related items 0.00% 0.00% 0.00% 0.00% 0.00% (1.28)% Core Efficiency ratio, excluding income tax reform-related expense and 50.06% 85.56% 93.75% 87.07% 87.54% 99.06% acquisition-related items p. 42
