Attached files
| file | filename |
|---|---|
| EX-99.2 - EXHIBIT 99.2 - GAP INC | historicalcompariablesal.htm |
| EX-99.1 - EXHIBIT 99.1 - GAP INC | q12018eprexhibit991.htm |
| 8-K - 8-K - GAP INC | q12018earnings8-k.htm |

GAP INC. FISCAL 2018 FIRST QUARTER EARNINGS RESULTS ART PECK PRESIDENT & CHIEF EXECUTIVE OFFICER TERI LIST-STOLL EXECUTIVE VICE PRESIDENT & CHIEF FINANCIAL OFFICER

DISCLOSURE STATEMENT FORWARD LOOKING STATEMENTS This conference call and webcast contain forward-looking statements within the "safe harbor" provisions of the Private Securities Litigation Reform Act of 1995. All statements other than those that are purely historical are forward-looking statements. Forward-looking statements include statements identified as such in our May 24, 2018 press release. Because these forward-looking statements involve risks and uncertainties, there are important factors that could cause our actual results to differ materially from those in the forward-looking statements. Information regarding factors that could cause results to differ can be found in our May 24, 2018 earnings press release, our Annual Report on Form 10-K for the fiscal year ended February 3, 2018, and our subsequent filings with the U.S. Securities and Exchange Commission, all of which are available on gapinc.com. These forward-looking statements are based on information as of May 24, 2018. We assume no obligation to publicly update or revise our forward-looking statements even if experience or future changes make it clear that any projected results expressed or implied therein will not be realized. SEC REGULATION G This presentation includes the non-GAAP measure free cash flow. The description and reconciliation of this measure from GAAP is included in our May 24, 2018 earnings press release, which is available on gapinc.com. 2

Q1 2018 HIGHLIGHTS: GAP INC. COMP SALES 7% 1 Year Comps 2 Year Comps 7% 5% 5% 3% 3% 3% 2% 2% 1% 1% 1% 0% -1% -2% -3% -4% -5% -6% Q4 2016 Q1 2017 Q2 2017 Q3 2017 Q4 2017 Q1 2018 6 consecutive quarters of positive comparable sales 3

Q1 2018 HIGHLIGHTS: U.S. STORES TRAFFIC TRENDS Q2’17 Q3’17 Q4’17 Q1’18 + + + _ : Beat to industry traffic : Miss to industry traffic + : Positive traffic 4

Q1 2018 HIGHLIGHTS: ONLINE SALES GROWTH Gap Inc. Online Sales Growth Rate 30% 15% 0% Q1 2016 Q1 2018 Continued strength in online sales Note: Online sales includes both sales through our online channels as well as ship-from-store sales. Table above includes impacts from 53rd week in Q4’17, calendar shift in Q1’18, and the adoption of ASC 606 in Q1’18. 5

Q1 P&L SUMMARY IN MILLIONS Q1 2018 Without Q1 2018 Without Q1 2018 Q1 2017 Adoption of ASC 606 Adoption of ASC 606 vs. Q1 2017 NET SALES $3,783 $3,642 $3,440 +6% COMP 1% 1% 2% GROSS PROFIT $1,427 $1,336 $1,303 +3% % 37.7% 36.7% 37.9% (120bps) MERCHANDISE MARGIN B/(W) LY (140bps) (180bps) +220bps ROD % OF SALES B/(W) LY +120bps +60bps +50bps OPERATING EXPENSES $1,198 $1,106 $1,049 +5% % 31.7% 30.4% 30.5% +10bps OPERATING INCOME $229 $230 $254 (9%) % 6.1% 6.3% 7.4% (110bps) NET INCOME $164 165 $143 +15% DILUTED EPS $0.42 $0.42 $0.36 +17% 6

ASC 606 ADOPTION IMPACT ON Q1 2018 IN MILLIONS 13 WEEKS ENDED MAY 5, 2018 BALANCES WITHOUT AS REPORTED ADJUSTMENTS ADOPTION of ASC 606 NET SALES $3,783 $(141) $3,642 COST OF GOODS SOLD AND OCCUPANCY EXPENSES 2,356 (50) 2,306 GROSS PROFIT 1,427 (91) 1,336 OPERATING EXPENSES 1,198 (92) 1,106 OPERATING INCOME 229 1 230 INTEREST, NET 10 - 10 INCOME BEFORE INCOME TAXES 219 1 220 INCOME TAXES 55 - 55 NET INCOME $164 $1 $165 7

Q1 2018: ADDITIONAL METRICS $1.4 billion $138 million Q1 2018 ending Q1 2018 capital cash, cash expenditures equivalents, and short-term investments $194 million +4% Q1 2018 Year-over-year distributions to inventory shareholders growth at the through share end of Q1 2018 repurchases and dividends

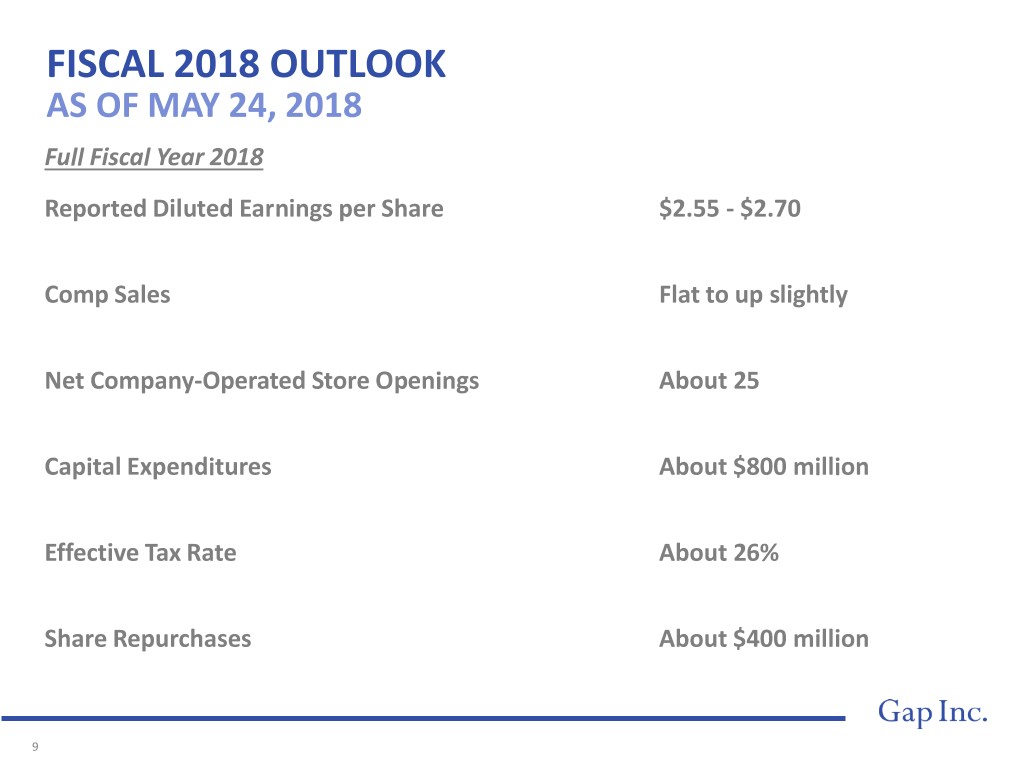
FISCAL 2018 OUTLOOK AS OF MAY 24, 2018 Full Fiscal Year 2018 Reported Diluted Earnings per Share $2.55 - $2.70 Comp Sales Flat to up slightly Net Company-Operated Store Openings About 25 Capital Expenditures About $800 million Effective Tax Rate About 26% Share Repurchases About $400 million 9

