Attached files
| file | filename |
|---|---|
| 8-K - FORM 8-K - Franklin Financial Network Inc. | tv494928_8k.htm |
Exhibit 99.1

MAY 24, 2018 FRANKLIN FINANCIAL NETWORK ANNUAL MEETING

FORWARD - LOOKING STATEMENTS Except for the historical information contained herein, this presentation contains forward - looking statements within the meaning of Section 27A of the Securities Act of 1933, as amended, and Section 21E of the Securities Exchange Act of 1934, as amended. The forward - looking statements include, among other things, statements regarding intent, belief or expectations of the Company and can be identified by the use of words such as "may," "will," "should," "would," "assume," "outlook," "seek," "plan," "believe," "expect," "anticipate," "intend," "estimate," "forecast," and other comparable terms. The Company intends that all such statements be subject to the “safe harbor” provisions of those Acts. Because forward - looking statements involve risks and uncertainties, actual results may differ materially from those expressed or implied. Investors are cautioned not to place undue reliance on these forward - looking statements and are advised to carefully review the discussion of forward - looking statements and risk factors in documents the Company files with the Securities and Exchange Commission. The Company undertakes no obligation to publicly update or revise any forward - looking statements, whether as a result of new information, future events or otherwise.

AGENDA • Official Business • Franklin Synergy Bank Progress Report • Questions

AGENDA • Mandy Garland Appointed Judge of the Election • Quorum Is Present, Either in Person or by Proxy • Anyone Who Would Like to Vote in Person or Who Would Like to Change Their Proxy? • Results of Ballot

FRANKLIN FINANCIAL NETWORK/FRANKLIN SYNERGY BANK BOARDS OF DIRECTORS Jimmy Allen* Hank Brockman* PJ Pratt Pam Stephens* Lee Moss David Kemp* Richard Herrington* Jim Cross Greg Waldron* Melody Sullivan* Ben Wynd* Anil Patel* * Denotes Franklin Financial Network Board Members elected today

THE SUCCESS OF FRANKLIN FINANCIAL NETWORK

Experienced Management Team with a Proven Track Record Robust Balance Sheet Growth Local Real Estate Lending Expertise Well Positioned in Attractive Markets Superior Asset Quality Strong Profitability METRICS THAT DISTINGUISH FRANKLIN FINANCIAL NETWORK

CULTURE CULTIVATES COMMUNITY Commitment to Financial Performance Employees Are Owners Team Oriented 1 2 3 Invested in Technology 4 We manage the bank with a long - term view, focusing on stability and consistent high performance Accountability – individuals are challenged to perform and compensated accordingly All of our officers and many of our employees are shareholders Incentivized to see company succeed Team has worked closely together for many years with minimal turnover Our employees take active leadership roles in the community We have aggressively invested in technology Most cost effective way to do business Our local markets demand a technology - driven bank
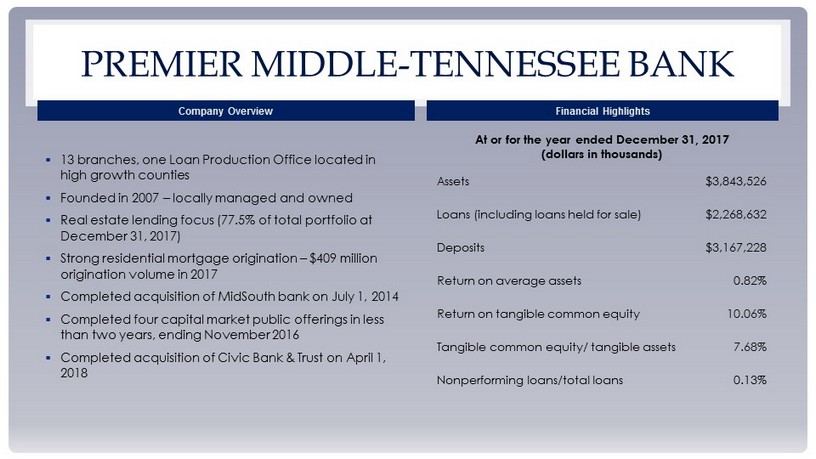
▪ 13 branches, one L oan Production O ffice located in high growth counties ▪ Founded in 2007 – locally managed and owned ▪ Real estate lending focus (77.5% of total portfolio at December 31, 2017) ▪ Strong residential mortgage origination – $409 million origination volume in 2017 ▪ Completed acquisition of MidSouth bank on July 1, 2014 ▪ Completed four capital market public offerings in less than two years, ending November 2016 ▪ Completed acquisition of Civic Bank & Trust on April 1, 2018 PREMIER MIDDLE - TENNESSEE BANK Company Overview Financial Highlights At or for the year ended December 31, 2017 (dollars in thousands) Assets $3,843,526 Loans (including loans held for sale) $2,268,632 Deposits $3,167,228 Return on average assets 0.82% Return on tangible common equity 10.06% Tangible common equity/ tangible assets 7.68% Nonperforming loans/total loans 0.13%

OUR MISSION STATEMENT Our Mission is to build a legacy company by: • Creating shareholder value • Cultivating strong customer relationships • Fostering an extraordinary team of directors, officers, and employees We will profitably market innovative financial products and services to relationship - oriented local businesses, professionals, consumers, and community banks.

MANAGING BANKING SUCCESS • Key Dynamics of Bank Success Is Managing Competing and Conflicting Objectives: • Soundness • Growth • Profitability • Corporate Citizenship

SOUNDNESS

ASSET QUALITY 0.18% 0.27% 0.16% 0.21% 0.37% (0.00%) 0.10% 0.01% 0.02% (0.02%) (0.10%) 0.00% 0.10% 0.20% 0.30% 0.40% 0.50% 2008 2009 2010 2011 2012 2013 2014 2015 2016 2017 Loan Losses as a % of Loans 0.91% 2.67% 1.41% 0.90% 0.82% 0.35% 0.14% 0.16% 0.21% 0.12% 0.00% 0.50% 1.00% 1.50% 2.00% 2.50% 3.00% 2008 2009 2010 2011 2012 2013 2014 2015 2016 2017 Non - Performing Assets to Assets

ASSET QUALITY 6.9% 22.4% 13.0% 8.4% 8.8% 4.0% 2.7% 0.6% 1.3% 1.3% 2.0% 12.6% 20.7% 18.9% 23.1% 17.5% 10.9% 8.9% 8.1% 5.6% 0.0% 5.0% 10.0% 15.0% 20.0% 25.0% 2008 2009 2010 2011 2012 2013 2014 2015 2016 2017 Texas Ratio (vs. peer) FSB Peer Key Elements Supporting Asset Quality • Vibrant Local Markets • Conservative Underwriting • Attention to Detail in Loan Servicing • Knowledge of Customer

GROWTH

ASSET GROWTH 194 272 350 465 578 796 1,356 2,168 2,943 3,844 - 500 1,000 1,500 2,000 2,500 3,000 3,500 4,000 2008 2009 2010 2011 2012 2013 2014 2015 2016 2017 Assets (in millions) • In 2007, FSB W as the Smallest of 177 Banks H eadquartered in Tennessee • Today, FSB Is the Fourth L argest Bank H eadquartered in Tennessee • At March 31, 2018, FSB Ranked A mong the Largest 250 Banks Headquartered in the USA

DEPOSIT GROWTH 145 227 306 406 515 681 1,172 1,814 2,392 3,167 - 500 1,000 1,500 2,000 2,500 3,000 3,500 2008 2009 2010 2011 2012 2013 2014 2015 2016 2017 Deposits (in millions) • Local Deposit Market Share Is Measured Annually at June 30 by FDIC • As of June 30, 2017, FSB achieved Market Share of: • #1 in Williamson County • #2 in Rutherford County • #6 in Nashville MSA – • Market Share achieved with significantly fewer locations than competitors, in just two of the counties in the Nashville MSA

LOAN GROWTH 91 168 198 235 315 432 806 1,318 1,797 2,269 - 250 500 750 1,000 1,250 1,500 1,750 2,000 2,250 2,500 2008 2009 2010 2011 2012 2013 2014 2015 2016 2017 Loans (in millions) • Annual Loan Growth • 2017: 26.2% • 2016: 36.4% • 2015: 63.6% • 2014: 86.5% • Acquisition of MidSouth Bank (2014) and Addition of Health Care Banking Team (2015) Supported Growth Performance

PROFITABILITY

NET INCOME AND EPS ( AS REPORTED AND ADJUSTED FOR EFFECT OF TAX CUTS & JOBS ACT, EFFE CTIVE 12/22/17) (2,505) (616) 973 2,154 4,140 4,561 8,414 16,080 28,057 28,099 33,422 (5,000) - 5,000 10,000 15,000 20,000 25,000 30,000 35,000 40,000 2008 2009 2010 2011 2012 2013 2014 2015 2016 2017 Net Income (in thousands) as reported as adjusted $(0.95) $(0.22) $0.28 $0.57 $1.03 $1.13 $1.32 $1.62 $2.56 $2.14 $2.54 $(1.00) $(0.50) $- $0.50 $1.00 $1.50 $2.00 $2.50 $3.00 2008 2009 2010 2011 2012 2013 2014 2015 2016 2017 Basic Earnings Per Share as reported as adjusted

PROFITABILITY (AS REPORTED AND ADJUSTED FOR EFFECT OF TAX CUTS & JOBS ACT, EFF ECTIVE 12/22/17) 0.33% 0.58% 0.80% 0.72% 0.80% 0.92% 1.10% 0.82% 0.97% 0.00% 0.25% 0.50% 0.75% 1.00% 1.25% 2008 2009 2010 2011 2012 2013 2014 2015 2016 2017 Return on Assets as reported as adjusted NM NM 3.31% 5.65% 8.36% 8.24% 8.62% 9.52% 13.50% 9.67% 11.51% 0.00% 2.50% 5.00% 7.50% 10.00% 12.50% 15.00% 2008 2009 2010 2011 2012 2013 2014 2015 2016 2017 Return on Equity as reported as adjusted NM NM

KEY ELEMENTS OF PROFITABILITY • Team Focus on Building Long Term Profitability • Economies of Scale • Use of Technology to Manage Operating Costs

CORPORATE CITIZENSHIP
CORPORATE CITIZENSHIP • Provide Leadership for Civic, Professional, and Charitable Organizations within the Community • As “Trustee of Public Faith”, Adhere to Regulatory Guidelines and Practices

FIRST QUARTER 2018 UPDATE

FIRST QUARTER 2018 HIGHLIGHTS Soundness • Nonperforming loans to total loans (1) : 0.15% • Net charge - offs to average loans: 0.01% • Tier 1 risk - based capital ratio (2) : 11.45% Growth • Strong growth in total loans (1) : +18.5% y/y • Net income available to common shareholders: + 26.7% • Diluted EPS of $ 0.73: +25.9% y/y Profitability • Return on assets: 1.03% • Return on tangible common equity: 14.07% (1) Excludes loans held for sale.
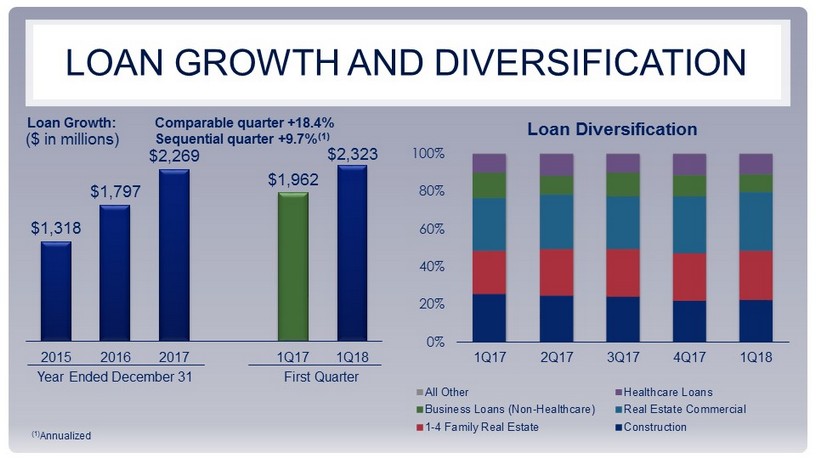
LOAN GROWTH AND DIVERSIFICATION ($ in millions) Loan Growth: Comparable quarter +18.4% Sequential quarter +9.7% (1) Loan Diversification $1,318 $1,797 $2,269 $1,962 $2,323 2015 2016 2017 1Q17 1Q18 Year Ended December 31 First Quarter 0% 20% 40% 60% 80% 100% 1Q17 2Q17 3Q17 4Q17 1Q18 All Other Healthcare Loans Business Loans (Non-Healthcare) Real Estate Commercial 1-4 Family Real Estate Construction (1) Annualized

KEY METRIC - ASSET QUALITY: PRIMARY MEASURES ($ in millions) Nonperforming Assets NPAs/total loans + foreclosed assets 0.27% 0.26% 0.21% 0.20% 0.22% Allowance for loan losses/NPLs 449% 479% 697% 698 % 621% Net charge offs/average loans 0.07% 0.00% (0.13%) 0.00% 0.01% 1Q17 2Q17 3Q17 4Q17 1Q18 Past Due 90 Days or More Non-accrual Foreclosed assets $4.4 $4.5 NPLs $5.3 $5.3 $ 5.0

IMPROVING EFFICIENCIES Net Interest Margin By Quarter (1) (1) Reflects tax - equivalent adjustments Efficiency Ratio 3.18% 3.08% 3.05% 2.92% 2.71% 1Q17 2Q17 3Q17 4Q17 1Q18 51.63% 53.91% 54.77% 57.36% 54.21% 1Q17 2Q17 3Q17 4Q17 1Q18

QUESTIONS