Attached files
| file | filename |
|---|---|
| 8-K - 8-K - Braemar Hotels & Resorts Inc. | bhrinvestorpresentation8-k.htm |

May 2018

Forward Looking Statements and Non-GAAP Measures In keeping with the SEC's "Safe Harbor" guidelines, certain statements made during this presentation could be considered forward- looking and subject to certain risks and uncertainties that could cause results to differ materially from those projected. When we use the words "will likely result," "may," "anticipate," "estimate," "should," "expect," "believe," "intend," or similar expressions, we intend to identify forward-looking statements. Such forward-looking statements include, but are not limited to, our business and investment strategy, our understanding of our competition, current market trends and opportunities, projected operating results, and projected capital expenditures. These forward-looking statements are subject to known and unknown risks and uncertainties, which could cause actual results to differ materially from those anticipated including, without limitation: general volatility of the capital markets and the market price of our common stock; changes in our business or investment strategy; availability, terms and deployment of capital; availability of qualified personnel; changes in our industry and the market in which we operate, interest rates or the general economy, and the degree and nature of our competition. These and other risk factors are more fully discussed in the company's filings with the Securities and Exchange Commission. EBITDA is defined as net income before interest, taxes, depreciation and amortization. EBITDA yield is defined as trailing twelve month EBITDA divided by the purchase price or debt amount. A capitalization rate is determined by dividing the property's net operating income by the purchase price. Net operating income is the property's funds from operations minus a capital expense reserve of either 4% or 5% of gross revenues. Hotel EBITDA flow-through is the change in Hotel EBITDA divided by the change in total revenues. EBITDA, FFO, AFFO, CAD and other terms are non-GAAP measures, reconciliations of which have been provided in prior earnings releases and filings with the SEC or in the appendix to this presentation. The calculation of implied equity value is derived from an estimated blended capitalization rate (“Cap Rate”) for the entire portfolio using the capitalization rate method. The estimated Cap Rate is based on recent Cap Rates of publically traded peers involving a similar blend of asset types found in the portfolio, which is then applied to Net Operating Income (“NOI”) of the company’s assets to calculate a Total Enterprise Value (“TEV”) of the company. From the TEV, we deduct debt and preferred equity and then add back working capital and the company’s investment in Ashford Inc. to derive an equity value. The capitalization rate method is one of several valuation methods for estimating asset value and implied equity value. Among the limitations of using the capitalization rate method for determining an implied equity value are that it does not take into account the potential change or variability in future cash flows, potential significant future capital expenditures, the intended hold period of the asset, or a change in the future risk profile of an asset. This overview is for informational purposes only and is not an offer to sell, or a solicitation of an offer to buy or sell, any securities of Braemar Hotels & Resorts, Inc. or any of its respective affiliates, and may not be relied upon in connection with the purchase or sale of any such security. Company Presentation // May 2018 2

Management Team RICHARD J. STOCKTON Chief Executive Officer & DERIC S. EUBANKS, CFA JEREMY J. WELTER President Chief Financial Officer Chief Operating Officer . 20 years of hospitality . 18 years of hospitality . 13 years of hospitality experience experience experience . 1 year with the Company . 15 years with the Company . 8 years with the Company (5 years with the Company’s . 15 years with Morgan Stanley . 3 years with ClubCorp predecessor) Cornell School of Hotel CFA charterholder . . . 5 years with Stephens Administration, BS . Southern Methodist University Investment Bank . University of Pennsylvania BBA . Oklahoma State University BS MBA Company Presentation // May 2018 3
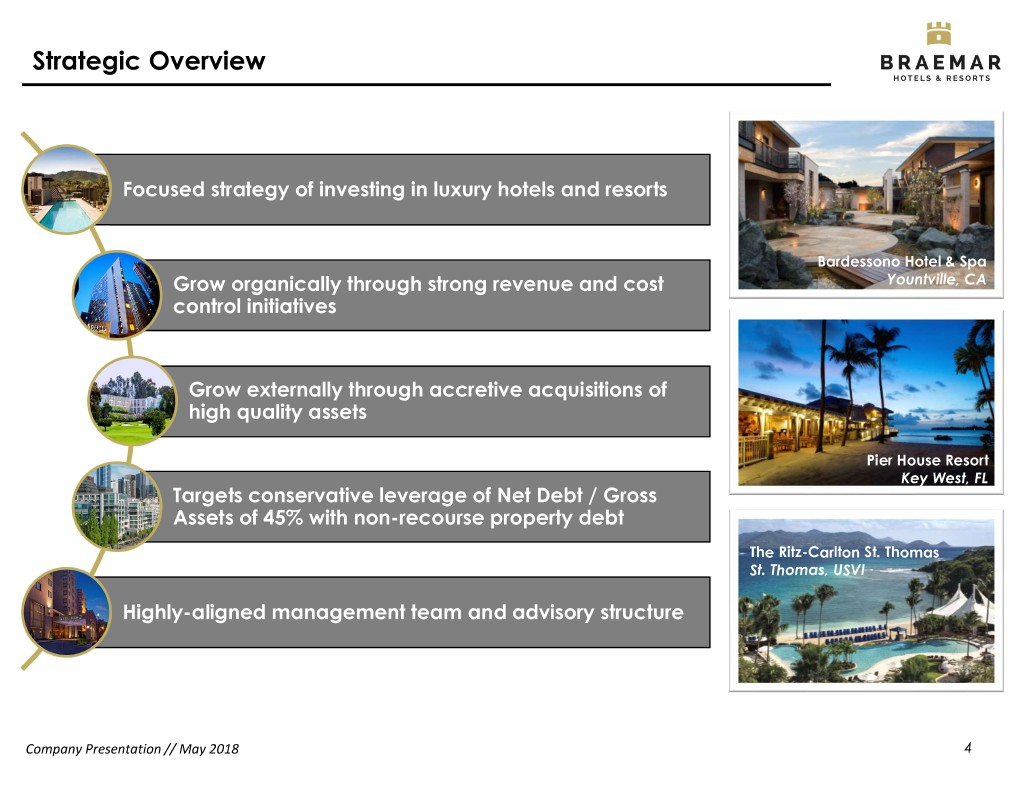
Strategic Overview Focused strategy of investing in luxury hotels and resorts Bardessono Hotel & Spa Grow organically through strong revenue and cost Yountville, CA control initiatives Grow externally through accretive acquisitions of high quality assets Pier House Resort Key West, FL Targets conservative leverage of Net Debt / Gross Assets of 45% with non-recourse property debt The Ritz-Carlton St. Thomas St. Thomas, USVI Highly-aligned management team and advisory structure Company Presentation // May 2018 4
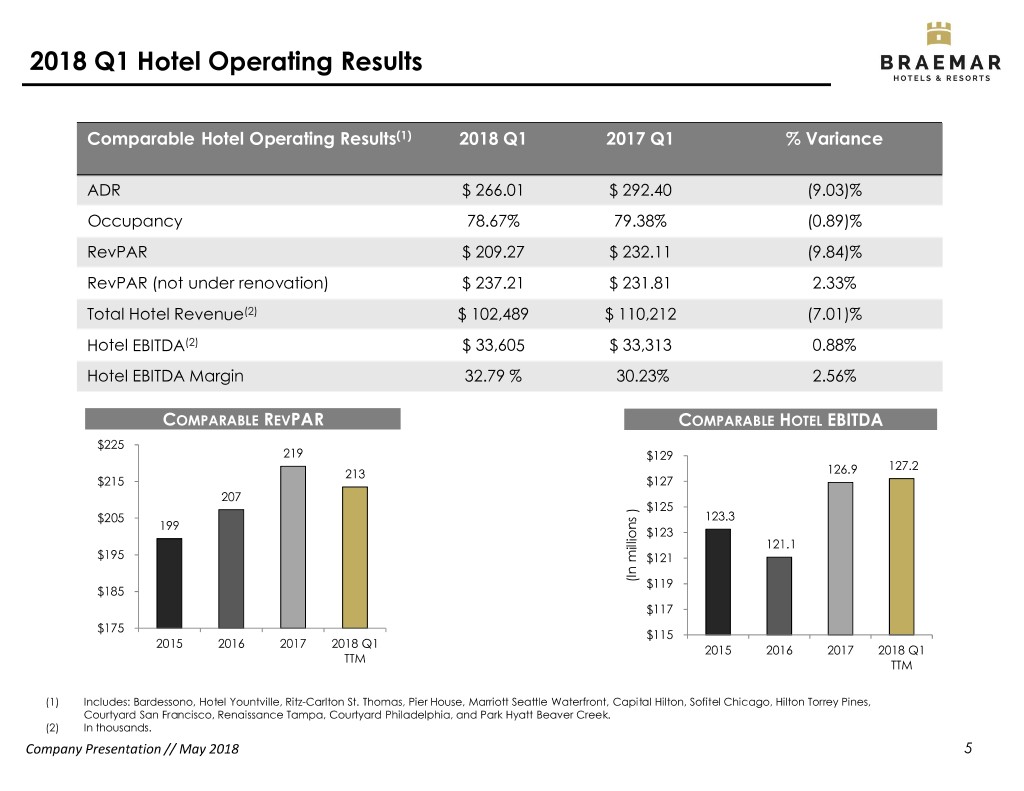
2018 Q1 Hotel Operating Results Comparable Hotel Operating Results(1) 2018 Q1 2017 Q1 % Variance ADR $ 266.01 $ 292.40 (9.03)% Occupancy 78.67% 79.38% (0.89)% RevPAR $ 209.27 $ 232.11 (9.84)% RevPAR (not under renovation) $ 237.21 $ 231.81 2.33% Total Hotel Revenue(2) $ 102,489 $ 110,212 (7.01)% Hotel EBITDA(2) $ 33,605 $ 33,313 0.88% Hotel EBITDA Margin 32.79 % 30.23% 2.56% COMPARABLE REVPAR COMPARABLE HOTEL EBITDA $225 219 $129 127.2 213 126.9 $215 $127 207 $125 $205 123.3 199 $123 121.1 $195 $121 (In millions ) millions (In $119 $185 $117 $175 $115 2015 2016 2017 2018 Q1 2015 2016 2017 2018 Q1 TTM TTM (1) Includes: Bardessono, Hotel Yountville, Ritz-Carlton St. Thomas, Pier House, Marriott Seattle Waterfront, Capital Hilton, Sofitel Chicago, Hilton Torrey Pines, Courtyard San Francisco, Renaissance Tampa, Courtyard Philadelphia, and Park Hyatt Beaver Creek. (2) In thousands. Company Presentation // May 2018 5

2018 Q1 Company Results Earnings Results • Adjusted EBITDAre was $29.8 million for the quarter, compared with $24.9 million for the prior year quarter • Comparable RevPAR for all hotels not under renovation increased 2.3% to $237.21 during the quarter • Adjusted funds from operations (AFFO) was $0.44 per diluted share for the quarter as compared with $0.46 per diluted share from prior year quarter • Subsequent to quarter end, the Company rebranded from Ashford Hospitality Prime to Braemar Hotels & Resorts • Subsequent to quarter end, the Company completed the acquisition of the 266-room Ritz Carlton Sarasota in Sarasota, FL for $171 million • Subsequent to quarter end, the Company agreed to sell the 293-room Renaissance Tampa in Tampa, FL for $68 million • Capex invested during the quarter was $15.7 million ADJUSTED EBITDARE AFFO PER SHARE QUARTERLY DIVIDEND PER SHARE $110 $107.4 $2.00 $0.80 $105 $102.5 $101.4 $1.60 $0.34 $0.31 $0.20 $100 $0.16 $1.20 $0.38 $0.42 $0.37 $95 $0.40 $0.12 $0.16 $0.80 $0.60 $0.50 $0.10 $0.12 (In millions) (In $90 $88.3 $0.62 $0.16 $0.10 $0.40 $0.12 $85 $0.39 $0.46 $0.44 $0.10 $0.16 $0.16 $0.26 $0.10 $0.00 $0.00 $0.05 $80 2015 2016 2017 2018 2015 2016 2017 2018 2015 2016 2017 2018 Q1 TTM Q1 Q2 Q3 Q4 Q1 Q2 Q3 Q4 Company Presentation // May 2018 6
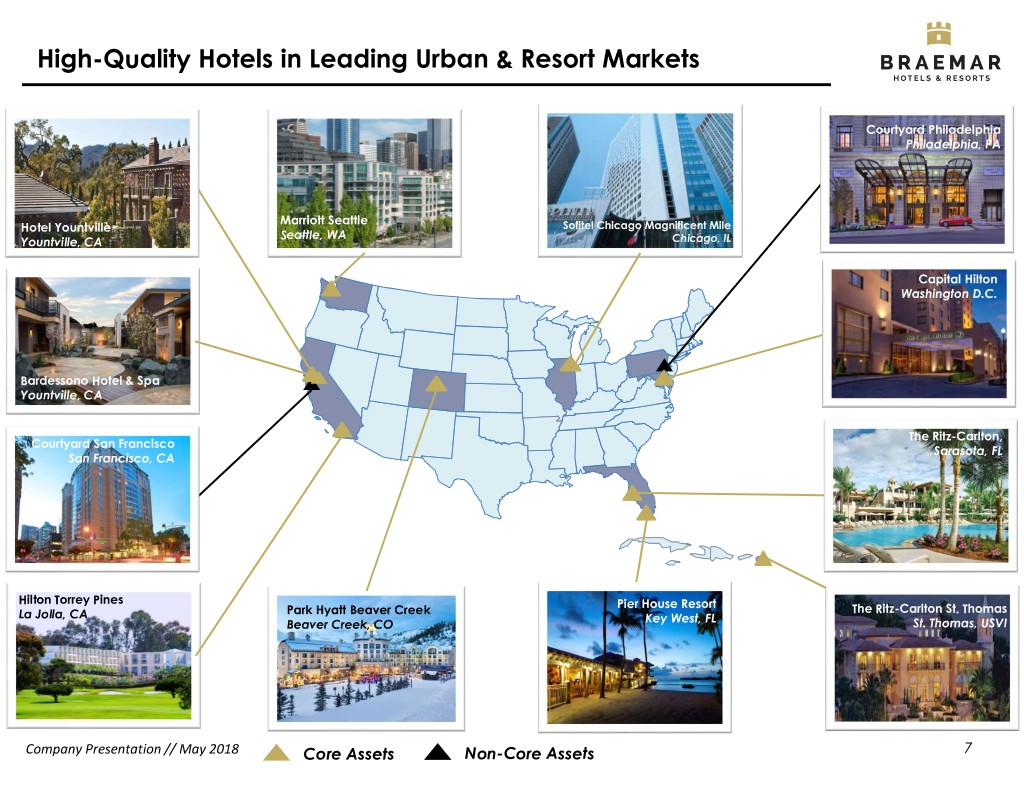
High-Quality Hotels in Leading Urban & Resort Markets Courtyard Philadelphia Philadelphia, PA Capital Hilton Marriott Seattle Washington D.C. Hotel Yountville Sofitel Chicago Magnificent Mile Seattle, WA Yountville, CA Chicago, IL Capital Hilton Washington D.C. Renaissance Tampa Tampa, FL Bardessono Hotel & Spa Yountville, CA The Ritz-Carlton, Courtyard San Francisco Sarasota, FL San Francisco, CA Hilton Torrey Pines Pier House Resort Park Hyatt Beaver Creek Pier House Resort The Ritz-Carlton St. Thomas La Jolla, CA Key West, FL Beaver Creek, CO Key West, FL St. Thomas, USVI Company Presentation // May 2018 Core Assets Non-Core Assets 7

Portfolio Detail • Core portfolio quality unparalleled in the $234 $213 public lodging REIT sector • Geographically diversified portfolio CORE REVPAR OVERALL REVPAR located in strong markets Number of TTM TTM TTM TTM Hotel % of (1) (1) (1) (1) Core Location Rooms ADR OCC RevPAR EBITDA Total Bardessono Napa Valley, CA 62 $775 76% $588 $5,256 4.1% Hotel Yountville Napa Valley, CA 80 $546 72% $395 $5,737 4.5% Ritz-Carlton St. Thomas St. Thomas, USVI 180 $438 80% $349 $9,575 7.5% Pier House Key West, FL 142 $430 76% $328 $11,162 8.8% Park Hyatt Beaver Creek Beaver Creek, CO 190 $446 60% $267 $9,467 7.4% Marriott Seattle Waterfront Seattle, WA 361 $276 87% $240 $16,134 12.7% Capital Hilton Washington D.C. 550 $232 87% $201 $15,769 12.4% Sofitel Chicago Magnificent Mile Chicago, IL 415 $204 80% $164 $5,811 4.6% Hilton Torrey Pines La Jolla, CA 394 $204 85% $174 $15,712 12.4% Total Core 2,374 $288 81% $234 $94,623 74.4% Non-Core (2)(2) Courtyard San Francisco Downtown(2) San Francisco, CA 410 $267 80% $214 $12,574 9.9% (3)(3) Renaissance Tampa(3) Tampa, FL 293 $190 83% $158 $6,780 5.3% (2)(2) Courtyard Philadelphia Downtown(2) Philadelphia, PA 499 $182 83% $151 $13,236 10.4% Total Non-Core 1,202 $212 82% $174 $32,590 25.6% Total Portfolio 3,576 $262 82% $213 $127,213 100.0% (1) Pro Forma TTM as of 3/31/2018 (2) Announced repositioning to Autograph Collection by Marriott Company Presentation // May 2018 (3) The company has recently agreed to sell the Renaissance Tampa 8 Note: TTM Hotel EBITDA in thousands

Recent Developments We are proud to announce that going forward the company will be known as Braemar Hotels & Resorts. • Reflects the new strategy announced by the company in January 2017 to focus exclusively on owning luxury hotels and resorts • "Braemar" pays homage to a stronghold in Scotland • The company's strategy is to position its portfolio in the defensive, as a guardian of capital for shareholders, with significant barriers to entry and a focus on high standards • The black and gold logo connotes luxury, while the imagery of the castle turret promotes strength and stability Company Presentation // May 2018 9

Recent Developments We recently agreed to sell the 293-room We recently completed the acquisition of Renaissance Tampa in Tampa, Florida for the 266-room Ritz-Carlton $68 million Sarasota in Sarasota, Florida for $171 million Meets Defined Strategy . Luxury Chain scale Segment TTM Cap Rate: 6% . Increases portfolio RevPAR by $5 . Replaces EBITDA . Attractive financial returns Stabilized Yield(2): 8% . No need to raise equity Property Financial Overview RevPAR(1): $284 . Hotel Net Operating Income of $10.2 million . 12.8x Hotel EBITDA multiple RENAISSANCE TAMPA . Hotel EBITDA $13.3 million IRR(3): 10% RevPAR(1): $158 Price per Key: $232,000 Meets Defined Strategy . Sale of non-core hotel increases overall portfolio RevPAR . Reduces the Company’s leverage and interest expense Property Financial Overview . Hotel Net Operating Income of $5.6 million . 8.2% TTM NOI Cap Rate . Hotel EBITDA $6.8 million RITZ-CARLTON SARASOTA (1) TTM RevPAR at time of announcement Company Presentation // May 2018 (2) Expected unlevered stabilized yield 10 (3) Underwritten unlevered IRR

EBITDA Contribution by Brand and Class Q1 2018 TTM Hotel EBITDA by Brand Q1 2018 TTM EBITDA by Class (3/31/2018)(1) Pro Forma (3/31/2018)(1) 4% 7% 19% 17% 49% 46% 23% 35% Marriott Hilton Independent Hyatt Accor Luxury Upper Upscale Upscale (1) Includes Ritz-Carlton Sarasota, excludes Renaissance Tampa Company Presentation // May 2018 11

Why We Focus on Luxury LUXURY UPPER UPSCALE Greatest long-term Second greatest long- RevPAR growth of term RevPAR growth of 4.0%(1) 3.1%(1) 350 300 250 200 150 RevPAR (Indexed) RevPAR 100 50 Jul-89 Jul-92 Jul-95 Jul-98 Jul-01 Jul-04 Jul-07 Jul-10 Jul-13 Jul-16 Apr-90 Apr-93 Apr-96 Apr-99 Apr-02 Apr-05 Apr-08 Apr-11 Apr-14 Apr-17 Jan-88 Jan-91 Jan-94 Jan-97 Jan-00 Jan-03 Jan-06 Jan-09 Jan-12 Jan-15 Jan-18 Oct-88 Oct-91 Oct-94 Oct-97 Oct-00 Oct-03 Oct-06 Oct-09 Oct-12 Oct-15 Luxury Class Upper Upscale Class Upscale Class Upper Midscale Class Midscale Class Economy Class (1) CAGR from December 1987 to March 2018 Company Presentation // May 2018 Source: STR 12

Long-Term Trading Premium(1) The top quartile of lodging REITs (by RevPAR) have consistently had higher quality assets and traded at a premium relative to other peers over PREMIUM EBITDA TRADING MULTIPLE a long-term 10 year period (TURNS) 25.0x 23.0x 21.0x 19.0x 17.0x 15.0x 13.0x 11.0x 9.0x 7.0x 5.0x 1/3/2006 1/3/2007 1/3/2008 1/3/2009 1/3/2010 1/3/2011 1/3/2012 1/3/2013 1/3/2014 1/3/2015 1/3/2016 1/3/2017 1/3/2018 Top Quartile Avg NTM EBITDA Multiple Peer Avg NTM EBITDA Multiple (1) Data is from 1/1/2006 to 3/31/2018 Company Presentation // May 2018 Source: STR, SNL 13 Top Quartile: BEE, PEB, LHO Peers: AHT, CLDT, CHSP, DRH, FCH, HT, HPT, HST, INN, RLJ, SHO

Asset Management Overview Senior Oversight 1 – Chief Operating Officer 8 – Asset managers 2 – Legal 1 – Director of Underwriting 2 – Revenue Optimization 1 – Analyst 1 – Analyst 4 – Capex specialists Acquisition Revenue Underwriting Optimization Risk Expense Management Control 3 – Risk & Insurance 1 – Property Tax specialist 1 – Analyst 1 – Analyst Company Presentation // May 2018 14

Past Operating Performance Relative to Peers • Braemar has outperformed its REIT peers each of the past 3 years (Braemar results in green or red; REIT averages in black) Hotel EBITDA Growth 2015 2016 2017 Q1 2018 8.5% 3.7% 0.2% 0.9% 8.3% 2.5% -2.3% -3.9% RevPAR Growth 2015 2016 2017 Q1 2018 7.3% 2.4% -2.5% -9.8% 4.2% 1.7% -0.2% -0.6% Note: Comparable Results. Peers include CHSP, PEB, DRH, LHO, and SHO. Company Presentation // May 2018 15

External Growth – Luxury Markets ~260,000 total luxury hotel rooms in U.S.(1) TOP 15 LUXURY MARKETS BY ROOMS(1) TOP 15 LUXURY MARKETS BY REVPAR(2) Market Hotels Rooms Market RevPAR Las Vegas 19 26,378 Hawaii $ 439 New York 80 18,573 New York, NY $ 369 Miami 47 12,458 Utah Area $ 369 Los Angeles 55 11,906 San Francisco/San Mateo, CA $ 315 Hawaii 27 8,376 Los Angeles/Long Beach, CA $ 314 Chicago 23 7,995 California Central Coast $ 301 San Francisco 41 7,989 Colorado Area $ 290 Denver/Mountain Resorts 66 7,712 Boston, MA $ 288 Washington DC 28 7,550 California North $ 281 San Diego 30 6,934 Orlando, FL $ 242 Orlando 8 5,422 Miami/Hialeah, FL $ 238 Phoenix 14 5,238 Washington, DC-MD-VA $ 224 New Orleans 23 4,828 Austin, TX $ 217 New Jersey 35 4,793 Seattle, WA $ 216 Atlanta 13 4,069 Denver, CO $ 201 (1) Based on information provided by STR for luxury class as of February 2018 Company Presentation // May 2018 (2) As of March 2018 16

Target Market Analysis(1) Market Size Fundamentals Pricing Desirability 60 50 40 30 20 10 0 Fundamentals Market Size Pricing Company Presentation // May 2018 17 (1) Based on internal analysis as of February, 2018
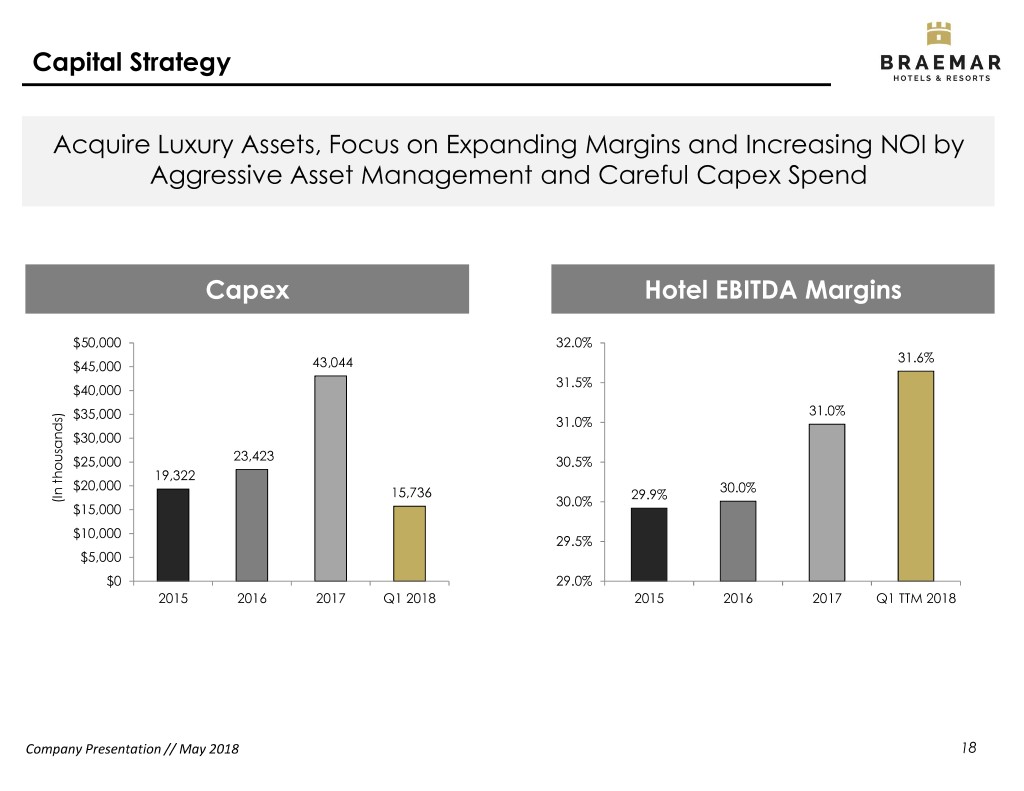
Capital Strategy Acquire Luxury Assets, Focus on Expanding Margins and Increasing NOI by Aggressive Asset Management and Careful Capex Spend Capex Hotel EBITDA Margins $50,000 32.0% 31.6% $45,000 43,044 31.5% $40,000 $35,000 31.0% 31.0% $30,000 $25,000 23,423 30.5% 19,322 $20,000 30.0% 15,736 29.9% (In thousands)(In 30.0% $15,000 $10,000 29.5% $5,000 $0 29.0% 2015 2016 2017 Q1 2018 2015 2016 2017 Q1 TTM 2018 Company Presentation // May 2018 18

Case Study – Pier House Resort • Braemar purchased the asset in early 2014 for $92.7 million • Remington had recently taken over property management & has a proven ability to deliver superior results • Initial yield on cost was 7.4%, current yield on cost is 11.1% 2016 Quarterly NOI and NOI Yield $12,000 12.0% 4.9% 170 206% $10,000 11.0% 10.0% $8,000 $2,242 $3,203 HOTEL EBITDA $2,157 HOTEL EBITDA FLOW- $2,020 9.0% RPI GROWTH MARGIN INCREASE $6,000 $1,317 $1,480 $999 THROUGH 8.0% (BPS) $1,116 $2,104 $2,185 $2,469 $4,000 $1,773 (In (In thousands) 7.0% 2017 $2,000 $2,854 $3,224 $3,385 $3,383 $3,570 6.0% $0 5.0% 2014 2015 2016 2017 Q1 2018 0.6% 362 469% Q1 Q2 Q3 Q4 NOI Yield* HOTEL EBITDA HOTEL EBITDA FLOW- RPI GROWTH MARGIN INCREASE THROUGH (BPS) 2018 Q1 -0.3% 218 357% HOTEL EBITDA HOTEL EBITDA FLOW- RPI GROWTH MARGIN INCREASE THROUGH (BPS) *NOI yield based on gross book value, Q1 2018 is based on TTM NOI Company Presentation // May 2018 Note: Includes $1.3 million of BI recoveries in Q4 2017 19

Case Study – Bardessono Hotel & Spa • Purchased for $85 million unencumbered by management. Installed Remington as property manager. • Initial TTM cap rate was 4.6%, current yield on cost is 7.1%* Despite California wildfire negative Quarterly NOI and NOI Yield impact in Q4, property continues to grow yield on cost $5,000 8.0% 7.0% $4,000 $1,238 $357 6.0% 2016 (First Full Year of Ownership) $3,000 $1,061 5.0% $1,915 $2,000 $1,692 4.0% 9.7% 518 242% $1,566 3.0% $1,000 (In (In thousands) $1,339 $1,369 HOTEL EBITDA MARGIN HOTEL EBITDA FLOW- $1,025 $882 2.0% REVPAR GROWTH THROUGH $0 INCREASE (BPS) ($438) $4 $93 1.0% ($1,000) 0.0% 2017 2015 2016 2017 Q1 2018 Q1 Q2 Q3 Q4 NOI Yield* -4.2% -147 52% HOTEL EBITDA MARGIN HOTEL EBITDA FLOW- REVPAR GROWTH INCREASE (BPS) THROUGH 2018 Q1 -4.4% 1,843 119% HOTEL EBITDA MARGIN HOTEL EBITDA FLOW- REVPAR GROWTH INCREASE (BPS) THROUGH *NOI yield based on gross book value, Q1 2018 is based on TTM NOI Company Presentation // May 2018 Note: Includes $1.0 million dollars of BI in Q1 2018 20

Conservative Capital Structure TARGET LEVERAGE OVERVIEW Floating-rate debt Non-recourse debt provides a natural lowers risk profile of hedge to hotel cash the platform flows Gross Assets Maximizes flexibility Long-standing lender in all economic relationships Net Debt environments Company Presentation // May 2018 21
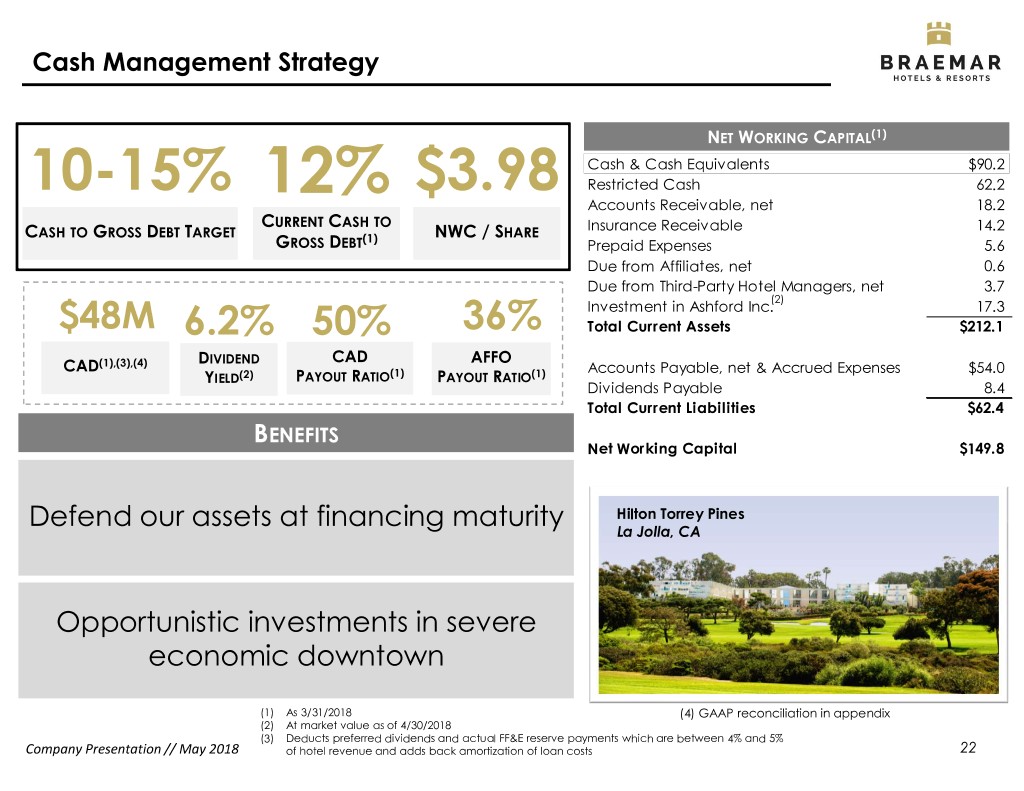
Cash Management Strategy NET WORKING CAPITAL(1) Cash & Cash Equivalents $90.2 10-15% 12% $3.98 Restricted Cash 62.2 Accounts Receivable, net 18.2 CURRENT CASH TO Insurance Receivable 14.2 CASH TO GROSS DEBT TARGET (1) NWC / SHARE GROSS DEBT Prepaid Expenses 5.6 Due from Affiliates, net 0.6 Due from Third-Party Hotel Managers, net 3.7 (2) Investment in Ashford Inc. 17.3 $48M 6.2% 50% 36% Total Current Assets $212.1 DIVIDEND CAD AFFO CAD(1),(3),(4) Accounts Payable, net & Accrued Expenses $54.0 YIELD(2) PAYOUT RATIO(1) PAYOUT RATIO(1) Dividends Payable 8.4 Total Current Liabilities $62.4 BENEFITS Net Working Capital $149.8 Defend our assets at financing maturity Hilton Torrey Pines La Jolla, CA Opportunistic investments in severe economic downtown (1) As 3/31/2018 (4) GAAP reconciliation in appendix (2) At market value as of 4/30/2018 (3) Deducts preferred dividends and actual FF&E reserve payments which are between 4% and 5% Company Presentation // May 2018 of hotel revenue and adds back amortization of loan costs 22

Debt Maturities Courtyard Philadelphia OVERVIEW(1) Philadelphia, PA 2019 2.2x 4.7% NEXT HARD DEBT FCCR WEIGHTED AVG. MATURITY INTEREST RATE Laddered debt maturities $300 $250 $200 $150 $277.6 (Inmillions) $100 $189.3 $158.5 $50 $112.0 $80.0 $0 2018 2019 2020 2021 2022 Thereafter Fixed-Rate Floating-Rate (1) As of 3/31/2018 23 Company Presentation // May 2018 Note: Excludes an $8.1 million TIF note maturing in 2018

Valuation Opportunity Valuation Opportunity 2017 Comparable RevPAR(1) 270 3.4 6.4 BHR $219 #1 Discount to Discount to Discount to PEB $207 #2 average peer average peer average peer trading cap trading EBITDA trading AFFO rate (bps) multiple (turns) multiple (turns) LHO $204 #3 Opportunity to capture significant CHSP $187 #4 valuation upside relative to peers and NAV DRH $184 #5 SHO $175 #6 TTM CAP RATE(2) TEV / 2018E EBITDA MULTIPLE(2),(3) PRICE / 2018E AFFO / SHARE MULTIPLE(2),(3) 10.0% 9.6% 16.0x 14.6x 9.5% 15.0x 14.5x 13.8x 13.9x 14.1x 9.0% 14.0x 12.8x 13.2x 14.0x 13.6x 12.4x 8.5% 13.1x 12.0x 8.0% 7.8% 13.0x 10.9x 7.5% 7.1% 7.0% 10.0x 6.9% 12.0x 11.6x 7.0% 6.4% 6.2% 6.5% 11.0x 8.0x 10.2x 6.4x 6.0% 6.0x 5.5% 10.0x 5.0% 9.0x 4.0x BHR DRH SHO LHO Peer CHSP PEB BHR DRH SHO Peer CHSP PEB LHO BHR DRH CHSP Peer PEB SHO LHO Avg Avg Avg Company Presentation // May 2018 (1) As reported by company earnings releases 24 (2) Balance sheet data as of 12/31/2017; stock price as of 4/30/2018 (3) Based on consensus estimates

Intrinsic Value(1),(2) Current Equity Implied Equity Implied Equity Valuation Market Cap(3) Market Cap(4) Value Upside Disconnect $392M $709M $317M BRAEMAR PORTFOLIO $814 (In millions $) Low-End High-End 81% Increase $709 TTM NOI(5) $101.8 $101.8 $605 Cap Rate(6) 7.5% 6.5% Implied Value 1,357 $1,566 $392 NWC(7),(8) $150 $150 Preferred Equity(7) ($124) ($124) Debt(7) ($778) ($778) Current Market Low End - Avg - Implied High End - Cap Implied Equity Equity Market Implied Equity Implied Equity Mkt Cap $605-- $814 Market Cap Cap Market Cap (1) See valuation methodology disclaimer (5) See GAAP reconciliation in appendix (2) Excludes termination fee (6) Based on current implied cap rates of publicly traded peers Company Presentation // May 2018 (3) As of 4/30/2018 (7) As of 3/31/2018; Adjusted for Hilton JV 25 (4) Based on average of estimated cap rates (8) Investment in Inc. at market value as of 4/30/2018
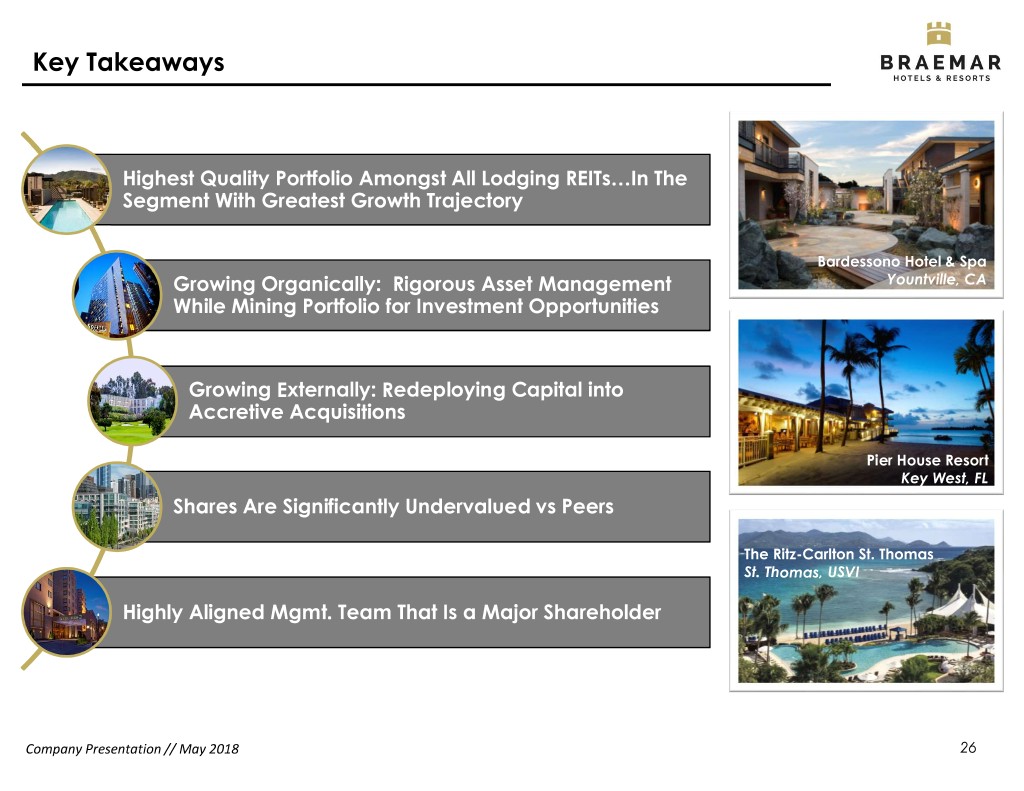
Key Takeaways Highest Quality Portfolio Amongst All Lodging REITs…In The Segment With Greatest Growth Trajectory Bardessono Hotel & Spa Growing Organically: Rigorous Asset Management Yountville, CA While Mining Portfolio for Investment Opportunities Growing Externally: Redeploying Capital into Accretive Acquisitions Pier House Resort Key West, FL Shares Are Significantly Undervalued vs Peers The Ritz-Carlton St. Thomas St. Thomas, USVI Highly Aligned Mgmt. Team That Is a Major Shareholder Company Presentation // May 2018 26

Appendix

Reconciliation of Net Income (Loss) to Hotel NOI Three Months Ended Three Months Ended Three Months Ended Three Months Ended TTM Ended March 31, 2018 December 31, 2017 September 30, 2017 June 30, 2017 March 31, 2018 Net income (loss)$ 16,761 $ 35,206 $ 10,705 $ 21,607 $ 84,279 Non-property adjustments 12 (23,720) 1,008 - (22,700) Interest income (18) (13) (18) (10) (59) Interest expense 3,123 2,986 2,744 2,204 11,057 Amortization of loan cost 199 310 307 271 1,087 Depreciation and amortization 13,006 12,705 14,134 13,468 53,313 Income tax expense (benefit) 154 (607) (404) 366 (491) Non-hotel EBITDA ownership expense 368 1,301 4,554 465 6,688 Hotel EBITDA including amounts attributable to noncontrolling interest 33,605 28,168 33,030 38,371 133,174 Less: EBITDA adjustments attributable to consolidated noncontrolling interest (1,990) (1,620) (1,618) (2,642) (7,870) Hotel EBITDA attributable to the Company and OP unitholders $ 31,615 $ 26,548 $ 31,412 $ 35,729 $ 125,304 Non-comparable adjustments - (1,126) (2,385) (2,450) (5,961) Comparable hotel EBITDA$ 33,605 $ 27,042 $ 30,645 $ 35,921 $ 127,213 FFE reserve$ (4,748) $ (4,251) $ (4,738) $ (5,132) (18,869) Comparable net operating income$ 28,857 $ 22,791 $ 25,907 $ 30,789 $ 108,344 NOI adjustments attributable to noncontrolling interests (1,658) (1,332) (1,311) (2,284) (6,585) NOI attributable to the Company and OP unitholders $ 27,199 $ 21,459 $ 24,596 $ 28,505 $ 101,759 Company Presentation // May 2018 28

Reconciliation of Net Income (Loss) to Cash Available for Distribution Three Months Ended Three Months Ended Three Months Ended Three Months Ended TTM Ended March 31, 2018 December 31, 2017 September 30, 2017 June 30, 2017 March 31, 2018 Net income (loss) $ 4,270 $ 28,444 $ (217) $ 386 $ 32,883 (Income) loss from consolidated entities attributable to noncontrolling interest 42 (528) (1,143) (1,614) (3,243) Net (income) loss attributable to redeemable noncontrolling interests in operating partnership (292) (2,996) 360 343 (2,585) Preferred dividends (1,707) (1,708) (1,707) (1,707) (6,829) Net income (loss) attributable to common stockholders 2,313 23,212 (2,707) (2,592) 20,226 Depreciation and amortization on real estate 12,258 11,952 13,406 12,752 50,368 Impairment charges on real estate 12 60 1,008 - 1,080 Net income (loss) attributable to redeemable noncontrolling interests in operating partnership 292 2,996 (360) (343) 2,585 Gain on sale of hotel property - (23,797) - - (23,797) Equity in (earnings) loss of unconsolidated entities 3 - - - 3 Company's portion of FFO of OpenKey (2) - - - (2) FFO available to common stockholders and OP unitholders 14,876 14,423 11,347 9,817 50,463 Preferred dividends 1,707 1,708 1,707 1,707 6,829 Transaction and management conversion costs 503 74 260 2,112 2,949 Other (income) expense 63 85 22 113 283 Write-off of loan costs and exit fees 2 1,531 380 - 1,913 Unrealized (gain) loss on investments (528) (6,314) (1,875) 1,563 (7,154) Unrealized (gain) loss on derivatives (73) 524 531 100 1,082 Non-cash stock/unit-based compensation 2,593 665 (921) 597 2,934 Legal, advisory and settlement costs (1,141) 203 560 3 (375) Contract modification cost - - - 5,000 5,000 Software implementation costs - - - 79 79 Uninsured hurricane and wildfire related costs 467 248 3,573 - 4,288 Tax reform - (161) - - (161) Adjusted FFO available to the Company and OP unitholders $ 18,469 $ 12,986 $ 15,584 $ 21,091 $ 68,130 FFE reserve (net of noncontrolling interest) (4,415) (4,110) (4,775) (5,219) (18,519) Preferred dividends (1,707) (1,708) (1,707) (1,707) (6,829) Amortization of loan costs 988 1,149 1,356 1,349 4,842 Cash available for distribution to the Company and OP unitholders 13,335 8,317 10,458 15,514 47,624 Company Presentation // May 2018 29
