Attached files
| file | filename |
|---|---|
| EX-32.2 - EXHIBIT 32.2 - RALPH LAUREN CORP | rl-20180331x10kex322.htm |
| EX-32.1 - EXHIBIT 32.1 - RALPH LAUREN CORP | rl-20180331x10kex321.htm |
| EX-31.2 - EXHIBIT 31.2 - RALPH LAUREN CORP | rl-20180331x10kex312.htm |
| EX-31.1 - EXHIBIT 31.1 - RALPH LAUREN CORP | rl-20180331x10kex311.htm |
| EX-23.1 - EXHIBIT 23.1 - RALPH LAUREN CORP | rl-20180331x10kex231.htm |
| EX-21.1 - EXHIBIT 21.1 - RALPH LAUREN CORP | rl-20180331x10kex211.htm |
| EX-12.1 - EXHIBIT 12.1 - RALPH LAUREN CORP | rl-20180331x10kex121.htm |
UNITED STATES
SECURITIES AND EXCHANGE COMMISSION
Washington, D.C. 20549
Form 10-K
(Mark One)
þ | ANNUAL REPORT PURSUANT TO SECTION 13 OR 15(d) OF THE SECURITIES EXCHANGE ACT OF 1934 |
For the fiscal year ended March 31, 2018 | |
or
o | TRANSITION REPORT PURSUANT TO SECTION 13 OR 15(d) OF THE SECURITIES EXCHANGE ACT OF 1934 |
Commission File Number: 001-13057
RALPH LAUREN CORPORATION
(Exact name of registrant as specified in its charter)
Delaware | 13-2622036 | |
(State or other jurisdiction of incorporation or organization) | (I.R.S. Employer Identification No.) | |
650 Madison Avenue, New York, New York | 10022 | |
(Address of principal executive offices) | (Zip Code) | |
(212) 318-7000
(Registrant's telephone number, including area code)
Securities registered pursuant to Section 12(b) of the Act:
Title of Each Class | Name of Each Exchange on Which Registered | |
Class A Common Stock, $.01 par value | New York Stock Exchange | |
Securities registered pursuant to Section 12(g) of the Act: None
Indicate by check mark if the registrant is a well-known seasoned issuer, as defined in Rule 405 of the Securities Act. | Yes þ No o | |
Indicate by check mark if the registrant is not required to file reports pursuant to Section 13 or 15(d) of the Act. | Yes o No þ | |
Indicate by check mark whether the registrant (1) has filed all reports required to be filed by Section 13 or 15(d) of the Securities Exchange Act of 1934 during the preceding 12 months (or for such shorter period that the registrant was required to file such reports), and (2) has been subject to such filing requirements for the past 90 days. | Yes þ No o | |
Indicate by check mark whether the registrant has submitted electronically and posted on its corporate Web site, if any, every Interactive Data File required to be submitted and posted pursuant to Rule 405 of Regulation S-T (§232.405 of this chapter) during the preceding 12 months (or for such shorter period that the registrant was required to submit and post such files). | Yes þ No o | |
Indicate by check mark if disclosure of delinquent filers pursuant to Item 405 of Regulation S-K (§229.405 of this chapter) is not contained herein, and will not be contained, to the best of registrant's knowledge, in definitive proxy or information statements incorporated by reference in Part III of this Form 10-K or any amendment to this Form 10-K. | o | |
Indicate by check mark whether the registrant is a large accelerated filer, an accelerated filer, a non-accelerated filer, a smaller reporting company, or an emerging growth company. See the definitions of "large accelerated filer," "accelerated filer," "smaller reporting company," and "emerging growth company" in Rule 12b-2 of the Exchange Act. | ||
Large accelerated filer þ | Accelerated filer o | |
Non-accelerated filer o (Do not check if a smaller reporting company) | Smaller reporting company o | |
Emerging growth company o | ||
If an emerging growth company, indicate by check mark if the registrant has elected not to use the extended transition period for complying with any new or revised financial accounting standards provided pursuant to Section 13(a) of the Exchange Act. | o | |
Indicate by check mark whether the registrant is a shell company (as defined in Rule 12b-2 of the Act). | Yes o No þ | |
The aggregate market value of the registrant's voting common stock held by non-affiliates of the registrant was $4,868,476,408 as of September 29, 2017, the last business day of the registrant's most recently completed second fiscal quarter based on the closing price of the common stock on the New York Stock Exchange. | ||
At May 18, 2018, 55,673,351 shares of the registrant's Class A common stock, $.01 par value and 25,881,276 shares of the registrant's Class B common stock, $.01 par value were outstanding. | ||
Part III incorporates information from certain portions of the registrant's definitive proxy statement to be filed with the Securities and Exchange Commission within 120 days after the fiscal year ended March 31, 2018. | ||
SPECIAL NOTE REGARDING FORWARD-LOOKING STATEMENTS
Various statements in this Form 10-K or incorporated by reference into this Form 10-K, in future filings by us with the Securities and Exchange Commission (the "SEC"), in our press releases, and in oral statements made from time to time by us or on our behalf constitute "forward-looking statements" within the meaning of the Private Securities Litigation Reform Act of 1995. Forward-looking statements are based on current expectations and are indicated by words or phrases such as "anticipate," "estimate," "expect," "project," "we believe," "is or remains optimistic," "currently envisions," and similar words or phrases and involve known and unknown risks, uncertainties, and other factors which may cause actual results, performance, or achievements to be materially different from the future results, performance, or achievements expressed in or implied by such forward-looking statements. These risks, uncertainties, and other factors include, among others:
• | the loss of key personnel, including Mr. Ralph Lauren, or other changes in our executive and senior management team or to our operating structure, and our ability to effectively transfer knowledge during periods of transition; |
• | our ability to successfully implement our long-term growth strategy and achieve anticipated operating enhancements and cost reductions from our restructuring plans; |
• | the impact to our business resulting from investments and other costs incurred in connection with the execution of our long-term growth strategy, including restructuring-related charges, which may be dilutive to our earnings in the short term; |
• | our ability to continue to expand or grow our business internationally and the impact of related changes in our customer, channel, and geographic sales mix as a result; |
• | our ability to open new retail stores, concession shops, and digital commerce sites in an effort to expand our direct-to-consumer presence; |
• | the impact to our business resulting from changes in consumers' ability, willingness, or preferences to purchase premium lifestyle products that we offer for sale and our ability to forecast consumer demand, which could result in either a build-up or shortage of inventory; |
• | our ability to continue to maintain our brand image and reputation and protect our trademarks; |
• | our ability to effectively manage inventory levels and the increasing pressure on our margins in a highly promotional retail environment; |
• | the impact to our business resulting from potential costs and obligations related to the early closure of our stores or termination of our long-term, non-cancellable leases; |
• | the impact of economic, political, and other conditions on us, our customers, suppliers, vendors, and lenders; |
• | our ability to secure our facilities and systems and those of our third-party service providers from, among other things, cybersecurity breaches, acts of vandalism, computer viruses, or similar Internet or email events; |
• | our efforts to successfully enhance, upgrade, and/or transition our global information technology systems and digital commerce platform; |
• | a variety of legal, regulatory, tax, political, and economic risks, including risks related to the importation and exportation of products, tariffs, and other trade barriers which our operations are currently subject to, or may become subject to as a result of potential changes in legislation, and other risks associated with our international operations, such as compliance with the Foreign Corrupt Practices Act or violations of other anti-bribery and corruption laws prohibiting improper payments, and the burdens of complying with a variety of foreign laws and regulations, including tax laws, trade and labor restrictions, and related laws that may reduce the flexibility of our business; |
• | changes in our tax obligations and effective tax rate due to a variety of other factors, including potential additional changes in U.S. or foreign tax laws and regulations, accounting rules, or the mix and level of earnings by jurisdiction in future periods that are not currently known or anticipated; |
• | the impact to our business resulting from the recently enacted U.S. tax legislation commonly referred to as the Tax Cuts and Jobs Act, including related changes to our tax obligations and effective tax rate in future periods, as well as the enactment-related charges that were recorded during Fiscal 2018 on a provisional basis based on a reasonable |
2 | ||
estimate and are subject to change, all of which could differ materially from our current expectations and/or investors' expectations;
• | the impact to our business resulting from the United Kingdom's decision to exit the European Union and the uncertainty surrounding the terms and conditions of such a withdrawal, as well as the related impact to global stock markets and currency exchange rates; |
• | the impact to our business resulting from increases in the costs of raw materials, transportation, and labor; |
• | our exposure to currency exchange rate fluctuations from both a transactional and translational perspective; |
• | the potential impact to our business resulting from the financial difficulties of certain of our large wholesale customers, which may result in consolidations, liquidations, restructurings, and other ownership changes in the retail industry, as well as other changes in the competitive marketplace, including the introduction of new products or pricing changes by our competitors; |
• | the potential impact on our operations and on our suppliers and customers resulting from natural or man-made disasters; |
• | the impact to our business of events of unrest and instability that are currently taking place in certain parts of the world, as well as from any terrorist action, retaliation, and the threat of further action or retaliation; |
• | our ability to maintain our credit profile and ratings within the financial community; |
• | our ability to access sources of liquidity to provide for our cash needs, including our debt obligations, tax obligations, payment of dividends, capital expenditures, and potential repurchases of our Class A common stock, as well as the ability of our customers, suppliers, vendors, and lenders to access sources of liquidity to provide for their own cash needs; |
• | the potential impact to the trading prices of our securities if our Class A common stock share repurchase activity and/or cash dividend payments differ from investors' expectations; |
• | our intention to introduce new products or enter into or renew alliances; |
• | changes in the business of, and our relationships with, major department store customers and licensing partners; and |
• | our ability to make certain strategic acquisitions and successfully integrate the acquired businesses into our existing operations. |
These forward-looking statements are based largely on our expectations and judgments and are subject to a number of risks and uncertainties, many of which are unforeseeable and beyond our control. A detailed discussion of significant risk factors that have the potential to cause our actual results to differ materially from our expectations is described in Part I of this Form 10-K under the heading of "Risk Factors." We undertake no obligation to publicly update or revise any forward-looking statements, whether as a result of new information, future events, or otherwise.
WEBSITE ACCESS TO COMPANY REPORTS AND OTHER INFORMATION
Our investor website is http://investor.ralphlauren.com. We were incorporated in June 1997 under the laws of the State of Delaware. Our Annual Reports on Form 10-K, Quarterly Reports on Form 10-Q, Current Reports on Form 8-K, and amendments to those reports filed with or furnished to the SEC pursuant to Section 13(a) or Section 15(d) of the Securities Exchange Act of 1934 are available at our investor website under the caption "SEC Filings" promptly after we electronically file such materials with or furnish such materials to the SEC. Information relating to corporate governance at Ralph Lauren Corporation, including our Corporate Governance Policies, our Code of Business Conduct and Ethics for all directors, officers, and employees, our Code of Ethics for Principal Executive Officers and Senior Financial Officers, and information concerning our directors, Committees of the Board of Directors, including Committee charters, and transactions involving Ralph Lauren Corporation securities by directors and executive officers are available at our website under the captions "Corporate Governance" and "SEC Filings." Paper copies of these filings and corporate governance documents are available to stockholders without charge by written request to Investor Relations, Ralph Lauren Corporation, 625 Madison Avenue, New York, New York 10022.
3 | ||
In this Form 10-K, references to "Ralph Lauren," "ourselves," "we," "our," "us," and the "Company" refer to Ralph Lauren Corporation and its subsidiaries, unless the context indicates otherwise. Due to the collaborative and ongoing nature of our relationships with our licensees, such licensees are sometimes referred to in this Form 10-K as "licensing alliances." Our fiscal year ends on the Saturday closest to March 31. All references to "Fiscal 2019" represent the 52-week fiscal year ending March 30, 2019. All references to "Fiscal 2018" represent the 52-week fiscal year ended March 31, 2018. All references to "Fiscal 2017" represent the 52-week fiscal year ended April 1, 2017. All references to "Fiscal 2016" represent the 53-week fiscal year ended April 2, 2016.
PART I
Item 1. | Business. |
General
Founded in 1967 by Mr. Ralph Lauren, we are a global leader in the design, marketing, and distribution of premium lifestyle products, including apparel, accessories, home furnishings, and other licensed product categories. Our long-standing reputation and distinctive image have been developed across an expanding number of products, brands, sales channels, and international markets. We believe that our global reach, breadth of product offerings, and multi-channel distribution are unique among luxury and apparel companies.
We diversify our business by geography (North America, Europe, and Asia, among other regions) and channels of distribution (wholesale, retail, and licensing). This allows us to maintain a dynamic balance as our operating results do not depend solely on the performance of any single geographic area or channel of distribution. Our wholesale sales are made principally to major department stores and specialty stores around the world. We also sell directly to consumers through our integrated retail channel, which includes our retail stores, concession-based shop-within-shops, and digital commerce operations around the world. In addition, we license to unrelated third parties for specified periods the right to operate retail stores and/or to use our various trademarks in connection with the manufacture and sale of designated products, such as certain apparel, eyewear, fragrances, and home furnishings.
We organize our business into the following three reportable segments: North America, Europe, and Asia. In addition to these reportable segments, we also have other non-reportable segments. See "Our Segments" for further discussion of our segment reporting structure.
Our global reach is extensive, with merchandise available through our wholesale distribution channels at over 12,000 doors worldwide, the majority in specialty stores, as well as through the digital commerce sites of many of our wholesale customers. We also sell directly to customers throughout the world via our 472 retail stores and 632 concession-based shop-within-shops, as well as through our own digital commerce sites and those of various third-party digital partners. In addition to our directly-operated stores and shops, our international licensing partners operate 88 Ralph Lauren stores, 54 Ralph Lauren concession shops, and 136 Club Monaco stores and shops.
We continue to invest in our business. Over the past five fiscal years, we have invested approximately $1.723 billion for capital improvements, acquisitions, and ventures, primarily funded through strong operating cash flow. We also continue to return value to our shareholders through our common stock share repurchases and payment of quarterly cash dividends. Over the past five fiscal years, the cost of shares of Class A common stock repurchased pursuant to our common stock repurchase program was approximately $1.727 billion and dividends paid amounted to approximately $805 million.
We have been controlled by the Lauren family since the founding of our Company. As of March 31, 2018, Mr. R. Lauren, or entities controlled by the Lauren family, held approximately 82% of the voting power of the Company's outstanding common stock.
4 | ||
Objectives and Opportunities
We believe that our size and the global scope of our operations provide us with design, sourcing, and distribution synergies across our different businesses. Our core strengths include a portfolio of global premium lifestyle brands, a well-diversified global multi-channel distribution network, an investment philosophy supported by a strong balance sheet, and an experienced management team. Despite the various risks and uncertainties associated with the current global economic environment, as discussed further in Item 7 — "Management's Discussion and Analysis of Financial Condition and Results of Operations — Global Economic Conditions and Industry Trends," we believe our core strengths will allow us to execute our long-term growth strategy.
We have developed a long-term growth strategy with the objective of delivering sustainable, profitable growth and long-term value creation for shareholders. Our strategy includes the following key strategic initiatives:
• | Elevating our brand through improved quality of sales, distribution, and product; |
• | Evolving product, marketing, and shopping experience to increase reach and appeal with new consumers; |
• | Expanding our digital and international presence; and |
• | Working in new ways to drive productivity and agility. |
Recent Developments
U.S. Tax Reform
On December 22, 2017, President Trump signed into law new tax legislation commonly referred to as the Tax Cuts and Jobs Act (the "TCJA"), which became effective January 1, 2018. The TCJA significantly revised U.S. tax law by, among other provisions, lowering the U.S. federal statutory income tax rate from 35% to 21%, creating a territorial tax system that includes a one-time mandatory transition tax on previously deferred foreign earnings, and eliminating or reducing certain income tax deductions.
During Fiscal 2018, we recorded net charges of $221.4 million within our income tax provision in connection with the TCJA, of which $209.3 million related to the mandatory transition tax, which we expect to pay over an eight-year period. These charges, which were recorded on a provisional basis as permitted by SEC Staff Accounting Bulletin No. 118 ("SAB 118"), negatively impacted our effective tax rate by 4,520 basis points and lowered our diluted earnings per share by $2.68 during Fiscal 2018. The provisional amounts were based on our present interpretations of the TCJA, current available information, and assumptions about future events, and are subject to further refinement as additional information becomes available and further analyses are completed.
Despite these enactment-related charges, we expect the TCJA will ultimately benefit our results of operations and financial condition in future periods, primarily due to the lower U.S. federal statutory income tax rate.
Additionally, we reevaluated our permanent reinvestment assertion and determined that undistributed foreign earnings that were subject to the one-time mandatory transition tax were no longer considered to be permanently reinvested, effective December 31, 2017. In connection with this decision, we repatriated $252.0 million of cash to the U.S. from certain of our foreign subsidiaries during the fourth quarter of Fiscal 2018, and we repatriated an additional $400.0 million during the first quarter of Fiscal 2019.
See Note 10 to the accompanying consolidated financial statements for additional discussion regarding the TCJA.
Change in Chief Executive Officer
Effective May 2017, Mr. Stefan Larsson departed as the Company's President and Chief Executive Officer and as a member of our Board of Directors. In connection with Mr. Larsson's departure, we recorded cumulative other charges of $17.0 million, of which $5.6 million and $11.4 million were recorded during Fiscal 2018 and Fiscal 2017, respectively. We do not expect to incur additional charges related to Mr. Larsson's departure. See Note 9 to our accompanying consolidated financial statements for further discussion of the charges recorded in connection with Mr. Larsson's departure.
Subsequent to Mr. Larsson's departure, Mr. Patrice Louvet was appointed as the Company's new President and Chief Executive Officer and as a member of our Board of Directors, effective July 2017.
5 | ||
Way Forward Plan
On June 2, 2016, our Board of Directors approved a restructuring plan with the objective of delivering sustainable, profitable sales growth and long-term value creation for shareholders (the "Way Forward Plan"). We are refocusing on our core brands and evolving our product, marketing, and shopping experience to increase desirability and relevance. We are also evolving our operating model to enable sustainable, profitable sales growth by significantly improving quality of sales, reducing supply chain lead times, improving our sourcing, and executing a disciplined multi-channel distribution and expansion strategy. As part of the Way Forward Plan, we are rightsizing our cost structure and implementing a return on investment-driven financial model to free up resources to invest in the brand and drive high-quality sales. The Way Forward Plan includes strengthening our leadership team and creating a more nimble organization by moving from an average of nine to six layers of management. The Way Forward Plan also includes the discontinuance of our Denim & Supply brand and the integration of our denim product offerings into our Polo Ralph Lauren brand. Collectively, these actions, which were substantially completed during Fiscal 2017, resulted in a reduction in workforce and the closure of certain stores and shop-within-shops, as well as gross annualized expense savings of approximately $200 million.
On March 30, 2017, our Board of Directors approved the following additional restructuring-related activities associated with the Way Forward Plan: (i) the restructuring of our in-house global digital commerce platform which was in development and shifting to a more cost-effective, flexible platform through a new agreement with Salesforce's Commerce Cloud, formerly known as Demandware; (ii) the closure of our Polo store at 711 Fifth Avenue in New York City; and (iii) the further streamlining of the organization and the execution of other key corporate actions in line with the Way Forward Plan. These actions, which are expected to result in additional expense savings of approximately $140 million, are an important part of our efforts to achieve our stated objective to return to sustainable, profitable growth and invest in the future. These additional restructuring-related activities were largely completed during Fiscal 2018 and resulted in a further reduction in workforce and the closure of certain corporate office and store locations. The remaining activities, which are primarily lease-related, are expected to be completed during Fiscal 2019.
In connection with the Way Forward Plan, we currently expect to incur total estimated charges of approximately $770 million, comprised of cash-related restructuring charges of approximately $450 million and non-cash charges of approximately $320 million. Cumulative charges incurred since inception were $669.2 million, of which $102.8 million and $566.4 million were incurred during Fiscal 2018 and Fiscal 2017, respectively, and we expect to incur the remaining charges of approximately $100 million during Fiscal 2019. In addition to these charges, we also incurred an additional non-cash charge of $155.2 million during Fiscal 2017 associated with the destruction of inventory out of current liquidation channels in line with our Way Forward Plan. See Notes 8 and 9 to our accompanying consolidated financial statements for detailed discussions of the charges recorded in connection with the Way Forward Plan.
Our Brands and Products
Our products, which include apparel, accessories, and fragrance collections for men and women, as well as childrenswear and home furnishings, comprise one of the most widely recognized families of consumer brands. Reflecting a distinctive American perspective, we have been an innovator in aspirational lifestyle branding and believe that, under the direction of internationally renowned designer Mr. Ralph Lauren, we have had a considerable influence on the way people dress and the way that fashion is advertised throughout the world.
We combine consumer insight with our design, marketing, and imaging skills to offer, along with our licensing alliances, broad lifestyle product collections with a unified vision:
• | Apparel — Our apparel products include extensive collections of men's, women's, and children's clothing, which are sold under various brand names, including Ralph Lauren Collection, Ralph Lauren Purple Label, Polo Ralph Lauren, Double RL, Lauren Ralph Lauren, Polo Golf Ralph Lauren, Ralph Lauren Golf, RLX Ralph Lauren, Polo Ralph Lauren Children, Chaps, and Club Monaco, among others; |
• | Accessories — Our range of accessories encompasses men's, women's, and children's, including footwear, eyewear, watches, fashion and fine jewelry, scarves, hats, gloves, umbrellas, and leather goods, including handbags, luggage, small leather goods, and belts, which are sold under the Ralph Lauren Collection, Ralph Lauren Purple Label, Double RL, Polo Ralph Lauren, Lauren Ralph Lauren, Polo Ralph Lauren Children, Chaps, and Club Monaco; |
• | Home — Our coordinated home products include bedding and bath products, furniture, fabric and wallpaper, lighting, tabletop, floorcovering, and giftware; |
6 | ||
• | Fragrance — Our fragrance offerings capture the essence of Ralph Lauren's men's and women's brands with numerous labels, designed to appeal to a variety of audiences. Women's fragrance products are sold under our Ralph Lauren Collection, Woman by Ralph Lauren, Romance Collection, Ralph Collection, and Big Pony Women's brands. Men's fragrance products are sold under our Polo Blue, Safari, Purple Label, Polo Red, Polo Green, Polo Black, Polo Supreme, Polo Sport, and Big Pony Men's brands; and |
• | Restaurants — Our restaurants translate Ralph Lauren's distinctive vision into places to gather with family and friends to enjoy fine food. Our restaurant concepts include The Polo Bar in New York City, RL Restaurant located in Chicago, Ralph's located in Paris, and our Ralph's Coffee concept, with locations in London and Hong Kong. |
Our lifestyle brand image is reinforced by our distribution through our stores and concession-based shop-within-shops, our wholesale channels of distribution, our global digital commerce sites, and our Ralph Lauren restaurants. We sell our products under the following key brand platforms:
1. | Ralph Lauren Luxury — Our Luxury group includes: |
Ralph Lauren Collection and Ralph Lauren Purple Label. The runway sets the stage for each season's Ralph Lauren Collection designs, which includes handmade evening gowns with exquisite detail and refined, hand-tailored suitings. For men, Ralph Lauren Purple Label offers refined suitings, custom tailored made-to-measure suits, and sophisticated sportswear, as well as benchmade footwear and made-to-order dress furnishings, accessories, and luggage. Ralph Lauren Collection and Ralph Lauren Purple Label are available in Ralph Lauren stores around the world, an exclusive selection of the finest specialty stores, and online at our Ralph Lauren digital commerce sites, including RalphLauren.com.
Double RL. Founded in 1993 and named after Ralph Lauren and his wife Ricky's "RRL" ranch in Colorado, Double RL offers a mix of selvedge denim, vintage apparel, sportswear, and accessories, with roots in workwear and military gear. Double RL is available at Double RL stores, at select Ralph Lauren stores, and an exclusive selection of the finest specialty stores around the world, as well as online at our Ralph Lauren digital commerce sites, including RalphLauren.com.
Ralph Lauren Home. Ralph Lauren Home presents home furnishings and accessories that reflect the style and craftsmanship synonymous with the name Ralph Lauren. Ralph Lauren Home includes furniture, bed and bath linens, china, crystal, silver, decorative accessories and gifts, as well as lighting, fabric, wallcovering, and floorcovering. Ralph Lauren Home offers exclusive luxury goods at select Ralph Lauren stores, home specialty stores, trade showrooms, and online at our Ralph Lauren digital commerce sites, including RalphLauren.com. The complete world of Ralph Lauren Home can be explored online at RalphLaurenHome.com.
Ralph Lauren Watches and Fine Jewelry. We offer a premier collection of timepieces, which embody Ralph Lauren's passion for impeccable quality and exquisite design. We also offer premium collections of fine jewelry, which capture the glamour and craftsmanship of Ralph Lauren's most luxurious designs. Ralph Lauren watches and fine jewelry are available at select Ralph Lauren stores and flagship locations around the world. A selection of watches is also available online at RalphLauren.com and the finest watch retailers.
2. | Polo Ralph Lauren — The Polo Ralph Lauren group includes: |
Polo Ralph Lauren. Men's Polo combines Ivy League classics and time-honored English haberdashery with downtown styles and all-American sporting looks in sportswear and tailored clothing. Women's Polo represents the epitome of classic and iconic American style with a modern and cool twist. Polo's signature aesthetic includes our renowned polo player logo. Men's and Women's Polo apparel and accessories are available in Polo and Ralph Lauren stores around the world, better department and specialty stores, and online at our Ralph Lauren digital commerce sites, including RalphLauren.com.
Polo Ralph Lauren Children. Polo Ralph Lauren Children is designed to reflect the timeless heritage and modern spirit of Ralph Lauren's collections for men and women. Signature classics include iconic polo knit shirts and luxurious cashmere cable-knit sweaters. Polo Ralph Lauren Children is available in a full range of sizes, from baby to girls 2-16 and boys 2-20. Polo Ralph Lauren Children can be found in select Polo and Ralph Lauren stores around the world, better department stores, and online at our Ralph Lauren digital commerce sites, including RalphLauren.com, as well as certain of our retailer partner digital commerce sites.
7 | ||
Polo Golf Ralph Lauren, Ralph Lauren Golf, and RLX Ralph Lauren. Tested and worn by top-ranked professional golfers, Polo Golf Ralph Lauren, Ralph Lauren Golf, and RLX Ralph Lauren for men and women define excellence in the world of golf. With a sharpened focus on the needs of the modern player but rooted in the rich design tradition of Ralph Lauren, the Golf collections combine state-of-the-art performance wear with luxurious finishing touches. The Polo and RLX Golf collections are available in select Polo stores, exclusive private clubs and resorts, and online at RalphLauren.com.
Pink Pony. Established in 2000, the Pink Pony campaign is our worldwide initiative in the fight against cancer. In the U.S., a percentage of sales from Pink Pony products benefit the Pink Pony Fund of The Polo Ralph Lauren Foundation, which supports programs for early diagnosis, education, treatment, and research, and is dedicated to bringing patient navigation and quality cancer care to medically underserved communities. Internationally, a network of local cancer charities around the world benefit from the sale of Pink Pony products. Pink Pony consists of dual gender sportswear and accessories. Pink Pony items feature our iconic pink polo player – a symbol of our commitment to the fight against cancer. Pink Pony is available at select Polo and Ralph Lauren stores and online at our Ralph Lauren digital commerce sites, including RalphLauren.com. Pink Pony is also available at select Macy's stores and online at Macys.com.
3. | Lauren Ralph Lauren — Our Lauren group includes: |
Lauren Ralph Lauren. Lauren for women combines timeless style with modern femininity in a lifestyle collection of sportswear, denim, and dresses, as well as accessories and footwear at a more accessible price point. Lauren for women is available in select department stores around the world and on-line at select digital commerce sites, including RalphLauren.com. Lauren for men offers a complete collection of men's tailored clothing, including suits, sport coats, dress shirts, dress pants, tuxedos, topcoats, and ties at a more accessible price point. Lauren for men is available at select department stores in North America and Europe.
Lauren Home. Launched in 2017, the Lauren Home collection includes accessibly-priced, timeless bath and bedding designs, updated with a fresh, modern spirit. The collection is built upon an assortment of essentials that is designed to be periodically augmented with trend-relevant colors and patterns.
4. | Chaps — Launched in 1978 and celebrating its 40th anniversary, Chaps presents a vision of timeless, all-American style for men, women, children and home. The complete lifestyle collection offers casual sportswear, workday essentials, tailored clothing, and occasion dresses. Chaps effortless and spirited style is available in over 2,000 doors across the U.S., Canada, Mexico, and China. |
5. | Club Monaco — Founded in 1985, Club Monaco is a celebration of the individual. It designs and markets its own clothing and accessories for a new generation of women and men who value versatile, thoughtful design that can take them through every moment of life. Club Monaco apparel and accessories are available at Club Monaco stores and select department stores in North America and around the world, as well as online at ClubMonaco.com and ClubMonaco.ca. |
Our Segments
We organize our business into the following three reportable segments:
• | North America — Our North America segment, representing approximately 52% of our Fiscal 2018 net revenues, primarily consists of sales of our Ralph Lauren branded products made through our wholesale and retail businesses in the U.S. and Canada, excluding Club Monaco. In North America, our wholesale business is comprised primarily of sales to department stores, and to a lesser extent, specialty stores. Our retail business in North America is comprised of our Ralph Lauren stores, our factory stores, and our digital commerce site, www.RalphLauren.com. |
• | Europe — Our Europe segment, representing approximately 26% of our Fiscal 2018 net revenues, primarily consists of sales of our Ralph Lauren branded products made through our wholesale and retail businesses in Europe and the Middle East, excluding Club Monaco. In Europe, our wholesale business is comprised of a varying mix of sales to both department stores and specialty stores, depending on the country. Our retail business in Europe is comprised of our Ralph Lauren stores, our factory stores, our concession-based shop-within-shops, and our various digital commerce sites. |
• | Asia — Our Asia segment, representing approximately 15% of our Fiscal 2018 net revenues, primarily consists of sales of our Ralph Lauren branded products made through our wholesale and retail businesses in Asia, Australia, and New Zealand. Our retail business in Asia is comprised of our Ralph Lauren stores, our factory stores, and our |
8 | ||
concession-based shop-within-shops. In addition, we sell our products online through various third-party digital partner commerce sites. In Asia, our wholesale business is comprised primarily of sales to department stores, with related products distributed through shop-within-shops.
No operating segments were aggregated to form our reportable segments. In addition to these reportable segments, we also have other non-reportable segments, representing approximately 7% of our Fiscal 2018 net revenues, which primarily consist of (i) sales of Club Monaco branded products made through our retail businesses in the U.S., Canada, and Europe, and our licensing alliances in Europe and Asia, (ii) sales of Ralph Lauren branded products made through our wholesale business in Latin America, and (iii) royalty revenues earned through our global licensing alliances, excluding Club Monaco.
This segment structure is consistent with how we establish our overall business strategy, allocate resources, and assess performance of our Company.
Approximately 45% of our Fiscal 2018 net revenues were earned outside of the U.S. See Note 19 to the accompanying consolidated financial statements for a summary of net revenues and operating income by segment, as well as net revenues and long-lived assets by geographic location.
Our Wholesale Business
Our wholesale business sells our products globally to leading upscale and certain mid-tier department stores, specialty stores, and golf and pro shops. We have continued to focus on elevating our brand by improving in-store product assortment and presentation, as well as full-price sell-throughs to consumers. As of the end of Fiscal 2018, our wholesale products were sold through over 12,000 doors worldwide, with the majority in specialty stores. Our products are also increasingly being sold through the digital commerce sites of many of our wholesale customers.
The primary product offerings sold through our wholesale channels of distribution include apparel, accessories, and home furnishings. Our luxury brands, including Ralph Lauren Collection and Ralph Lauren Purple Label, are distributed worldwide through a limited number of premier fashion retailers. In North America, our wholesale business is comprised primarily of sales to department stores, and to a lesser extent, specialty stores. In Europe, our wholesale business is comprised of a varying mix of sales to both department stores and specialty stores, depending on the country. In Asia, our wholesale business is comprised primarily of sales to department stores, with related products distributed through shop-within-shops. We also distribute our wholesale products to certain licensed stores operated by our partners in Latin America, Asia, Europe, and the Middle East.
We sell the majority of our excess and out-of-season products through secondary distribution channels worldwide, including our retail factory stores.
Worldwide Wholesale Distribution Channels
The following table presents by segment the number of wholesale doors in our primary channels of distribution as of March 31, 2018 and April 1, 2017:
March 31, 2018 | April 1, 2017 | |||||
North America | 6,848 | 7,018 | ||||
Europe | 4,928 | 5,690 | ||||
Asia | 341 | 187 | ||||
Other non-reportable segments | 109 | 171 | ||||
Total | 12,226 | 13,066 | ||||
We have three key wholesale customers that generate significant sales volume. During Fiscal 2018, sales to our largest wholesale customer, Macy's, Inc. ("Macy's"), accounted for approximately 8% of our total net revenues. Further, during Fiscal 2018, sales to our three largest wholesale customers, including Macy's, accounted for approximately 19% of our total net revenues, as compared to approximately 21% during Fiscal 2017. Substantially all sales to our three largest wholesale customers related to our North America segment.
Our products are sold primarily by our own sales forces. Our wholesale business maintains its primary showrooms in New York City. In addition, we maintain regional showrooms in Bologna, Geneva, London, Madrid, Munich, Panama, Paris, and Stockholm.
9 | ||
Shop-within-Shops. As a critical element of our distribution to department stores, we and our licensing partners utilize shop-within-shops to enhance brand recognition, to permit more complete merchandising of our lines by the department stores, and to differentiate the presentation of our products.
The following table presents by segment the number of shop-within-shops in our primary channels of distribution as of March 31, 2018 and April 1, 2017:
March 31, 2018 | April 1, 2017 | |||||
North America | 16,276 | 18,979 | ||||
Europe | 5,302 | 6,164 | ||||
Asia | 499 | 339 | ||||
Other non-reportable segments | 311 | 372 | ||||
Total | 22,388 | 25,854 | ||||
The size of our shop-within-shops ranges from approximately 50 to 9,200 square feet. Shop-within-shop fixed assets primarily include items such as customized freestanding fixtures, wall cases and components, decorative items, and flooring. We normally share in the cost of building out these shop-within-shops with our wholesale customers.
Basic Stock Replenishment Program. Basic products such as knit shirts, chino pants, oxford cloth shirts, select accessories, and home products can be ordered by our wholesale customers at any time through our basic stock replenishment program. We generally ship these products within two to five days of order receipt.
Our Retail Business
Our retail business sells directly to customers throughout the world via our 472 retail stores and 632 concession-based shop-within-shops, totaling approximately 3.8 million and 0.6 million square feet, respectively, as well as through our own digital commerce sites and those of various third-party digital partners. We operate our business using a global omni-channel retailing strategy that seeks to deliver an integrated shopping experience with a consistent message of our brands and products to our customers, regardless of whether they are shopping for our products in physical stores or online.
Ralph Lauren Stores
Our Ralph Lauren stores feature a broad range of apparel, accessories, watch and jewelry, fragrance, and home product assortments in an atmosphere reflecting the distinctive attitude and image of the Ralph Lauren, Polo, and Double RL brands, including exclusive merchandise that is not sold in department stores. During Fiscal 2018, we opened 14 new Ralph Lauren stores and closed 12 stores. Our Ralph Lauren stores are primarily situated in major upscale street locations and upscale regional malls, generally in large urban markets.
The following table presents the number of Ralph Lauren stores by segment as of March 31, 2018:
Ralph Lauren Stores | |||
North America | 41 | ||
Europe | 19 | ||
Asia | 51 | ||
Total | 111 | ||
Our eight flagship Ralph Lauren regional store locations showcase our iconic styles and products and demonstrate our most refined merchandising techniques. In addition to generating sales of our products, our worldwide Ralph Lauren stores establish, reinforce, and capitalize on the image of our brands. Our Ralph Lauren stores range in size from approximately 700 to 37,900 square feet.
10 | ||
Factory Stores
We extend our reach to additional consumer groups through our 290 factory stores worldwide, which are principally located in major outlet centers. Our worldwide factory stores offer selections of our apparel, accessories, and fragrances. In addition to these product offerings, certain of our factory stores in North America offer home furnishings. During Fiscal 2018, we opened 22 new factory stores and closed 10 factory stores.
The following table presents the number of factory stores by segment as of March 31, 2018:
Factory Stores | |||
North America | 174 | ||
Europe | 62 | ||
Asia | 54 | ||
Total | 290 | ||
Our factory stores range in size from approximately 1,400 to 28,300 square feet. Factory stores obtain products from our suppliers, our product licensing partners, and our other retail stores and digital commerce operations, and also serve as a secondary distribution channel for our excess and out-of-season products.
Concession-based Shop-within-Shops
The terms of trade for shop-within-shops are largely conducted on a concession basis, whereby inventory continues to be owned by us (not the department store) until ultimate sale to the end consumer. The salespeople involved in the sales transactions are generally our employees and not those of the department store.
The following table presents the number of concession-based shop-within-shops by segment as of March 31, 2018:
Concession-based Shop-within-Shops | |||
North America | 2 | ||
Europe | 25 | ||
Asia | 603 | ||
Other non-reportable segments | 2 | ||
Total(a) | 632 | ||
(a) | Our concession-based shop-within-shops were located at approximately 295 retail locations. |
The size of our concession-based shop-within-shops ranges from approximately 100 to 3,300 square feet. We may share in the cost of building out certain of these shop-within-shops with our department store partners.
Club Monaco Stores
Our Club Monaco stores feature fashion apparel and accessories for both men and women with clean and contemporary signature styles. During Fiscal 2018, we opened one new Club Monaco store and closed nine stores. Our Club Monaco stores range in size from approximately 900 to 17,400 square feet.
The following table presents the number of Club Monaco stores by geographic location as of March 31, 2018:
Club Monaco Stores | |||
North America | 67 | ||
Europe | 4 | ||
Total(a) | 71 | ||
(a) | Our Club Monaco business has been aggregated with other non-reportable segments. |
11 | ||
Directly-Operated Digital Commerce Websites
In addition to our stores, our retail business sells products online in North America and Europe through our various directly-operated digital commerce sites, which include www.RalphLauren.com and www.ClubMonaco.com, among others.
Our Ralph Lauren digital commerce sites offer our customers access to a broad array of Ralph Lauren, Polo, and Double RL apparel, accessories, watch and jewelry, fragrance, and home product assortments, and reinforce the luxury image of our brands. While investing in digital commerce operations remains a primary focus, it is an extension of our investment in the integrated omni-channel strategy used to operate our overall retail business, in which our digital commerce operations are interdependent with our physical stores.
Our Club Monaco digital commerce sites offer our domestic and Canadian customers access to our global assortment of Club Monaco apparel and accessories product lines, as well as select online exclusives.
In addition to our directly-operated platforms, our retail business in Asia sells products online through various third-party digital partner commerce sites.
Our Licensing Business
Through licensing alliances, we combine our consumer insight, design, and marketing skills with the specific product or geographic competencies of our licensing partners to create and build new businesses. We generally seek out licensing partners who are leaders in their respective markets, contribute the majority of the product development costs, provide the operational infrastructure required to support the business, and own the inventory. Our licensing business has been aggregated with other non-reportable segments.
Product Licensing
We grant our product licensees the right to manufacture and sell at wholesale specified categories of products under one or more of our trademarks. Each product licensing partner pays us royalties based upon its sales of our products, generally subject to a minimum royalty requirement for the right to use our trademarks and design services. In addition, our licensing partners may be required to allocate a portion of their revenues to advertising our products and sharing in the creative costs associated with these products. Larger allocations typically are required in connection with launches of new products or in new territories. Our license agreements generally have one to five-year terms and may grant the licensees conditional renewal options.
We work closely with all of our licensing partners to ensure that their products are developed, marketed, and distributed to reach the intended consumer and are presented consistently across product categories to convey the distinctive identity and lifestyle associated with our brands. Virtually all aspects of the design, production quality, packaging, merchandising, distribution, advertising, and promotion of Ralph Lauren products are subject to our prior approval and continuing oversight. We perform a broader range of services for most of our Ralph Lauren Home licensing partners than we do for our other licensing partners, including design, operating showrooms, marketing, and advertising.
The following table lists our largest licensing agreements as of March 31, 2018. Except as noted in the table, these product licenses cover North America only.
Category | Licensed Products | Licensing Partners | ||
Men's Apparel | Underwear and Sleepwear | Hanesbrands, Inc. (includes Japan) | ||
Chaps, Lauren, and Ralph Tailored Clothing | Peerless Clothing International, Inc. | |||
Beauty Products | Fragrances, Cosmetics, Color, and Skin Care | L'Oreal S.A. (global) | ||
Accessories | Eyewear | Luxottica Group, S.p.A. (global) | ||
Home | Bedding and Bath | Ichida Co., Ltd. | ||
Utility and Blankets | Hollander Sleep Products LLC and Ichida Co., Ltd. | |||
Fabric and Wallpaper | P. Kaufmann, Inc. | |||
12 | ||
International Licensing
We believe that international markets offer additional opportunities for our iconic designs and lifestyle image. Our international licensing partners acquire the right to sell, promote, market, and/or distribute various categories of our products in a given geographic area and source products from us, our product licensing partners, and independent sources. The international licensees' rights may include the right to own and operate retail stores. As of March 31, 2018, our international licensing partners operated 88 Ralph Lauren stores, 54 Ralph Lauren concession shops, and 136 Club Monaco stores and shops.
Digital Ecosystem
Investing in our digital ecosystem remains a primary focus and is a key component of our integrated global omni-channel strategy that spans across owned and partnered channels, both physical and digital. Our digital ecosystem is comprised of directly-operated platforms, wholesale partner websites, third-party digital pure players, and social commerce.
Our directly-operated digital commerce sites represent our digital flagships, displaying the most elevated expression of our brands. The strategy for our digital flagships is to emphasize brand experience, develop digital content that drives deeper consumer engagement and conversion, as well as broaden our omni-channel service offerings, such as pickup and return in store.
Our products are also sold through the digital commerce sites of many of our wholesale customers. We collaborate with our key wholesale partners to leverage consumer insights to extend our reach and improve traffic conversion.
We also sell products online through various third-party digital pure-play sites, which have a higher penetration of younger consumers. On many of these sites, we have created digital shop-in-shop environments with a consistent brand experience, tailored product stories, and an assortment that is carefully curated by our merchants. We also partner closely with our pure-play customers on marketing events, as well as optimizing search and other data analysis to drive higher traffic and conversion for our brands.
In connection with our digital commerce operations, we engage consumers through various digital and social media platforms, which are supported through our collaboration with influencers who have an authentic connection to our brand.
Seasonality of Business
Our business is typically affected by seasonal trends, with higher levels of wholesale sales in our second and fourth fiscal quarters and higher retail sales in our second and third fiscal quarters. These trends result primarily from the timing of seasonal wholesale shipments and key vacation travel, back-to-school, and holiday shopping periods impacting our retail business. As a result of changes in our business, consumer spending patterns, and the macroeconomic environment, historical quarterly operating trends and working capital requirements may not be indicative of our future performance. In addition, fluctuations in sales, operating income, and cash flows in any fiscal quarter may be affected by other events affecting retail sales, such as changes in weather patterns.
Working capital requirements vary throughout the year. Working capital requirements typically increase during the first half of the fiscal year as inventory builds to support peak shipping/selling periods and, accordingly, typically decrease during the second half of the fiscal year as inventory is shipped/sold. Cash provided by operating activities is typically higher in the second half of the fiscal year due to reduced working capital requirements during that period.
Product Design
Our products reflect a timeless and innovative interpretation of American style with a strong international appeal. Our consistent emphasis on new and distinctive design has been an important contributor to the prominence, strength, and reputation of the Ralph Lauren brands.
Our Ralph Lauren products are designed by, and under the direction of, Mr. Ralph Lauren and our design staff. We form design teams around our brands and product categories to develop concepts, themes, and products for each brand and category. Through close collaboration with merchandising, sales, and production staff, these teams support all of our businesses in order to gain market information and other valuable input.
13 | ||
Marketing and Advertising
Our marketing and advertising programs communicate the themes and images of our brands and are integral to the success of our product offerings. The majority of our advertising program is created and executed by our in-house creative and advertising agency to ensure consistency of presentation, which is complemented by our marketing experts in each region who help to execute our international strategies.
We create distinctive image advertising for our brands, conveying the particular message of each one within the context of the overall Ralph Lauren aesthetic. Advertisements generally portray a lifestyle rather than a specific item and include a variety of products offered by ourselves and, in some cases, our licensing partners. Our communication campaigns are increasingly being executed through digital and social media platforms to drive further engagement with the younger consumer, with a focus on influencers. In regards to influencers, we believe in investing in long-term relationships with those who have an authentic connection to our brand and influence the areas of culture that matter most to our audiences. We also continue to advertise through print and outdoor media, and, to a lesser extent, through television and cinema.
Our digital advertising programs focus on high impact and innovative digital media outlets, which allow us to convey our key brand messages and lifestyle positioning. We also develop digital editorial initiatives that allow for deeper education and engagement around the Ralph Lauren lifestyle, including the RL Magazine, RL Style Guide, and a wide array of video and social media content. We deploy these marketing and advertising initiatives through online, mobile, email, and social media. Our digital commerce sites present the Ralph Lauren lifestyle online, while offering a broad array of our apparel, accessories, and home product lines.
Additionally, we advertise in consumer and trade publications, and participate in cooperative advertising on a shared cost basis with some of our retail and licensing partners. We also provide point-of-sale fixtures and signage to our wholesale customers to enhance the presentation of our products at their retail locations. In addition, when our licensing partners are required to spend an amount equal to a percentage of their licensed product sales on advertising, we coordinate the advertising placement on their behalf. We believe our investments in shop-within-shop environments and retail stores, including our global flagship locations, contribute to and enhance the themes of our brands to consumers.
We also conduct a variety of public relations activities. Each spring and fall, our Ralph Lauren Women's Collection is presented during New York Fashion Week. We also introduce each of the spring and fall menswear and womenswear collections at press presentations in major cities such as New York City and Milan. These fashion events, in addition to celebrity red carpet dressing moments, model appearances, and events hosted in our stores and restaurants, including The Polo Bar in New York City, generate extensive domestic and international media and social coverage.
We continue to be the official outfitter for all on-court officials at both the Wimbledon and the U.S. Open tennis tournaments. Both tournaments provide worldwide exposure for our brand in a relevant lifestyle environment. We also continue to be the exclusive Official Parade Outfitter for the U.S. Olympic and Paralympic Teams, with the right to manufacture, distribute, advertise, promote, and sell products in the U.S. which replicate the Parade Outfits and associated leisure wear. Most recently, we dressed Team U.S.A. for the 2018 Winter Olympic Games in PyeongChang, South Korea. As part of our involvement with Team U.S.A., we have established a partnership with athletes serving as brand ambassadors and as the faces of our advertising, marketing, and public relations campaigns. Additionally, under our agreement with the United States Golf Association ("USGA"), we continue to be the official apparel outfitter for the USGA and the U.S. Open Championships and serve as the championship's largest on-site apparel supplier.
We believe our partnerships with such prestigious global athletic events reinforce our brand's sporting heritage in a truly authentic way and serve to connect our Company and brands to our consumers through their individual areas of passion.
14 | ||
Sourcing, Production and Quality
We contract for the manufacture of our products and do not own or operate any production facilities. Over 500 different manufacturers worldwide produce our apparel, accessories, and home products, with no one manufacturer providing more than 4% of our total production during Fiscal 2018. We source both finished products and raw materials. Raw materials include fabric, buttons, and other trim. Finished products consist of manufactured and fully assembled products ready for shipment to our customers. In Fiscal 2018, over 97% of our products (by dollar value) were produced outside of the U.S., primarily in Asia, Europe, and Latin America. See "Import Restrictions and Other Government Regulations" and Item 1A — "Risk Factors — Our business is subject to risks associated with importing products and the ability of our manufacturers to produce our goods on time and to our specifications."
Most of our businesses must commit to the manufacturing of our garments before we sell finished goods, whether to wholly-owned retail stores or to wholesale customers. We also must commit to the purchase of fabric from mills well in advance of our sales. If we overestimate our primary customers' demand for a particular product or the need for a particular fabric or yarn, we primarily sell the excess products or garments made from such fabric or yarn in our factory stores or through other secondary distribution channels.
Suppliers operate under the close supervision of our global manufacturing division and buying agents headquartered in Asia, the Americas, the Middle East, and Europe. All products are produced according to our specifications and standards. Production and quality control staff in Asia, the Americas, the Middle East, and Europe monitor manufacturing at supplier facilities in order to correct problems prior to shipment of the final product. Procedures have been implemented under our vendor certification and compliance programs so that quality assurance is reviewed early in the production process, allowing merchandise to be received at the distribution facilities and shipped to customers with minimal interruption.
Competition
Competition is very strong in the segments of the fashion and consumer product industries in which we operate. We compete with numerous designers and manufacturers of apparel and accessories, fragrances, and home furnishing products, both domestic and international. We also face increasing competition from companies selling our product categories through the Internet. Some of our competitors may be significantly larger and have substantially greater resources than us. We compete primarily on the basis of fashion, quality, value, and service, which depend on our ability to:
• | anticipate and respond to changing consumer demands in a timely manner; |
• | create and maintain favorable brand recognition, loyalty, and reputation for quality; |
• | develop and produce innovative, high-quality products that appeal to consumers of varying age groups; |
• | competitively price our products and create an acceptable value proposition for consumers; |
• | provide strong and effective marketing support; |
• | obtain additional points of distribution and sufficient retail floor space, and effectively present our products to consumers; |
• | attract consumer traffic to both retail stores and websites; |
• | source raw materials at cost-effective prices; |
• | anticipate and maintain proper inventory levels; and |
• | ensure product availability and optimize supply chain and distribution efficiencies. |
See Item 1A — "Risk Factors — We face intense competition worldwide in the markets in which we operate."
15 | ||
Distribution
To facilitate global distribution, our products are shipped from manufacturers to a network of distribution centers around the world for inspection, sorting, packing, and delivery to our retail locations and digital commerce and wholesale customers. This network includes the following primary distribution facilities:
Facility Location | Geographic Region Serviced | Facility Ownership | ||
Greensboro, North Carolina | U.S. | Owned | ||
N. Pendleton Street, High Point, North Carolina | U.S. | Owned | ||
NC Highway 66, High Point, North Carolina | U.S. | Leased | ||
Eagle Hill Drive, High Point, North Carolina | U.S. | Leased | ||
Chino Hills, California | U.S. | Third-party | ||
Miami, Florida | U.S. | Third-party | ||
Toronto, Ontario | Canada | Third-party | ||
Parma, Italy | Europe | Third-party | ||
Yokohama, Japan | Japan | Third-party | ||
Bugok, South Korea | South Korea | Leased | ||
Tuen Mun, Hong Kong | Greater China and Southeast Asia(a) | Third-party | ||
Colón, Panama | Latin America | Third-party | ||
(a) | Includes Australia, China, Hong Kong, Macau, Malaysia, New Zealand, the Philippines, Singapore, Taiwan, Thailand, and Vietnam. |
All facilities are designed to allow for high-density cube storage and value-added services, and utilize unit and carton tracking technology to facilitate process control and inventory management. The distribution network is managed through globally integrated information technology systems.
Management Information Systems
Our management information systems make the design, marketing, manufacturing, importation, and distribution of our products more efficient by providing, among other things:
• | comprehensive order processing; |
• | production and design information; |
• | accounting information; and |
• | an enterprise view of information for our design, marketing, manufacturing, importing, and distribution functions. |
The point-of-sale registers, in conjunction with other systems in our stores, enable us to track inventory from store receipt to final sale on a real-time basis. We believe our merchandising and financial systems, coupled with our point-of-sale registers and software programs, allow for efficient stock replenishment, effective merchandise planning, and real-time inventory and sales accounting.
In the U.S. and Europe, we utilize an automated replenishment system to facilitate the processing of basic stock replenishment orders from our retail business and wholesale customers, the movement of goods through distribution channels, and the collection of information for planning and forecasting purposes. In the U.S. and Europe, we also utilize an automated allocation system to facilitate the flow of inventory for our retail business.
16 | ||
We are continually improving and upgrading our computer systems and software. For example, as part of a multi-year plan to integrate and upgrade our global systems and processes, we recently completed the migration of our European operations to SAP, the operating and financial reporting information technology system used by our North America operations. We also transitioned our North America digital commerce operations to a third-party cloud-based platform during Fiscal 2018, and we have plans to transition our other digital commerce operations during Fiscal 2019 and beyond.
See Item 1A — "Risk Factors — A data security or privacy breach could damage our reputation and our relationships with our customers or employees, expose us to litigation risk, and adversely affect our business," "Risk Factors — Risks and uncertainties associated with the implementation of information systems may negatively impact our business," and "Risk Factors — Our business could suffer if our computer systems and websites are disrupted or cease to operate effectively."
Wholesale Credit Control
We manage our own credit function. We sell our merchandise principally to major department stores and extend credit based on an evaluation of the wholesale customer's financial capacity and condition, usually without requiring collateral. We monitor credit levels and the financial condition of our wholesale customers on a continuing basis to minimize credit risk. We do not factor or underwrite our accounts receivables, or maintain credit insurance to manage the risk of bad debts. In North America, collection and deduction transactional activities are provided through a third-party service provider. See Item 1A — "Risk Factors — A substantial portion of our revenue is derived from a limited number of large wholesale customers. Our business could be adversely affected as a result of consolidations, liquidations, restructurings, other ownership changes in the retail industry, and/or any financial instability of our large wholesale customers."
Wholesale Backlog
We generally receive wholesale orders approximately three to five months prior to the time the products are delivered to customers, with the exception of orders received through our basic stock replenishment program, which ship within two to five days of order receipt. Our wholesale orders are generally subject to broad cancellation rights.
The following table presents our wholesale backlog by segment as of March 31, 2018 and April 1, 2017:
March 31, 2018 | April 1, 2017 | |||||||
(billions) | ||||||||
North America | $ | 0.6 | $ | 0.8 | ||||
Europe | 0.4 | 0.4 | ||||||
Total | $ | 1.0 | $ | 1.2 | ||||
We expect that substantially all of our backlog orders as of March 31, 2018 will be filled within the next fiscal year.
The size of our order backlog depends upon a number of factors, including the timing of the market weeks for our particular lines during which a significant percentage of our orders are received and the timing of shipments, which varies from year-to-year with consideration for holidays, consumer trends, concept plans, and the basic stock replenishment program's usage. As a consequence, a comparison of the size of our order backlog from period-to-period may not be meaningful, nor may it be indicative of eventual shipments.
Trademarks
We own the RALPH LAUREN, POLO, POLO BY RALPH LAUREN DESIGN, and the famous polo player astride a horse trademarks in the U.S. and approximately 120 countries worldwide. Other trademarks that we own include:
• | PURPLE LABEL; |
• | DOUBLE RL; |
• | RRL; |
17 | ||
• | RLX; |
• | LAUREN RALPH LAUREN; |
• | PINK PONY; |
• | LAUREN; |
• | RALPH; |
• | CHAPS; |
• | CLUB MONACO; and |
• | Various other trademarks, including those pertaining to fragrances and cosmetics. |
Mr. Ralph Lauren has the royalty-free right to use as trademarks RALPH LAUREN, DOUBLE RL, and RRL in perpetuity in connection with, among other things, beef and living animals. The trademarks DOUBLE RL and RRL are currently used by the Double RL Company, an entity wholly owned by Mr. R. Lauren. In addition, Mr. R. Lauren has the right to engage in personal projects involving film or theatrical productions (not including or relating to our business) through RRL Productions, Inc., a company wholly owned by Mr. R. Lauren. Any activity by these companies has no impact on us.
Our trademarks are the subject of registrations and pending applications throughout the world for use on a variety of items of apparel, apparel-related products, home furnishings, restaurant and café services, online services and online publications, and beauty products, as well as in connection with retail services, and we continue to expand our worldwide usage and registration of related trademarks. In general, trademarks remain valid and enforceable as long as the marks are used in connection with the related products and services and the required registration renewals are filed. We regard the license to use the trademarks and our other proprietary rights in and to the trademarks as extremely valuable assets in marketing our products and, on a worldwide basis, vigorously seek to protect them against infringement. As a result of the appeal of our trademarks, our products have been the object of counterfeiting. While we have a broad enforcement program which has been generally effective in protecting our intellectual property rights and limiting the sale of counterfeit products in the U.S. and in most major markets abroad, we face greater challenges with respect to enforcing our rights against trademark infringement in certain parts of Asia.
In markets outside of the U.S., our rights to some or all of our trademarks may not be clearly established. In the course of our international expansion, we have experienced conflicts with various third parties who have acquired ownership rights in certain trademarks, including POLO and/or a representation of a Polo Player Design, which impede our use and registration of our principal trademarks. While such conflicts are common and may arise again from time to time as we continue our international expansion, we have, in general, successfully resolved such conflicts in the past through both legal action and negotiated settlements with third-party owners of the conflicting marks (see Item 1A — "Risk Factors — Our trademarks and other intellectual property rights may not be adequately protected outside the U.S." and Item 3 — "Legal Proceedings" for further discussion). Although we have not suffered any material restraints or restrictions on doing business in desirable markets in the past, we cannot assure that significant impediments will not arise in the future as we expand product offerings and introduce trademarks to new markets.
Import Restrictions and Other Government Regulations
Virtually all of our merchandise imported into the Americas, Europe, Asia, Australia, and New Zealand is subject to duties. In addition, most of the countries to which we ship could impose safeguard quotas and duties to protect their local industries from import surges that threaten to create market disruption. The U.S. and other countries may also unilaterally impose additional duties in response to a particular product being imported (from China or other countries) at unfairly traded prices in such increased quantities that would cause (or threaten) injury to the relevant domestic industry (generally known as "anti-dumping" actions). If dumping is suspected in the U.S., the U.S. government may self-initiate a dumping case on behalf of the U.S. textile industry which could significantly affect our costs. Furthermore, additional duties, generally known as countervailing duties, can also be imposed by the U.S. government to offset subsidies provided by a foreign government to foreign manufacturers if the importation of such subsidized merchandise injures or threatens to injure a U.S. industry.
In addition, each of the countries in which our products are sold has laws and regulations covering imports. Because the U.S. and the other countries in which our products are manufactured and sold may, from time to time, impose new duties, tariffs, surcharges, or other import controls or restrictions, including the imposition of a "safeguard quota," or adjust presently prevailing duty or tariff rates or levels, we maintain a program of intensive monitoring of import restrictions and opportunities. We seek to
18 | ||
minimize our potential exposure to import-related risks through, among other measures, adjustments in product design and fabrication, shifts of production among countries and manufacturers, and through geographical diversification of our sources of supply.
As almost all of our products are manufactured by foreign suppliers, the enactment of new legislation or the administration of current international trade regulations or executive action affecting textile agreements, or changes in sourcing patterns could adversely affect our operations. See Item 1A — "Risk Factors — Our ability to conduct business globally may be affected by a variety of legal, regulatory, political, and economic risks" and "Risk Factors — Our business is subject to risks associated with importing products and the ability of our manufacturers to produce our goods on time and to our specifications."
We are also subject to other international trade agreements, such as the North American Free Trade Agreement, the Central American Free Trade Agreement, the U.S.-Peru Free Trade Agreement, the U.S.-Jordan Free Trade Agreement, the U.S.-Korea Free Trade Agreement and other special trade preference programs. A portion of our imported products are eligible for certain of these duty-advantaged programs. Apparel and other products sold by us are under the jurisdiction of multiple governmental agencies, including, in the U.S., the Federal Trade Commission, the U.S. Fish and Wildlife Service, the Environmental Protection Agency, and the Consumer Products Safety Commission.
Our products are also subject to regulation in the U.S. and other countries, including the U.S. Consumer Product Safety Improvement Act, which relate principally to product labeling, licensing requirements, and consumer product safety requirements and regulatory testing, particularly with respect to products used by children. Any failure to comply with such requirements could result in significant penalties and require us to recall products, which could have a material adverse effect on our business or operating results. We believe that we are in substantial compliance with these regulations, as well as applicable federal, state, local, and foreign rules and regulations governing the discharge of materials hazardous to the environment. We do not anticipate any significant capital expenditures for environmental control matters either in the next fiscal year or in the near future. Our licensed products, licensing partners, buying/sourcing agents, and the vendors and factories with which we contract for the manufacture and distribution of our products are also subject to regulation. Our agreements require our licensing partners, buying/sourcing agents, vendors, and factories to operate in compliance with all applicable laws and regulations, and we are not aware of any violations which could reasonably be expected to have a material adverse effect on our business or operating results.
We are also subject to disclosure and reporting requirements, established under existing or new federal or state laws, such as the requirements to identify the origin and existence of certain "conflict minerals" under the Dodd-Frank Wall Street Reform and Consumer Protection Act, and disclosures of specific actions to eradicate abusive labor practices in our supply chain under the California Transparency in Supply Chains Act. While we require our suppliers to operate in compliance with all applicable laws and our operating guidelines which promote ethical and socially responsible business practices, any violation of labor, environmental, health, and safety or other laws, or any divergence by an independent supplier's labor practices from generally accepted industry standards, could damage our reputation, disrupt our sourcing capabilities, and increase the cost of doing business, adversely affecting our results of operations. See Item 1A — "Risk Factors — Our business could suffer if we fail to comply with labor laws or if one of our manufacturers fails to use acceptable labor or environmental practices."
Although we have not suffered any material restriction from doing business in desirable markets in the past, we cannot assure that significant impediments will not arise in the future as we expand product offerings and introduce additional trademarks to new markets.
Employees
As of March 31, 2018, we had approximately 23,500 employees, comprised of approximately 12,800 full-time and approximately 10,700 part-time employees. Approximately 13,500 of our employees are located in the U.S. and approximately 10,000 are located in foreign countries. Approximately 25 of our U.S. production employees in the womenswear business are members of Workers United (which was previously known as UNITE HERE) under an industry association collective bargaining agreement, which our womenswear subsidiary has adopted. We consider our relations with both our union and non-union employees to be good.
19 | ||
Executive Officers
The following are our current executive officers and their principal recent business experience:
Ralph Lauren | Age 78 | Mr. Ralph Lauren founded our business in 1967 and, for five decades, has cultivated the iconography of America into a global lifestyle brand. He has been our Executive Chairman and Chief Creative Officer since November 2015, and a director of the Company since prior to our initial public offering in 1997. He had previously been our Chairman and Chief Executive Officer since prior to our initial public offering in 1997 until November 2015. In addition, he was previously a member of our Advisory Board or the Board of Directors of our predecessors since their organization. | ||
Patrice Louvet | Age 53 | Mr. Louvet has served as our President and Chief Executive Officer, and a director of the Company since July 2017. Prior to joining the Company, he served as the Group President, Global Beauty, of Procter & Gamble Co. ("P&G") since February 2015. Prior to that role, Mr. Louvet held successively senior leadership positions at P&G, including the roles of Group President, Global Grooming (Gillette), and President of P&G's Global Prestige Business. Before he joined P&G, he served as a Naval Officer, Admiral Aide de Camp in the French Navy from 1987 to 1989. Mr. Louvet graduated from École Supérieure de Commerce de Paris and received his M.B.A. from the University of Illinois. He has served as a member of the board of directors of Bacardi Limited since July 2012. | ||
Valérie Hermann | Age 55 | Ms. Hermann has been our President, Global Brands since September 2016, with responsibility for all aspects of the development of our global brand groups, including Ralph Lauren Luxury, Polo Ralph Lauren, Lauren, Chaps, and Ralph Lauren Home. She served as our Global Brand President of Luxury, Women's Collections, and World of Accessories from May 2016 through September 2016, and was our President of Luxury Collections from April 2014 through April 2016. Ms. Hermann was President and Chief Executive Officer of Reed Krakoff Co. from April 2011 through March 2014. From 2005 to 2011, she served as Chief Executive Officer of Saint Laurent Paris. Prior to that, Ms. Hermann held various positions at LVMH Moët Hennessy Louis Vuitton, including Director of Women's Ready to Wear at Dior. | ||
David Lauren | Age 46 | Mr. David Lauren is our Chief Innovation Officer, Strategic Advisor to the CEO, and Vice Chairman of the Board. He has served as our Chief Innovation Officer and Vice Chairman of the Board since October 2016. From November 2010 to October 2016, he served as our Executive Vice President of Global Advertising, Marketing and Communications. Prior to that, he served in numerous leadership roles at the Company with responsibility for advertising, marketing, and communications. He has been a director of the Company since August 2013. Mr. D. Lauren oversees the Company's innovation processes and capabilities to drive its brand strength and financial performance across all channels. He has been instrumental in growing the Company's global digital commerce business and pioneering our technology initiatives. He serves on the board of trustees of the Ralph Lauren Center for Cancer Care and Prevention and the board of directors of The National Museum of American History. Mr. D. Lauren is also the Head of The Polo Ralph Lauren Foundation. Before joining the Company in 2000, he was Editor-In-Chief and President of Swing, a general interest publication for Generation X. Mr. D. Lauren is the son of Mr. R. Lauren. | ||
Jane Hamilton Nielsen | Age 54 | Ms. Nielsen has been our Chief Financial Officer since September 2016. She served as Chief Financial Officer of Coach, Inc. from September 2011 to August 2016. From 2009 to 2011, she was Senior Vice President and Chief Financial Officer of PepsiCo Beverages Americas and the Global Nutrition Group, divisions of PepsiCo, Inc., with responsibility for all financial management including financial reporting, performance management, capital allocation, and strategic planning. Prior to that, Ms. Nielsen held various senior roles in finance at PepsiCo, Inc. and Pepsi Bottling Group starting in 1996. She also serves on the board of directors of Pinnacle Foods Inc. Ms. Nielsen received her M.B.A. from the Harvard Business School and B.A. from Smith College. | ||
20 | ||
Item 1A. | Risk Factors |
There are risks associated with an investment in our securities. The following risk factors should be read carefully in connection with evaluating our business and the forward-looking statements contained in this Annual Report on Form 10-K. Any of the following risk factors could materially adversely affect our business, our prospects, our results of operations, our financial condition, our liquidity, the trading price of our securities, and/or the actual outcome of matters as to which forward-looking statements are made in this report. Additional risks and uncertainties not currently known to us or that we currently view as immaterial may also materially adversely affect our business, results of operations, and financial condition in future periods or if circumstances change.
The loss of the services of Mr. Ralph Lauren, members of our executive management team, or other key personnel could have a material adverse effect on our business.
Mr. Ralph Lauren's leadership in the design and marketing areas of our business has been a critical element of our success since the inception of our Company. Mr. R. Lauren is instrumental to, and closely identified with, our brand that bears his name. Our ability to maintain our brand image and leverage the goodwill associated with Mr. R. Lauren's name may be damaged if we were to lose his services. The death or disability of Mr. R. Lauren or other extended or permanent loss of his services, or any negative market or industry perception with respect to him or arising from his loss, could have a material adverse effect on our business, results of operations, and financial condition.
We also depend on the service and management experience of other key executive officers and other members of senior management who have substantial experience and expertise in our industry and our business and have made significant contributions to our growth and success. Competition in our industry to attract and retain these employees is intense and is influenced by our reputation, our ability to offer competitive compensation and benefits, and economic conditions, among other factors. The loss of the services of any of our key executive officers or other members of senior management, or one or more of our other key personnel, or the concurrent loss of several of these individuals or any negative public perception with respect to these individuals, could also have a material adverse effect on our business, results of operations, and financial condition.
We are not protected by a material amount of key-man or similar life insurance covering our executive officers, including Mr. R. Lauren, or other members of senior management. We have entered into employment agreements with certain of our executive officers, but competition for experienced executives in our industry is intense and the non-compete period with respect to certain of our executive officers could, in some circumstances in the event of their termination of employment with our Company, end prior to the employment term set forth in their employment agreements.
Recent changes in our executive and senior management team, including the departure of Mr. Stefan Larsson and the appointment of Mr. Patrice Louvet, may be disruptive to, or cause uncertainty in, our business.
Effective May 2017, Mr. Stefan Larsson departed as the Company's President and CEO and as a member of our Board of Directors. Subsequent to Mr. Larsson's departure, Mr. Patrice Louvet was appointed as the Company's new President and CEO and as a member of our Board of Directors, effective July 2017. Our ability to continue to execute our growth strategy may be adversely affected or delayed by the uncertainty associated with this transition. In addition to Mr. Larsson's departure, certain other members of our executive and senior management team have departed in recent years, and we may implement other management and organizational changes in connection with our growth strategy. Any changes in our executive and senior management team may be disruptive to, or cause uncertainty in, our business and future strategic direction. The departure of certain key individuals and the failure to ensure a smooth transition and effective transfer of knowledge involving senior employees could hinder or delay our strategic planning and execution, as well as adversely affect our ability to attract and retain other experienced and talented employees. Any such disruption or uncertainty could have a material adverse impact on our business, results of operations, and financial condition. Further, such disruption may hinder our ability to maintain an effective system of internal controls and compliance with the requirements under the Sarbanes-Oxley Act of 2002.
We cannot assure the successful implementation of our growth strategy.
We have developed a long-term growth strategy with the objective of delivering sustainable, profitable growth and long-term value creation for shareholders, as described in Item 1 — "Business — Objectives and Opportunities." Our ability to successfully execute our growth strategy is subject to various risks and uncertainties, as described within this "Risk Factors" section of our Form 10-K.
21 | ||
Although we believe that our growth strategy will lead to long-term growth in revenue and profitability, there can be no assurance regarding the timing of or extent to which we will realize the anticipated benefits, if at all. Our failure to realize the anticipated benefits, which may be due to our inability to execute the various elements of our growth strategy, changes in consumer preferences, competition, economic conditions, and other risks described herein, could have a material adverse effect on our business, results of operations, and financial condition. Our failure could also result in the implementation of additional restructuring-related activities, which may be dilutive to our earnings in the short term.
Achievement of our growth strategy may require investment in new capabilities, distribution channels, and technologies. These investments may result in short-term costs without accompanying current revenues and, therefore, may be dilutive to our earnings in the short term. There can be no assurance regarding the timing of or extent to which we will realize the anticipated benefits of these investments and other costs, if at all.
We may not fully realize the expected cost savings and/or operating efficiencies from our restructuring plans.
We have implemented restructuring plans to support key strategic initiatives, such as the Way Forward Plan, as described in Item 1 — "Business — Recent Developments." Although designed to deliver long-term sustainable growth, restructuring plans present significant potential risks that may impair our ability to achieve anticipated operating enhancements and/or cost reductions, or otherwise harm our business, including:
• | higher than anticipated costs in implementing planned workforce reductions, particularly in highly regulated locations outside the U.S.; |
• | higher than anticipated lease termination and store closure costs (see "Our business is subject to risks associated with leasing real estate and other assets under long-term, non-cancellable leases"); |
• | failure to meet operational targets or customer requirements due to the loss of employees or inadequate transfer of knowledge; |
• | failure to maintain adequate controls and procedures while executing, and subsequent to completing, our restructuring plans; |
• | diversion of management attention and resources from ongoing business activities and/or a decrease in employee morale; |
• | attrition beyond any planned reduction in workforce; and |
• | damage to our reputation and brand image due to our restructuring-related activities, including the closure of certain of our stores. |
If we are not successful in implementing and managing our restructuring plans, we may not be able to achieve targeted operating enhancements, sales growth, and/or cost reductions, which could adversely impact our business, results of operations, and financial condition. Our failure to achieve targeted results could also lead to the implementation of additional restructuring-related activities, which may be dilutive to our earnings in the short term.
We may not be successful in the expansion of our multi-channel distribution network.
Implementation of our growth strategy involves the continuation and expansion of our multi-channel distribution network, including within international markets such as China, which is subject to many factors, including, but not limited to, our ability to:
• | identify new or underpenetrated markets where our products and brand will be accepted by consumers; |
• | attract customers, particularly in new markets; |
• | identify desirable freestanding and department store locations, the availability of which may be out of our control; |
• | negotiate acceptable lease terms, including desired tenant improvement allowances; |
• | efficiently and cost effectively build-out stores and shop-within-shop locations; |
• | source sufficient inventory levels to meet the needs of the new stores and shop-within-shops; |
22 | ||
• | hire, train, and retain competent store personnel; and |
• | integrate new stores and shop-within-shops into our existing systems and operations. |
Any of these challenges could delay or otherwise prevent us from successfully executing our distribution expansion strategy. There can be no assurance that our new stores and shop-within-shops will be successful and profitable or if the capital costs associated with the build-out of such new locations will be recovered. Further, entry into new markets may bring us into competition with new or existing competitors that have a more established market presence than us or other competitive advantages. Other risks related to our international expansion plans include general economic conditions in specific countries or markets, changes in diplomatic and trade relationships, political instability, and foreign government regulation, among other risks described herein. If our expansion plans are unsuccessful or do not deliver an appropriate return on our investments, our business, results of operations, and financial condition could be adversely affected.
The success of our business also depends on our ability to continue to maintain, enhance, and expand our digital footprint and capabilities. Consumers are increasingly shopping online using computers, smartphones, tablets, and other devices. Any failure on our part, or on the part of our third party digital partners, to provide attractive, reliable, secure, and user-friendly digital commerce platforms could negatively impact our customers' shopping experience resulting in reduced website traffic, diminished loyalty to our brands, and lost sales. In addition, as we continue to expand and increase the global presence of our digital commerce business, sales from our brick and mortar stores and wholesale channels of distribution in areas where digital commerce sites are introduced may decline due to changes in consumer shopping habits and cannibalization.
The success of our business depends on our ability to respond to constantly changing fashion and retail trends and consumer demands in a timely manner, develop products that resonate with our existing customers and attract new customers, and provide a seamless shopping experience to our customers.
The industries in which we operate have historically been subject to rapidly changing fashion trends and consumer preferences. Our success depends in large part on our ability to originate and define fashion product and home product trends, as well as to anticipate, gauge, and react to changing consumer demands in a timely manner. Our products must appeal to a broad range of consumers worldwide whose preferences cannot be predicted with certainty and are subject to rapid change, influenced by fashion trends, current economic conditions, and weather conditions, among other factors. This issue is further compounded by the increasing use of digital and social media by consumers and the speed by which information and opinions are shared across the globe. We cannot assure that we will be able to continue to develop appealing styles or successfully meet constantly changing consumer demands in the future. In addition, we cannot assure that any new products or brands that we introduce will be successfully received by consumers. Any failure on our part to anticipate, identify, and respond effectively to changing consumer demands and fashion trends could adversely affect retail and consumer acceptance of our products and leave us with a substantial amount of unsold inventory or missed opportunities. Conversely, if we underestimate consumer demand for our products or if manufacturers fail to supply quality products in a timely manner, we may experience inventory shortages. Any of these outcomes could have a material adverse effect on our business, results of operations, and financial condition. For a discussion of risks related to our inventory management, see "Our profitability may decline if we are unable to effectively manage inventory or as a result of increasing pressure on margins."
Our marketing and advertising programs are integral to the success of our product offerings and on our ability to attract new customers and retain existing customers. Our communication campaigns are increasingly being executed through digital and social media platforms to drive further engagement with the younger consumer, with a focus on influencers. However, we cannot assure that our marketing and advertising programs will be successful or appeal to consumers.
The success of our business also depends on our ability to continue to develop and maintain a reliable omni-channel experience for our customers. Our business has evolved from an in-store experience to a shopping experience through multiple technologies, including computers, smartphones, tablets, and other devices, as our customers have become increasingly technologically savvy. We are increasingly using digital and social media platforms to interact with customers and as a means to enhance their shopping experience. If we are unable to develop and continuously improve our customer-facing technologies, we may not be able to provide a convenient and consistent experience to our customers regardless of the sales channel. This could negatively affect our ability to compete with other retailers and result in diminished loyalty to our brands, which could adversely impact our business, results of operations, and financial condition.
We have also implemented, and expect to continue to implement, new store design concepts as part of our growth strategy. There can be no assurance that any of our new store designs will resonate with customers or otherwise achieve the desired sales and profitability measures necessary to recover our initial capital investments. If we are unable to successfully develop new store designs, or if customers are not receptive to the design layout or visual merchandising, our business, results of operations, and
23 | ||
financial condition could be adversely affected. In addition, the failure of new store designs to achieve acceptable results could lead to our decision to close a store prior to the lease expiration date. For additional discussion of risks related to the early termination of our leases, see "Our business is subject to risks associated with leasing real estate and other assets under long-term, non-cancellable leases."
The success of our business depends on our ability to retain the value and reputation of our brands.
Our success depends on the value and reputation of our brands and our ability to consistently anticipate, identify, and respond to customers' demands, preferences, and fashion trends in the design, pricing, and production of our products, including the preference for certain products to be manufactured in the U.S. As the Ralph Lauren name is integral to our business, any negative publicity regarding Mr. R. Lauren or our Company, especially through social media which accelerates and increases the potential scope of negative publicity, could negatively impact the image of our brands with our customers and result in diminished loyalty to our brands, even if the subject of such publicity is unverified or inaccurate. Additionally, our failure to comply with ethical, social, product safety, labor, health, environmental or other standards and regulations could damage the reputation of our brands and lead to adverse consumer actions, as well as expose us to government enforcement action and/or private litigation. Even if we react appropriately to negative publicity, our customers' perception of our brand image and our reputation could be negatively impacted. Any failure on our part to retain the value and reputation of brands could adversely impact our business, results of operations, and financial condition.
We face intense competition worldwide in the markets in which we operate.
We face increasing competition from companies selling apparel, accessories, home, and other of our product categories through the Internet. Although we sell our products through the Internet, increased competition and promotional activity in the worldwide apparel, accessory, and home product industries from Internet-based competitors could reduce our sales, prices, and margins and adversely affect our business, results of operations, and financial condition. We also face intense competition from other domestic and foreign fashion-oriented apparel, footwear, accessory, and casual apparel producers that sell products through brick and mortar stores and wholesale and licensing channels. We compete with these companies primarily on the basis of:
• | anticipating and responding in a timely fashion to changing consumer demands and shopping preferences, including the increasing shift to digital brand engagement, social media communications, and online shopping; |
• | creating and maintaining favorable brand recognition, loyalty, and a reputation for quality; |
• | developing and producing innovative, high-quality products in sizes, colors, and styles that appeal to consumers of varying age groups; |
• | competitively pricing our products and creating an acceptable value proposition for consumers; |
• | providing strong and effective marketing support; |
• | obtaining sufficient retail floor space and effective presentation of our products at retail stores; |
• | attracting consumer traffic to both retail stores and websites; |
• | sourcing raw materials at cost-effective prices; |
• | anticipating and maintaining proper inventory levels; |
• | ensuring product availability and optimizing supply chain and distribution efficiencies with third-party manufacturers and retailers; |
• | recruiting and retaining key employees; |
• | maintaining and growing market share; and |
• | protecting our intellectual property. |
Some of our competitors may be significantly larger and more diversified and may have greater financial, marketing, and distribution resources, more desirable store locations, and/or greater digital commerce presence than us, among other competitive advantages. Such competitive advantages may enable them to better withstand unfavorable economic conditions, compete more effectively on the basis of price and production, and/or more quickly respond to rapidly changing fashion trends and consumer
24 | ||
demands than us. In addition, technological advances and the retail industry's low barriers to entry allow for the introduction of new competitors and products at a rapid pace.
Any increased competition, or our failure to adequately address any of these competitive factors, could result in reduced market share or sales, which could adversely affect our business, results of operations, and financial condition.
Our profitability may decline if we are unable to effectively manage inventory or as a result of increasing pressure on margins.
We have implemented key strategic initiatives designed to optimize our inventory levels and improve the efficiency and responsiveness of our supply chain. Although we have shortened lead times for the design, sourcing, and production of certain of our product lines, we expect to continue to place orders with our vendors for the majority of our products in advance of the related selling season. As a result, we are vulnerable to changes in consumer preferences and demand and pricing shifts. Our failure to continue to shorten lead times or to correctly anticipate consumer preferences and demand could result in the build-up of excess inventory. If that occurs, we may be forced to rely on less preferred distribution channels, markdowns, promotional sales, destruction, or donations to dispose of excess, slow-moving inventory, which may negatively impact our overall profitability and/or impair the image of our brands. Conversely, if we underestimate consumer demand for our products or if manufacturers fail to supply quality products in a timely manner, we may experience inventory shortages, which may negatively impact customer relationships, diminish brand loyalty, and result in lost sales. Any of these outcomes could have a material adverse effect on our business, results of operations, and financial condition.
Additionally, our industry is subject to significant pricing pressure caused by many factors, including intense competition and a highly promotional retail environment, consolidation in the retail industry, pressure from retailers to reduce the costs of products, and changes in consumer spending patterns. Although we have reduced our promotional activity in connection with our quality of sales initiatives, these factors may cause us to reduce our sales prices to retailers and consumers, which could cause our gross margin to decline if we are unable to appropriately manage inventory levels and/or otherwise offset price reductions with comparable reductions in our costs. If our sales prices decline and we fail to sufficiently reduce our product costs or operating expenses, our profitability will decline. This could have a material adverse effect on our business, results of operations, and financial condition. In addition, changes in our customer, channel, and geographic sales mix could have a negative impact on our profitability.
Our business is subject to risks associated with leasing real estate and other assets under long-term, non-cancellable leases.
We generally operate most of our retail stores and corporate facilities under long-term, non-cancellable leasing arrangements. Our retail store leases typically require us to make minimum rental payments, and often contingent rental payments based upon sales. In addition, our leases generally require us to pay our proportionate share of the cost of insurance, taxes, maintenance, and utilities. We generally cannot cancel our leases at our option. If we decide to close a store, or if we decide to downsize, consolidate, or relocate any of our corporate facilities, we may be required to record an impairment charge and/or exit costs associated with the disposal of the store or corporate facility. In addition, we may remain obligated under the applicable lease for, among other things, payment of the base rent for the remaining lease term, even after the space is exited. Such costs and obligations related to the early closure of our stores or termination of our leases, such as the recent closing of our Polo store at 711 Fifth Avenue in New York City, could have a material adverse effect on our business, results of operations, and financial condition. In addition, as each of our leases naturally expires, we may be unable to negotiate renewals, either on commercially acceptable terms or at all, which could lead store closures resulting in lost sales.
Economic, political, and other conditions may adversely affect the level of consumer purchases of discretionary items and luxury retail products, including our products.
The industries in which we operate are cyclical. Many economic and other factors outside of our control affect the level of consumer spending in the apparel, cosmetic, fragrance, accessory, jewelry, watch, and home product industries, including, among others:
• | actual and perceived economic conditions; |
• | employment levels and wage rates; |
• | stock market performance; |
• | inflation; |
• | interest rates; |
25 | ||
• | foreign currency exchange rates; |
• | the housing market; |
• | consumer debt levels; |
• | the availability of consumer credit; |
• | commodity prices, including fuel and energy costs; |
• | taxation; |
• | consumer confidence in future economic conditions; |
• | general domestic and international political conditions; |
• | the threat, outbreak, or escalation of terrorism, military conflicts, or other hostilities; and |
• | weather conditions. |
Consumer purchases of discretionary items and luxury retail products, including our products, tend to decline during recessionary periods and at other times when disposable income is lower. Unfavorable economic conditions and other factors may also reduce consumers' willingness and ability to travel to major cities and vacation destinations in which our stores are located. Further, consumers may prefer to spend more of their discretionary income on "experiences," such as dining and entertainment, over consumer goods. A downturn or an uncertain outlook in the economies in which we, or our wholesale and licensing partners, sell our products may materially adversely affect our business, results of operations, and financial condition. See Item 7 — "Management's Discussion and Analysis of Financial Condition and Results of Operations — Global Economic Conditions and Industry Trends" for further discussion.
A data security or privacy breach could damage our reputation and our relationships with our customers or employees, expose us to litigation risk, and adversely affect our business.
We are dependent on information technology systems and networks, including the Internet, for a significant portion of our direct-to-consumer sales, including our digital commerce operations and retail business credit card transaction authorization and processing. We are also responsible for storing data relating to our customers and employees and rely on third parties for the operation of our digital commerce websites and for the various social media tools and websites we use as part of our marketing strategy. In our normal course of business, we often collect, retain, and transmit certain sensitive and confidential customer information, including credit card information, over public networks. There is significant concern by consumers, employees, and lawmakers alike over the security of personal information transmitted over the Internet, consumer identity theft, and user privacy, as cyber-criminals are becoming increasingly more sophisticated in their attempts to gain unauthorized access to computer systems and confidential or sensitive data.
We have a longstanding information security risk program committed to regular risk management practices surrounding the protection of confidential data. This program includes various technical controls, including security monitoring, data leakage protection, network segmentation and access controls around the computer resources that house confidential or sensitive data. We have also implemented employee awareness training programs around phishing, malware, and other cyber risks. We continually evaluate the security environment surrounding the handling and control of our critical data, especially the private data we receive from our customers, employees and partners, and have instituted additional measures to help protect us from system intrusion or data breaches. Additionally, we have purchased network security and cyber liability insurance in order to provide a level of financial protection, should a data breach occur.
Despite the security measures we currently have in place, our facilities and systems and those of our third-party service providers may be vulnerable to security breaches, acts of vandalism, phishing attacks, computer viruses, misplaced or lost data, programming and/or human errors, or other Internet or email events. The increased use of smartphones, tablets, and other devices may also heighten these and other operational risks. The retail industry in particular continues to be the target of many cyber-attacks, which are becoming increasingly more difficult to anticipate and prevent due to their rapidly evolving nature. The technology we use to protect our systems from being breached or compromised could become outdated as a result of advances in computer capabilities or other technological developments. Additionally, measures we implement to protect our computer systems against cyber-attacks may make them harder to use or reduce the speed at which they operate, which in turn could negatively impact our customers' shopping experience resulting in reduced website traffic, diminished loyalty to our brands, and lost sales.
26 | ||
Any perceived or actual electronic or physical security breach involving the misappropriation, loss, or other unauthorized disclosure of confidential or personally identifiable information, including penetration of our network security, whether by us or by a third party, could disrupt our business, severely damage our reputation and our relationships with our customers or employees, expose us to risks of litigation, significant fines and penalties, and liability, and result in deterioration in our customers' and employees' confidence in us, and adversely affect our business, results of operations, and financial condition. Since we do not control third-party service providers and cannot guarantee that no electronic or physical computer break-ins and security breaches will occur in the future, any perceived or actual unauthorized disclosure of personally identifiable information regarding our employees, customers or website visitors could harm our reputation and credibility, result in lost sales, impair our ability to attract website visitors, and/or reduce our ability to attract and retain employees and customers. As these threats develop and grow, we may find it necessary to make significant further investments to protect data and our infrastructure, including the implementation of new computer systems or upgrades to existing systems, deployment of additional personnel and protection-related technologies, engagement of third-party consultants, and training of employees. In addition, as the regulatory environment relating to information security and privacy is becoming increasingly more demanding, we may also incur significant costs in complying with the various applicable state, federal, and foreign laws regarding protection of, and unauthorized disclosure of, personal information.
Risks and uncertainties associated with the implementation of information systems may negatively impact our business.
We are continually improving and upgrading our computer systems and software. For example, as part of a multi-year plan to integrate and upgrade our global systems and processes, we recently completed the migration of our European operations to SAP, the operating and financial reporting information technology system used by our North America operations. We also transitioned our North America digital commerce operations to a third-party cloud-based platform during Fiscal 2018, and we have plans to transition our other digital commerce operations during Fiscal 2019 and beyond.
Implementation of new information systems, such as the global operating and financial reporting system recently implemented, or the transition to a new digital commerce platform, involves risks and uncertainties. Any disruptions, delays, or deficiencies in the design, implementation, or transition of such systems could result in increased costs, disruptions in the sourcing, sale, and shipment of our product, delays in the collection of cash from our customers, and/or adversely affect our ability to accurately report our financial results in a timely manner, all of which could materially adversely affect our business, results of operations, and financial condition. For additional discussion of risks related to our information systems, see "Our business could suffer if our computer systems and websites are disrupted or cease to operate effectively."
Our business could suffer if our computer systems and websites are disrupted or cease to operate effectively.
We are dependent on our computer systems to record and process transactions and manage and operate our business, including in designing, marketing, manufacturing, importing, tracking, and distributing our products, processing payments, accounting for and reporting financial results, and managing our employees and employee benefit programs. We also utilize an automated replenishment system to facilitate the processing of basic replenishment orders from our retail business and our wholesale customers, the movement of goods through distribution channels, and the collection of information for planning and forecasting. In addition, we have digital commerce and other informational Internet websites in North America, Europe, and Asia, including Australia and New Zealand, and have plans for additional digital commerce sites in the future. Given the complexity of our business and the significant number of transactions that we engage in on a daily basis, it is imperative that we maintain uninterrupted operation of our computer hardware and software systems. Despite our preventative efforts, our systems are vulnerable to damage or interruption from, among other things, security breaches, computer viruses, technical malfunctions, inadequate system capacity, power outages, natural disasters, and usage errors by our employees or third-party consultants. If our information technology systems become damaged or otherwise cease to function properly, we may have to make significant investments to repair or replace them. Additionally, confidential or sensitive data related to our customers or employees could be lost or compromised. Any material disruptions in our information technology systems could have a material adverse effect on our business, results of operations, and financial condition.
Our ability to conduct business globally may be affected by a variety of legal, regulatory, political, and economic risks.
Our ability to capitalize on growth in new international markets and to maintain our current level of operations in our existing markets is subject to certain risks associated with operating in various locations around the globe. These include, but are not limited to:
• | complying with a variety of U.S. and foreign laws and regulations, including, but not limited to, trade, labor, and product safety trading restrictions, as well as the Foreign Corrupt Practices Act, which prohibits U.S. companies from making improper payments to foreign officials for the purpose of obtaining or retaining business, and similar |
27 | ||
foreign country laws, such as the U.K. Bribery Act, which prohibits U.K. and related companies from any form of bribery;
• | adapting to local customs and culture; |
• | unexpected changes in laws, judicial processes, or regulatory requirements; |
• | the imposition of additional duties, tariffs, taxes, and other charges or other barriers to trade; |
• | changes in diplomatic and trade relationships; |
• | political instability and terrorist attacks; and |
• | general economic fluctuations in specific countries or markets. |
Changes in regulatory, geopolitical, social, economic, or monetary policies and other factors may have a material adverse effect on our business in the future, or may require us to exit a particular market or significantly modify our current business practices. For example, there are growing concerns regarding trade relations between the U.S. and China, as both countries recently indicated their intention to impose significant tariffs on the importation of certain product categories. Although the U.S. has not proposed new tariffs on apparel-related imports, it had indicated that it was considering expanding the product categories that would be subject to new tariffs. As approximately one-third of our products are sourced from China, the U.S.'s imposition of new tariffs on apparel or other goods imported from China could have a material adverse effect on our cost of sales and profitability. Although we are actively reviewing options to mitigate this risk, including diverting production to other countries, there can be no assurance that we will be able to offset any increased costs through pricing actions or other means. For a discussion of risks associated with the importation of products, see "Our business is subject to risks associated with importing products and the ability of our manufacturers to produce our goods on time and to our specifications."
Our business could also be impacted by changes to the tax laws and regulations in the countries where we operate. For example, the Organisation for Economic Co-operation and Development, which represents a coalition of member countries, is supporting changes to numerous long-standing tax principles through its Base Erosion and Profit Shifting project, which is focused on a number of issues, including the shifting of profits among affiliated entities located in different tax jurisdictions. Taxing authorities of certain foreign jurisdictions may also decide to modify existing tax laws in response to the recently enacted U.S. tax legislation commonly referred to as the TCJA, as described in Item 1 — "Business — Recent Developments." We cannot predict which, if any, of these items will be enacted into law or the resulting impact any such enactment will have on our consolidated financial statements. However, if new legislation were enacted, it could have a material adverse effect on our business, results of operations, and financial condition. For a discussion of risks related to the TCJA, see "The impact to our business of recently enacted U.S. tax legislation could differ materially from our current estimates."
Additionally, in June 2016, voters in the United Kingdom approved an advisory referendum to withdraw from the European Union, commonly referred to as "Brexit." Subsequently, in March 2017, the United Kingdom's government invoked Article 50 of the Treaty on European Union, which formally triggered the two-year negotiation process to exit the European Union. Negotiations to determine the United Kingdom's future relationship with the European Union, including terms of trade, are complex and there can be no assurance regarding the terms or timing of any such arrangements. A withdrawal could significantly disrupt the free movement of goods, services, and people between the United Kingdom and the European Union, and result in increased legal and regulatory complexities, as well as potential higher costs of conducting business in Europe. The uncertainty surrounding the terms of the United Kingdom's withdrawal and its consequences could adversely impact consumer and investor confidence, and the level of consumer purchases of discretionary items and luxury retail products, including our products. Any of these effects, among others, could materially adversely affect our business, results of operations, and financial condition. Brexit has also contributed to significant volatility and uncertainty in global stock markets and currency exchange rates, and such volatility could continue to occur as the negotiation process progresses. For a discussion of risks related to currency exchange fluctuations, see "Our business is exposed to domestic and foreign currency fluctuations."
Our business is subject to risks associated with importing products and the ability of our manufacturers to produce our goods on time and to our specifications.
We do not own or operate any manufacturing facilities and depend exclusively on independent third parties for the manufacture of our products. Our products are manufactured to our specifications through arrangements with over 500 foreign manufacturers in various countries. In Fiscal 2018, over 97% of our products (by dollar value) were produced outside of the U.S., primarily in Asia, Europe, and Latin America. Risks inherent in importing our products include:
28 | ||
• | changes in social, political, and economic conditions or terrorist acts that could result in the disruption of trade from the countries in which our manufacturers or suppliers are located; |
• | the imposition of additional regulations, quotas, or safeguards relating to imports or exports, and costs of complying with such regulations and other laws relating to the identification and reporting of the sources of minerals used in our products; |
• | the imposition of additional duties, tariffs, taxes, and other charges on imports or exports; |
• | unfavorable changes in the availability, cost, or quality of raw materials and commodities; |
• | increases in the cost of labor, travel, and transportation; |
• | disruptions of shipping and international trade caused by natural and man-made disasters, labor strikes, or other unforeseen events; |
• | heightened terrorism-related security concerns, which could subject imported or exported goods to additional, more frequent, or more thorough inspections, leading to delays in the delivery of cargo; |
• | decreased scrutiny by customs officials for counterfeit goods, leading to lost sales, increased costs for our anti-counterfeiting measures, and damage to the reputation of our brands; |
• | pandemic and epidemic diseases, which could result in closed factories, reduced workforces, scarcity of raw materials, and scrutiny or embargoing of goods produced in infected areas; |
• | the imposition of anti-dumping or countervailing duty proceedings resulting in the potential assessment of special duties; and |
• | the imposition of sanctions in the form of additional duties either by the U.S. or its trading partners to remedy perceived illegal actions by national governments. |
Any one of these factors could have a material adverse effect on our business, results of operations, and financial condition. For a discussion of risks related to the potential imposition of additional regulations and laws, see "Our ability to conduct business globally may be affected by a variety of legal, regulatory, political, and economic risks."
In addition, the inability of a manufacturer to ship orders of our products in a timely manner or to meet our strict quality standards could cause us to miss the delivery date requirements of our customers for those items, which could result in cancellation of orders, refusal to accept deliveries, or a substantial reduction in purchase prices, any of which could have a material adverse effect on our business, results of operations, and financial condition. Prices of raw materials used to manufacture our products may also fluctuate, and increases in prices of such raw materials could have a material adverse effect on our cost of sales. Furthermore, the cost of labor at many of our third-party manufacturers has been increasing significantly and, as the middle class in developing countries such as China continues to grow, it is unlikely that such cost pressure will abate. The cost of transportation remains significant as well, and it is likely that such cost will fluctuate significantly if oil prices remain volatile. We may not be able to offset such increases in raw materials, freight, or labor costs through pricing actions or other means.
Fluctuations in our tax obligations and effective tax rate may result in volatility of our operating results.
We are subject to income taxes in many U.S. and certain foreign jurisdictions, with the applicable tax rates varying by jurisdiction. We record tax expense based on our estimates of future payments, which include reserves for uncertain tax positions in multiple tax jurisdictions. At any one time, multiple tax years are subject to audit by various taxing authorities. The results of these audits and negotiations with taxing authorities may affect the ultimate settlement of these issues. As a result, we expect that throughout the year there could be ongoing variability in our quarterly tax rates as events occur and exposures are evaluated. Our effective tax rate in a given financial statement period may also be materially impacted by changes in the mix and level of earnings by jurisdiction or by changes to existing accounting rules. For example, Accounting Standards Update ("ASU") No. 2016-09, "Improvements to Employee Share-Based Payment Accounting" ("ASU 2016-09"), which became effective for our Company during the first quarter of Fiscal 2018, has resulted in, and is expected to continue to result in, increased volatility in the provision of income taxes. See Note 4 to the accompanying consolidated financial statements for further discussion of ASU 2016-09.
In addition, the tax laws and regulations in the countries where we operate may change, such as the recently enacted U.S. tax legislation commonly referred to as the TCJA, or there may be changes in interpretation and enforcement of existing tax laws, which could materially affect our income tax expense in our consolidated financial statements. For a discussion of risks related
29 | ||
to the potential imposition of additional regulations and laws, see "Our ability to conduct business globally may be affected by a variety of legal, regulatory, political, and economic risks" and "The impact to our business of recently enacted U.S. tax legislation could differ materially from our current estimates."
The impact to our business of recently enacted U.S. tax legislation could differ materially from our current estimates.
On December 22, 2017, President Trump signed into law new tax legislation commonly referred to as the TCJA, as described in Item 1 — "Business — Recent Developments." The TCJA is complex and widely considered to be the most significant overhaul to the U.S. federal tax code since 1986.
Although we expect the TCJA will ultimately benefit our results of operations and financial condition in future periods, primarily due to it reducing the U.S. federal statutory income tax rate from 35% to 21%, its enactment resulted in the recognition of net charges of $221.4 million within our income tax provision during Fiscal 2018. These charges were recorded on a provisional basis, as permitted by SAB 118, based on our present interpretations of the TCJA, current available information, and assumptions about future events. Although we believe these provisional amounts represent a reasonable estimate of the ultimate enactment-related impact the TCJA will have on our consolidated financial statements, the amounts could be adjusted materially as additional information becomes available and further analyses are completed. The impact of the TCJA to our business in future periods is also subject to a variety of factors beyond our control including, but not limited to, (i) potential amendments to the TCJA; (ii) potential changes to state, local, and foreign tax laws in response to the TCJA; and (iii) potential new or interpretative guidance issued by the Financial Accounting Standards Board or the Internal Revenue Service and other tax agencies. Any of these factors could cause our actual results to differ materially from our current expectations and/or investors' expectations and there can be no assurance that the TCJA will ultimately benefit our business, results of operations, and financial condition in future periods.
Our business is exposed to domestic and foreign currency fluctuations.
Our business is exposed to foreign currency exchange risk. Specifically, changes in exchange rates between the U.S. dollar and other currencies impact our financial results from a transactional perspective, as our foreign operations generally purchase inventory in U.S. dollars, as is common for most apparel companies. Given that we source most of our products overseas, the cost of these products may be affected by changes in the value of the relevant currencies. Changes in currency exchange rates may also impact consumers' willingness or ability to travel abroad and/or purchase our products while traveling, as well as affect the U.S. Dollar value of the foreign currency denominated prices at which our international businesses sell products. Additionally, the operating results and financial position of our international subsidiaries are exposed to foreign exchange rate fluctuations as their financial results are translated from the respective local currency into U.S. Dollars during the financial statement consolidation process. The foreign currencies to which we are exposed to from a transactional and translational perspective primarily include the Euro, the Japanese Yen, the South Korean Won, the Australian Dollar, the Canadian Dollar, the British Pound Sterling, the Swiss Franc, the Swedish Krona, the Chinese Renminbi, the New Taiwan Dollar, and the Hong Kong Dollar. The expansion of our international business increases our exposure to foreign currency exchange risk.
Although we hedge certain exposures to changes in foreign currency exchange rates arising in the ordinary course of business, we cannot fully anticipate all of our currency exposures and therefore foreign currency fluctuations may have a material adverse impact on our business, results of operations, and financial condition. In addition, factors that could impact the effectiveness of our hedging activities include the volatility of currency markets, the accuracy of forecasted transactions, and the availability of hedging instruments. As such, our hedging activities may not completely mitigate the impact of foreign currency fluctuations on our results of operations. See Item 7 — "Management's Discussion and Analysis of Financial Condition and Results of Operations — Market Risk Management."
A substantial portion of our revenue is derived from a limited number of large wholesale customers. Our business could be adversely affected as a result of consolidations, liquidations, restructurings, other ownership changes in the retail industry, and/or any financial instability of our large wholesale customers.
Several of our department store customers, including some under common ownership, account for a significant portion of our wholesale net sales. A substantial portion of sales of our licensed products by our domestic licensing partners are also made to our largest department store customers. During Fiscal 2018, sales to our largest wholesale customer, Macy's, accounted for approximately 8% of total net revenues. Further, sales to our three largest wholesale customers, including Macy's, accounted for approximately 19% of total net revenues for Fiscal 2018, and constituted approximately 29% of our total gross trade accounts receivable outstanding as of March 31, 2018. Substantially all sales to our three largest wholesale customers related to our North America segment.
30 | ||
We typically do not enter into long-term agreements with our customers. Instead, we enter into a number of purchase order commitments with our customers for each of our product lines every season. A decision by the controlling owner of a group of stores or any other significant customer, whether motivated by competitive conditions, financial difficulties, or otherwise, to decrease or eliminate the amount of merchandise purchased from us or our licensing partners or to change their manner of doing business with us or our licensing partners or their new strategic and operational initiatives, including their continued focus on further development of their "private label" initiatives, could have a material adverse effect on our business, results of operations, and financial condition.
In addition, as a result of unfavorable economic conditions, certain of our large wholesale customers, particularly those located in the U.S., have been highly promotional in recent years and have aggressively marked down their merchandise, including our products. Such promotional activity could negatively impact our brand image and/or lead to requests from those customers for increased markdown allowances at the end of the season, which could have a material adverse effect on our business, results of operations, and financial condition. In response and in connection with our growth plan, we began to strategically reduce shipments to certain of our customers during Fiscal 2018.
The department store sector has also experienced numerous consolidations, restructurings, reorganizations, and other ownership changes in recent years. Any such actions in the future could result in a reduction in the number of stores that carry our products, and the stores that remain open may purchase fewer of our products and/or reduce the retail floor space designated to our brands. There can be no assurance that consolidations, restructurings, reorganizations, or other ownership changes in the department store sector will not have a material adverse effect on our business, results of operations, and financial condition.
We sell our wholesale merchandise primarily to major department stores across North America, Europe, Asia, Australia, and Latin America, and extend credit based on an evaluation of each wholesale customer's financial condition, usually without requiring collateral. However, the financial difficulties of a wholesale customer could cause us to limit or eliminate our business with that customer. We may also assume more credit risk relating to that customer's receivables. Our inability to collect on our trade accounts receivable from any one of these customers could have a material adverse effect on our business, results of operations, and financial condition. See Item 1 — "Business — Wholesale Credit Control."
Economic conditions could have a negative impact on our major customers, suppliers, vendors, and lenders, which in turn could materially adversely affect our business.
Although we believe that our cash provided by operations and available borrowing capacity under our credit facilities and commercial paper borrowing program will provide us with sufficient liquidity, the impact of economic conditions on our major customers, suppliers, vendors, and lenders and their ability to access global capital markets cannot be predicted. The inability of major manufacturers to ship our products could impair our ability to meet the delivery date requirements of our customers. Deterioration in global financial markets could affect our ability to access sources of liquidity to provide for our future cash needs, increase the cost of any future financing, or cause our lenders to be unable to meet their funding commitments under our credit facilities. A disruption in the ability of our significant customers to access liquidity could cause serious disruptions or an overall deterioration of their businesses which could lead to a significant reduction in their future orders of our products and the inability or failure on their part to meet their payment obligations to us, any of which could have a material adverse effect on our business, results of operations, and financial condition.
Our business could suffer if we need to replace manufacturers or distribution centers.
We do not own or operate any manufacturing facilities and depend exclusively on independent third parties for the manufacture of our products. We compete with other companies for the production capacity of our manufacturers. Some of these competitors have greater financial and other resources than we have, and thus may have an advantage in securing production capacity. If we experience a significant increase in demand, or if an existing manufacturer of ours must be replaced, we may have to expand our third-party manufacturing capacity. We cannot guarantee that this additional capacity will be available when required on terms that are acceptable to us. See Item 1 — "Business — Sourcing, Production and Quality." We enter into a number of purchase order commitments each season specifying a time for delivery, method of payment, design and quality specifications, and other standard industry provisions, but do not have long-term contracts with any manufacturer. None of the manufacturers we use produce our products exclusively.
In addition, we rely on a number of owned and independently-operated distribution facilities around the world to warehouse and ship products to our customers and perform other related logistic services. Our ability to meet the needs of our customers depends on the proper operation of these distribution centers. If any of our distribution centers were closed or were to become inoperable or inaccessible for any reason, we could experience a substantial loss of inventory, disruption of deliveries to our customers and our retail stores, increased costs, and longer lead times associated with the distribution of products during the period
31 | ||
that would be required to reopen or replace the facility. These disruptions could have a material adverse effect on our business, results of operations, and financial condition.
Our business could be adversely affected by natural disasters and other catastrophic events in the locations in which we or our customers or suppliers operate.
We have operations, including retail, distribution, and warehousing operations, in locations subject to natural disasters, such as severe weather, geological events, and epidemic diseases, and other catastrophic events, such as terrorist attacks and military conflict, any of which could disrupt our operations. In addition, our customers and suppliers also have operations in these locations and could experience similar disruptions. The occurrence of natural disasters or other catastrophic events may result in sudden disruptions in the business operations of the local economies affected, as well as of the regional and global economies. In addition, our business can be affected by unseasonable weather conditions, such as extended periods of unseasonably warm temperatures in the winter or unseasonably cold temperatures in the summer. Any of these events could result in decreased demand for our products and disruptions in our sales channels and manufacturing and distribution networks, which could have a material adverse effect on our business, results of operations, and financial condition.
Our trademarks and other intellectual property rights may not be adequately protected outside the U.S.
We believe that our trademarks, intellectual property, and other proprietary rights are extremely important to our success and our competitive position. We devote substantial resources to the establishment and protection of our trademarks and anti-counterfeiting activities worldwide. However, significant counterfeiting and imitation of our products continues to exist. In the course of our international expansion we have experienced conflicts with various third parties that have acquired or claimed ownership rights to some of our key trademarks that include Polo and/or a representation of a polo player astride a horse, or otherwise have contested our rights to our trademarks. We have resolved certain of these conflicts through both legal action and negotiated settlements. We cannot guarantee that the actions we have taken to establish and protect our trademarks and other proprietary rights will be adequate to prevent counterfeiting, lost business, or brand dilution, any of which may have a material adverse effect on our business. We expect to continue to devote substantial resources to challenge brands arising from imitation of our products. Also, there can be no assurance that others will not assert rights in, or ownership of, trademarks and other proprietary rights of ours or that we will be able to successfully resolve these types of conflicts to our satisfaction or at all. In addition, the laws of certain foreign countries do not protect trademarks or other proprietary rights to the same extent as do the laws of the U.S. and, as a result, our intellectual property may be more vulnerable and difficult to protect in such countries. See Item 1 — "Business — Trademarks," and Item 3 — "Legal Proceedings."
Our business could suffer if we fail to comply with labor laws or if one of our manufacturers fails to use acceptable labor or environmental practices.
We are subject to labor laws governing relationships with employees, including minimum wage requirements, overtime, working conditions, and citizenship requirements. Compliance with these laws may lead to increased costs and operational complexity and may increase our exposure to governmental investigations or litigation.
In addition, we require our licensing partners and independent manufacturers to operate in compliance with applicable laws and regulations. While our internal and vendor operating guidelines promote ethical business practices and our employees periodically visit and monitor the operations of our independent manufacturers, we do not control these manufacturers or their labor practices. The violation of labor, environmental, or other laws by an independent manufacturer used by us or one of our licensing partners, or the divergence of an independent manufacturer's or licensing partner's labor or environmental practices from those generally accepted as ethical or appropriate in the U.S., could interrupt or otherwise disrupt the shipment of finished products to us or damage our reputation. Any of these events, in turn, could have a material adverse effect on our business, results of operations, and financial condition.
Certain legal proceedings, regulatory matters, and accounting changes could adversely affect our business.
We are involved in certain legal proceedings and regulatory matters and are subject from time to time to various claims involving alleged breach of contract claims, intellectual property and other related claims, escheatment and unclaimed property, credit card fraud, security breaches in certain of our retail store information systems, employment issues, consumer matters, and other litigation. Certain of these lawsuits and claims, if decided adversely to us or settled by us, could result in material liability to our Company or have a negative impact on our reputation or relations with our employees, customers, licensees, or other third parties. In addition, regardless of the outcome of any litigation or regulatory proceedings, such proceedings could result in substantial costs and may require our Company to devote substantial time and resources to defend itself. Further, changes in governmental regulations both in the U.S. and in other countries where we conduct business operations could have an adverse impact on our
32 | ||
business, results of operations, and financial condition. See Item 3 — "Legal Proceedings" for further discussion of our Company's legal matters.
In addition, we are subject to changes in accounting rules and interpretations issued by the Financial Accounting Standards Board and other regulatory agencies. If and when effective, such changes to accounting standards could have a material impact on our consolidated financial statements. See Note 4 to the accompanying consolidated financial statements for a description of certain recently issued or proposed accounting standards.
The trading prices of our securities periodically may rise or fall based on the accuracy of predictions of our earnings or other financial performance, including our ability to return value to shareholders.
Our business planning process is designed to maximize our long-term strength, growth, and profitability, and not to achieve an earnings target in any particular fiscal quarter. We believe that this longer-term focus is in the best interests of our Company and our stockholders. At the same time, however, we recognize that, from time to time, it may be helpful to provide investors with guidance as to our quarterly and annual forecast of net sales and earnings. While we generally expect to provide updates to our guidance when we report our results each fiscal quarter, we do not have any responsibility to update any of our forward-looking statements at such times or otherwise. In addition, any longer-term guidance that we provide is based on goals that we believe, at the time guidance is given, are reasonably attainable. However, such long-range targets are more difficult to predict than our current quarter and full fiscal year expectations. If, or when, we announce actual results that differ from those that have been predicted by us, outside analysts, or others, the market price of our securities could be adversely affected. Investors who rely on these predictions when making investment decisions with respect to our securities do so at their own risk. We take no responsibility for any losses suffered as a result of such changes in the prices of our securities.
In addition, we periodically return value to shareholders through our payment of quarterly cash dividends and common stock share repurchases. Investors may have an expectation that we will continue to pay quarterly cash dividends, further increase our cash dividend rate, and/or repurchase shares available under our Class A common stock repurchase program. Our ability to pay quarterly cash dividends and repurchase our Class A common stock will depend on our ability to generate sufficient cash flows from operations in the future. This ability may be subject to certain economic, financial, competitive, and other factors that are beyond our control. Further, our Board of Directors may, at its discretion, elect to suspend or otherwise alter these programs at any time. The market price of our securities could be adversely affected if our cash dividend payments and/or Class A common stock share repurchase activity differ from investors' expectations.
The voting shares of our Company's stock are concentrated in one majority stockholder.
As of March 31, 2018, Mr. Ralph Lauren, or entities controlled by the Lauren family, held approximately 82% of the voting power of the outstanding common stock of our Company. In addition, Mr. R. Lauren serves as our Executive Chairman and Chief Creative Officer, Mr. R. Lauren's son, Mr. David Lauren, serves as our Chief Innovation Officer, Strategic Advisor to the CEO, and Vice Chairman of the Board of Directors, and we employ other members of the Lauren family. From time to time, we may have other business dealings with Mr. R. Lauren, members of the Lauren family, or entities affiliated with Mr. R. Lauren or the Lauren family. As a result of his stock ownership and position in our Company, Mr. R. Lauren has the ability to exercise significant control over our business, including, without limitation, (i) the election of our Class B common stock directors, voting separately as a class and (ii) any action requiring the approval of our stockholders, including the adoption of amendments to our certificate of incorporation and the approval of mergers or sales of all or substantially all of our assets.
We rely on our licensing partners to preserve the value of our licenses. Failure to maintain licensing partners could harm our business.
The risks associated with our own products also apply to our licensed products in addition to any number of possible risks specific to a licensing partner's business, including risks associated with a particular licensing partner's ability to:
• | obtain capital; |
• | execute its business plans; |
• | manage its labor relations; |
• | maintain relationships with its suppliers and customers; and |
• | manage its credit and bankruptcy risks effectively. |
33 | ||
Although a number of our license agreements prohibit our licensing partners from entering into licensing arrangements with our competitors, our licensing partners generally are not precluded from offering, under other non-competitor brands, the types of products covered by their license agreements with us. A substantial portion of sales of our products by our domestic licensing partners are also made to our largest customers. While we have significant control over our licensing partners' products and advertising, we rely on our licensing partners for, among other things, operational and financial control over their businesses. Changes in management, reduced sales of licensed products, poor execution, or financial difficulties with respect to any of our licensing partners could adversely affect our revenues, both directly from reduced licensing revenue received and indirectly from reduced sales of our other products.
Although we believe that we could replace our existing licensing partners in most circumstances, if necessary, our inability to do so for any period of time could adversely affect our revenues, both directly from reduced licensing revenue received and indirectly from reduced sales of our other products. See Item 1 — "Business — Our Licensing Business."
Item 1B. | Unresolved Staff Comments. |
Not applicable.
Item 2. | Properties. |
We lease space for our retail stores, showrooms, warehouses, and offices in various domestic and international locations. We do not own any real property except for our distribution facility and an adjacent parcel of land in Greensboro, North Carolina; our retail digital commerce call center and distribution facility in High Point, North Carolina; and our retail stores in Southampton and Easthampton, New York, and Nantucket, Massachusetts.
We believe that our existing facilities are well maintained, in good operating condition, and are adequate for our present level of operations.
The following table sets forth information relating to our key properties as of March 31, 2018:
Location | Use | Approximate Square Feet | ||
Greensboro, NC | Wholesale and retail distribution facility | 1,300,000 | ||
NC Highway 66, High Point, NC | Wholesale and retail distribution facility | 847,000 | ||
N. Pendleton Street, High Point, NC | Retail digital commerce call center and distribution facility | 805,000 | ||
625 Madison Avenue, NYC | Corporate offices and showrooms | 362,000 | ||
Eagle Hill Drive, High Point, NC | Wholesale distribution facility | 343,000 | ||
650 Madison Avenue, NYC | Executive and corporate offices, design studio, and showrooms | 270,000 | ||
Lyndhurst, NJ | Corporate and retail administrative offices | 178,000 | ||
601 West 26th Street, NYC | Corporate offices | 137,800 | ||
Geneva, Switzerland | European corporate offices | 107,000 | ||
7th Avenue, NYC | Corporate offices, design studio, and Women's showrooms | 104,000 | ||
Manhattan Place, Hong Kong | Asia sourcing offices | 46,000 | ||
Gateway Office, Hong Kong | Asia corporate offices | 37,500 | ||
888 Madison Avenue, NYC | Retail flagship store | 37,900 | ||
N. Michigan Avenue, Chicago | Retail flagship store | 37,500 | ||
New Bond Street, London, UK | Retail flagship store | 31,500 | ||
867 Madison Avenue, NYC | Retail flagship store | 27,700 | ||
Paris, France | Retail flagship store | 25,700 | ||
Tokyo, Japan | Retail flagship store | 25,000 | ||
N. Rodeo Drive, Beverly Hills | Retail flagship store | 19,400 | ||
Regent Street, London, UK | Retail flagship store | 19,000 | ||
34 | ||
As of March 31, 2018, we directly operated 472 retail stores, totaling approximately 3.8 million square feet. We anticipate that we will be able to extend our retail store leases, as well as those leases for our non-retail facilities, which expire in the near future on satisfactory terms or relocate to desirable alternate locations. We generally lease our freestanding retail stores for initial periods ranging from 5 to 15 years, with renewal options. See Item 1A — "Risk Factors — Our business is subject to risks associated with leasing real estate and other assets under long-term, non-cancellable leases."
Item 3. | Legal Proceedings. |
We are involved, from time to time, in litigation, other legal claims, and proceedings involving matters associated with or incidental to our business, including, among other things, matters involving credit card fraud, trademark and other intellectual property, licensing, importation and exportation of products, taxation, unclaimed property, and employee relations. We believe at present that the resolution of currently pending matters will not individually or in the aggregate have a material adverse effect on our consolidated financial statements. However, our assessment of any litigation or other legal claims could potentially change in light of the discovery of facts not presently known or determinations by judges, juries, or other finders of fact which are not in accord with management's evaluation of the possible liability or outcome of such litigation or claims.
Item 4. | Mine Safety Disclosures. |
Not applicable.
35 | ||
PART II
Item 5. | Market for Registrant's Common Equity, Related Stockholder Matters and Issuer Purchases of Equity Securities. |
Our Class A common stock is traded on the New York Stock Exchange ("NYSE") under the symbol "RL." The following table sets forth the high and low sales prices per share of our Class A common stock, as reported on the NYSE Composite Tape, and the cash dividends per common share declared for each quarterly period in our two most recent fiscal years:
Market Price of Class A Common Stock | Dividends Declared per Common Share | |||||||||||
High | Low | |||||||||||
Fiscal 2018: | ||||||||||||
First Quarter | $ | 84.47 | $ | 66.06 | $ | 0.50 | ||||||
Second Quarter | 92.55 | 70.36 | 0.50 | |||||||||
Third Quarter | 105.52 | 83.26 | 0.50 | |||||||||
Fourth Quarter | 119.33 | 100.09 | 0.50 | |||||||||
Fiscal 2017: | ||||||||||||
First Quarter | $ | 98.50 | $ | 83.66 | $ | 0.50 | ||||||
Second Quarter | 109.85 | 87.26 | 0.50 | |||||||||
Third Quarter | 114.00 | 89.24 | 0.50 | |||||||||
Fourth Quarter | 93.05 | 75.62 | 0.50 | |||||||||
Since 2003, we have maintained, and intend to continue to maintain, a regular quarterly cash dividend program on our common stock. However, any decision to declare and pay dividends in the future will be made at the discretion of our Board of Directors and will depend on our results of operations, cash requirements, financial condition, and other factors that the Board of Directors may deem relevant.
As of May 18, 2018, there were 694 holders of record of our Class A common stock and 6 holders of record of our Class B common stock. All of our outstanding shares of Class B common stock are owned by Mr. Ralph Lauren, Executive Chairman and Chief Creative Officer, and entities controlled by the Lauren family. Shares of our Class B common stock may be converted immediately into Class A common stock on a one-for-one basis by the holder. There is no cash or other consideration paid by the holder converting the shares and, accordingly, there is no cash or other consideration received by the Company. The shares of Class A common stock issued by the Company in such conversions are exempt from registration pursuant to Section 3(a)(9) of the Securities Act of 1933, as amended. No shares of our Class B common stock were converted into Class A common stock during the fiscal quarter ended March 31, 2018.
The following table sets forth repurchases of shares of our Class A common stock during the fiscal quarter ended March 31, 2018:
Total Number of Shares Purchased(a) | Average Price Paid per Share | Total Number of Shares Purchased as Part of Publicly Announced Plans or Programs | Approximate Dollar Value of Shares That May Yet Be Purchased Under the Plans or Programs(b) | |||||||||||
(millions) | ||||||||||||||
December 31, 2017 to January 27, 2018 | — | $ | — | — | $ | 100 | ||||||||
January 28, 2018 to February 24, 2018 | 639 | 116.20 | — | 100 | ||||||||||
February 25, 2018 to March 31, 2018 | 7,098 | 108.46 | — | 100 | ||||||||||
7,737 | — | |||||||||||||
(a) | Represents shares surrendered to or withheld by the Company in satisfaction of withholding taxes in connection with the vesting of awards issued under its long-term stock incentive plans. |
(b) | Repurchases of shares of Class A common stock are subject to overall business and market conditions. |
36 | ||
The following graph compares the cumulative total stockholder return (stock price appreciation plus dividends) on our Class A common stock to the cumulative total return of the Standard & Poor's 500 Index and a peer group index of companies that we believe are closest to ours (the "Peer Group") for the period from March 30, 2013, the last day of our 2013 fiscal year, through March 31, 2018, the last day of our 2018 fiscal year. Our Peer Group consists of Burberry Group PLC, Compagnie Financière Richemont SA, The Estée Lauder Companies Inc., Hermes International, Kering, Luxottica Group, LVMH, PVH Corp., Tapestry, Inc., Tiffany & Co., Tod's S.p.A., and V.F. Corporation. All calculations for foreign companies in our Peer Group are performed using the local foreign issue of such companies. The returns are calculated by assuming a $100 investment on March 30, 2013 in Class A common stock or March 31, 2013 in an index, with all dividends reinvested.
COMPARISON OF 5 YEAR CUMULATIVE TOTAL RETURN
Among Ralph Lauren Corporation, the S&P 500 Index, and a Peer Group
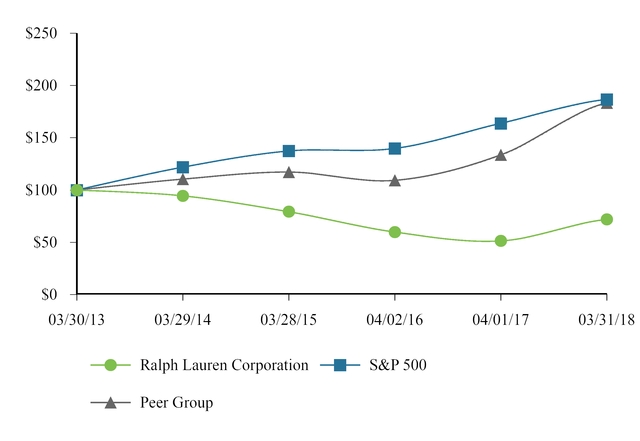
Item 6. | Selected Financial Data |
See the "Index to Consolidated Financial Statements and Supplementary Information," and specifically "Selected Financial Information" appearing at the end of this Annual Report on Form 10-K. This selected financial data should be read in conjunction with Item 7 — "Management's Discussion and Analysis of Financial Condition and Results of Operations" and Item 8 — "Financial Statements and Supplementary Data" included in this Annual Report on Form 10-K. Historical results may not be indicative of future results.
37 | ||
Item 7. | Management's Discussion and Analysis of Financial Condition and Results of Operations. |
The following management's discussion and analysis of financial condition and results of operations ("MD&A") should be read together with our audited consolidated financial statements and notes thereto, which are included in this Annual Report on Form 10-K. We utilize a 52-53 week fiscal year ending on the Saturday closest to March 31. As such, Fiscal 2018 ended on March 31, 2018 and was a 52-week period; Fiscal 2017 ended on April 1, 2017 and was a 52-week period; Fiscal 2016 ended on April 2, 2016 and was a 53-week period; and Fiscal 2019 will end on March 30, 2019 and will be a 52-week period.
INTRODUCTION
MD&A is provided as a supplement to the accompanying consolidated financial statements and notes thereto to help provide an understanding of our results of operations, financial condition, and liquidity. MD&A is organized as follows:
• | Overview. This section provides a general description of our business, global economic conditions and industry trends, and a summary of our financial performance for Fiscal 2018. In addition, this section includes a discussion of recent developments and transactions affecting comparability that we believe are important in understanding our results of operations and financial condition, and in anticipating future trends. |
• | Results of operations. This section provides an analysis of our results of operations for Fiscal 2018 and Fiscal 2017 as compared to the respective prior fiscal year. |
• | Financial condition and liquidity. This section provides a discussion of our financial condition and liquidity as of March 31, 2018, which includes (i) an analysis of our financial condition as compared to the prior fiscal year-end; (ii) an analysis of changes in our cash flows for Fiscal 2018 and Fiscal 2017 as compared to the respective prior fiscal year; (iii) an analysis of our liquidity, including the availability under our commercial paper borrowing program and credit facilities, common stock repurchases, payments of dividends, and our outstanding debt and covenant compliance; and (iv) a summary of our contractual and other obligations as of March 31, 2018. |
• | Market risk management. This section discusses how we manage our risk exposures related to foreign currency exchange rates, interest rates, and our investments as of March 31, 2018. |
• | Critical accounting policies. This section discusses accounting policies considered to be important to our results of operations and financial condition, which typically require significant judgment and estimation on the part of management in their application. In addition, all of our significant accounting policies, including our critical accounting policies, are summarized in Note 3 to the accompanying consolidated financial statements. |
• | Recently issued accounting standards. This section discusses the potential impact on our reported results of operations and financial condition of certain accounting standards that have been recently issued or proposed. |
OVERVIEW
Our Business
Our Company is a global leader in the design, marketing, and distribution of premium lifestyle products, including apparel, accessories, home furnishings, and other licensed product categories. Our long-standing reputation and distinctive image have been developed across an expanding number of products, brands, sales channels, and international markets. Our brand names include Ralph Lauren, Ralph Lauren Collection, Ralph Lauren Purple Label, Polo Ralph Lauren, Double RL, Lauren Ralph Lauren, Polo Ralph Lauren Children, Chaps, and Club Monaco, among others.
We diversify our business by geography (North America, Europe, and Asia, among other regions) and channels of distribution (wholesale, retail, and licensing). This allows us to maintain a dynamic balance as our operating results do not depend solely on the performance of any single geographic area or channel of distribution. Our wholesale sales are made principally to major department stores and specialty stores around the world. We also sell directly to consumers through our integrated retail channel, which includes our retail stores, concession-based shop-within-shops, and digital commerce operations around the world. In addition, we license to unrelated third parties for specified periods the right to operate retail stores and/or to use our various trademarks in connection with the manufacture and sale of designated products, such as certain apparel, eyewear, fragrances, and home furnishings.
38 | ||
We organize our business into the following three reportable segments:
• | North America — Our North America segment, representing approximately 52% of our Fiscal 2018 net revenues, primarily consists of sales of our Ralph Lauren branded products made through our wholesale and retail businesses in the U.S. and Canada, excluding Club Monaco. In North America, our wholesale business is comprised primarily of sales to department stores, and to a lesser extent, specialty stores. Our retail business in North America is comprised of our Ralph Lauren stores, our factory stores, and our digital commerce site, www.RalphLauren.com. |
• | Europe — Our Europe segment, representing approximately 26% of our Fiscal 2018 net revenues, primarily consists of sales of our Ralph Lauren branded products made through our wholesale and retail businesses in Europe and the Middle East, excluding Club Monaco. In Europe, our wholesale business is comprised of a varying mix of sales to both department stores and specialty stores, depending on the country. Our retail business in Europe is comprised of our Ralph Lauren stores, our factory stores, our concession-based shop-within-shops, and our various digital commerce sites. |
• | Asia — Our Asia segment, representing approximately 15% of our Fiscal 2018 net revenues, primarily consists of sales of our Ralph Lauren branded products made through our wholesale and retail businesses in Asia, Australia, and New Zealand. Our retail business in Asia is comprised of our Ralph Lauren stores, our factory stores, and our concession-based shop-within-shops. In addition, we sell our products through various third-party digital partner commerce sites. In Asia, our wholesale business is comprised primarily of sales to department stores, with related products distributed through shop-within-shops. |
In addition to these reportable segments, we also have other non-reportable segments, representing approximately 7% of our Fiscal 2018 net revenues, which primarily consist of (i) sales of Club Monaco branded products made through our retail businesses in the U.S., Canada, and Europe, and our licensing alliances in Europe and Asia, (ii) sales of Ralph Lauren branded products made through our wholesale business in Latin America, and (iii) royalty revenues earned through our global licensing alliances, excluding Club Monaco.
Approximately 45% of our Fiscal 2018 net revenues were earned outside of the U.S. See Note 19 to the accompanying consolidated financial statements for further discussion of our segment reporting structure.
Our business is typically affected by seasonal trends, with higher levels of wholesale sales in our second and fourth fiscal quarters and higher retail sales in our second and third fiscal quarters. These trends result primarily from the timing of seasonal wholesale shipments and key vacation travel, back-to-school, and holiday shopping periods impacting our retail business.
Global Economic Conditions and Industry Trends
The global economy and our industry are impacted by many different influences. Most recently, the U.S. enacted new tax legislation known as the TCJA (as defined within "Recent Developments"), which is intended to stimulate economic growth and capital investment in the U.S. by, among its other provisions, lowering tax rates for both corporations and individuals alike. Certain other worldwide events, including political unrest, acts of terrorism, monetary policy changes, and currency and commodity price changes, increase volatility in the global economy. In addition, the current domestic and international political environment, including potential changes to other U.S. policies related to global trade, immigration, and healthcare, have also resulted in uncertainty surrounding the future state of the global economy. As our international business continues to grow, and because the majority of our products are produced outside of the U.S., major changes in global tax policies or trade relations could have a material adverse effect on our business or operating results. Our results also have been, and are expected to continue to be, impacted by foreign exchange rate fluctuations.
In addition, the retail landscape in which we operate is evolving, with consumers continuing to diversify the channels in which they transact and shifting their shopping preference from physical stores to online. This, along with other factors, has resulted in many retailers, including certain of our large wholesale customers, becoming highly promotional and aggressively marking down their merchandise in an attempt to offset declines in physical store traffic. The retail industry, particularly in the U.S., has also experienced numerous bankruptcies, restructurings, and ownership changes in recent years. Certain of our operations, including our North America wholesale business, have been negatively impacted by these dynamics. The continuation of these industry trends could further impact consumer spending and consumption behavior in our industry, which could have a material adverse effect on our business or operating results. Additionally, changes in economic conditions, including those that may result from the TCJA, can further impact consumer discretionary income levels and spending. While we are optimistic that the TCJA will stimulate economic growth, it is still too early to determine the resulting impact on consumer spending and consumption behavior.
39 | ||
We have implemented various operating strategies globally to help address many of these current challenges, and continue to build a foundation for long-term profitable growth centered around strengthening our consumer-facing areas of product, stores, and marketing across channels and driving a more efficient operating model. In connection with these strategies, we are taking deliberate actions to ensure promotional consistency across channels and enhance the overall brand and shopping experience, including reducing shipments to better align with underlying demand and lower inventory levels. Additionally, we are optimizing our wholesale distribution channel, and closed approximately 25% of our underperforming U.S. department store points of distribution during Fiscal 2018. Further, in October 2017, we began to shift to a more cost-effective and flexible platform for our directly operated digital businesses, which is expected to deliver a more brand-enhancing and consistent customer experience across our global digital ecosystem. See our restructuring activities as described within "Recent Developments" below for further discussion. Although the investments that we are making in our business and our quality of sales initiatives may create operating profit pressure in the near-term, we expect that these initiatives will create longer-term shareholder value.
We will continue to monitor these conditions and trends and evaluate and adjust our operating strategies and foreign currency and cost management opportunities to help mitigate the related impact on our results of operations, while remaining focused on the long-term growth of our business and protecting the value of our brand.
For a detailed discussion of significant risk factors that have the potential to cause our actual results to differ materially from our expectations, see Part I, Item 1A — "Risk Factors" included in this Annual Report on Form 10-K.
Summary of Financial Performance
Operating Results
In Fiscal 2018, we reported net revenues of $6.182 billion, net income of $162.8 million, and net income per diluted share of $1.97, as compared to net revenues of $6.653 billion, a net loss of $99.3 million, and net loss per diluted share of $1.20 in Fiscal 2017. The comparability of our operating results has been affected by TCJA enactment-related charges recorded during Fiscal 2018, as well as restructuring-related charges, impairment of assets, and certain other charges recorded during both Fiscal 2018 and Fiscal 2017, as discussed further below.
During Fiscal 2018, net revenues declined 7.1% on a reported basis and 8.4% on a constant currency basis, as defined within "Transactions and Trends Affecting Comparability of Results of Operations and Financial Condition" below. The decline in reported net revenues during Fiscal 2018 was primarily due to lower sales from our North America segment driven by the impact of our quality of distribution and sales initiatives, including lower levels of promotional activity and a strategic reduction in shipments, as well as brand discontinuances and lower consumer demand.
Our gross profit as a percentage of net revenues increased by 580 basis points to 60.7% during Fiscal 2018, primarily driven by lower non-cash inventory-related charges recorded in connection with the Way Forward Plan, lower levels of promotional activity in connection with our long-term growth strategy, favorable geographic and channel mix, and lower sourcing costs.
Selling, general, and administrative ("SG&A") expenses as a percentage of net revenues increased by 240 basis points to 50.1% during Fiscal 2018, primarily due to operating deleverage on lower net revenues and the unfavorable impact attributable to geographic and channel mix, as a greater portion of our revenue was generated by our international retail businesses (which typically carry higher operating expense margins). These increases were largely offset by our operational discipline and cost savings associated with our restructuring activities.
Net income increased by $262.1 million to $162.8 million in Fiscal 2018 as compared to Fiscal 2017, primarily due to a $590.5 million increase in operating income, partially offset by a $332.0 million increase in our income tax provision largely driven by TCJA enactment-related charges.
Net income per diluted share increased by $3.17 to $1.97 per share in Fiscal 2018 as compared to Fiscal 2017, due to higher net income and lower weighted-average diluted shares outstanding during Fiscal 2018.
Net income during Fiscal 2018 reflected TCJA enactment-related charges of $221.4 million, or $2.68 per diluted share. Our operating results during Fiscal 2018 and Fiscal 2017 were also negatively impacted by restructuring-related charges, impairment of assets, and certain other charges totaling $165.6 million and $770.3 million, respectively, which had an after-tax effect of reducing net income by $113.3 million, or $1.38 per diluted share, and $592.1 million, or $7.10 per diluted share, respectively. In addition, our net loss during Fiscal 2017 reflected the favorable impact of $15.9 million, or $0.19 per diluted share, related to the reversal of an income tax reserve resulting from a change in tax law that impacted an interest assessment on a prior year withholding tax.
40 | ||
Financial Condition and Liquidity
We ended Fiscal 2018 in a net cash and investments position (cash and cash equivalents plus short-term and non-current investments, less total debt) of $1.494 billion, compared to $786.2 million as of the end of Fiscal 2017. The increase in our net cash and investments position was primarily due to our operating cash flows of $975.1 million, partially offset by our use of cash to invest in our business through $161.6 million in capital expenditures and to make cash dividend payments of $162.4 million.
We generated $975.1 million of cash from operations during Fiscal 2018, compared to $952.6 million during Fiscal 2017. The increase in our operating cash flows was due to a net favorable change related to our operating assets and liabilities, including our working capital, as compared to the prior fiscal year, partially offset by a decline in net income before non-cash charges.
Our equity increased to $3.457 billion as of March 31, 2018, compared to $3.300 billion as of April 1, 2017, primarily due to our comprehensive income and the net impact of stock-based compensation arrangements, partially offset by our dividends declared during Fiscal 2018.
Recent Developments
U.S. Tax Reform
On December 22, 2017, President Trump signed into law new tax legislation commonly referred to as the Tax Cuts and Jobs Act (the "TCJA"), which became effective January 1, 2018. The TCJA significantly revised U.S. tax law by, among other provisions, lowering the U.S. federal statutory income tax rate from 35% to 21%, creating a territorial tax system that includes a one-time mandatory transition tax on previously deferred foreign earnings, and eliminating or reducing certain income tax deductions.
During Fiscal 2018, we recorded net charges of $221.4 million within our income tax provision in connection with the TCJA, of which $209.3 million related to the mandatory transition tax, which we expect to pay over an eight-year period. These charges, which were recorded on a provisional basis as permitted by SEC Staff Accounting Bulletin No. 118 ("SAB 118"), negatively impacted our effective tax rate by 4,520 basis points and lowered our diluted earnings per share by $2.68 during Fiscal 2018. The provisional amounts were based on our present interpretations of the TCJA, current available information, and assumptions about future events, and are subject to further refinement as additional information becomes available and further analyses are completed.
Despite these enactment-related charges, we expect the TCJA will ultimately benefit our results of operations and financial condition in future periods, primarily due to the lower U.S. federal statutory income tax rate.
Additionally, we reevaluated our permanent reinvestment assertion and determined that undistributed foreign earnings that were subject to the one-time mandatory transition tax were no longer considered to be permanently reinvested, effective December 31, 2017. In connection with this decision, we repatriated $252.0 million of cash to the U.S. from certain of our foreign subsidiaries during the fourth quarter of Fiscal 2018, and we repatriated an additional $400.0 million during the first quarter of Fiscal 2019.
See Note 10 to the accompanying consolidated financial statements for additional discussion regarding the TCJA.
Change in Chief Executive Officer
Effective May 2017, Mr. Stefan Larsson departed as the Company's President and Chief Executive Officer and as a member of our Board of Directors. In connection with Mr. Larsson's departure, we recorded cumulative other charges of $17.0 million, of which $5.6 million and $11.4 million were recorded during Fiscal 2018 and Fiscal 2017, respectively. We do not expect to incur additional charges related to Mr. Larsson's departure. See Note 9 to our accompanying consolidated financial statements for further discussion of the charges recorded in connection with Mr. Larsson's departure.
Subsequent to Mr. Larsson's departure, Mr. Patrice Louvet was appointed as the Company's new President and Chief Executive Officer and as a member of our Board of Directors, effective July 2017.
41 | ||
Way Forward Plan
On June 2, 2016, our Board of Directors approved a restructuring plan with the objective of delivering sustainable, profitable sales growth and long-term value creation for shareholders (the "Way Forward Plan"). We are refocusing on our core brands and evolving our product, marketing, and shopping experience to increase desirability and relevance. We are also evolving our operating model to enable sustainable, profitable sales growth by significantly improving quality of sales, reducing supply chain lead times, improving our sourcing, and executing a disciplined multi-channel distribution and expansion strategy. As part of the Way Forward Plan, we are rightsizing our cost structure and implementing a return on investment-driven financial model to free up resources to invest in the brand and drive high-quality sales. The Way Forward Plan includes strengthening our leadership team and creating a more nimble organization by moving from an average of nine to six layers of management. The Way Forward Plan also includes the discontinuance of our Denim & Supply brand and the integration of our denim product offerings into our Polo Ralph Lauren brand. Collectively, these actions, which were substantially completed during Fiscal 2017, resulted in a reduction in workforce and the closure of certain stores and shop-within-shops, as well as gross annualized expense savings of approximately $200 million.
On March 30, 2017, our Board of Directors approved the following additional restructuring-related activities associated with the Way Forward Plan: (i) the restructuring of our in-house global digital commerce platform which was in development and shifting to a more cost-effective, flexible platform through a new agreement with Salesforce's Commerce Cloud, formerly known as Demandware; (ii) the closure of our Polo store at 711 Fifth Avenue in New York City; and (iii) the further streamlining of the organization and the execution of other key corporate actions in line with the Way Forward Plan. These actions, which are expected to result in additional expense savings of approximately $140 million, are an important part of our efforts to achieve our stated objective to return to sustainable, profitable growth and invest in the future. These additional restructuring-related activities were largely completed during Fiscal 2018 and resulted in a further reduction in workforce and the closure of certain corporate office and store locations. The remaining activities, which are primarily lease-related, are expected to be completed during Fiscal 2019.
In connection with the Way Forward Plan, we currently expect to incur total estimated charges of approximately $770 million, comprised of cash-related restructuring charges of approximately $450 million and non-cash charges of approximately $320 million. Cumulative charges incurred since inception were $669.2 million, of which $102.8 million and $566.4 million were incurred during Fiscal 2018 and Fiscal 2017, respectively, and we expect to incur the remaining charges of approximately $100 million during Fiscal 2019. In addition to these charges, we also incurred an additional non-cash charge of $155.2 million during Fiscal 2017 associated with the destruction of inventory out of current liquidation channels in line with our Way Forward Plan. See Notes 8 and 9 to our accompanying consolidated financial statements for detailed discussions of the charges recorded in connection with the Way Forward Plan.
Global Reorganization Plan
On May 12, 2015, our Board of Directors approved a reorganization and restructuring plan comprised of the following major actions: (i) the reorganization of the Company's operating structure in order to streamline our business processes to better align our cost structure with our long-term growth strategy; (ii) a strategic store and shop-within-shop performance review conducted by region and brand; (iii) a targeted corporate functional area review; and (iv) the consolidation of certain of our luxury lines (collectively, the "Global Reorganization Plan"). The Global Reorganization Plan has resulted in a reduction in workforce and the closure of certain stores and shop-within-shops. Actions associated with the Global Reorganization Plan were substantially completed during Fiscal 2016 and resulted in improved operational efficiencies by reducing annual operating expenses by approximately $125 million.
Since its inception, we have recorded total cumulative charges of $147.4 million in connection with the Global Reorganization Plan, of which $4.9 million and $142.5 million were recorded during Fiscal 2017 and Fiscal 2016, respectively. Actions associated with the Global Reorganization Plan were completed by the end of the first quarter of Fiscal 2017 and no additional charges are expected to be incurred in relation to this plan. See Notes 8 and 9 to our accompanying consolidated financial statements for detailed discussions of the charges recorded in connection with the Global Reorganization Plan.
42 | ||
Transactions and Trends Affecting Comparability of Results of Operations and Financial Condition
The comparability of our operating results for the three fiscal years presented herein has been affected by certain events, including:
• | charges incurred in connection with our restructuring plans, as well as certain other asset impairments and other charges, as summarized below (references to "Notes" are to the notes to the accompanying consolidated financial statements): |
Fiscal Years Ended | ||||||||||||
March 31, 2018 | April 1, 2017 | April 2, 2016 | ||||||||||
(millions) | ||||||||||||
Impairment of assets (see Note 8) | $ | (50.0 | ) | $ | (253.8 | ) | $ | (48.8 | ) | |||
Restructuring and other charges (see Note 9) | (108.0 | ) | (318.6 | ) | (142.6 | ) | ||||||
Restructuring-related inventory charges (see Note 9)(a) | (7.6 | ) | (197.9 | ) | (20.4 | ) | ||||||
Total charges | $ | (165.6 | ) | $ | (770.3 | ) | $ | (211.8 | ) | |||
(a) | Non-cash restructuring-related inventory charges are recorded within cost of goods sold in the consolidated statements of operations. |
• | TCJA enactment-related charges of $221.4 million recorded within the income tax provision in the consolidated statements of operations during Fiscal 2018; |
• | the reversal of an income tax reserve resulting from a change in tax law that impacted an interest assessment on a prior year withholding tax, which favorably impacted our income tax benefit by $15.9 million during Fiscal 2017; and |
• | the inclusion of the 53rd week in Fiscal 2016, which resulted in incremental net revenues of $72.2 million and net income of $8.3 million. |
Since we are a global company, the comparability of our operating results reported in U.S. Dollars is also affected by foreign currency exchange rate fluctuations because the underlying currencies in which we transact change in value over time compared to the U.S. Dollar. These rate fluctuations can have a significant effect on our reported results. As such, in addition to financial measures prepared in accordance with accounting principles generally accepted in the U.S. ("U.S. GAAP"), our discussions often contain references to constant currency measures, which are calculated by translating the current-year and prior-year reported amounts into comparable amounts using a single foreign exchange rate for each currency. We present constant currency financial information, which is a non-U.S. GAAP financial measure, as a supplement to our reported operating results. We use constant currency information to provide a framework to assess how our businesses performed excluding the effects of foreign currency exchange rate fluctuations. We believe this information is useful to investors to facilitate comparisons of operating results and better identify trends in our businesses. The constant currency performance measures should be viewed in addition to, and not in lieu of or superior to, our operating performance measures calculated in accordance with U.S. GAAP. Reconciliations between this non-U.S. GAAP financial measure and the most directly comparable U.S. GAAP measure are included in the "Results of Operations" section where applicable.
Our discussion also includes reference to comparable store sales. Comparable store sales refer to the growth of sales in stores that are open for at least one full fiscal year. Sales for stores that are closed during a fiscal year are excluded from the calculation of comparable store sales. Sales for stores that are either relocated, enlarged (as defined by gross square footage expansion of 25% or greater), or generally closed for 30 or more consecutive days for renovation are also excluded from the calculation of comparable store sales until such stores have been in their new location or in their newly renovated state for at least one full fiscal year. Sales from our digital commerce sites are included within comparable store sales for those geographies that have been serviced by the related site for at least one full fiscal year. Sales for digital commerce sites that are shut down during a fiscal year are excluded from the calculation of comparable store sales. We use an integrated omni-channel strategy to operate our retail business, in which our digital commerce operations are interdependent with our physical stores. All comparable store sales metrics were calculated on a 52-week basis.
Our "Results of Operations" discussion that follows includes the significant changes in operating results arising from these items affecting comparability. However, unusual items or transactions may occur in any period. Accordingly, investors and other financial statement users should consider the types of events and transactions that have affected operating trends.
43 | ||
RESULTS OF OPERATIONS
Fiscal 2018 Compared to Fiscal 2017
The following table summarizes our results of operations and expresses the percentage relationship to net revenues of certain financial statement captions. All percentages shown in the below table and the discussion that follows have been calculated using unrounded numbers.
Fiscal Years Ended | |||||||||||||||
March 31, 2018 | April 1, 2017 | $ Change | % / bps Change | ||||||||||||
(millions, except per share data) | |||||||||||||||
Net revenues | $ | 6,182.3 | $ | 6,652.8 | $ | (470.5 | ) | (7.1 | %) | ||||||
Cost of goods sold | (2,430.6 | ) | (3,001.7 | ) | 571.1 | (19.0 | %) | ||||||||
Gross profit | 3,751.7 | 3,651.1 | 100.6 | 2.8 | % | ||||||||||
Gross profit as % of net revenues | 60.7 | % | 54.9 | % | 580 bps | ||||||||||
Selling, general, and administrative expenses | (3,095.5 | ) | (3,171.0 | ) | 75.5 | (2.4 | %) | ||||||||
SG&A expenses as % of net revenues | 50.1 | % | 47.7 | % | 240 bps | ||||||||||
Impairment of assets | (50.0 | ) | (253.8 | ) | 203.8 | (80.3 | %) | ||||||||
Restructuring and other charges | (108.0 | ) | (318.6 | ) | 210.6 | (66.1 | %) | ||||||||
Operating income (loss) | 498.2 | (92.3 | ) | 590.5 | NM | ||||||||||
Operating income (loss) as % of net revenues | 8.1 | % | (1.4 | %) | 950 bps | ||||||||||
Interest expense | (18.2 | ) | (12.4 | ) | (5.8 | ) | 46.8 | % | |||||||
Interest income | 12.3 | 7.3 | 5.0 | 69.0 | % | ||||||||||
Other expense, net | (3.1 | ) | (7.5 | ) | 4.4 | (57.9 | %) | ||||||||
Income (loss) before income taxes | 489.2 | (104.9 | ) | 594.1 | NM | ||||||||||
Income tax benefit (provision) | (326.4 | ) | 5.6 | (332.0 | ) | NM | |||||||||
Effective tax rate(a) | 66.7 | % | 5.3 | % | 6,140 bps | ||||||||||
Net income (loss) | $ | 162.8 | $ | (99.3 | ) | $ | 262.1 | NM | |||||||
Net income (loss) per common share: | |||||||||||||||
Basic | $ | 1.99 | $ | (1.20 | ) | $ | 3.19 | NM | |||||||
Diluted | $ | 1.97 | $ | (1.20 | ) | $ | 3.17 | NM | |||||||
(a) | Effective tax rate is calculated by dividing the income tax benefit (provision) by income (loss) before income taxes. |
NM Not meaningful.
Net Revenues. Net revenues decreased by $470.5 million, or 7.1%, to $6.182 billion in Fiscal 2018 as compared to Fiscal 2017, including net favorable foreign currency effects of $86.5 million. On a constant currency basis, net revenues decreased by $557.0 million, or 8.4%.
The following table summarizes the percentage change in our Fiscal 2018 consolidated comparable store sales as compared to the prior fiscal year on both a reported and constant currency basis:
As Reported | Constant Currency | |||||
Digital commerce comparable store sales | (15 | %) | (16 | %) | ||
Comparable store sales excluding digital commerce | (2 | %) | (3 | %) | ||
Total comparable store sales | (4 | %) | (5 | %) | ||
44 | ||
Our global average store count increased by two stores and concession shops during Fiscal 2018 compared with the prior fiscal year, primarily due to new openings in Asia, largely offset by global closures primarily associated with the Way Forward Plan. The following table details our retail store presence by segment as of the periods presented:
March 31, 2018 | April 1, 2017 | |||||
Freestanding Stores: | ||||||
North America | 215 | 216 | ||||
Europe | 81 | 82 | ||||
Asia | 105 | 89 | ||||
Other non-reportable segments | 71 | 79 | ||||
Total freestanding stores | 472 | 466 | ||||
Concession Shops: | ||||||
North America | 2 | 1 | ||||
Europe | 25 | 31 | ||||
Asia | 603 | 586 | ||||
Other non-reportable segments | 2 | 2 | ||||
Total concession shops | 632 | 620 | ||||
Total stores | 1,104 | 1,086 | ||||
In addition to our stores, we sell products online in North America and Europe through our various digital commerce sites, which include www.RalphLauren.com and www.ClubMonaco.com, among others. In Asia, we sell products online through various third-party digital partner commerce sites.
Net revenues for our segments, as well as a discussion of the changes in each reportable segment's net revenues from the prior fiscal year, are provided below:
Fiscal Years Ended | $ Change | Foreign Exchange Impact | $ Change | % Change | ||||||||||||||||||||||
March 31, 2018 | April 1, 2017 | As Reported | Constant Currency | As Reported | Constant Currency | |||||||||||||||||||||
(millions) | ||||||||||||||||||||||||||
Net Revenues: | ||||||||||||||||||||||||||
North America | $ | 3,231.0 | $ | 3,783.0 | $ | (552.0 | ) | $ | 3.0 | $ | (555.0 | ) | (14.6 | %) | (14.7 | %) | ||||||||||
Europe | 1,585.0 | 1,543.4 | 41.6 | 81.2 | (39.6 | ) | 2.7 | % | (2.6 | %) | ||||||||||||||||
Asia | 933.7 | 882.5 | 51.2 | 1.9 | 49.3 | 5.8 | % | 5.6 | % | |||||||||||||||||
Other non-reportable segments | 432.6 | 443.9 | (11.3 | ) | 0.4 | (11.7 | ) | (2.5 | %) | (2.6 | %) | |||||||||||||||
Total net revenues | $ | 6,182.3 | $ | 6,652.8 | $ | (470.5 | ) | $ | 86.5 | $ | (557.0 | ) | (7.1 | %) | (8.4 | %) | ||||||||||
North America net revenues — Net revenues decreased by $552.0 million, or 14.6%, during Fiscal 2018 as compared to Fiscal 2017, including net favorable foreign currency effects of $3.0 million. On a constant currency basis, net revenues decreased by $555.0 million, or 14.7%.
The $552.0 million net decline in North America net revenues was driven by:
• | a $435.0 million net decrease related to our North America wholesale business, largely driven by a strategic reduction of shipments (including within the off-price channel) and points of distribution in connection with our long-term growth strategy, the impact of brand discontinuances, and the continued challenging department store traffic trends; |
• | a $115.0 million net decrease in comparable store sales, primarily driven by lower sales from our Ralph Lauren digital commerce operations and certain of our retail stores due in part to a decline in traffic, as well as lower levels of promotional activity and a planned reduction in inventory in connection with our long-term growth strategy. The following table summarizes the percentage change in comparable store sales related to our North America retail business on both a reported and constant currency basis: |
45 | ||
As Reported | Constant Currency | |||||
Digital commerce comparable store sales | (22 | %) | (22 | %) | ||
Comparable store sales excluding digital commerce | (3 | %) | (3 | %) | ||
Total comparable store sales | (7 | %) | (7 | %) | ||
• | a $2.0 million net decrease in non-comparable store sales. |
Europe net revenues — Net revenues increased by $41.6 million, or 2.7%, during Fiscal 2018 as compared to Fiscal 2017, including net favorable foreign currency effects of $81.2 million. On a constant currency basis, net revenues decreased by $39.6 million, or 2.6%.
The $41.6 million net increase in Europe net revenues was driven by:
• | a $43.5 million net increase in non-comparable store sales, primarily driven by new store openings and net favorable foreign currency effects of $10.1 million; and |
• | a $15.2 million net increase related to our Europe wholesale business, largely driven by net favorable foreign currency effects of $45.1 million, partially offset by the impact of brand discontinuances and a strategic reduction of shipments within the off-price channel in connection with our long-term growth strategy. |
These increases were partially offset by:
• | a $17.1 million net decrease in comparable store sales, including net favorable foreign currency effects of $26.0 million. Our comparable store sales decreased by $43.1 million on a constant currency basis, primarily driven by lower sales from certain of our retail stores due in part to lower levels of promotional activity and a planned reduction in inventory in connection with our long-term growth strategy. The following table summarizes the percentage change in comparable store sales related to our Europe retail business on both a reported and constant currency basis: |
As Reported | Constant Currency | |||||
Digital commerce comparable store sales | 4 | % | (2 | %) | ||
Comparable store sales excluding digital commerce | (4 | %) | (8 | %) | ||
Total comparable store sales | (3 | %) | (7 | %) | ||
Asia net revenues — Net revenues increased by $51.2 million, or 5.8%, during Fiscal 2018 as compared to Fiscal 2017, including net favorable foreign currency effects of $1.9 million. On a constant currency basis, net revenues increased by $49.3 million, or 5.6%.
The $51.2 million net increase in Asia net revenues was driven by:
• | a $21.4 million net increase in non-comparable store sales, primarily driven by new store openings; |
• | an $18.3 million net increase in comparable store sales, including net favorable foreign currency effects of $1.0 million. Our comparable store sales increased by $17.3 million on a constant currency basis, primarily driven by higher sales from certain of our retail locations due in part to improved conversion, partially offset by the impact of lower levels of promotional activity in connection with our long-term growth strategy. The following table summarizes the percentage change in comparable store sales related to our Asia retail business on both a reported and constant currency basis: |
As Reported | Constant Currency | |||||
Total comparable store sales(a) | 3 | % | 3 | % | ||
(a) | Comparable store sales for our Asia segment were comprised primarily of sales made through our stores and concession shops. |
• | an $11.5 million net increase related to our Asia wholesale business, largely driven by our expansion in Japan. |
46 | ||
Gross Profit. Gross profit increased by $100.6 million, or 2.8%, to $3.752 billion in Fiscal 2018. Gross profit during Fiscal 2018 and Fiscal 2017 reflected non-cash inventory-related charges of $7.6 million and $197.9 million, respectively, recorded in connection with the Way Forward Plan. The increase in gross profit also included a net favorable foreign currency effect of $64.2 million. Gross profit as a percentage of net revenues increased to 60.7% in Fiscal 2018 from 54.9% in Fiscal 2017. The 580 basis point increase was primarily driven by the lower non-cash inventory-related charges recorded in connection with the Way Forward Plan during Fiscal 2018 as compared to Fiscal 2017, lower levels of promotional activity in connection with our long-term growth strategy, favorable geographic and channel mix, and lower sourcing costs.
Gross profit as a percentage of net revenues is dependent upon a variety of factors, including changes in the relative sales mix among distribution channels, changes in the mix of products sold, the timing and level of promotional activities, foreign currency exchange rates, and fluctuations in material costs. These factors, among others, may cause gross profit as a percentage of net revenues to fluctuate from year to year.
Selling, General, and Administrative Expenses. SG&A expenses include compensation and benefits, advertising and marketing, rent and occupancy, distribution, information technology, legal, depreciation and amortization, bad debt, and other selling and administrative costs. SG&A expenses decreased by $75.5 million, or 2.4%, to $3.096 billion in Fiscal 2018. This decrease included a net unfavorable foreign currency effect of $31.8 million. SG&A expenses as a percentage of net revenues increased to 50.1% in Fiscal 2018 from 47.7% in Fiscal 2017. The 240 basis point increase was primarily due to operating deleverage on lower net revenues, as previously discussed, and the unfavorable impact attributable to geographic and channel mix, as a greater portion of our revenue was generated by our international retail businesses (which typically carry higher operating expense margins). These increases were partially offset by our operational discipline and cost savings associated with our restructuring activities.
The $75.5 million net decline in SG&A expenses was driven by:
Fiscal 2018 Compared to Fiscal 2017 | ||||
(millions) | ||||
SG&A expense category: | ||||
Depreciation and amortization expense | $ | (26.1 | ) | |
Shipping and handling costs | (18.4 | ) | ||
Compensation-related expenses | (16.4 | ) | ||
Non-income tax related expenses | (9.4 | ) | ||
Selling-related expenses | (8.3 | ) | ||
Rent and occupancy expenses | (6.9 | ) | ||
Marketing and advertising expenses | 21.3 | |||
Other | (11.3 | ) | ||
Total decline in SG&A expenses | $ | (75.5 | ) | |
In Fiscal 2019, we remain committed to spending on key strategic initiatives including marketing, digital, expanding and renovating our global retail stores and concession shops, and investing in productivity-enhancing infrastructure. We expect to make these investments while continuing to manage our cost base with discipline.
Impairment of Assets. During Fiscal 2018, we recorded non-cash impairment charges of $41.2 million to write off certain fixed assets related to our domestic and international stores, shop-within-shops, and corporate offices. Additionally, as a result of a change in the planned usage of a certain intangible asset, we recorded a non-cash impairment charge of $8.8 million during Fiscal 2018 to reduce the value of the intangible asset to its estimated fair value. During Fiscal 2017, we recorded non-cash impairment charges of $248.6 million to write off certain fixed assets related to our domestic and international stores, shop-within-shops, and corporate offices, as well as our in-house global digital commerce platform which was in development. Additionally, as a result of the realignment of our segment reporting structure, we recorded a non-cash goodwill impairment charge of $5.2 million during Fiscal 2017. See Note 8 to the accompanying consolidated financial statements.
Restructuring and Other Charges. During Fiscal 2018 and Fiscal 2017, we recorded restructuring charges of $79.2 million and $294.0 million, respectively, in connection with our restructuring plans, consisting of severance and benefits costs, lease termination and store closure costs, other cash charges, and non-cash accelerated stock-based compensation expense. In addition, during Fiscal 2018, we recorded net other charges of $28.8 million primarily related to depreciation expense associated with our
47 | ||
former Polo store at 711 Fifth Avenue in New York City, our pending customs audit, the departure of Mr. Stefan Larsson, and the reversal of reserves associated with the settlement of certain non-income tax issues. During Fiscal 2017, we recorded other charges of $24.6 million related to the anticipated settlement of certain non-income tax issues and the departure of Mr. Stefan Larsson. See Note 9 to the accompanying consolidated financial statements.
Operating Income (Loss). During Fiscal 2018, we reported operating income of $498.2 million, as compared to an operating loss of $92.3 million during Fiscal 2017. Our operating results during Fiscal 2018 and Fiscal 2017 were negatively impacted by restructuring-related charges, impairment of assets, and certain other charges totaling $165.6 million and $770.3 million, respectively, as previously discussed. The $590.5 million increase in operating income also included a net favorable foreign currency effect of $32.4 million. Operating income as a percentage of net revenues was 8.1% during Fiscal 2018, reflecting a 950 basis point increase from the prior fiscal year. The overall increase in operating income as a percentage of net revenues was primarily driven by the net decline in restructuring-related charges, impairment of assets, and certain other charges and the increase in our gross profit margin, partially offset by the increase in SG&A expenses as a percentage of net revenues, all as previously discussed.
Operating income (loss) and margin for our segments, as well as a discussion of the changes in each reportable segment's operating margin from the prior fiscal year, are provided below:
Fiscal Years Ended | ||||||||||||||||||
March 31, 2018 | April 1, 2017 | |||||||||||||||||
Operating Income (Loss) | Operating Margin | Operating Income (Loss) | Operating Margin | $ Change | Margin Change | |||||||||||||
(millions) | (millions) | (millions) | ||||||||||||||||
Segment: | ||||||||||||||||||
North America | $ | 677.6 | 21.0% | $ | 666.8 | 17.6% | $ | 10.8 | 340 bps | |||||||||
Europe | 356.7 | 22.5% | 305.2 | 19.8% | 51.5 | 270 bps | ||||||||||||
Asia | 137.2 | 14.7% | (86.3 | ) | (9.8%) | 223.5 | 2,450 bps | |||||||||||
Other non-reportable segments | 107.5 | 24.9% | 81.0 | 18.2% | 26.5 | 670 bps | ||||||||||||
1,279.0 | 966.7 | 312.3 | ||||||||||||||||
Unallocated corporate expenses | (672.8 | ) | (740.4 | ) | 67.6 | |||||||||||||
Unallocated restructuring and other charges | (108.0 | ) | (318.6 | ) | 210.6 | |||||||||||||
Total operating income (loss) | $ | 498.2 | 8.1% | $ | (92.3 | ) | (1.4%) | $ | 590.5 | 950 bps | ||||||||
North America operating margin improved by 340 basis points, primarily due to the favorable impact of 100 basis points related to our retail business, largely driven by the increase in our gross profit margin. The increase also reflected the favorable impact of 240 basis points related to lower non-cash charges recorded in connection with the Way Forward Plan during Fiscal 2018 as compared to the prior fiscal year. Our wholesale business did not have a meaningful impact on the change in our North America operating margin, as the improved gross margin was offset by operating expense deleverage on lower net revenues.
Europe operating margin improved by 270 basis points, primarily due to the favorable impact of 130 basis points related to lower non-cash charges recorded in connection with the Way Forward Plan during Fiscal 2018 as compared to the prior fiscal year, as well as the favorable impact of 120 basis points related to our retail business, largely driven by the increase in our gross profit margin, partially offset by an increase in SG&A expenses as a percentage of net revenues. The increase also reflected favorable foreign currency effects of 20 basis points. Our wholesale business did not have a meaningful impact on the change in our Europe operating margin.
Asia operating margin improved by 2,450 basis points, primarily due to the favorable impact of 2,000 basis points related to lower non-cash charges recorded in connection with the Way Forward Plan during Fiscal 2018 as compared to the prior fiscal year. The increase also reflected the favorable impact of 350 basis points related to our retail business, largely driven by the increase in our gross profit margin and a decline in SG&A expenses as a percentage of net revenues. The improvement also reflected favorable foreign currency effects of 140 basis points. These increases in operating margin were partially offset by a 40 basis point decline related to our wholesale business.
48 | ||
Unallocated corporate expenses decreased by $67.6 million to $672.8 million in Fiscal 2018, primarily due to lower impairment of asset charges of $96.3 million, lower non-income tax related expenses of $9.4 million, and lower other expenses of $10.7 million, partially offset by lower intercompany sourcing commission income of $31.9 million (which is offset at the segment level and eliminates in consolidation), higher consulting fees of $8.7 million, and higher compensation-related expenses of $8.2 million.
Unallocated restructuring and other charges decreased by $210.6 million to $108.0 million in Fiscal 2018, as previously discussed above and in Note 9 to the accompanying consolidated financial statements.
Non-operating Expense, Net. Non-operating expense, net is comprised of interest expense, interest income, and other expense, net, which includes foreign currency gains (losses), equity in losses from our equity-method investees, and other non-operating expenses. Non-operating expense, net, decreased by $3.6 million to $9.0 million in Fiscal 2018 from $12.6 million in Fiscal 2017. The decline in non-operating expense, net, was driven by:
• | a $5.0 million increase in interest income driven by the increase in our cash, cash equivalents, and investments as compared to the prior fiscal year; and |
• | a $3.4 million increase in foreign currency gains, largely related to the net favorable revaluation and settlement of foreign currency-denominated intercompany receivables and payables, inclusive of the impact of forward foreign currency exchange contracts, as compared to the prior fiscal year (foreign currency gains (losses) do not result from the translation of the operating results of our foreign subsidiaries to U.S. Dollars). |
These declines in non-operating expense were partially offset by:
• | a $5.8 million increase in interest expense driven by the less favorable impact of our swap contracts during Fiscal 2018 as compared to the prior fiscal year. See Note 13 to the accompanying consolidated financial statements for further discussion of our swap contracts. |
Income Tax Benefit (Provision). The income tax benefit (provision) represents federal, foreign, state and local income taxes. During Fiscal 2018, we reported an income tax provision of $326.4 million and an effective tax rate of 66.7%, as compared to an income tax benefit of $5.6 million and an effective tax rate of 5.3% during Fiscal 2017. The $332.0 million increase in the income tax provision was primarily due to enactment-related charges of $221.4 million recorded during Fiscal 2018 in connection with the TCJA (as discussed within "Recent Developments"), which negatively impacted our effective tax rate by 4,520 basis points, as well as the increase in pretax income. The 66.7% effective tax rate for Fiscal 2018 was higher than our blended statutory tax rate of 31.5% primarily due to TCJA enactment-related charges, the adoption of Accounting Standards Update No. 2016-09, "Improvements to Employee Share-Based Payment Accounting" ("ASU 2016-09"), and the unfavorable impact of additional income tax reserves associated with certain income tax audits, partially offset by the tax impacts of earnings in lower taxed foreign jurisdictions versus the U.S. and tax benefits associated with adjustments recorded on deferred tax assets and provision to tax return adjustments. See Note 4 to the accompanying consolidated financial statements for additional information relating to our adoption of ASU 2016-09. The 5.3% effective tax rate for Fiscal 2017 was lower than the statutory tax rate of 35.0% primarily due to the tax impact of earnings in lower taxed foreign jurisdictions versus the U.S., valuation allowances and adjustments recorded on deferred tax assets, and income tax reserves largely associated with an income tax settlement and certain income tax audits, partially offset by the reversal of an income tax reserve resulting from a change in tax law that impacted an interest assessment on a prior year withholding tax. Our effective tax rate will change from period to period based on various factors including, but not limited to, the geographic mix of earnings, the timing and amount of foreign dividends, enacted tax legislation, state and local taxes, tax audit findings and settlements, and the interaction of various global tax strategies.
Net Income (Loss). During Fiscal 2018, we reported net income of $162.8 million, as compared to a net loss of $99.3 million during Fiscal 2017. The $262.1 million increase in net income was primarily due to the $590.5 million increase in operating income, partially offset by the $332.0 million increase in our income tax provision, as previously discussed. Net income in Fiscal 2018 reflected TCJA enactment-related charges of $221.4 million. Our operating results during Fiscal 2018 and Fiscal 2017 were also negatively impacted by restructuring-related charges, impairment of assets, and certain other charges totaling $165.6 million and $770.3 million, respectively, which had an after-tax effect of reducing net income by $113.3 million and $592.1 million, respectively. In addition, our net loss during Fiscal 2017 reflected the favorable impact of $15.9 million related to the reversal of an income tax reserve resulting from a change in tax law that impacted an interest assessment on a prior year withholding tax.
49 | ||
Net Income (Loss) per Diluted Share. During Fiscal 2018, we reported net income per diluted share of $1.97, as compared to a net loss per diluted share of $1.20 during Fiscal 2017. The $3.17 per share increase was due to the higher level of net income, as previously discussed, and lower weighted-average diluted shares outstanding during Fiscal 2018, driven by the weighted-average impact of our share repurchases during Fiscal 2017. Net income per diluted share during Fiscal 2018 was negatively impacted by $2.68 per share as a result of TCJA enactment-related charges. Net income (loss) per diluted share during Fiscal 2018 and Fiscal 2017 were also negatively impacted by $1.38 per share and $7.10 per share, respectively, as a result of restructuring-related charges, impairment of assets, and certain other charges. In addition, our net loss per diluted share during Fiscal 2017 reflected the favorable impact of $0.19 per share related to the reversal of an income tax reserve resulting from a change in tax law that impacted an interest assessment on a prior year withholding tax.
Fiscal 2017 Compared to Fiscal 2016
The following table summarizes our results of operations and expresses the percentage relationship to net revenues of certain financial statement captions. All percentages shown in the below table and the discussion that follows have been calculated using unrounded numbers.
Fiscal Years Ended | |||||||||||||||
April 1, 2017 | April 2, 2016 | $ Change | % / bps Change | ||||||||||||
(millions, except per share data) | |||||||||||||||
Net revenues | $ | 6,652.8 | $ | 7,405.2 | $ | (752.4 | ) | (10.2 | %) | ||||||
Cost of goods sold | (3,001.7 | ) | (3,218.5 | ) | 216.8 | (6.7 | %) | ||||||||
Gross profit | 3,651.1 | 4,186.7 | (535.6 | ) | (12.8 | %) | |||||||||
Gross profit as % of net revenues | 54.9 | % | 56.5 | % | (160 bps) | ||||||||||
Selling, general, and administrative expenses | (3,171.0 | ) | (3,412.5 | ) | 241.5 | (7.1 | %) | ||||||||
SG&A expenses as % of net revenues | 47.7 | % | 46.1 | % | 160 bps | ||||||||||
Impairment of assets | (253.8 | ) | (48.8 | ) | (205.0 | ) | NM | ||||||||
Restructuring and other charges | (318.6 | ) | (142.6 | ) | (176.0 | ) | 123.4 | % | |||||||
Operating income (loss) | (92.3 | ) | 582.8 | (675.1 | ) | (115.8 | %) | ||||||||
Operating income (loss) as % of net revenues | (1.4 | %) | 7.9 | % | (930 bps) | ||||||||||
Interest expense | (12.4 | ) | (21.0 | ) | 8.6 | (41.0 | %) | ||||||||
Interest income | 7.3 | 6.3 | 1.0 | 14.9 | % | ||||||||||
Other expense, net | (7.5 | ) | (16.3 | ) | 8.8 | (53.9 | %) | ||||||||
Income (loss) before income taxes | (104.9 | ) | 551.8 | (656.7 | ) | (119.0 | %) | ||||||||
Income tax benefit (provision) | 5.6 | (155.4 | ) | 161.0 | (103.6 | %) | |||||||||
Effective tax rate(a) | 5.3 | % | 28.2 | % | (2,290 bps) | ||||||||||
Net income (loss) | $ | (99.3 | ) | $ | 396.4 | $ | (495.7 | ) | (125.1 | %) | |||||
Net income (loss) per common share: | |||||||||||||||
Basic | $ | (1.20 | ) | $ | 4.65 | $ | (5.85 | ) | (125.8 | %) | |||||
Diluted | $ | (1.20 | ) | $ | 4.62 | $ | (5.82 | ) | (126.0 | %) | |||||
(a) | Effective tax rate is calculated by dividing the income tax benefit (provision) by income (loss) before income taxes. |
NM Not meaningful.
Net Revenues. Net revenues decreased by $752.4 million, or 10.2%, to $6.653 billion in Fiscal 2017. This decrease reflected net unfavorable foreign currency effects of $21.2 million, as well as the absence of the 53rd week, which resulted in incremental net revenues of $72.2 million during the prior fiscal year. On a constant currency basis, net revenues decreased by $731.2 million, or 9.9%.
50 | ||
The following table summarizes the percentage change in our Fiscal 2017 consolidated comparable store sales as compared to the prior fiscal year on both a reported and constant currency basis:
As Reported | Constant Currency | |||||
Digital commerce comparable store sales | (10 | %) | (10 | %) | ||
Comparable store sales excluding digital commerce | (7 | %) | (7 | %) | ||
Total comparable store sales | (7 | %) | (7 | %) | ||
Our global average store count increased by 44 stores and concession shops during Fiscal 2017 compared with the prior fiscal year, due to new global store openings, primarily in Asia, partially offset by store closures, primarily associated with our Way Forward Plan. The following table details our retail store presence by segment as of the periods presented:
April 1, 2017 | April 2, 2016 | |||||
Freestanding Stores: | ||||||
North America | 216 | 224 | ||||
Europe | 82 | 87 | ||||
Asia | 89 | 105 | ||||
Other non-reportable segments | 79 | 77 | ||||
Total freestanding stores | 466 | 493 | ||||
Concession Shops: | ||||||
North America | 1 | 2 | ||||
Europe | 31 | 34 | ||||
Asia | 586 | 545 | ||||
Other non-reportable segments | 2 | 2 | ||||
Total concession shops | 620 | 583 | ||||
Total stores | 1,086 | 1,076 | ||||
In addition to our stores, we sold products online in North America and Europe through our various digital commerce sites, which include www.RalphLauren.com and www.ClubMonaco.com, among others. In Asia, we sell products online through various third-party digital partner commerce sites.
Net revenues for our segments, as well as a discussion of the changes in each reportable segment's net revenues from the prior fiscal year, are provided below:
Fiscal Years Ended | $ Change | Foreign Exchange Impact | $ Change | % Change | ||||||||||||||||||||||
April 1, 2017 | April 2, 2016 | As Reported | Constant Currency | As Reported | Constant Currency | |||||||||||||||||||||
(millions) | ||||||||||||||||||||||||||
Net Revenues: | ||||||||||||||||||||||||||
North America | $ | 3,783.0 | $ | 4,479.6 | $ | (696.6 | ) | $ | (0.4 | ) | $ | (696.2 | ) | (15.6 | %) | (15.5 | %) | |||||||||
Europe | 1,543.4 | 1,561.7 | (18.3 | ) | (64.3 | ) | 46.0 | (1.2 | %) | 2.9 | % | |||||||||||||||
Asia | 882.5 | 892.4 | (9.9 | ) | 43.6 | (53.5 | ) | (1.1 | %) | (6.0 | %) | |||||||||||||||
Other non-reportable segments | 443.9 | 471.5 | (27.6 | ) | (0.1 | ) | (27.5 | ) | (5.8 | %) | (5.8 | %) | ||||||||||||||
Total net revenues | $ | 6,652.8 | $ | 7,405.2 | $ | (752.4 | ) | $ | (21.2 | ) | $ | (731.2 | ) | (10.2 | %) | (9.9 | %) | |||||||||
North America net revenues — Net revenues decreased by $696.6 million, or 15.6%, during Fiscal 2017 as compared to Fiscal 2016. This decrease reflected net unfavorable foreign currency effects of $0.4 million, as well as the absence of the 53rd week, which resulted in incremental net revenues of $38.2 million during the prior fiscal year. On a constant currency basis, net revenues decreased by $696.2 million, or 15.5%.
51 | ||
The $696.6 million net decline in North America net revenues was driven by:
• | a $510.3 million net decrease related to our North America wholesale business, reflecting lower sales across all of our major apparel and accessories businesses, due in part to a strategic reduction of shipments in connection with our long-term growth strategy and a decline in department store traffic, which contributed to a more competitive retail environment. This decrease also reflected the absence of the 53rd week, which resulted in incremental net revenues of $10.0 million during the prior fiscal year; |
• | a $165.5 million net decrease in comparable store sales, primarily driven by lower sales from certain of our retail stores and Ralph Lauren digital commerce operations due in part to a decline in traffic. The following table summarizes our comparable store sales percentages on both a reported and constant currency basis related to our North America retail business: |
As Reported | Constant Currency | |||||
Digital commerce comparable store sales | (15 | %) | (15 | %) | ||
Comparable store sales excluding digital commerce | (8 | %) | (8 | %) | ||
Total comparable store sales | (10 | %) | (10 | %) | ||
• | a $20.8 million net decrease in non-comparable store sales, primarily driven by the absence of the 53rd week, which resulted in incremental net revenues of $28.2 million during the prior fiscal year, partially offset by new store openings during Fiscal 2017. |
Europe net revenues — Net revenues decreased by $18.3 million, or 1.2%, during Fiscal 2017 as compared to Fiscal 2016. This decrease reflected net unfavorable foreign currency effects of $64.3 million, as well as the absence of the 53rd week, which resulted in incremental net revenues of $14.3 million during the prior fiscal year. On a constant currency basis, net revenues increased by $46.0 million, or 2.9%.
The $18.3 million net decline in Europe net revenues was driven by:
• | a $57.1 million net decrease in comparable store sales, including net unfavorable foreign currency effects of $26.9 million. Our comparable store sales decreased by $30.2 million on a constant currency basis, primarily driven by lower sales from certain retail stores due in part to a decline in traffic, as well as lower levels of promotional activity in connection with our long-term growth strategy, partially offset by higher sales from our Ralph Lauren digital commerce operations. The following table summarizes our comparable store sales percentages on both a reported and constant currency basis related to our Europe retail business: |
As Reported | Constant Currency | |||||
Digital commerce comparable store sales | 7 | % | 11 | % | ||
Comparable store sales excluding digital commerce | (10 | %) | (6 | %) | ||
Total comparable store sales | (8 | %) | (4 | %) | ||
This decline was partially offset by:
• | a $25.4 million net increase related to our Europe wholesale business, reflecting increased sales across all of our major apparel and accessories businesses. This increase was net of unfavorable foreign currency effects of $23.0 million; and |
• | a $13.4 million net increase in non-comparable store sales, primarily driven by new store openings during Fiscal 2017, partially offset by net unfavorable foreign currency effects of $14.4 million and the absence of the 53rd week, which resulted in incremental net revenues of $14.3 million during the prior fiscal year. |
Asia net revenues — Net revenues decreased by $9.9 million, or 1.1%, during Fiscal 2017 as compared to Fiscal 2016, reflecting the absence of the 53rd week, which resulted in incremental net revenues of $15.4 million during the prior fiscal year. This decrease is inclusive of net favorable foreign currency effects of $43.6 million. On a constant currency basis, net revenues decreased by $53.5 million, or 6.0%.
52 | ||
The $9.9 million net decline in Asia net revenues was driven by:
• | a $17.1 million net decrease in non-comparable store sales, primarily driven by the absence of the 53rd week, which resulted in incremental net revenues of $15.4 million during the prior fiscal year, as well as lower sales from certain of our stores and concession shops due in part to a decline in traffic, lower levels of promotional activity in connection with our long-term growth strategy, and the strategic closure of certain of our locations, partially offset by net favorable foreign currency effects of $11.1 million and new store openings during Fiscal 2017; and |
• | a $5.1 million net decrease related to our Asia wholesale business, primarily driven by lower sales in Greater China and Southeast Asia, partially offset by net favorable foreign currency effects of $3.4 million. |
These declines were partially offset by:
• | a $12.3 million net increase in comparable store sales, including net favorable foreign currency effects of $29.1 million. Our comparable store sales decreased by $16.8 million on a constant currency basis, primarily driven by lower sales from certain of our stores and concession shops due in part to a decline in traffic, and lower levels of promotional activity in connection with our long-term growth strategy. The following table summarizes our comparable store sales percentage on both a reported and constant currency basis related to our Asia retail business: |
As Reported | Constant Currency | |||||
Total comparable store sales(a) | 2 | % | (3 | %) | ||
(a) | Comparable store sales for our Asia segment were comprised solely of sales made through our stores and concession shops. |
Gross Profit. Gross profit decreased by $535.6 million, or 12.8%, to $3.651 billion in Fiscal 2017. Gross profit during Fiscal 2017 and Fiscal 2016 reflected non-cash inventory-related charges of $197.9 million and $20.4 million, respectively, recorded in connection with our restructuring plans. Gross profit as a percentage of net revenues declined by 160 basis points to 54.9% in Fiscal 2017 from 56.5% in Fiscal 2016. This decline was primarily driven by the higher non-cash inventory-related charges recorded in connection with our restructuring plans during Fiscal 2017 as compared to the comparable prior year period and net unfavorable foreign currency effects, partially offset by increased profitability driven by favorable geographic and channel mix and our quality of sales initiatives, including lower levels of promotional activity within our international businesses.
Selling, General, and Administrative Expenses. SG&A expenses decreased by $241.5 million, or 7.1%, to $3.171 billion in Fiscal 2017. This decrease included a net unfavorable foreign currency effect of $5.3 million. SG&A expenses as a percentage of net revenues increased by 160 basis points to 47.7% in Fiscal 2017 from 46.1% in Fiscal 2016. This increase was primarily due to operating deleverage on lower net revenues, as previously discussed, and the continued investment in, and expansion of, our retail businesses (which typically carry higher operating expense margins) through new store and concession shop openings (as previously discussed); investments in our facilities and infrastructure; and investments in new business initiatives. These increases were partially offset by our operational discipline and cost savings associated with our restructuring activities.
The $241.5 million decline in SG&A expenses was driven by:
Fiscal 2017 Compared to Fiscal 2016 | ||||
(millions) | ||||
SG&A expense category: | ||||
Compensation-related expenses | $ | (108.8 | ) | |
Marketing and advertising expenses | (60.1 | ) | ||
Consulting fees | (23.0 | ) | ||
Rent and occupancy expenses | (19.3 | ) | ||
Shipping and handling costs | (12.9 | ) | ||
Other | (17.4 | ) | ||
Total decline in SG&A expenses | $ | (241.5 | ) | |
53 | ||
Impairment of Assets. During Fiscal 2017, we recorded non-cash impairment charges of $248.6 million to write off certain fixed assets related to our domestic and international stores, shop-within-shops, and corporate offices, as well as our in-house global digital commerce platform which was in development. Additionally, as a result of the realignment of our segment reporting structure, we recorded a non-cash goodwill impairment charge of $5.2 million during Fiscal 2017. During Fiscal 2016, we recorded non-cash impairment charges of $48.8 million, primarily to write off certain fixed assets related to our domestic and international stores and shop-within-shops. See Note 8 to the accompanying consolidated financial statements.
Restructuring and Other Charges. During Fiscal 2017 and Fiscal 2016, we recorded restructuring charges of $294.0 million and $94.9 million, respectively, in connection with our restructuring plans, consisting of severance and benefits costs, lease termination and store closure costs, other cash charges, and non-cash accelerated stock-based compensation expense. In addition, during Fiscal 2017, we recorded other charges of $24.6 million related to the anticipated settlement of certain non-income tax issues and the departure of Mr. Stefan Larsson. During Fiscal 2016, we recorded other charges of $47.7 million primarily related to our pending customs audit and the settlement of certain litigation claims. See Note 9 to the accompanying consolidated financial statements.
Operating Income (Loss). During Fiscal 2017, we reported an operating loss of $92.3 million, as compared to operating income of $582.8 million during Fiscal 2016. Our operating results during Fiscal 2017 and Fiscal 2016 were negatively impacted by restructuring-related charges, impairment of assets, and certain other charges totaling $770.3 million and $211.8 million, respectively, as previously discussed. The $675.1 million decline in operating income also included a net unfavorable foreign currency effect of $67.4 million. Operating loss as a percentage of net revenues was 1.4% during Fiscal 2017, reflecting a 930 basis point decline from the prior fiscal year. The overall decline in operating income as a percentage of net revenues was primarily driven by the decline in our gross profit margin and the increase in restructuring-related charges, impairment of assets, and certain other charges, as well as the increase in SG&A expenses as a percentage of net revenues, all as previously discussed.
Operating income (loss) and margin for our segments, as well as a discussion of the changes in each reportable segment's operating margin from the prior fiscal year, are provided below:
Fiscal Years Ended | ||||||||||||||||||
April 1, 2017 | April 2, 2016 | |||||||||||||||||
Operating Income (Loss) | Operating Margin | Operating Income (Loss) | Operating Margin | $ Change | Margin Change | |||||||||||||
(millions) | (millions) | (millions) | ||||||||||||||||
Segment: | ||||||||||||||||||
North America | $ | 666.8 | 17.6% | $ | 941.3 | 21.0% | $ | (274.5 | ) | (340 bps) | ||||||||
Europe | 305.2 | 19.8% | 281.0 | 18.0% | 24.2 | 180 bps | ||||||||||||
Asia | (86.3 | ) | (9.8%) | (1.2 | ) | (0.1%) | (85.1 | ) | (970 bps) | |||||||||
Other non-reportable segments | 81.0 | 18.2% | 119.3 | 25.3% | (38.3 | ) | (710 bps) | |||||||||||
966.7 | 1,340.4 | (373.7 | ) | |||||||||||||||
Unallocated corporate expenses | (740.4 | ) | (615.0 | ) | (125.4 | ) | ||||||||||||
Unallocated restructuring and other charges | (318.6 | ) | (142.6 | ) | (176.0 | ) | ||||||||||||
Total operating income (loss) | $ | (92.3 | ) | (1.4%) | $ | 582.8 | 7.9% | $ | (675.1 | ) | (930 bps) | |||||||
North America operating margin declined by 340 basis points, primarily due to the unfavorable impact of 200 basis points related to higher non-cash charges recorded in connection with our restructuring plans during Fiscal 2017 as compared to the prior fiscal year. Our lower operating margin also reflected a 70 basis point decline related to our wholesale business, largely driven by the impact of a more competitive retail environment, and a 40 basis point decline related to our retail business, largely driven by an increase in SG&A expenses as a percentage of net revenues. The remaining 30 basis point decline was attributable to other factors, including unfavorable channel mix.
Europe operating margin increased by 180 basis points, primarily due to the favorable impact of 360 basis points and 240 basis points related to our wholesale and retail businesses, respectively, largely driven by the increase in our gross margin attributable to lower levels of promotional activity in connection with our long-term growth strategy. Our wholesale business also benefited from a decline in SG&A expenses as a percentage of net revenues. These increases in operating margin were partially offset by unfavorable foreign currency effects of 340 basis points, as well as an 80 basis point decline attributable to higher non-cash charges recorded in connection with our restructuring plans during Fiscal 2017 as compared to the prior fiscal year.
54 | ||
Asia operating margin declined by 970 basis points, primarily due to the unfavorable impact of 1,720 basis points related to higher non-cash charges recorded in connection with our restructuring plans during Fiscal 2017 as compared to the prior fiscal year. This decline in operating margin was partially offset by the favorable impact of 690 basis points related to our retail business, largely driven by a decline in SG&A expenses as a percentage of net revenues, lower levels of promotional activity in connection with our long-term growth strategy, and the strategic closure of certain of our locations. Our operating margin also reflected the favorable impact of 60 basis points related to our wholesale business.
Unallocated corporate expenses increased by $125.4 million, primarily due to higher non-cash impairment charges of $117.0 million, higher depreciation and amortization expense of $13.5 million, higher non-income tax related charges of $9.3 million, and higher other operating expenses of $37.4 million. These increases were partially offset by a decline in compensation-related expenses of $33.4 million and a decline in consulting fees of $18.4 million.
Unallocated restructuring and other charges increased by $176.0 million to $318.6 million in Fiscal 2017, as previously discussed above and in Note 9 to the accompanying consolidated financial statements.
Non-operating Expense, Net. Non-operating expense, net, decreased by $18.4 million to $12.6 million in Fiscal 2017 from $31.0 million in Fiscal 2016. The decline in non-operating expense was driven by:
• | an $8.6 million decrease in interest expense driven by the net favorable impact of our swap contracts entered into during Fiscal 2016, partially offset by the inclusion of twelve months of interest expense during Fiscal 2017 related to the 2.625% unsecured senior notes issued in August 2015, as compared to approximately seven months of interest expense during the prior year period. See Note 13 to the accompanying consolidated financial statements for further discussion of our swap contracts; |
• | a $5.7 million decrease in equity in losses of equity-method investees, primarily related to our share in losses from our joint venture, the Ralph Lauren Watch and Jewelry Company Sárl, which is accounted for under the equity method of accounting; and |
• | a $4.9 million decrease in foreign currency losses, largely related to the net favorable revaluation and settlement of foreign currency-denominated intercompany receivables and payables, inclusive of the impact of forward foreign currency exchange contracts, as compared to the prior fiscal year (foreign currency gains (losses) do not result from the translation of the operating results of our foreign subsidiaries to U.S. Dollars). |
Income Tax Benefit (Provision). During Fiscal 2017, we reported an income tax benefit of $5.6 million, as compared to an income tax provision of $155.4 million during Fiscal 2016. The $161.0 million decrease in the income tax provision was largely driven by lower pretax income resulting in a pretax loss in Fiscal 2017. The 5.3% effective tax rate for Fiscal 2017 was lower than the statutory tax rate primarily due to the tax impact of earnings in lower taxed foreign jurisdictions versus the U.S., valuation allowances and adjustments recorded on deferred tax assets, and income tax reserves largely associated with an income tax settlement and certain income tax audits, partially offset by the reversal of an income tax reserve resulting from a change in tax law that impacted an interest assessment on a prior year withholding tax. The 28.2% effective tax rate for Fiscal 2016 was lower than the statutory tax rate primarily due to the tax impact of earnings in lower taxed foreign jurisdictions versus the U.S. and a change to the assessment period associated with certain tax liabilities, partially offset by the reversal of certain deferred tax assets that were determined to not be realizable.
Net Income (Loss). During Fiscal 2017, we reported a net loss of $99.3 million, as compared to net income of $396.4 million during Fiscal 2016. The $495.7 million decrease in net income was primarily due to the decline in operating income, partially offset by the reduction in our income tax provision, as previously discussed. Our operating results during Fiscal 2017 and Fiscal 2016 were negatively impacted by restructuring-related charges, impairment of assets, and certain other charges totaling $770.3 million and $211.8 million, respectively, which had an after-tax effect of reducing net income by $592.1 million and $150.1 million, respectively. In addition, our net loss during Fiscal 2017 reflected unfavorable foreign currency impacts of $63.6 million, partially offset by the favorable impact of $15.9 million related to the reversal of an income tax reserve resulting from a change in tax law that impacted an interest assessment on a prior year withholding tax, as previously discussed. Our net income during Fiscal 2016 reflected the favorable impact of the inclusion of the 53rd week, which increased net income by $8.3 million.
Net Income (Loss) per Diluted Share. During Fiscal 2017, we reported a net loss per diluted share of $1.20, as compared to net income per diluted share of $4.62 during Fiscal 2016. The $5.82 per share decline was due to lower net income, as previously discussed, and lower weighted-average diluted shares outstanding during Fiscal 2017, driven by our share repurchases during Fiscal 2017. Net income (loss) per diluted share during Fiscal 2017 and Fiscal 2016 was negatively impacted by $7.10 per share and $1.74 per share, respectively, as a result of restructuring-related charges, impairment of assets, and certain other charges, as
55 | ||
previously discussed. In addition, our net loss per diluted share during Fiscal 2017 reflected unfavorable foreign currency impacts of $0.77 per share, partially offset by the favorable impact of $0.19 per share related to the reversal of an income tax reserve resulting from a change in tax law that impacted an interest assessment on a prior year withholding tax, as previously discussed. Net income per diluted share during Fiscal 2016 reflected the favorable impact of the inclusion of the 53rd week, which increased net income per diluted share by $0.10 per share.
FINANCIAL CONDITION AND LIQUIDITY
Financial Condition
The following table presents our financial condition as of March 31, 2018 and April 1, 2017.
March 31, 2018 | April 1, 2017 | $ Change | ||||||||||
(millions) | ||||||||||||
Cash and cash equivalents | $ | 1,304.6 | $ | 668.3 | $ | 636.3 | ||||||
Short-term investments | 699.4 | 684.7 | 14.7 | |||||||||
Non-current investments(a) | 86.2 | 21.4 | 64.8 | |||||||||
Short-term debt(b) | (10.1 | ) | — | (10.1 | ) | |||||||
Current portion of long-term debt(b) | (298.1 | ) | — | (298.1 | ) | |||||||
Long-term debt(b) | (288.0 | ) | (588.2 | ) | 300.2 | |||||||
Net cash and investments(c) | $ | 1,494.0 | $ | 786.2 | $ | 707.8 | ||||||
Equity | $ | 3,457.4 | $ | 3,299.6 | $ | 157.8 | ||||||
(a) | Recorded within other non-current assets in our consolidated balance sheets. |
(b) | See Note 11 to the accompanying consolidated financial statements for discussion of the carrying values of our debt. |
(c) | "Net cash and investments" is defined as cash and cash equivalents, plus short-term and non-current investments, less total debt. |
The increase in our net cash and investments position at March 31, 2018 as compared to April 1, 2017 was primarily due to our operating cash flows of $975.1 million, partially offset by our use of cash to invest in our business through $161.6 million in capital expenditures and to make dividend payments of $162.4 million.
The increase in equity was primarily attributable to our comprehensive income and the net impact of stock-based compensation arrangements, partially offset by our dividends declared during Fiscal 2018.
Cash Flows
Fiscal 2018 Compared to Fiscal 2017
Fiscal Years Ended | ||||||||||||
March 31, 2018 | April 1, 2017 | $ Change | ||||||||||
(millions) | ||||||||||||
Net cash provided by operating activities | $ | 975.1 | $ | 952.6 | $ | 22.5 | ||||||
Net cash used in investing activities | (189.1 | ) | (208.1 | ) | 19.0 | |||||||
Net cash used in financing activities | (197.5 | ) | (518.4 | ) | 320.9 | |||||||
Effect of exchange rate changes on cash, cash equivalents, and restricted cash | 55.2 | (16.4 | ) | 71.6 | ||||||||
Net increase in cash, cash equivalents, and restricted cash | $ | 643.7 | $ | 209.7 | $ | 434.0 | ||||||
56 | ||
Net Cash Provided by Operating Activities. Net cash provided by operating activities increased to $975.1 million during Fiscal 2018, from $952.6 million during Fiscal 2017. The $22.5 million net increase in cash provided by operating activities was due to a net favorable change related to our operating assets and liabilities, including our working capital, as compared to the prior fiscal year, partially offset by a decline in net income before non-cash charges. The decline in net income before non-cash charges reflected a net charge of $209.3 million recorded during Fiscal 2018 in connection with the TCJA's one-time mandatory transition tax. This charge, which is expected to be paid over an eight-year period net of foreign tax credits and other federal income tax activity (see "Contractual and Other Obligations" below), did not impact our cash flows from operating activities during Fiscal 2018 as reflected in the offsetting net favorable change in our income taxes payable and deferred taxes. Excluding the impact of this enactment-related charge, the net increase related to our operating assets and liabilities, including working capital, was primarily due to:
• | favorable changes in our (i) other income tax receivables and payables (excluding the impact of the one-time mandatory transition tax) and (ii) deferred income, both largely driven by the timing of cash collections and payments. |
These increases related to our operating assets and liabilities were partially offset by:
• | a less favorable change related to our inventory in Fiscal 2018 as compared to Fiscal 2017, largely driven by the timing of our inventory management initiatives and the timing of inventory receipts; and |
• | unfavorable changes in our (i) accounts payable and accrued liabilities and (ii) accounts receivable, largely driven by the timing of cash payments and collections, respectively. |
Net Cash Used in Investing Activities. Net cash used in investing activities was $189.1 million during Fiscal 2018, as compared to $208.1 million during Fiscal 2017. The $19.0 million net decrease in cash used in investing activities was primarily driven by:
• | a $122.4 million decline in capital expenditures. During Fiscal 2018, we spent $161.6 million on capital expenditures, as compared to $284.0 million during Fiscal 2017. Our capital expenditures during Fiscal 2018 primarily related to our global retail and department store renovations, new store openings, and the continued enhancements to our global information technology systems. |
This decrease in cash used in investing activities was partially offset by:
• | a $104.9 million increase in purchases of investments, less proceeds from sales and maturities of investments. During Fiscal 2018, we made net investment purchases of $22.9 million, as compared to receiving net proceeds from sales and maturities of investments of $82.0 million during Fiscal 2017. |
In Fiscal 2019, we expect to spend approximately $275 million in capital expenditures, primarily on consumer-facing initiatives that have demonstrated a proof of concept and healthy rates of return, including our global store fleet and digital ecosystem.
Net Cash Used in Financing Activities. Net cash used in financing activities was $197.5 million during Fiscal 2018, as compared to $518.4 million during Fiscal 2017. The $320.9 million net decrease in cash used in financing activities was primarily driven by:
• | a $198.1 million decline in cash used to repurchase shares of our Class A common stock. During Fiscal 2018, $17.1 million in shares of Class A common stock were surrendered or withheld in satisfaction of withholding taxes in connection with the vesting of awards under our long-term stock incentive plans. On a comparative basis, during Fiscal 2017, we used $200.0 million to repurchase shares of Class A common stock pursuant to our common stock repurchase program, and an additional $15.2 million in shares of Class A common stock were surrendered or withheld for taxes; and |
• | a $126.2 million decline in cash used to repay debt, less proceeds from debt issuances. During Fiscal 2018, we received $10.1 million in borrowings under our credit facilities. During Fiscal 2017, we made $90.0 million in net repayments related to our commercial paper note issuances and repayments and repaid $26.1 million of borrowings previously outstanding under our credit facilities. |
57 | ||
Fiscal 2017 Compared to Fiscal 2016
Fiscal Years Ended | ||||||||||||
April 1, 2017 | April 2, 2016 | $ Change | ||||||||||
(millions) | ||||||||||||
Net cash provided by operating activities | $ | 952.6 | $ | 1,016.7 | $ | (64.1 | ) | |||||
Net cash used in investing activities | (208.1 | ) | (576.3 | ) | 368.2 | |||||||
Net cash used in financing activities | (518.4 | ) | (483.0 | ) | (35.4 | ) | ||||||
Effect of exchange rate changes on cash, cash equivalents, and restricted cash | (16.4 | ) | 7.2 | (23.6 | ) | |||||||
Net increase (decrease) in cash, cash equivalents, and restricted cash | $ | 209.7 | $ | (35.4 | ) | $ | 245.1 | |||||
Net Cash Provided by Operating Activities. Net cash provided by operating activities decreased to $952.6 million during Fiscal 2017, from $1.017 billion during Fiscal 2016. The $64.1 million net decrease in cash provided by operating activities was due to a decline in net income before non-cash charges, partially offset by a net favorable change related to our operating assets and liabilities, including our working capital. The net increase related to our working capital was primarily driven by:
• | a decline in our inventory levels, largely driven by our inventory management initiatives, lower sourcing costs, and the timing of inventory receipts. |
This increase related to our working capital was partially offset by:
• | an unfavorable change in our accounts receivable, largely driven by the timing of cash collections; and |
• | an unfavorable change in our prepaid expenses and other current assets, largely driven by the timing of payments. |
Net Cash Used in Investing Activities. Net cash used in investing activities was $208.1 million during Fiscal 2017, as compared to $576.3 million during Fiscal 2016. The $368.2 million net decrease in cash used in investing activities was primarily driven by:
• | a $224.3 million increase in proceeds from sales and maturities of investments, less cash used to purchase investments. During Fiscal 2017, we received net proceeds from sales and maturities of investments of $82.0 million, as compared to making net investment purchases of $142.3 million during Fiscal 2016; and |
• | a $133.7 million decline in capital expenditures. During Fiscal 2017, we spent $284.0 million on capital expenditures, as compared to $417.7 million during Fiscal 2016. Our capital expenditures during Fiscal 2017 primarily related to our global retail store openings, department store renovations, enhancements to our global information technology systems, and further development of our infrastructure. |
Net Cash Used in Financing Activities. Net cash used in financing activities was $518.4 million during Fiscal 2017, as compared to $483.0 million during Fiscal 2016. The $35.4 million net increase in cash used in financing activities was primarily driven by:
• | a $296.8 million increase in cash used to repay debt, less proceeds from debt issuances. During Fiscal 2017, we made $90.0 million in net repayments related to our commercial paper note issuances and repayments and repaid $26.1 million of borrowings previously outstanding under our credit facilities. During Fiscal 2016, we received net proceeds of $299.4 million from the issuance of our 2.625% unsecured senior notes and $26.1 million in borrowings under our credit facilities, which were partially offset by net repayments of $144.8 million related to our commercial paper note issuances and repayments; and |
• | a $28.2 million decline in proceeds from the exercise of stock options. |
These increases in cash used in financing activities were partially offset by:
• | a $285.2 million decrease in cash used to repurchase shares of our Class A common stock. During Fiscal 2017, we used $200.0 million to repurchase shares of Class A common stock pursuant to our common stock repurchase program, and an additional $15.2 million in shares of Class A common stock were surrendered or withheld in satisfaction of |
58 | ||
withholding taxes in connection with the vesting of awards under our long-term stock incentive plans. On a comparative basis, during Fiscal 2016, we used $479.9 million to repurchase shares of Class A common stock pursuant to our common stock repurchase program, and an additional $20.5 million in shares of Class A common stock were surrendered or withheld for taxes.
Sources of Liquidity
Our primary sources of liquidity are the cash flows generated from our operations, our available cash and cash equivalents and short-term investments, availability under our credit facilities, our issuances of commercial paper notes, and other available financing options.
During Fiscal 2018, we generated $975.1 million of net cash flows from our operations. As of March 31, 2018, we had $2.004 billion in cash, cash equivalents, and short-term investments, of which $1.064 billion were held by our subsidiaries domiciled outside the U.S. We are not dependent on foreign cash to fund our domestic operations. Given recent changes to the taxation of undistributed foreign earnings in connection with the TCJA (as discussed within "Recent Developments"), we have reevaluated our permanent reinvestment assertion and determined that undistributed foreign earnings that were subject to the TCJA's one-time mandatory transition tax were no longer considered to be permanently reinvested, effective December 31, 2017. In connection with this decision, we repatriated $252.0 million of cash to the U.S. from certain of our foreign subsidiaries during the fourth quarter of Fiscal 2018, and we repatriated an additional $400.0 million during the first quarter of Fiscal 2019. In addition, we recorded a deferred tax liability of $7.1 million for the expected future remittance of previously taxed foreign earnings. The mandatory transition tax does not apply to undistributed foreign earnings generated after December 31, 2017, and therefore we intend to permanently reinvest any such earnings. However, if our plans change and we choose to repatriate post-2017 earnings to the U.S. in the future, we would be subject to applicable U.S. and foreign taxes.
The following table presents our total availability, borrowings outstanding, and remaining availability under our credit facilities and Commercial Paper Program as of March 31, 2018:
March 31, 2018 | ||||||||||||
Description(a) | Total Availability | Borrowings Outstanding | Remaining Availability | |||||||||
(millions) | ||||||||||||
Global Credit Facility and Commercial Paper Program(b) | $ | 500 | $ | 8 | (c) | $ | 492 | |||||
Pan-Asia Credit Facilities | 52 | 10 | 42 | |||||||||
(a) | As defined in Note 11 to the accompanying consolidated financial statements. |
(b) | Borrowings under the Commercial Paper Program are supported by the Global Credit Facility. Accordingly, we do not expect combined borrowings outstanding under the Commercial Paper Program and the Global Credit Facility to exceed $500 million. |
(c) | Represents outstanding letters of credit for which we were contingently liable under the Global Credit Facility as of March 31, 2018. |
We believe that the Global Credit Facility is adequately diversified with no undue concentration in any one financial institution. In particular, as of March 31, 2018, there were nine financial institutions participating in the Global Credit Facility, with no one participant maintaining a maximum commitment percentage in excess of 20%. Borrowings under the Pan-Asia Credit Facilities are guaranteed by the parent company and are granted at the sole discretion of the participating regional branches of JPMorgan Chase (the "Banks"), subject to availability of the Banks' funds and satisfaction of certain regulatory requirements. We have no reason to believe that the participating institutions will be unable to fulfill their obligations to provide financing in accordance with the terms of the Global Credit Facility and the Pan-Asia Credit Facilities in the event of our election to draw funds in the foreseeable future.
Our sources of liquidity are used to fund our ongoing cash requirements, including working capital requirements, global retail store and digital commerce expansion, construction and renovation of shop-within-shops, investment in infrastructure, including technology, acquisitions, joint ventures, payment of dividends, debt repayments, Class A common stock repurchases, settlement of contingent liabilities (including uncertain tax positions), and other corporate activities, including our restructuring actions. We believe that our existing sources of cash, the availability under our credit facilities, and our ability to access capital markets will be sufficient to support our operating, capital, and debt service requirements for the foreseeable future, the ongoing development of our businesses, and our plans for further business expansion.
59 | ||
See Note 11 to the accompanying consolidated financial statements for additional information relating to our credit facilities.
Common Stock Repurchase Program
As of March 31, 2018, the remaining availability under our Class A common stock repurchase program was approximately $100 million. Repurchases of shares of Class A common stock are subject to overall business and market conditions.
See Note 15 to the accompanying consolidated financial statements for additional information relating to our Class A common stock repurchase program.
Dividends
Since 2003, we have maintained, and intend to continue to maintain, a regular quarterly cash dividend program on our common stock. However, any decision to declare and pay dividends in the future will be made at the discretion of our Board of Directors and will depend on our results of operations, cash requirements, financial condition, and other factors that the Board of Directors may deem relevant.
See Note 15 to the accompanying consolidated financial statements for additional information relating to our quarterly cash dividend program.
Debt and Covenant Compliance
In September 2013, we completed a registered public debt offering and issued $300 million aggregate principal amount of unsecured senior notes due September 26, 2018, which bear interest at a fixed rate of 2.125%, payable semi-annually (the "2.125% Senior Notes"). In August 2015, we completed a second registered public debt offering and issued an additional $300 million aggregate principal amount of unsecured senior notes due August 18, 2020, which bear interest at a fixed rate of 2.625%, payable semi-annually (the "2.625% Senior Notes").
The indenture and supplemental indentures governing the 2.125% Senior Notes and 2.625% Senior Notes (as supplemented, the "Indenture") contain certain covenants that restrict our ability, subject to specified exceptions, to incur certain liens; enter into sale and leaseback transactions; consolidate or merge with another party; or sell, lease, or convey all or substantially all of our property or assets to another party. However, the Indenture does not contain any financial covenants.
The Global Credit Facility contains a number of covenants, as described in Note 11 to the accompanying consolidated financial statements. As of March 31, 2018, no Event of Default (as such term is defined pursuant to the Global Credit Facility) has occurred under our Global Credit Facility. The Pan-Asia Credit Facilities do not contain any financial covenants.
See Note 11 to the accompanying consolidated financial statements for additional information relating to our debt and covenant compliance.
60 | ||
Contractual and Other Obligations
Firm Commitments
The following table summarizes certain of our aggregate contractual obligations as of March 31, 2018, and the estimated timing and effect that such obligations are expected to have on our liquidity and cash flows in future periods. We expect to fund these firm commitments with operating cash flows generated in the normal course of business and, if necessary, through availability under our credit facilities or other accessible sources of financing.
Fiscal 2019 | Fiscal 2020-2021 | Fiscal 2022-2023 | Fiscal 2024 and Thereafter | Total | ||||||||||||||||
(millions) | ||||||||||||||||||||
Senior Notes | $ | 300.0 | $ | 300.0 | $ | — | $ | — | $ | 600.0 | ||||||||||
Interest payments on Senior Notes | 11.1 | 11.8 | — | — | 22.9 | |||||||||||||||
Operating leases | 343.8 | 580.7 | 419.2 | 504.5 | 1,848.2 | |||||||||||||||
Capital leases | 29.6 | 62.4 | 58.3 | 78.5 | 228.8 | |||||||||||||||
Inventory purchase commitments | 741.7 | — | — | — | 741.7 | |||||||||||||||
Mandatory transition tax payments | 23.0 | 23.2 | 30.8 | 70.8 | 147.8 | |||||||||||||||
Other commitments | 40.6 | 55.4 | 11.0 | — | 107.0 | |||||||||||||||
Total | $ | 1,489.8 | $ | 1,033.5 | $ | 519.3 | $ | 653.8 | $ | 3,696.4 | ||||||||||
The following is a description of our material, firmly committed obligations as of March 31, 2018:
• | Senior Notes represent the principal amount of our outstanding 2.125% Senior Notes and 2.625% Senior Notes. Amounts do not include any fair value adjustments, call premiums, unamortized debt issuance costs, or interest payments (see below); |
• | Interest payments on Senior Notes represent the semi-annual contractual interest payments due on our 2.125% Senior Notes and 2.625% Senior Notes. Amounts do not include the impact of potential cash flows underlying our swap contracts entered into during Fiscal 2016 (see Note 13 to the accompanying consolidated financial statements for discussion of our swap contracts); |
• | Lease obligations represent the minimum rental payments due under noncancelable leases for our real estate and operating equipment. In addition to such amounts, we are normally required to pay taxes, insurance, and certain occupancy costs relating to our leased real estate properties, which are not included in the table above. Approximately 75% of these lease obligations relate to our retail operations. Information has been presented separately for operating and capital leases; |
• | Inventory purchase commitments represent our legally-binding agreements to purchase fixed or minimum quantities of goods at determinable prices; |
• | Mandatory transition tax payments represent our tax obligation incurred in connection with the deemed repatriation of previously deferred foreign earnings pursuant to the TCJA (see Note 10 to the accompanying consolidated financial statements for discussion of the TCJA). The expected mandatory transition tax payments have been presented net of foreign tax credits and other federal income tax activity of $61.5 million, which we expect to utilize to partially reduce this tax obligation; and |
• | Other commitments primarily represent our legally-binding obligations under sponsorship, licensing, and other marketing and advertising agreements; distribution-related agreements; information technology-related service agreements; and pension-related obligations. |
Excluded from the above contractual obligations table is the non-current liability for unrecognized tax benefits of $79.2 million as of March 31, 2018, as we cannot make a reliable estimate of the period in which the liability will be settled, if ever. The above table also excludes the following: (i) other than the current portion of long-term debt, capital lease obligations, and mandatory transition tax payments, amounts recorded in current liabilities in our consolidated balance sheet as of March 31, 2018, including $10.1 million in borrowings outstanding under our Pan-Asia Credit Facilities, which will be paid within one year; and (ii) non-current liabilities that have no cash outflows associated with them (e.g., deferred revenue), or the cash outflows associated with
61 | ||
them are uncertain or do not represent a "purchase obligation" as the term is used herein (e.g., deferred taxes, derivative financial instruments, and other miscellaneous items).
We also have certain contractual arrangements that would require us to make payments if certain events or circumstances occur. See Note 14 to the accompanying consolidated financial statements for a description of our contingent commitments not included in the above table.
Off-Balance Sheet Arrangements
In addition to the commitments included in the above table, our other off-balance sheet firm commitments relating to our outstanding letters of credit amounted to $9.3 million as of March 31, 2018. We do not maintain any other off-balance sheet arrangements, transactions, obligations, or other relationships with unconsolidated entities that would be expected to have a material current or future effect on our consolidated financial statements.
MARKET RISK MANAGEMENT
As discussed in Note 13 to the accompanying consolidated financial statements, we are exposed to a variety of risks, including changes in foreign currency exchange rates relating to foreign currency-denominated balances, certain anticipated cash flows from our international operations, and possible declines in the value of reported net assets of our foreign operations, as well as changes in the fair value of our fixed-rate debt relating to changes in interest rates. Consequently, at times, in the normal course of business, we employ established policies and procedures, including the use of derivative financial instruments, to manage such risks. We do not enter into derivative transactions for speculative or trading purposes.
As a result of the use of derivative instruments, we are exposed to the risk that counterparties to our contracts will fail to meet their contractual obligations. To mitigate this counterparty credit risk, we have a policy of only entering into contracts with carefully selected financial institutions based upon an evaluation of their credit ratings and certain other factors, adhering to established limits for credit exposure. Our established policies and procedures for mitigating credit risk from derivative transactions include ongoing review and assessment of the creditworthiness of our counterparties. We also enter into master netting arrangements with counterparties, when possible, to mitigate credit risk associated with our derivative instruments. As a result of the above considerations, we do not believe that we are exposed to any undue concentration of counterparty risk with respect to our derivative contracts as of March 31, 2018. However, we do have in aggregate $1.6 million of derivative instruments in net asset positions with two creditworthy financial institutions.
Foreign Currency Risk Management
We manage our exposure to changes in foreign currency exchange rates through the use of forward foreign currency exchange and cross-currency swap contracts. Refer to Note 13 to the accompanying consolidated financial statements for a summary of the notional amounts and fair values of our forward foreign currency exchange and cross-currency swap contracts outstanding as of March 31, 2018.
Forward Foreign Currency Exchange Contracts
We enter into forward foreign currency exchange contracts as hedges to reduce our risk related to exchange rate fluctuations on inventory transactions made in an entity's non-functional currency, intercompany royalty payments made by certain of our international operations, the settlement of foreign currency-denominated balances, and the translation of certain foreign operations' net assets into U.S. Dollars. As part of our overall strategy to manage the level of exposure to the risk of foreign currency exchange rate fluctuations, primarily to changes in the value of the Euro, the Japanese Yen, the South Korean Won, the Australian Dollar, the Canadian Dollar, the British Pound Sterling, the Swiss Franc, the Swedish Krona, the Chinese Renminbi, the New Taiwan Dollar, and the Hong Kong Dollar, we hedge a portion of our foreign currency exposures anticipated over a two-year period. In doing so, we use forward foreign currency exchange contracts that generally have maturities of two months to two years to provide continuing coverage throughout the hedging period of the respective exposure.
Our foreign exchange risk management activities are governed by our Company's established policies and procedures. These policies and procedures provide a framework that allows for the management of currency exposures while ensuring the activities are conducted within our established guidelines. Our policies include guidelines for the organizational structure of our risk management function and for internal controls over foreign exchange risk management activities, including, but not limited to, authorization levels, transaction limits, and credit quality controls, as well as various measurements for monitoring compliance. We monitor foreign exchange risk using different techniques, including a periodic review of market values and sensitivity analyses.
62 | ||
We record our forward foreign currency exchange contracts at fair value in our consolidated balance sheets. To the extent forward foreign currency exchange contracts are designated as cash flow hedges and are highly effective in offsetting changes in the value of the hedged items, the related gains or losses are initially deferred in equity as a component of accumulated other comprehensive income ("AOCI") and are subsequently recognized in our consolidated statements of operations as follows:
• | Forecasted Inventory Transactions — recognized as part of the cost of the inventory being hedged within cost of goods sold when the related inventory is sold to a third party. |
• | Intercompany Royalties/Settlement of Foreign Currency Balances — recognized within other expense, net, during the period that the hedged balance is remeasured through earnings, generally through its settlement when the related payment occurs. |
We recognized in earnings net losses on forward foreign currency exchange contracts of $8.7 million and $2.6 million during Fiscal 2018 and Fiscal 2017, respectively, and a net gain of $32.4 million during Fiscal 2016.
Cross-Currency Swap Contracts
During Fiscal 2016, we entered into two pay-floating rate, receive-floating rate cross-currency swaps, with notional amounts of €280 million and €274 million, which we designated as hedges of our net investment in certain of our European subsidiaries (the "Cross-Currency Swaps"). The Cross-Currency Swaps, which mature on September 26, 2018 and August 18, 2020, respectively, swap the U.S. Dollar-denominated variable interest rate payments based on the 3-month London Interbank Offered Rate ("LIBOR") plus a fixed spread for Euro-denominated variable interest rate payments based on the 3-month Euro Interbank Offered Rate plus a fixed spread. As a result, the Cross-Currency Swaps, in conjunction with the Interest Rate Swaps (as defined below), economically convert our $300 million fixed-rate 2.125% and $300 million fixed-rate 2.625% obligations to €280 million and €274 million floating-rate Euro-denominated liabilities, respectively.
Sensitivity
We perform a sensitivity analysis to determine the effects that market risk exposures may have on the fair values of our forward foreign currency exchange and cross-currency swap contracts. To perform the analysis, we assess the risk of loss in these contracts' fair values that would result from hypothetical changes in foreign currency exchange rates. This analysis assumes a like movement by the foreign currencies in our hedge portfolio against the U.S. Dollar. As of March 31, 2018, a 10% appreciation or depreciation of the U.S. Dollar against the exchange rates for foreign currencies under contract would result in a net increase or decrease, respectively, in the fair value of our derivative portfolio of approximately $141 million. This hypothetical net change in fair value should ultimately be largely offset by the net change in the fair values of the underlying hedged items.
Interest Rate Risk Management
During Fiscal 2016, we entered into two pay-floating rate, receive-fixed rate interest rate swap contracts which we designated as hedges against changes in the respective fair values of our fixed-rate 2.125% Senior Notes and our fixed-rate 2.625% Senior Notes attributed to changes in the benchmark interest rate (the "Interest Rate Swaps"). The Interest Rate Swaps, which mature on September 26, 2018 and August 18, 2020, respectively, both have notional amounts of $300 million and swap the fixed interest rates on our 2.125% Senior Notes and 2.625% Senior Notes for variable interest rates based on 3-month LIBOR plus a fixed spread.
Sensitivity
As of March 31, 2018, notwithstanding the aforementioned Interest Rate Swaps, we had no variable-rate debt outstanding. As such, our exposure to changes in interest rates primarily relates to a change in the fair value of our fixed-rate Senior Notes and borrowings outstanding under our credit facilities. As of March 31, 2018, the fair values of our Senior Notes and borrowings outstanding under our credit facilities were $598.1 million and $10.1 million, respectively. A 25 basis point increase or decrease in the level of interest rates would decrease or increase, respectively, the aggregate fair value of our Senior Notes and borrowings outstanding under our credit facilities by approximately $2 million. Such potential increases or decreases in the fair value of our debt would only be relevant if we were to retire all or a portion of the debt prior to its maturity, and are based on certain simplifying assumptions, including an immediate across-the-board increase or decrease in the level of interest rates with no other subsequent changes for the remainder of the period.
63 | ||
Investment Risk Management
As of March 31, 2018, we had cash and cash equivalents on-hand of $1.305 billion, consisting of deposits in interest bearing accounts, investments in money market deposit accounts, and investments in time deposits and commercial paper with original maturities of 90 days or less. Our other significant investments included $699.4 million of short-term investments, consisting of investments in time deposits and commercial paper with original maturities greater than 90 days; $50.9 million of restricted cash placed in escrow with certain banks as collateral, primarily to secure guarantees in connection with certain international tax matters; and $86.2 million of investments with maturities greater than one year, consisting of time deposits.
We actively monitor our exposure to changes in the fair value of our global investment portfolio in accordance with our established policies and procedures, which include monitoring both general and issuer-specific economic conditions, as discussed further below. Our investment objectives include capital preservation, maintaining adequate liquidity, diversification to minimize liquidity and credit risk, and achievement of maximum returns within the guidelines set forth in our investment policy. See Note 13 to the accompanying consolidated financial statements for further detail of the composition of our investment portfolio as of March 31, 2018.
We evaluate investments held in unrealized loss positions, if any, for other-than-temporary impairment on a quarterly basis. This evaluation involves a variety of considerations, including assessments of risks and uncertainties associated with general economic conditions and distinct conditions affecting specific issuers. We consider the following factors: (i) the length of time and the extent to which the fair value has been below cost, (ii) the financial condition, credit worthiness, and near-term prospects of the issuer, (iii) the length of time to maturity, (iv) anticipated future economic conditions and market forecasts, (v) our intent and ability to retain our investment for a period of time sufficient to allow for recovery of market value, and (vi) an assessment of whether it is more likely than not that we will be required to sell our investment before recovery of market value. No material realized or unrealized gains or losses on available-for-sale investments or other-than-temporary impairment charges were recorded in any of the fiscal years presented.
CRITICAL ACCOUNTING POLICIES
An accounting policy is considered to be critical if it is important to our results of operations, financial condition, and cash flows, and requires significant judgment and estimates on the part of management in its application. Our estimates are often based on complex judgments, assessments of probability, and assumptions that management believes to be reasonable, but that are inherently uncertain and unpredictable. It is also possible that other professionals, applying reasonable judgment to the same set of facts and circumstances, could develop and support a range of alternative estimated amounts. We believe that the following list represents our critical accounting policies. For a discussion of all of our significant accounting policies, including our critical accounting policies, see Note 3 to the accompanying consolidated financial statements.
Sales Reserves and Uncollectible Accounts
A significant area of judgment affecting reported revenue and net income involves estimating sales reserves, which represent the portion of gross revenues not expected to be realized. In particular, revenue related to our wholesale business is reduced by estimates of returns, discounts, end-of-season markdowns, and operational chargebacks. Revenue related to our retail business, including digital commerce sales, is also reduced by an estimate of returns.
In determining estimates of returns, discounts, end-of-season markdowns, and operational chargebacks, we analyze historical trends, seasonal results, current economic and market conditions, and retailer performance. We review and refine these estimates on a quarterly basis. Our historical estimates of these costs have not differed materially from actual results. A hypothetical 1% increase in our reserves for returns, discounts, end-of-season markdowns, and operational chargebacks as of March 31, 2018 would have decreased our Fiscal 2018 net revenues by approximately $2 million.
Similarly, we evaluate our accounts receivable balances to determine if they will ultimately be collected. Significant judgments and estimates are involved in this evaluation, including an analysis of specific risks on a customer-by-customer basis for larger accounts and customers, and a receivables aging analysis that determines the percentage of receivables that has historically been uncollected by aged category. Based on this information, we provide a reserve for the estimated amounts believed to be uncollectible. Although we believe that we have adequately provided for those risks as part of our bad debt reserve, a severe and prolonged adverse impact on our major customers' business operations could have a corresponding material adverse effect on our net sales, cash flows, and/or financial condition.
64 | ||
See "Accounts Receivable" in Note 3 to the accompanying consolidated financial statements for an analysis of the activity in our sales reserves and allowance for doubtful accounts for each of the three fiscal years presented.
Inventories
We hold inventory that is sold through wholesale distribution channels to major department stores and specialty retail stores. We also hold retail inventory that is sold in our own stores and digital commerce sites directly to consumers. Substantially all of our inventories are comprised of finished goods, which are stated at the lower of cost or estimated realizable value, with cost determined on a weighted-average cost basis.
The estimated net realizable value of inventory is determined based on an analysis of historical sales trends of our individual product lines, the impact of market trends and economic conditions, and a forecast of future demand, giving consideration to the value of current orders in-house for future sales of inventory, as well as plans to sell inventory through our factory stores, among other liquidation channels. Actual results may differ from estimates due to the quantity, quality, and mix of products in inventory, consumer and retailer preferences, and market conditions. Reserves for inventory shrinkage, representing the risk of physical loss of inventory, are estimated based on historical experience and are adjusted based upon physical inventory counts. Our historical estimates of these costs and the related provisions have not differed materially from actual results.
A hypothetical 1% increase in the level of our inventory reserves as of March 31, 2018 would have decreased our Fiscal 2018 gross profit by approximately $1 million.
Impairment of Goodwill and Other Intangible Assets
Goodwill and certain other intangible assets deemed to have indefinite useful lives are not amortized. Rather, goodwill and indefinite-lived intangible assets are assessed for impairment at least annually. Finite-lived intangible assets are amortized over their respective estimated useful lives and, along with other long-lived assets, are evaluated for impairment periodically whenever events or changes in circumstances indicate that their carrying values may not be fully recoverable.
We generally perform our annual goodwill impairment assessment using a qualitative approach to determine whether it is more likely than not that the fair value of a reporting unit is less than its respective carrying value. However, in order to reassess the fair values of our reporting units, we periodically perform a quantitative impairment analysis in lieu of using the qualitative approach.
Performance of the qualitative goodwill impairment assessment requires judgment in identifying and considering the significance of relevant key factors, events, and circumstances that affect the fair values of our reporting units. This requires consideration and assessment of external factors such as macroeconomic, industry, and market conditions, as well as entity-specific factors, such as our actual and planned financial performance. We also give consideration to the difference between each reporting unit's fair value and carrying value as of the most recent date that a fair value measurement was performed. If the results of the qualitative assessment conclude that it is not more likely than not that the fair value of a reporting unit exceeds its carrying value, additional quantitative impairment testing is performed.
The quantitative goodwill impairment test involves comparing the fair value of a reporting unit with its carrying value, including goodwill. If the fair value of a reporting unit exceeds its carrying value, the reporting unit's goodwill is considered not to be impaired. However, if the carrying value of a reporting unit exceeds its fair value, an impairment loss is recorded in an amount equal to that excess. Any impairment charge recognized is limited to the amount of the respective reporting unit's allocated goodwill.
Determining the fair value of a reporting unit under the quantitative goodwill impairment test requires judgment and often involves the use of significant estimates and assumptions. Similarly, estimates and assumptions are used when determining the fair values of other indefinite-lived intangible assets. These estimates and assumptions could have a significant impact on whether or not an impairment charge is recognized and the magnitude of any such charge. To assist management in the process of determining any potential goodwill impairment, we may review and consider appraisals from accredited independent valuation firms. Estimates of fair value are primarily determined using discounted cash flows, market comparisons, and recent transactions. These approaches use significant estimates and assumptions, including projected future cash flows (including timing), discount rates reflecting the risks inherent in future cash flows, perpetual growth rates, and determination of appropriate market comparables.
We performed our annual goodwill impairment assessment as of the beginning of the second quarter of Fiscal 2018 using the qualitative approach discussed above, while giving consideration to our most recent quantitative goodwill impairment test (the results of which indicated that the fair values of our reporting units with allocated goodwill significantly exceeded their respective
65 | ||
carrying values). Based on the results of the qualitative impairment assessment performed, we concluded that it is more likely than not that the fair values of these reporting units significantly exceeded their respective carrying values and there were no reporting units at risk of impairment. Additionally, no goodwill impairment charges were recorded during any of the three fiscal years presented in connection with the Company's annual goodwill impairment assessments.
Subsequent to our Fiscal 2017 annual goodwill impairment assessment, we realigned our segment reporting structure during the fourth quarter of Fiscal 2017 as a result of significant organizational changes implemented in connection with the Way Forward Plan. As a result of the realignment of our segment reporting structure, we reallocated the carrying amount of goodwill to our new reporting units based upon each reporting unit's relative fair value as of the first day of our fourth quarter of Fiscal 2017. In connection with this reallocation, we performed an interim assessment of the recoverability of goodwill assigned to our new reporting units using the quantitative approach described above. Based on the results of the quantitative impairment assessment performed, we concluded that the fair value of one of our new reporting units was less than its carrying value. As a result, a goodwill impairment charge of $5.2 million was recorded during the fourth quarter of Fiscal 2017 to fully write off the carrying value of the reporting unit's reallocated goodwill. The fair values of the remaining new reporting units significantly exceeded their respective carrying values and were not at risk of impairment.
In evaluating finite-lived intangible assets for recoverability, we use our best estimate of future cash flows expected to result from the use of the asset and its eventual disposition where probable. To the extent that estimated future undiscounted net cash flows attributable to the asset are less than its carrying value, an impairment loss is recognized equal to the difference between the carrying value of such asset and its fair value, considering external market participant assumptions.
During Fiscal 2018, we recorded a non-cash impairment charge of $8.8 million as a result of a change in the planned usage of a certain intangible asset to reduce the value of the intangible asset to its estimated fair value. There were no other finite-lived intangible asset impairment charges recorded during any of the fiscal periods presented. See Note 8 to the accompanying consolidated financial statements for further discussion.
It is possible that our conclusions regarding impairment or recoverability of goodwill or other intangible assets could change in future periods if, for example, (i) our businesses do not perform as projected, (ii) overall economic conditions in future years vary from current assumptions, (iii) business conditions or strategies change from our current assumptions, or (iv) the identification of our reporting units change, among other factors. Such changes could result in a future impairment charge of goodwill or other intangible assets, which could have a material adverse effect on our consolidated financial position or results of operations.
Impairment of Other Long-Lived Assets
Property and equipment, along with other long-lived assets, are evaluated for impairment periodically whenever events or changes in circumstances indicate that their related carrying values may not be fully recoverable. In evaluating long-lived assets for recoverability, we use our best estimate of future cash flows expected to result from the use of the asset and its eventual disposition, where applicable. To the extent that estimated future undiscounted net cash flows attributable to the asset are less than its carrying value, an impairment loss is recognized equal to the difference between the carrying value of such asset and its fair value, considering external market participant assumptions. Assets to be disposed of and for which there is a committed plan of disposal are reported at the lower of carrying value or fair value, less costs to sell.
In determining future cash flows, we take various factors into account, including changes in merchandising strategy, the emphasis on retail store cost controls, the effects of macroeconomic trends such as consumer spending, and the impacts of more experienced retail store managers and increased local advertising. Since the determination of future cash flows is an estimate of future performance, future impairments may arise in the event that future cash flows do not meet expectations.
During Fiscal 2018, Fiscal 2017, and Fiscal 2016, we recorded non-cash impairment charges of $41.2 million, $248.6 million, and $48.8 million, respectively, to fully write off the carrying values of certain long-lived assets based upon their assumed fair values of zero. See Note 8 to the accompanying consolidated financial statements for further discussion.
Income Taxes
In determining our income tax provision for financial reporting purposes, we establish a reserve for uncertain tax positions. If we consider that a tax position is more likely than not of being sustained upon audit, based solely on the technical merits of the position, we recognize the tax benefit. We measure the tax benefit by determining the largest amount that is greater than 50% likely of being realized upon settlement, presuming that the tax position is examined by the appropriate taxing authority that has full knowledge of all relevant information. These assessments can be complex and require significant judgment, and we often obtain assistance from external advisors. To the extent that our estimates change or the final tax outcome of these matters is different
66 | ||
from the amounts recorded, such differences will impact the income tax provision in the period in which such determinations are made. If the initial assessment of a position fails to result in the recognition of a tax benefit, we will recognize the tax benefit if (i) there are changes in tax law or analogous case law that sufficiently raise the likelihood of prevailing on the technical merits of the position to more likely than not; (ii) the statute of limitations expires; or (iii) there is a completion of an audit resulting in a settlement of that tax year with the appropriate agency.
Deferred income taxes reflect the tax effect of certain net operating losses, capital losses, general business credit carryforwards, and the net tax effects of temporary differences between the carrying amount of assets and liabilities for financial statement and income tax purposes, as determined under enacted tax laws and rates. Valuation allowances are established when management determines that it is more likely than not that some portion or all of a deferred tax asset will not be realized. Tax valuation allowances are analyzed periodically by assessing the adequacy of future expected taxable income, which typically involves the use of significant estimates. Such allowances are adjusted as events occur, or circumstances change, that warrant adjustments to those balances.
During Fiscal 2018, we recorded net charges of $221.4 million within our income tax provision in connection with the TCJA. These charges were recorded on a provisional basis, as permitted by SAB 118, based on our present interpretations of the TCJA, current available information, and assumptions about future events. Although we believe these provisional amounts represent a reasonable estimate of the ultimate enactment-related impact the TCJA will have on our consolidated financial statements, the amounts could be adjusted materially as additional information becomes available, including potential new or interpretative guidance issued by the Financial Accounting Standards Board or the Internal Revenue Service and other tax agencies, and as further analyses are completed.
See Note 10 to the accompanying consolidated financial statements for further discussion of income taxes.
Contingencies
We are periodically exposed to various contingencies in the ordinary course of conducting our business, including certain litigation, alleged information system security breaches, contractual disputes, employee relation matters, various tax or other governmental audits, and trademark and intellectual property matters and disputes. We record a liability for such contingencies to the extent that we conclude their occurrence is probable and the related losses are estimable. In addition, if it is reasonably possible that an unfavorable settlement of a contingency could exceed the established liability, we disclose the estimated impact on our liquidity, financial condition, and results of operations, if practicable. Management considers many factors in making these assessments. As the ultimate resolution of contingencies is inherently unpredictable, these assessments can involve a series of complex judgments about future events including, but not limited to, court rulings, negotiations between affected parties, and governmental actions. As a result, the accounting for loss contingencies relies heavily on management's judgment in developing the related estimates and assumptions.
Stock-Based Compensation
We expense all stock-based compensation awarded to employees and non-employee directors based on the grant date fair value of the awards over the requisite service period, adjusted for forfeitures which are estimated based on an analysis of historical experience and expected future trends.
Stock Options
Stock options have been granted to employees and non-employee directors with exercise prices equal to the fair market value of our Class A common stock on the date of grant. We use the Black-Scholes option-pricing model to estimate the grant date fair value of stock options, which requires the use of both subjective and objective assumptions. Certain key assumptions involve estimating future uncertain events. The key factors influencing the estimation process include the expected term of the option, expected volatility of our stock price, our expected dividend yield, and the risk-free interest rate, among others. Generally, once stock option values are determined, accounting practices do not permit them to be changed, even if the estimates used are different from actual results.
No stock options were granted during any of the three fiscal years presented. See Note 17 to the accompanying consolidated financial statements for further discussion.
67 | ||
Restricted Stock and Restricted Stock Units ("RSUs")
We grant restricted shares of our Class A common stock to our non-employee directors and service-based RSUs to certain of our senior executives and other employees. In addition, we grant performance-based RSUs to such senior executives and other key executives. The fair values of restricted stock shares and RSUs are based on the fair value of our Class A common stock on the date of grant, adjusted to reflect the absence of dividends for any awards not entitled to accrue dividend equivalents while outstanding. Compensation expense for performance-based RSUs is recognized over the employees' requisite service period when attainment of the performance goals is deemed probable, which involves judgment as to achievement of certain performance metrics.
Our performance-based RSU awards with a market condition in the form of a total shareholder return ("TSR") modifier are valued based on the expected attainment of performance at the end of a three-year performance period and TSR achieved relative to the S&P 500 index over the performance period. The fair value of these awards is estimated using a Monte Carlo simulation valuation model prepared by an independent third party. This pricing model utilizes multiple input variables that determine the probability of satisfying each market condition stipulated in the terms of the award to estimate its grant date fair value. Compensation expense, net of estimated forfeitures, is updated for the Company's expected net income performance level against the related goal at the end of each reporting period. No performance-based RSUs with a TSR modifier were granted during any of the three fiscal years presented. See Note 17 to the accompanying consolidated financial statements for further discussion.
Sensitivity
The assumptions used in calculating the grant date fair values of stock-based compensation awards represent our best estimates. In addition, judgment is required in estimating the number of stock-based awards that are expected to be forfeited. If actual results differ significantly from our estimates and assumptions, if we change the assumptions used to estimate the grant date fair value for future stock-based award grants, or if there are changes in market conditions, stock-based compensation expense and, therefore, our results of operations could be materially impacted. A hypothetical 10% change in our stock-based compensation expense would have affected our Fiscal 2018 net income by approximately $5 million.
RECENTLY ISSUED ACCOUNTING STANDARDS
See Note 4 to the accompanying consolidated financial statements for a description of certain recently issued or proposed accounting standards which have impacted our consolidated financial statements, or may impact our consolidated financial statements in future reporting periods.
Item 7A. | Quantitative and Qualitative Disclosures about Market Risk. |
For a discussion of our exposure to market risk, see "Market Risk Management" in Item 7 included elsewhere in this Annual Report on Form 10-K.
Item 8. | Financial Statements and Supplementary Data. |
See the "Index to Consolidated Financial Statements" appearing at the end of this Annual Report on Form 10-K.
Item 9. | Changes in and Disagreements with Accountants on Accounting and Financial Disclosure. |
Not applicable.
Item 9A. | Controls and Procedures. |
(a) Evaluation of Disclosure Controls and Procedures
Disclosure controls and procedures are the controls and other procedures of an issuer that are designed to provide reasonable assurance that information required to be disclosed by the issuer in the reports that it files or submits under the Securities Exchange Act of 1934 is recorded, processed, summarized, and reported within the time period specified in the Securities and Exchange Commission's rules and forms. Disclosure controls and procedures include, without limitation, controls and procedures designed
68 | ||
to ensure that material information required to be disclosed by an issuer in the reports that it files or submits under the Securities Exchange Act of 1934 is accumulated and communicated to the issuer's management, including its principal executive and principal financial officers, or persons performing similar functions, as appropriate to allow timely decisions regarding required disclosure.
We have evaluated, under the supervision and with the participation of management, including our principal executive and principal financial officers, the effectiveness of our disclosure controls and procedures, as defined in Rules 13a-15(e) and 15d-15(e) of the Securities Exchange Act of 1934, as of the end of the fiscal year covered by this annual report. Based on that evaluation, our principal executive and principal financial officers have concluded that the Company's disclosure controls and procedures were effective at the reasonable assurance level, as of the fiscal year-end covered by this Annual Report on Form 10-K.
(b) Management's Report on Internal Control Over Financial Reporting
Management is responsible for establishing and maintaining adequate internal control over financial reporting, as defined in Securities Exchange Act Rule 13a-15(f). Internal control over financial reporting is designed to provide reasonable assurance regarding the reliability of financial reporting and preparation of financial statements for external purposes in accordance with U.S. Generally Accepted Accounting Principles. Internal control over financial reporting includes maintaining records that in reasonable detail accurately and fairly reflect our transactions; providing reasonable assurance that transactions are recorded as necessary for preparation of our financial statements; providing reasonable assurance that receipts and expenditures of the Company's assets are made in accordance with management authorization; and providing reasonable assurance that unauthorized acquisition, use or disposition of the Company's assets that could have a material effect on our financial statements would be prevented or detected on a timely basis. Because of its inherent limitations, internal control over financial reporting is not intended to provide absolute assurance that a misstatement of our financial statements would be prevented or detected. Further, the evaluation of the effectiveness of internal control over financial reporting was made as of a specific date, and continued effectiveness in future periods is subject to the risks that controls may become inadequate because of changes in conditions or that the degree of compliance with the policies and procedures may decline.
Under the supervision and with the participation of management, including our principal executive and principal financial officers, we conducted an evaluation of the effectiveness of our internal control over financial reporting as of the end of the fiscal year covered by this report based on the framework issued by the Committee of Sponsoring Organizations of the Treadway Commission in Internal Control-Integrated Framework (2013 Framework). Based on this evaluation, management concluded that the Company's internal controls over financial reporting were effective at the reasonable assurance level as of the fiscal year-end covered by this Annual Report on Form 10-K.
Ernst & Young LLP, the Company's independent registered public accounting firm, has issued an attestation report on the Company's internal control over financial reporting as included elsewhere herein.
(c) Changes in Internal Controls over Financial Reporting
Except as discussed below, there has been no change in our internal control over financial reporting during the fourth quarter of Fiscal 2018 that has materially affected, or is reasonably likely to materially affect, the Company's internal control over financial reporting.
Operating and Financial Reporting System Implementation
During the first quarter of Fiscal 2018, we completed the migration of our European operations to an operating and financial reporting information technology system, SAP, as part of a multi-year plan to integrate and upgrade our global systems and processes.
As a result of the implementation of this system, we have experienced certain changes to our processes and procedures which, in turn, result in changes to our internal control over financial reporting. While we expect SAP to strengthen our internal financial controls by automating certain manual processes and standardizing business processes and reporting across our organization, management will continue to evaluate and monitor our internal controls as processes and procedures in each of the affected areas evolve. For a discussion of risks related to the implementation of new systems, see Item 1A — "Risk Factors — Risks and uncertainties associated with the implementation of information systems may negatively impact our business."
Item 9B. | Other Information. |
Not applicable.
69 | ||
PART III
Item 10. | Directors, Executive Officers and Corporate Governance. |
Information relating to our directors and corporate governance will be set forth in the Company's proxy statement for its 2018 annual meeting of stockholders to be filed within 120 days after March 31, 2018 (the "Proxy Statement") and is incorporated by reference herein. Information relating to our executive officers is set forth in Item 1 of this Annual Report on Form 10-K under the caption "Executive Officers."
We have a Code of Ethics for Principal Executive Officers and Senior Financial Officers that covers the Company's principal executive officer, principal operating officer, principal financial officer, principal accounting officer, controller, and any person performing similar functions, as applicable. We also have a Code of Business Conduct and Ethics that covers the Company's directors, officers, and employees. You can find our Code of Ethics for Principal Executive Officers and Senior Financial Officers and our Code of Business Conduct and Ethics (collectively, the "Codes") on our Internet site, http://investor.ralphlauren.com. We will post any amendments to the Codes and any waivers that are required to be disclosed by the rules of either the SEC or the NYSE on our Internet site.
Item 11. | Executive Compensation. |
Information relating to executive and director compensation will be set forth in the Proxy Statement and such information is incorporated by reference herein.
Item 12. | Security Ownership of Certain Beneficial Owners and Management and Related Stockholder Matters. |
Equity Compensation Plan Information
The following table sets forth information as of March 31, 2018 regarding compensation plans under which the Company's equity securities are authorized for issuance:
(a) | (b) | (c) | |||||||||
Plan Category | Numbers of Securities to be Issued upon Exercise of Outstanding Options, Warrants and Rights | Weighted-Average Exercise Price of Outstanding Options ($) | Number of Securities Remaining Available for Future Issuance Under Equity Compensation Plans (Excluding Securities Reflected in Column (a)) | ||||||||
Equity compensation plans approved by security holders | 3,829,623 | (1) | $ | 157.86 | (2) | 3,111,331 | (3) | ||||
Equity compensation plans not approved by security holders | — | — | — | ||||||||
Total | 3,829,623 | $ | 157.86 | 3,111,331 | |||||||
(1) | Consists of 1,150,895 options to purchase shares of our Class A common stock and 2,678,728 restricted stock units that are payable solely in shares of Class A common stock (including 449,426 service-based restricted stock units that have fully vested but for which the underlying shares have not yet been delivered as of March 31, 2018). Does not include 19,096 outstanding restricted shares that are subject to forfeiture. |
(2) | Represents the weighted average exercise price of outstanding stock options. |
(3) | All of the securities remaining available for future issuance set forth in column (c) may be in the form of options, stock appreciation rights, restricted stock, restricted stock units, performance awards, or other stock-based awards under the Company's 1997 Incentive Plan and 2010 Incentive Plan (the "Plans"). An additional 19,096 outstanding shares of restricted stock granted under the Company's Plans that remain subject to forfeiture are not reflected in column (c). |
Other information relating to security ownership of certain beneficial owners and management will be set forth in the Proxy Statement and such information is incorporated by reference herein.
70 | ||
Item 13. | Certain Relationships and Related Transactions, and Director Independence. |
The information required to be included by Item 13 of Form 10-K will be included in the Proxy Statement and such information is incorporated by reference herein.
Item 14. | Principal Accounting Fees and Services. |
The information required to be included by Item 14 of Form 10-K will be included in the Proxy Statement and such information is incorporated by reference herein.
PART IV
Item 15. | Exhibits, Financial Statement Schedules. |
(a) 1., 2. Financial Statements and Financial Statement Schedules. See index on Page F-1.
3. Exhibits
Exhibit Number | Description | |
3.1 | ||
3.2 | ||
3.3 | ||
4.1 | ||
4.2 | ||
4.3 | ||
10.1 | ||
10.2 | ||
10.3 | ||
10.4 | ||
10.5 | ||
10.6 | ||
10.7 | ||
10.8 | ||
10.9 | ||
10.10 | ||
10.11 | ||
71 | ||
Exhibit Number | Description | |
10.12 | ||
10.13 | ||
10.14 | ||
10.15 | ||
10.16 | ||
10.17 | ||
10.18 | ||
10.19 | ||
10.20 | ||
10.21 | ||
10.22 | ||
10.23 | ||
10.24 | ||
10.25 | ||
10.26 | ||
10.27 | ||
10.28 | ||
10.29 | ||
10.30 | ||
10.31 | ||
10.32 | ||
12.1* | ||
72 | ||
Exhibit Number | Description | |
14.1 | ||
14.2 | ||
21.1* | ||
23.1* | ||
31.1* | ||
31.2* | ||
32.1* | ||
32.2* | ||
101* | Interactive data files pursuant to Rule 405 of Regulation S-T: (i) the Consolidated Balance Sheets at March 31, 2018 and April 1, 2017, (ii) the Consolidated Statements of Operations for the fiscal years ended March 31, 2018, April 1, 2017, and April 2, 2016, (iii) the Consolidated Statements of Comprehensive Income (Loss) for the fiscal years ended March 31, 2018, April 1, 2017, and April 2, 2016, (iv) the Consolidated Statements of Cash Flows for the fiscal years ended March 31, 2018, April 1, 2017, and April 2, 2016, (v) the Consolidated Statements of Equity for the fiscal years ended March 31, 2018, April 1, 2017, and April 2, 2016, and (vi) the Notes to the Consolidated Financial Statements. | |
Exhibits 32.1 and 32.2 shall not be deemed "filed" for purposes of Section 18 of the Securities Exchange Act of 1934, or otherwise subject to the liability of that Section. Such exhibits shall not be deemed incorporated by reference into any filing under the Securities Act of 1933 or Securities Exchange Act of 1934.
* | Filed herewith. |
† | Management contract or compensatory plan or arrangement. |
73 | ||
SIGNATURES
Pursuant to the requirements of the Securities Exchange Act of 1934, the registrant has duly caused this report to be signed on its behalf by the undersigned thereunto duly authorized.
RALPH LAUREN CORPORATION | ||
By: | /S/ JANE HAMILTON NIELSEN | |
Jane Hamilton Nielsen | ||
Chief Financial Officer | ||
(Principal Financial and Accounting Officer) | ||
Date: May 23, 2018 | ||
Pursuant to the requirements of the Securities Exchange Act of 1934, this report has been signed below by the following persons on behalf of the registrant and in the capacities and on the dates indicated:
Signature | Title | Date | ||
/S/ RALPH LAUREN | Executive Chairman, Chief Creative Officer, and Director | May 23, 2018 | ||
Ralph Lauren | ||||
/S/ PATRICE LOUVET | President, Chief Executive Officer, and Director (Principal Executive Officer) | May 23, 2018 | ||
Patrice Louvet | ||||
/S/ JANE HAMILTON NIELSEN | Chief Financial Officer (Principal Financial and Accounting Officer) | May 23, 2018 | ||
Jane Hamilton Nielsen | ||||
/s/ DAVID LAUREN | Vice Chairman, Chief Innovation Officer, Strategic Advisor to the CEO, and Director | May 23, 2018 | ||
David Lauren | ||||
/S/ JOHN R. ALCHIN | Director | May 23, 2018 | ||
John R. Alchin | ||||
/S/ ARNOLD H. ARONSON | Director | May 23, 2018 | ||
Arnold H. Aronson | ||||
/S/ FRANK A. BENNACK, JR. | Director | May 23, 2018 | ||
Frank A. Bennack, Jr. | ||||
/S/ DR. JOYCE F. BROWN | Director | May 23, 2018 | ||
Dr. Joyce F. Brown | ||||
/S/ JOEL L. FLEISHMAN | Director | May 23, 2018 | ||
Joel L. Fleishman | ||||
/s/ MICHAEL A. GEORGE | Director | May 23, 2018 | ||
Michael A. George | ||||
74 | ||
Signature | Title | Date | ||
/S/ HUBERT JOLY | Director | May 23, 2018 | ||
Hubert Joly | ||||
/S/ JUDITH MCHALE | Director | May 23, 2018 | ||
Judith McHale | ||||
/S/ ROBERT C. WRIGHT | Director | May 23, 2018 | ||
Robert C. Wright | ||||
75 | ||
RALPH LAUREN CORPORATION
INDEX TO CONSOLIDATED FINANCIAL STATEMENTS AND SUPPLEMENTARY INFORMATION
Page | ||
Consolidated Financial Statements: | ||
Supplementary Information: | ||
EX-12.1 | ||
EX-21.1 | ||
EX-23.1 | ||
EX-31.1 | ||
EX-31.2 | ||
EX-32.1 | ||
EX-32.2 | ||
EX-101 | INSTANCE DOCUMENT | |
EX-101 | SCHEMA DOCUMENT | |
EX-101 | CALCULATION LINKBASE DOCUMENT | |
EX-101 | LABELS LINKBASE DOCUMENT | |
EX-101 | PRESENTATION LINKBASE DOCUMENT | |
EX-101 | DEFINITION LINKBASE DOCUMENT | |
F-1 | ||
RALPH LAUREN CORPORATION
CONSOLIDATED BALANCE SHEETS
March 31, 2018 | April 1, 2017 | |||||||
(millions) | ||||||||
ASSETS | ||||||||
Current assets: | ||||||||
Cash and cash equivalents | $ | 1,304.6 | $ | 668.3 | ||||
Short-term investments | 699.4 | 684.7 | ||||||
Accounts receivable, net of allowances of $222.2 million and $214.4 million | 421.4 | 450.2 | ||||||
Inventories | 761.3 | 791.5 | ||||||
Income tax receivable | 38.0 | 79.4 | ||||||
Prepaid expenses and other current assets | 323.7 | 280.4 | ||||||
Total current assets | 3,548.4 | 2,954.5 | ||||||
Property and equipment, net | 1,186.3 | 1,316.0 | ||||||
Deferred tax assets | 86.6 | 125.9 | ||||||
Goodwill | 950.5 | 904.6 | ||||||
Intangible assets, net | 188.0 | 219.8 | ||||||
Other non-current assets | 183.5 | 131.2 | ||||||
Total assets | $ | 6,143.3 | $ | 5,652.0 | ||||
LIABILITIES AND EQUITY | ||||||||
Current liabilities: | ||||||||
Short-term debt | $ | 10.1 | $ | — | ||||
Current portion of long-term debt | 298.1 | — | ||||||
Accounts payable | 165.6 | 147.7 | ||||||
Income tax payable | 30.0 | 29.5 | ||||||
Accrued expenses and other current liabilities | 1,083.4 | 982.7 | ||||||
Total current liabilities | 1,587.2 | 1,159.9 | ||||||
Long-term debt | 288.0 | 588.2 | ||||||
Income tax payable | 124.8 | — | ||||||
Non-current liability for unrecognized tax benefits | 79.2 | 62.7 | ||||||
Other non-current liabilities | 606.7 | 541.6 | ||||||
Commitments and contingencies (Note 14) | ||||||||
Total liabilities | 2,685.9 | 2,352.4 | ||||||
Equity: | ||||||||
Class A common stock, par value $.01 per share; 102.0 million and 101.5 million shares issued; 55.4 million and 55.1 million shares outstanding | 1.0 | 0.9 | ||||||
Class B common stock, par value $.01 per share; 25.9 million shares issued and outstanding | 0.3 | 0.3 | ||||||
Additional paid-in-capital | 2,383.4 | 2,308.8 | ||||||
Retained earnings | 5,752.2 | 5,751.9 | ||||||
Treasury stock, Class A, at cost; 46.6 million and 46.4 million shares | (4,581.0 | ) | (4,563.9 | ) | ||||
Accumulated other comprehensive loss | (98.5 | ) | (198.4 | ) | ||||
Total equity | 3,457.4 | 3,299.6 | ||||||
Total liabilities and equity | $ | 6,143.3 | $ | 5,652.0 | ||||
See accompanying notes.
F-2 | ||
RALPH LAUREN CORPORATION
CONSOLIDATED STATEMENTS OF OPERATIONS
Fiscal Years Ended | ||||||||||||
March 31, 2018 | April 1, 2017 | April 2, 2016 | ||||||||||
(millions, except per share data) | ||||||||||||
Net revenues | $ | 6,182.3 | $ | 6,652.8 | $ | 7,405.2 | ||||||
Cost of goods sold | (2,430.6 | ) | (3,001.7 | ) | (3,218.5 | ) | ||||||
Gross profit | 3,751.7 | 3,651.1 | 4,186.7 | |||||||||
Selling, general, and administrative expenses | (3,095.5 | ) | (3,171.0 | ) | (3,412.5 | ) | ||||||
Impairment of assets | (50.0 | ) | (253.8 | ) | (48.8 | ) | ||||||
Restructuring and other charges | (108.0 | ) | (318.6 | ) | (142.6 | ) | ||||||
Total other operating expenses, net | (3,253.5 | ) | (3,743.4 | ) | (3,603.9 | ) | ||||||
Operating income (loss) | 498.2 | (92.3 | ) | 582.8 | ||||||||
Interest expense | (18.2 | ) | (12.4 | ) | (21.0 | ) | ||||||
Interest income | 12.3 | 7.3 | 6.3 | |||||||||
Other expense, net | (3.1 | ) | (7.5 | ) | (16.3 | ) | ||||||
Income (loss) before income taxes | 489.2 | (104.9 | ) | 551.8 | ||||||||
Income tax benefit (provision) | (326.4 | ) | 5.6 | (155.4 | ) | |||||||
Net income (loss) | $ | 162.8 | $ | (99.3 | ) | $ | 396.4 | |||||
Net income (loss) per common share: | ||||||||||||
Basic | $ | 1.99 | $ | (1.20 | ) | $ | 4.65 | |||||
Diluted | $ | 1.97 | $ | (1.20 | ) | $ | 4.62 | |||||
Weighted average common shares outstanding: | ||||||||||||
Basic | 81.7 | 82.7 | 85.2 | |||||||||
Diluted | 82.5 | 82.7 | 85.9 | |||||||||
Dividends declared per share | $ | 2.00 | $ | 2.00 | $ | 2.00 | ||||||
See accompanying notes.
F-3 | ||
RALPH LAUREN CORPORATION
CONSOLIDATED STATEMENTS OF COMPREHENSIVE INCOME (LOSS)
Fiscal Years Ended | ||||||||||||
March 31, 2018 | April 1, 2017 | April 2, 2016 | ||||||||||
(millions) | ||||||||||||
Net income (loss) | $ | 162.8 | $ | (99.3 | ) | $ | 396.4 | |||||
Other comprehensive income (loss), net of tax: | ||||||||||||
Foreign currency translation gains (losses) | 126.9 | (48.6 | ) | 36.4 | ||||||||
Net gains (losses) on cash flow hedges | (30.6 | ) | 26.6 | (55.2 | ) | |||||||
Net gains on defined benefit plans | 3.6 | 5.1 | 2.9 | |||||||||
Other comprehensive income (loss), net of tax | 99.9 | (16.9 | ) | (15.9 | ) | |||||||
Total comprehensive income (loss) | $ | 262.7 | $ | (116.2 | ) | $ | 380.5 | |||||
See accompanying notes.
F-4 | ||
RALPH LAUREN CORPORATION
CONSOLIDATED STATEMENTS OF CASH FLOWS
Fiscal Years Ended | ||||||||||||
March 31, 2018 | April 1, 2017 | April 2, 2016 | ||||||||||
(millions) | ||||||||||||
Cash flows from operating activities: | ||||||||||||
Net income (loss) | $ | 162.8 | $ | (99.3 | ) | $ | 396.4 | |||||
Adjustments to reconcile net income (loss) to net cash provided by operating activities: | ||||||||||||
Depreciation and amortization expense | 295.2 | 307.5 | 309.4 | |||||||||
Deferred income tax expense (benefit) | 84.1 | (38.9 | ) | (7.9 | ) | |||||||
Equity in losses of equity-method investees | 4.5 | 5.2 | 10.9 | |||||||||
Non-cash stock-based compensation expense | 74.5 | 63.6 | 97.0 | |||||||||
Non-cash impairment of assets | 50.0 | 253.8 | 48.8 | |||||||||
Non-cash restructuring-related inventory charges | 7.6 | 197.9 | 20.4 | |||||||||
Other non-cash charges | 7.4 | 29.2 | 19.7 | |||||||||
Changes in operating assets and liabilities: | ||||||||||||
Accounts receivable | 34.5 | 54.1 | 129.4 | |||||||||
Inventories | 57.8 | 120.4 | (90.9 | ) | ||||||||
Prepaid expenses and other current assets | (15.1 | ) | (27.8 | ) | 30.2 | |||||||
Accounts payable and accrued liabilities | 64.6 | 112.9 | 90.1 | |||||||||
Income tax receivables and payables | 165.1 | (34.0 | ) | (14.6 | ) | |||||||
Deferred income | 1.4 | (20.7 | ) | (7.9 | ) | |||||||
Other balance sheet changes | (19.3 | ) | 28.7 | (14.3 | ) | |||||||
Net cash provided by operating activities | 975.1 | 952.6 | 1,016.7 | |||||||||
Cash flows from investing activities: | ||||||||||||
Capital expenditures | (161.6 | ) | (284.0 | ) | (417.7 | ) | ||||||
Purchases of investments | (1,605.6 | ) | (860.4 | ) | (1,085.0 | ) | ||||||
Proceeds from sales and maturities of investments | 1,582.7 | 942.4 | 942.7 | |||||||||
Acquisitions and ventures | (4.6 | ) | (6.1 | ) | (16.3 | ) | ||||||
Net cash used in investing activities | (189.1 | ) | (208.1 | ) | (576.3 | ) | ||||||
Cash flows from financing activities: | ||||||||||||
Proceeds from issuance of short-term debt | 10.1 | 3,735.2 | 4,343.9 | |||||||||
Repayments of short-term debt | — | (3,851.3 | ) | (4,462.6 | ) | |||||||
Proceeds from issuance of long-term debt | — | — | 299.4 | |||||||||
Payments of capital lease obligations | (28.2 | ) | (27.3 | ) | (24.3 | ) | ||||||
Payments of dividends | (162.4 | ) | (164.8 | ) | (170.3 | ) | ||||||
Repurchases of common stock, including shares surrendered for tax withholdings | (17.1 | ) | (215.2 | ) | (500.4 | ) | ||||||
Proceeds from exercise of stock options | 0.1 | 5.0 | 33.2 | |||||||||
Other financing activities | — | — | (1.9 | ) | ||||||||
Net cash used in financing activities | (197.5 | ) | (518.4 | ) | (483.0 | ) | ||||||
Effect of exchange rate changes on cash, cash equivalents, and restricted cash | 55.2 | (16.4 | ) | 7.2 | ||||||||
Net increase (decrease) in cash, cash equivalents, and restricted cash | 643.7 | 209.7 | (35.4 | ) | ||||||||
Cash, cash equivalents, and restricted cash at beginning of period | 711.8 | 502.1 | 537.5 | |||||||||
Cash, cash equivalents, and restricted cash at end of period | $ | 1,355.5 | $ | 711.8 | $ | 502.1 | ||||||
See accompanying notes.
F-5 | ||
RALPH LAUREN CORPORATION
CONSOLIDATED STATEMENTS OF EQUITY
Additional | Treasury Stock | |||||||||||||||||||||||||||||
Common Stock(a) | Paid-in | Retained | at Cost | Total | ||||||||||||||||||||||||||
Shares | Amount | Capital | Earnings | Shares | Amount | AOCI(b) | Equity | |||||||||||||||||||||||
(millions) | ||||||||||||||||||||||||||||||
Balance at March 28, 2015 | 125.9 | $ | 1.2 | $ | 2,117.1 | $ | 5,787.2 | 39.6 | $ | (3,848.3 | ) | $ | (165.6 | ) | $ | 3,891.6 | ||||||||||||||
Comprehensive income: | ||||||||||||||||||||||||||||||
Net income | 396.4 | |||||||||||||||||||||||||||||
Other comprehensive loss | (15.9 | ) | ||||||||||||||||||||||||||||
Total comprehensive income | 380.5 | |||||||||||||||||||||||||||||
Dividends declared | (168.6 | ) | (168.6 | ) | ||||||||||||||||||||||||||
Repurchases of common stock | 4.4 | (500.4 | ) | (500.4 | ) | |||||||||||||||||||||||||
Stock-based compensation | 97.0 | 97.0 | ||||||||||||||||||||||||||||
Shares issued and tax benefits recognized pursuant to stock-based compensation plans(c) | 1.0 | — | 43.4 | 43.4 | ||||||||||||||||||||||||||
Balance at April 2, 2016 | 126.9 | $ | 1.2 | $ | 2,257.5 | $ | 6,015.0 | 44.0 | $ | (4,348.7 | ) | $ | (181.5 | ) | $ | 3,743.5 | ||||||||||||||
Comprehensive loss: | ||||||||||||||||||||||||||||||
Net loss | (99.3 | ) | ||||||||||||||||||||||||||||
Other comprehensive loss | (16.9 | ) | ||||||||||||||||||||||||||||
Total comprehensive loss | (116.2 | ) | ||||||||||||||||||||||||||||
Dividends declared | (163.8 | ) | (163.8 | ) | ||||||||||||||||||||||||||
Repurchases of common stock | 2.4 | (215.2 | ) | (215.2 | ) | |||||||||||||||||||||||||
Stock-based compensation | 63.6 | 63.6 | ||||||||||||||||||||||||||||
Shares issued and tax shortfalls recognized pursuant to stock-based compensation plans(c) | 0.5 | — | (12.3 | ) | (12.3 | ) | ||||||||||||||||||||||||
Balance at April 1, 2017 | 127.4 | $ | 1.2 | $ | 2,308.8 | $ | 5,751.9 | 46.4 | $ | (4,563.9 | ) | $ | (198.4 | ) | $ | 3,299.6 | ||||||||||||||
Comprehensive income: | ||||||||||||||||||||||||||||||
Net income | 162.8 | |||||||||||||||||||||||||||||
Other comprehensive income | 99.9 | |||||||||||||||||||||||||||||
Total comprehensive income | 262.7 | |||||||||||||||||||||||||||||
Dividends declared | (162.5 | ) | (162.5 | ) | ||||||||||||||||||||||||||
Repurchases of common stock | 0.2 | (17.1 | ) | (17.1 | ) | |||||||||||||||||||||||||
Stock-based compensation | 74.5 | 74.5 | ||||||||||||||||||||||||||||
Shares issued pursuant to stock-based compensation plans(c) | 0.5 | 0.1 | 0.1 | 0.2 | ||||||||||||||||||||||||||
Balance at March 31, 2018 | 127.9 | $ | 1.3 | $ | 2,383.4 | $ | 5,752.2 | 46.6 | $ | (4,581.0 | ) | $ | (98.5 | ) | $ | 3,457.4 | ||||||||||||||
(a) | Includes Class A and Class B common stock. |
(b) | Accumulated other comprehensive income (loss). |
(c) | Includes an excess tax shortfall relating to stock-based compensation plans of $17.3 million in Fiscal 2017 and an excess tax benefit of $10.2 million in Fiscal 2016. In Fiscal 2018, the Company adopted ASU 2016-09 (as defined in Note 4), which requires such excess tax benefits and shortfalls be reflected prospectively as income tax benefit (provision) in the statements of operations. See Note 4 for further discussion of the Company's adoption of ASU 2016-09. |
See accompanying notes.
F-6 | ||
RALPH LAUREN CORPORATION
NOTES TO CONSOLIDATED FINANCIAL STATEMENTS
1. | Description of Business |
Ralph Lauren Corporation ("RLC") is a global leader in the design, marketing, and distribution of premium lifestyle products, including apparel, accessories, home furnishings, and other licensed product categories. RLC's long-standing reputation and distinctive image have been developed across an expanding number of products, brands, sales channels, and international markets. RLC's brand names include Ralph Lauren, Ralph Lauren Collection, Ralph Lauren Purple Label, Polo Ralph Lauren, Double RL, Lauren Ralph Lauren, Polo Ralph Lauren Children, Chaps, and Club Monaco, among others. RLC and its subsidiaries are collectively referred to herein as the "Company," "we," "us," "our," and "ourselves," unless the context indicates otherwise.
The Company diversifies its business by geography (North America, Europe, and Asia, among other regions) and channels of distribution (wholesale, retail, and licensing). This allows the Company to maintain a dynamic balance as its operating results do not depend solely on the performance of any single geographic area or channel of distribution. The Company's wholesale sales are made principally to major department stores and specialty stores around the world. The Company also sells directly to consumers through its integrated retail channel, which includes its retail stores, concession-based shop-within-shops, and digital commerce operations around the world. In addition, the Company licenses to unrelated third parties for specified periods the right to operate retail stores and/or to use its various trademarks in connection with the manufacture and sale of designated products, such as certain apparel, eyewear, fragrances, and home furnishings.
The Company organizes its business into the following three reportable segments: North America, Europe, and Asia. In addition to these reportable segments, the Company also has other non-reportable segments. See Note 19 for further discussion of the Company's segment reporting structure.
2. | Basis of Presentation |
Basis of Consolidation
These consolidated financial statements have been prepared in accordance with accounting principles generally accepted in the U.S. ("U.S. GAAP") and present the consolidated financial position, income (loss), comprehensive income (loss), and cash flows of the Company, including all entities in which the Company has a controlling financial interest and is determined to be the primary beneficiary. All significant intercompany balances and transactions have been eliminated in consolidation.
Fiscal Year
The Company utilizes a 52-53 week fiscal year ending on the Saturday closest to March 31. As such, fiscal year 2018 ended on March 31, 2018 and was a 52-week period ("Fiscal 2018"); fiscal year 2017 ended on April 1, 2017 and was a 52-week period ("Fiscal 2017"); fiscal year 2016 ended on April 2, 2016 and was a 53-week period ("Fiscal 2016"); and fiscal year 2019 will end on March 30, 2019 and will be a 52-week period ("Fiscal 2019").
Use of Estimates
The preparation of financial statements in conformity with U.S. GAAP requires management to make certain estimates and assumptions that affect the amounts reported in the financial statements and notes thereto. Actual results could differ materially from those estimates.
Significant estimates inherent in the preparation of the consolidated financial statements include reserves for bad debt, customer returns, discounts, end-of-season markdowns, operational chargebacks, and certain cooperative advertising allowances; the realizability of inventory; reserves for litigation and other contingencies; useful lives and impairments of long-lived tangible and intangible assets; fair value measurements; accounting for income taxes and related uncertain tax positions; valuation of stock-based compensation awards and related estimated forfeiture rates; reserves for restructuring activity; and accounting for business combinations, among others.
Reclassifications
Certain reclassifications have been made to the prior periods' financial information in order to conform to the current period's presentation.
F-7 | ||
RALPH LAUREN CORPORATION
NOTES TO CONSOLIDATED FINANCIAL STATEMENTS (Continued)
3. | Summary of Significant Accounting Policies |
Revenue Recognition
Revenue is recognized across all segments of the business when there is persuasive evidence of an arrangement, delivery has occurred, the price has been fixed or is determinable, and collectability is reasonably assured.
Revenue within the Company's wholesale business is recognized at the time title passes and risk of loss is transferred to customers. Wholesale revenue is recorded net of estimates of returns, discounts, end-of-season markdowns, operational chargebacks, and certain cooperative advertising allowances. Returns and allowances require pre-approval from management and discounts are based on trade terms. Estimates for end-of-season markdown reserves are based on historical trends, actual and forecasted seasonal results, an evaluation of current economic and market conditions, retailer performance, and, in certain cases, contractual terms. Estimates for operational chargebacks are based on actual customer notifications of order fulfillment discrepancies and historical trends. The Company reviews and refines these estimates on at least a quarterly basis. The Company's historical estimates of these costs have not differed materially from actual results.
Retail store and concession-based shop-within-shop revenue is recognized net of estimated returns at the time of sale to consumers. Revenue from sales of products ordered through the Company's digital commerce sites and those of third-party digital partners is recognized upon delivery of the shipment to its customers. Such revenue is also reduced by an estimate of returns.
Gift cards issued by the Company are recorded as a liability until they are redeemed, at which point revenue is recognized. The Company recognizes income for unredeemed gift cards when the likelihood of redemption by a customer is remote and the Company determines that it does not have a legal obligation to remit the value of the unredeemed gift card to the relevant jurisdiction as unclaimed or abandoned property.
Revenue from licensing arrangements is recognized when earned in accordance with the terms of the underlying agreements, generally based upon the higher of (i) contractually guaranteed minimum royalty levels or (ii) actual sales and royalty data, or estimates thereof, received from the Company's licensees.
The Company accounts for sales taxes and other related taxes on a net basis, excluding such taxes from revenue.
Cost of Goods Sold and Selling Expenses
Cost of goods sold includes the expenses incurred to acquire and produce inventory for sale, including product costs, freight-in, and import costs, as well as changes in reserves for shrinkage and inventory realizability. Gains and losses associated with forward foreign currency exchange contracts that are designated as cash flow hedges of inventory transactions are also recognized within cost of goods sold when the hedged inventory is sold. The costs of selling merchandise, including those associated with preparing merchandise for sale, such as picking, packing, warehousing, and order charges ("handling costs"), are included in selling, general, and administrative ("SG&A") expenses in the consolidated statements of operations.
Shipping and Handling Costs
The costs associated with shipping goods to customers are reflected as a component of SG&A expenses in the consolidated statements of operations. Shipping and handling costs (described above) billed to customers are included in revenue. A summary of shipping and handling costs is as follows:
Fiscal Years Ended | ||||||||||||
March 31, 2018 | April 1, 2017 | April 2, 2016 | ||||||||||
(millions) | ||||||||||||
Shipping costs | $ | 39.1 | $ | 42.8 | $ | 44.6 | ||||||
Handling costs | 155.4 | 170.1 | 181.2 | |||||||||
F-8 | ||
RALPH LAUREN CORPORATION
NOTES TO CONSOLIDATED FINANCIAL STATEMENTS (Continued)
Advertising and Marketing Costs
Advertising costs, including the costs to produce advertising, are expensed when the advertisement is first exhibited. Out-of-store advertising costs paid to wholesale customers under cooperative advertising programs are expensed as an advertising cost within SG&A expenses if both the identified advertising benefit is sufficiently separable from the purchase of the Company's products by customers and the fair value of such benefit is measurable. Otherwise, such costs are reflected as a reduction of revenue. Costs of in-store advertising paid to wholesale customers under cooperative advertising programs are not included in advertising costs, but rather are reflected as a reduction of revenue since the benefits are not sufficiently separable from the purchases of the Company's products by customers. Costs associated with the marketing and promotion of the Company's products are included within SG&A expenses.
Advertising and marketing expenses amounted to $241.1 million, $219.9 million, and $280.0 million in Fiscal 2018, Fiscal 2017, and Fiscal 2016, respectively. Deferred advertising, marketing, and promotional costs, which principally relate to advertisements that have not yet been exhibited or services that have not yet been received, were $6.8 million and $4.1 million at the end of Fiscal 2018 and Fiscal 2017, respectively, and were recorded within prepaid expenses and other current assets in the Company's consolidated balance sheets.
Foreign Currency Translation and Transactions
The financial position and operating results of the Company's foreign operations are primarily consolidated using their respective local currency as the functional currency. Local currency assets and liabilities are translated to U.S. Dollars at the rates of exchange in effect on the balance sheet date, and local currency revenues and expenses are translated to U.S. Dollars at average rates of exchange in effect during the period. The resulting translation gains or losses are included in the consolidated statements of comprehensive income (loss) as a component of other comprehensive income (loss) ("OCI") and in the consolidated statements of equity within accumulated other comprehensive income (loss) ("AOCI"). Gains and losses on the translation of intercompany loans made to foreign subsidiaries that are of a long-term investment nature are also included within this component of equity.
The Company also recognizes gains and losses on both third-party and intercompany transactions that are denominated in a currency other than the respective entity's functional currency. Such foreign currency transaction gains and losses are recognized in earnings within other expense, net, in the consolidated statements of operations, inclusive of the effects of any related hedging activities, and reflected net gains of $4.5 million and $1.1 million in Fiscal 2018 and Fiscal 2017, respectively, and net losses of $3.8 million in Fiscal 2016.
Comprehensive Income (Loss)
Comprehensive income (loss), which is reported in the consolidated statements of comprehensive income (loss) and consolidated statements of equity, consists of net income (loss) and other gains and losses affecting equity that, under U.S. GAAP, are excluded from net income (loss). The components of OCI for the Company consist of foreign currency translation gains (losses); net realized and unrealized gains (losses) on cash flow hedges, such as forward foreign currency exchange contracts; net realized and unrealized gains (losses) on available-for-sale investments; and net realized and unrealized gains (losses) related to the Company's defined benefit plans.
Net Income (Loss) per Common Share
Basic net income (loss) per common share is computed by dividing net income (loss) attributable to common shares by the weighted-average number of common shares outstanding during the period. Weighted-average common shares include shares of the Company's Class A and Class B common stock. Diluted net income (loss) per common share adjusts basic net income (loss) per common share for the dilutive effects of outstanding stock options, restricted stock units ("RSUs"), and any other potentially dilutive instruments, only in the periods in which such effects are dilutive.
F-9 | ||
RALPH LAUREN CORPORATION
NOTES TO CONSOLIDATED FINANCIAL STATEMENTS (Continued)
The weighted-average number of common shares outstanding used to calculate basic net income (loss) per common share is reconciled to shares used to calculate diluted net income (loss) per common share as follows:
Fiscal Years Ended | |||||||||
March 31, 2018 | April 1, 2017 | April 2, 2016 | |||||||
(millions) | |||||||||
Basic shares | 81.7 | 82.7 | 85.2 | ||||||
Dilutive effect of stock options and RSUs | 0.8 | — | (a) | 0.7 | |||||
Diluted shares | 82.5 | 82.7 | 85.9 | ||||||
(a) | Incremental shares of 0.7 million attributable to outstanding stock options and RSUs were excluded from the computation of diluted shares for Fiscal 2017, as such shares would not be dilutive as a result of the net loss incurred. |
All earnings per share amounts have been calculated using unrounded numbers. Options to purchase shares of the Company's Class A common stock at an exercise price greater than the average market price of the common stock during the reporting period are anti-dilutive and therefore not included in the computation of diluted net income (loss) per common share. In addition, the Company has outstanding performance-based RSUs, which are included in the computation of diluted shares only to the extent that the underlying performance conditions (and applicable market condition modifiers, if any) (i) have been satisfied as of the end of the reporting period or (ii) would be considered satisfied if the end of the reporting period were the end of the related contingency period and the result would be dilutive. As of the end of Fiscal 2018, Fiscal 2017, and Fiscal 2016, there were 2.0 million, 2.2 million, and 2.6 million, respectively, additional shares issuable upon exercise of anti-dilutive options and contingent vesting of performance-based RSUs, that were excluded from the diluted shares calculations.
Stock-Based Compensation
The Company recognizes expense for all stock-based compensation awards granted to employees and non-employee directors based on the grant date fair value of the awards over the requisite service period, adjusted for forfeitures which are estimated based on an analysis of historical experience and expected future trends. The Company uses the Black-Scholes valuation model to estimate the grant date fair value of its stock option awards. For performance-based RSU awards that include a market condition in the form of a total shareholder return ("TSR") modifier, the Company uses a Monte Carlo simulation valuation model to estimate the grant date fair value. The fair values of restricted stock awards, service-based RSUs, and performance-based RSUs that are not subject to a TSR modifier are determined based on the fair value of the Company's Class A common stock on the date of grant, adjusted to reflect the absence of dividends for those awards that are not entitled to dividend equivalents. Compensation expense for all performance-based RSUs is recognized over the requisite service period when attainment of the performance goal is deemed probable, net of estimated forfeitures. The Company recognizes compensation expense on an accelerated basis for all awards with graded vesting terms, including stock options, restricted stock, and certain RSUs. For RSU awards with cliff vesting terms, compensation expense is recognized on a straight-line basis. For certain RSU awards granted to retirement-eligible employees, or employees who will become retirement-eligible prior to the end of the awards' respective stated vesting periods, the related stock-based compensation expense is recognized on an accelerated basis over a term commensurate with the period that the employee is required to provide service in order to vest in the award. See Note 17 for further discussion of the Company's stock-based compensation plans.
Cash and Cash Equivalents
Cash and cash equivalents include all highly liquid investments with original maturities of 90 days or less, including investments in time deposits and debt securities. Investments in debt securities are diversified among high-credit quality securities in accordance with the Company's risk-management policies.
Restricted Cash
The Company is periodically required to place cash in escrow with various banks as collateral, primarily to secure guarantees of corresponding amounts made by the banks to international tax authorities on behalf of the Company, such as to secure refunds of value-added tax payments in certain international tax jurisdictions or in the case of certain international tax audits. Such cash
F-10 | ||
RALPH LAUREN CORPORATION
NOTES TO CONSOLIDATED FINANCIAL STATEMENTS (Continued)
is classified as restricted cash and reported as a component of either prepaid expenses and other current assets or other non-current assets in the Company's consolidated balance sheets.
Investments
The Company's investment objectives include capital preservation, maintaining adequate liquidity, diversification to minimize liquidity and credit risk, and achievement of maximum returns within the guidelines set forth in the Company's investment policy.
Short-term investments consist of investments which the Company expects to convert into cash within one year, including time deposits and debt securities, which have original maturities greater than 90 days. Non-current investments, which are classified within other non-current assets in the consolidated balance sheets, consist of those investments which the Company does not expect to convert into cash within one year.
The Company classifies all of its investments at the time of purchase as available-for-sale. These investments are recorded at fair value with unrealized gains or losses classified as a component of AOCI in the consolidated balance sheets, and related realized gains or losses classified as a component of other expense, net, in the consolidated statements of operations. Cash inflows and outflows related to the sale and purchase of investments are classified as investing activities in the Company's consolidated statements of cash flows.
Equity-method Investments
Investments in companies in which the Company has significant influence, but less than a controlling financial interest, are accounted for using the equity method. Significant influence is generally presumed to exist when the Company owns between 20% and 50% of the investee.
Under the equity method of accounting, the following amounts are recorded in the Company's consolidated financial statements: the Company's investment in and amounts due to and from the investee are included in the consolidated balance sheets; the Company's share of the investee's earnings (losses) is included in the consolidated statements of operations; and dividends, cash distributions, loans, or other cash received from the investee and additional cash investments, loan repayments, or other cash paid to the investee are included in the consolidated statements of cash flows.
The Company's equity-method investments include its 50% interest in the Ralph Lauren Watch and Jewelry Company, Sárl, a ten-year term joint venture formed with Compagnie Financière Richemont SA, the Swiss luxury goods group, which expired in March 2018. This joint venture is a Swiss corporation whose purpose was to design, develop, manufacture, sell, and distribute luxury watches and fine jewelry through Ralph Lauren stores, as well as through fine independent jewelry and luxury watch retailers around the world. As a result of its expiration, the joint venture's operations will wind-down during Fiscal 2019.
During Fiscal 2018, Fiscal 2017, and Fiscal 2016, equity in losses of equity-method investees were $4.5 million, $5.2 million, and $10.9 million, respectively, and were recorded within other expense, net, in the Company's consolidated statements of operations.
Impairment Assessment
The Company evaluates investments held in unrealized loss positions, if any, for other-than-temporary impairment on a quarterly basis. Such evaluation involves a variety of considerations, including assessments of the risks and uncertainties associated with general economic conditions and distinct conditions affecting specific issuers. Factors considered by the Company include (i) the length of time and the extent to which the fair value has been below cost; (ii) the financial condition, credit worthiness, and near-term prospects of the issuer; (iii) the length of time to maturity; (iv) future economic conditions and market forecasts; (v) the Company's intent and ability to retain its investment for a period of time sufficient to allow for recovery of market value; and (vi) an assessment of whether it is more likely than not that the Company will be required to sell its investment before recovery of market value. See Note 13 for further information relating to the Company's investments.
F-11 | ||
RALPH LAUREN CORPORATION
NOTES TO CONSOLIDATED FINANCIAL STATEMENTS (Continued)
Accounts Receivable
In the normal course of business, the Company extends credit to wholesale customers that satisfy defined credit criteria. Accounts receivable is recorded at carrying value, which approximates fair value, and is presented in the Company's consolidated balance sheets net of certain reserves and allowances. These reserves and allowances consist of (i) reserves for returns, discounts, end-of-season markdowns, operational chargebacks, and certain cooperative advertising allowances (see the "Revenue Recognition" section above for further discussion of related accounting policies) and (ii) allowances for doubtful accounts.
A rollforward of the activity in the Company's reserves for returns, discounts, end-of-season markdowns, operational chargebacks, and certain cooperative advertising allowances is presented below:
Fiscal Years Ended | ||||||||||||
March 31, 2018 | April 1, 2017 | April 2, 2016 | ||||||||||
(millions) | ||||||||||||
Beginning reserve balance | $ | 202.8 | $ | 239.7 | $ | 239.7 | ||||||
Amount charged against revenue to increase reserve | 585.0 | 666.6 | 749.0 | |||||||||
Amount credited against customer accounts to decrease reserve | (596.6 | ) | (698.8 | ) | (753.0 | ) | ||||||
Foreign currency translation | 11.3 | (4.7 | ) | 4.0 | ||||||||
Ending reserve balance | $ | 202.5 | $ | 202.8 | $ | 239.7 | ||||||
An allowance for doubtful accounts is determined through an analysis of accounts receivable aging, assessments of collectability based on an evaluation of historical and anticipated trends, the financial condition of the Company's customers, and an evaluation of the impact of economic conditions, among other factors.
A rollforward of the activity in the Company's allowance for doubtful accounts is presented below:
Fiscal Years Ended | ||||||||||||
March 31, 2018 | April 1, 2017 | April 2, 2016 | ||||||||||
(millions) | ||||||||||||
Beginning reserve balance | $ | 11.6 | $ | 14.5 | $ | 11.4 | ||||||
Amount recorded to expense to increase reserve(a) | 10.2 | 6.2 | 6.8 | |||||||||
Amount written-off against customer accounts to decrease reserve | (3.2 | ) | (8.5 | ) | (4.1 | ) | ||||||
Foreign currency translation | 1.1 | (0.6 | ) | 0.4 | ||||||||
Ending reserve balance | $ | 19.7 | $ | 11.6 | $ | 14.5 | ||||||
(a) | Amounts recorded to bad debt expense are included within SG&A expenses in the consolidated statements of operations. |
Concentration of Credit Risk
The Company sells its wholesale merchandise primarily to major department and specialty stores around the world, and extends credit based on an evaluation of each customer's financial capacity and condition, usually without requiring collateral. In the Company's wholesale business, concentration of credit risk is relatively limited due to the large number of customers and their dispersion across many geographic areas. However, the Company has three key wholesale customers that generate significant sales volume. During Fiscal 2018, the Company's sales to its largest wholesale customer, Macy's, Inc. ("Macy's"), accounted for approximately 8% of total net revenues. Further, during Fiscal 2018, sales to the Company's three largest wholesale customers, including Macy's, accounted for approximately 19% of total net revenues, as compared to approximately 21% during Fiscal 2017. Substantially all of the Company's sales to its three largest wholesale customers related to its North America segment. As of March 31, 2018, these three key wholesale customers constituted approximately 29% of total gross accounts receivable.
F-12 | ||
RALPH LAUREN CORPORATION
NOTES TO CONSOLIDATED FINANCIAL STATEMENTS (Continued)
Inventories
The Company holds inventory that is sold through wholesale distribution channels to major department stores and specialty retail stores. The Company also holds retail inventory that is sold in its own stores and digital commerce sites directly to consumers. Substantially all of the Company's inventories are comprised of finished goods, which are stated at the lower of cost or estimated realizable value, with cost determined on a weighted-average cost basis.
The estimated realizable value of inventory is determined based on an analysis of historical sales trends of the Company's individual product lines, the impact of market trends and economic conditions, and a forecast of future demand, giving consideration to the value of current in-house orders for future sales of inventory, as well as plans to sell inventory through the Company's factory stores, among other liquidation channels. Actual results may differ from estimates due to the quantity, quality, and mix of products in inventory, consumer and retailer preferences, and market conditions. Reserves for inventory shrinkage, representing the risk of physical loss of inventory, are estimated based on historical experience and are adjusted based upon physical inventory counts. The Company's historical estimates of these costs and its related provisions have not differed materially from actual results.
Property and Equipment, Net
Property and equipment, net is stated at cost less accumulated depreciation. Depreciation is calculated using the straight-line method based upon the estimated useful lives of depreciable assets, which range from three to seven years for furniture and fixtures, machinery and equipment, and capitalized software; and from ten to forty years for buildings and improvements. Leasehold improvements are depreciated over the shorter of the estimated useful lives of the respective assets or the term of the related lease.
Property and equipment, along with other long-lived assets, are evaluated for impairment periodically whenever events or changes in circumstances indicate that their related carrying values may not be fully recoverable. In evaluating long-lived assets for recoverability, including finite-lived intangibles as described below, the Company uses its best estimate of future cash flows expected to result from the use of the asset and its eventual disposition. To the extent that estimated future undiscounted net cash flows attributable to the asset are less than its carrying value, an impairment loss is recognized equal to the difference between the carrying value of such asset and its fair value, considering external market participant assumptions. Assets to be disposed of and for which there is a committed plan for disposal are reported at the lower of carrying value or fair value, less costs to sell.
Goodwill and Other Intangible Assets
At acquisition, the Company estimates and records the fair value of purchased intangible assets, which typically consist of reacquired license agreements, customer relationships, non-compete agreements, and/or order backlog. The fair values of these intangible assets are estimated based on management's assessment, considering independent third-party appraisals when necessary. The excess of the purchase consideration over the fair value of net assets acquired, both tangible and intangible, is recorded as goodwill. Goodwill and certain other intangible assets deemed to have indefinite useful lives are not amortized. Rather, goodwill and such indefinite-lived intangible assets are assessed for impairment at least annually. The Company generally performs its annual goodwill and indefinite-lived intangible assets impairment analyses using a qualitative approach to determine whether it is more likely than not that the fair values of such assets are less than their respective carrying values. If, based on the results of the qualitative assessment, it is concluded that it is not more likely than not that the fair value of the asset exceeds its carrying value, a quantitative test is performed. Under the quantitative test, if the carrying value of the asset exceeds its fair value, an impairment loss is recognized in the amount of the excess. The Company also periodically performs a quantitative test to assess its goodwill for impairment in lieu of using the qualitative approach in order to reassess the fair values of its reporting units.
Finite-lived intangible assets are amortized over their respective estimated useful lives and, along with other long-lived assets as noted above, are evaluated for impairment periodically whenever events or changes in circumstances indicate that their related carrying values may not be fully recoverable. See discussion of the Company's accounting policy for long-lived asset impairment as previously described under the caption "Property and Equipment, Net."
Income Taxes
Income taxes are provided using the asset and liability method. Under this method, income taxes (i.e., deferred tax assets and liabilities, current taxes payable/refunds receivable, and tax expense) are recorded based on amounts refundable or payable in the current year and include the results of any difference between U.S. GAAP and tax reporting. Deferred income taxes reflect the tax effect of certain net operating losses, capital losses, general business credit carryforwards, and the net tax effects of temporary differences between the carrying amount of assets and liabilities for financial statement and income tax purposes, as determined
F-13 | ||
RALPH LAUREN CORPORATION
NOTES TO CONSOLIDATED FINANCIAL STATEMENTS (Continued)
under enacted tax laws and rates. The Company accounts for the financial effect of changes in tax laws or rates in the period of enactment.
In addition, valuation allowances are established when management determines that it is more likely than not that some portion or all of a deferred tax asset will not be realized. Tax valuation allowances are analyzed periodically and adjusted as events occur or circumstances change that warrant adjustments.
In determining the income tax benefit (provision) for financial reporting purposes, the Company establishes a reserve for uncertain tax positions. If the Company considers that a tax position is more likely than not of being sustained upon audit, based solely on the technical merits of the position, it recognizes the tax benefit. The Company measures the tax benefit by determining the largest amount that is greater than 50% likely of being realized upon settlement, presuming that the tax position is examined by the appropriate taxing authority that has full knowledge of all relevant information. These assessments can be complex and the Company often obtains assistance from external advisors. To the extent that the Company's estimates change or the final tax outcome of these matters is different than the amounts recorded, such differences will impact the income tax benefit (provision) in the period in which such determinations are made. If the initial assessment fails to result in the recognition of a tax benefit, the Company regularly monitors its position and subsequently recognizes the tax benefit if (i) there are changes in tax law or analogous case law that sufficiently raise the likelihood of prevailing on the technical merits of the position to more likely than not; (ii) the statute of limitations expires; or (iii) there is a completion of an audit resulting in a settlement of that tax year with the appropriate agency. Uncertain tax positions are classified as current only when the Company expects to pay cash within the next twelve months. Interest and penalties are recorded within the income tax benefit (provision) in the Company's consolidated statements of operations and are classified on the consolidated balance sheets together with the related liability for unrecognized tax benefits.
See Note 10 for further discussion of the Company's income taxes.
Leases
The Company leases certain facilities and equipment, including the vast majority of its retail stores. Certain of the Company's lease agreements contain renewal options, rent escalation clauses, and/or landlord incentives. Renewal terms generally reflect market rates at the time of renewal. Rent expense for noncancelable operating leases with scheduled rent increases and/or landlord incentives is recognized on a straight-line basis over the lease term, including any applicable rent holidays, beginning on the earlier of the lease commencement date or the date the Company takes control of the leased space. The excess of straight-line rent expense over the scheduled payment amounts and landlord incentives is recorded as a deferred rent obligation. As of the end of Fiscal 2018 and Fiscal 2017, deferred rent obligations of $249.5 million and $246.3 million, respectively, were classified primarily within other non-current liabilities in the Company's consolidated balance sheets.
In certain lease arrangements, the Company is involved with the construction of the building or leasehold improvements (generally on property owned by the landlord). If the Company concludes that it has substantively all of the risks of ownership during construction of a leased property and therefore is deemed the owner of the project for accounting purposes, it records an asset and related financing obligation in the amount of the total project costs related to construction-in-progress and the fair value of the pre-existing building. Once construction is complete, the Company considers the requirements for sale-leaseback treatment, including the transfer back of all risks of ownership and whether the Company has any continuing involvement in the leased property. If the arrangement does not qualify for sale-leaseback treatment, the Company continues to amortize the financing obligation and depreciate the building over the lease term.
Derivative Financial Instruments
The Company records all derivative financial instruments on its consolidated balance sheets at fair value. For derivative instruments that qualify for hedge accounting, the effective portion of changes in their fair value is either (i) offset against the changes in fair value of the related hedged assets, liabilities, or firm commitments through earnings or (ii) recognized in equity as a component of AOCI until the hedged item is recognized in earnings, depending on whether the derivative is being used to hedge against changes in fair value or cash flows and net investments, respectively.
Each derivative instrument that qualifies for hedge accounting is expected to be highly effective at reducing the risk associated with the exposure being hedged. For each derivative instrument that is designated as a hedge, the Company formally documents the related risk management objective and strategy, including identification of the hedging instrument, the hedged item, and the risk exposure, as well as how hedge effectiveness will be assessed prospectively and retrospectively over the instrument's term. To assess hedge effectiveness, the Company generally uses regression analysis, a statistical method, to compare the change in the
F-14 | ||
RALPH LAUREN CORPORATION
NOTES TO CONSOLIDATED FINANCIAL STATEMENTS (Continued)
fair value of the derivative instrument to the change in fair value or cash flows of the related hedged item. The extent to which a hedging instrument has been and is expected to remain highly effective in achieving offsetting changes in fair value or cash flows is assessed and documented by the Company on at least a quarterly basis.
As a result of its use of derivative instruments, the Company is exposed to the risk that counterparties to such contracts will fail to meet their contractual obligations. To mitigate this counterparty credit risk, the Company has a policy of only entering into contracts with carefully selected financial institutions based upon an evaluation of their credit ratings and certain other factors, adhering to established limits for credit exposure. The Company's established policies and procedures for mitigating credit risk from derivative transactions include ongoing review and assessment of its counterparties' creditworthiness. The Company also enters into master netting arrangements with counterparties, when possible, to mitigate credit risk associated with its derivative instruments. In the event of default or termination (as such terms are defined within the respective master netting arrangement), these arrangements allow the Company to net-settle amounts payable and receivable related to multiple derivative transactions with the same counterparty. The master netting arrangements specify a number of events of default and termination, including, among others, the failure to make timely payments.
The fair values of the Company's derivative instruments are recorded on its consolidated balance sheets on a gross basis. For cash flow reporting purposes, proceeds received or amounts paid upon the settlement of a derivative instrument are classified in the same manner as the related item being hedged, primarily within cash flows from operating activities.
Cash Flow Hedges
The Company uses forward foreign currency exchange contracts to reduce its risk related to exchange rate fluctuations on inventory transactions made in an entity's non-functional currency, intercompany royalty payments made by certain of its international operations, and the settlement of foreign currency-denominated balances. To the extent forward foreign currency exchange contracts are designated as cash flow hedges and are highly effective in offsetting changes in the value of the hedged items, the related gains or losses are initially deferred in equity as a component of AOCI and are subsequently recognized in the consolidated statements of operations as follows:
• | Forecasted Inventory Transactions — recognized as part of the cost of the inventory being hedged within cost of goods sold when the related inventory is sold to a third party. |
• | Intercompany Royalties/Settlement of Foreign Currency Balances — recognized within other expense, net, during the period that the hedged balance is remeasured through earnings, generally through its settlement when the related payment occurs. |
To the extent that a derivative instrument designated as a cash flow hedge is not considered effective, any change in its fair value relating to such ineffectiveness is immediately recognized in earnings within other expense, net. If it is determined that a derivative instrument has not been highly effective, and will continue not to be highly effective in hedging the designated exposure, hedge accounting is discontinued and further gains (losses) are immediately recognized in earnings within other expense, net. Upon discontinuance of hedge accounting, the cumulative change in fair value of the derivative instrument previously recorded in AOCI is recognized in earnings when the related hedged item affects earnings, consistent with the originally-documented hedging strategy, unless the forecasted transaction is no longer probable of occurring, in which case the accumulated amount is immediately recognized in earnings within other expense, net.
Hedge of a Net Investment in a Foreign Operation
The Company periodically uses cross-currency swap contracts and forward foreign currency exchange contracts to reduce risk associated with exchange rate fluctuations on certain of its net investments in foreign subsidiaries. Changes in the fair values of such derivative instruments that are designated as hedges of net investments in foreign operations are recorded in equity as a component of AOCI in the same manner as foreign currency translation adjustments, to the extent they are effective as a hedge. To assess effectiveness, the Company uses a method based on changes in spot rates to measure the impact of foreign currency exchange rate fluctuations on both its foreign subsidiary net investment and the related derivative hedging instrument. Accordingly, changes in fair value of the hedging instrument other than those due to changes in the spot rate are excluded from the assessment of hedge effectiveness and are recorded in the consolidated statement of operations with any other ineffectiveness as interest expense. Amounts associated with the effective portion of net investment hedges are released from AOCI and recognized in earnings only upon the sale or liquidation of the hedged net investment.
F-15 | ||
RALPH LAUREN CORPORATION
NOTES TO CONSOLIDATED FINANCIAL STATEMENTS (Continued)
Fair Value Hedges
Changes in the fair value of a derivative instrument that is designated as a fair value hedge, along with offsetting changes in the fair value of the related hedged item attributable to the hedged risk, are recorded in earnings. Hedge ineffectiveness is recorded in earnings to the extent that the change in the fair value of the hedged item does not offset the change in the fair value of the hedging instrument.
Undesignated Hedges
All of the Company's undesignated hedges are entered into to hedge specific economic risks, particularly foreign currency exchange rate risk related to foreign currency-denominated balances. Changes in the fair value of undesignated derivative instruments are immediately recognized in earnings within other expense, net.
See Note 13 for further discussion of the Company's derivative financial instruments.
4. | Recently Issued Accounting Standards |
Targeted Improvements to Accounting for Hedging Activities
In August 2017, the Financial Accounting Standards Board ("FASB") issued Accounting Standards Update ("ASU") No. 2017-12, "Targeted Improvements to Accounting for Hedging Activities" ("ASU 2017-12"). ASU 2017-12 amends existing hedge accounting guidance by better aligning an entity's financial reporting with its risk management activities and by simplifying its application. Among its provisions, ASU 2017-12 eliminates the requirement to separately measure and report ineffectiveness for instruments that qualify for hedge accounting, and generally requires that the entire change in fair value of such instruments ultimately be presented in the same income statement line as the respective hedged item. Additionally, the updated guidance reduces complexity in the accounting for certain hedging relationships, eases documentation and effectiveness assessment requirements, broadens the scope of risk components eligible to qualify for hedge accounting, and modifies certain disclosure requirements. ASU 2017-12 is effective for the Company beginning in its fiscal year ending March 28, 2020 ("Fiscal 2020"), with early adoption permitted, and is to be applied using a modified retrospective transition approach, except for the amended presentation and disclosure requirements, which are to be applied prospectively. The Company is currently evaluating the impact that ASU 2017-12 will have on its consolidated financial statements and related disclosures.
Improving the Presentation of Net Periodic Pension Cost and Net Periodic Postretirement Benefit Cost
In March 2017, the FASB issued ASU No. 2017-07, "Improving the Presentation of Net Periodic Pension Cost and Net Periodic Postretirement Benefit Cost" ("ASU 2017-07"). Among its provisions, ASU 2017-07 requires that for defined benefit plans, an employer present only the service cost component of net pension expense within the same income statement line item used to reflect other compensation costs arising from services rendered by employees during the period. All other components of net periodic pension and postretirement benefit expense must be presented separately from the service cost component, outside of operating income.
The Company early-adopted ASU 2017-07 during the fourth quarter of Fiscal 2018 and applied its provisions on a retrospective basis by reclassifying $2.5 million and $0.9 million from SG&A expenses to other expense, net, in its consolidated statements of operations for Fiscal 2017 and Fiscal 2016, respectively, representing the non-service cost components of net pension expense for its international defined benefit plans during these periods. The service cost component of net pension expense for these periods remains presented within SG&A expenses. Other than this change in presentation, the adoption of ASU 2017-07 did not have an impact on the Company's consolidated financial statements. See Note 18 for further discussion of the Company's international defined benefit plans, including a summary of net pension expense for the fiscal years presented.
Restricted Cash
In November 2016, the FASB issued ASU No. 2016-18, "Restricted Cash" ("ASU 2016-18"). ASU 2016-18 requires that the statement of cash flows explain the change during the period in the total of cash, cash equivalents, and restricted cash. Accordingly, restricted cash will be included with cash and cash equivalents when reconciling the beginning-of-period and end-of-period total amounts presented on the statement of cash flows. The Company early-adopted ASU 2016-18 during the first quarter of Fiscal 2018 and applied its provisions retrospectively. Other than the change in presentation within the statement of cash flows,
F-16 | ||
RALPH LAUREN CORPORATION
NOTES TO CONSOLIDATED FINANCIAL STATEMENTS (Continued)
the adoption of ASU 2016-18 did not have an impact on the Company's consolidated financial statements. See Note 20 for a reconciliation of cash, cash equivalents, and restricted cash from the consolidated balance sheets to the consolidated statements of cash flows.
Improvements to Employee Share-Based Payment Accounting
In March 2016, the FASB issued ASU No. 2016-09, "Improvements to Employee Share-Based Payment Accounting" ("ASU 2016-09"). ASU 2016-09 simplifies several aspects related to the accounting for and financial statement presentation of share-based payments, including the accounting for income taxes upon award settlement and forfeitures, and the classification of excess tax benefits and shares surrendered for tax withholdings in the statement of cash flows.
The Company adopted ASU 2016-09 during the first quarter of Fiscal 2018. Among its various provisions, ASU 2016-09 impacts the accounting for income taxes upon award settlement by requiring that all excess tax benefits and shortfalls be reflected in the income tax benefit (provision) in the statement of operations in the period that they are realized. This reflects a change from previous practice, which generally required that such activity be recorded in equity as additional paid-in-capital. This change, which was applied prospectively in the Company's consolidated financial statements, increased the Company's income tax provision by $15.4 million during Fiscal 2018. Future impacts of this guidance on the Company's income tax benefit (provision) will depend largely on unpredictable events and other factors, including the timing of both employee stock option exercises and cancellations, if any, and the value realized upon vesting or exercise of shares compared to the grant date fair value of those shares, and will likely result in increased volatility. This increase in volatility is expected to be more pronounced during the first half of the Company's fiscal year due to the timing of annual stock-based compensation award vestings and stock option expirations.
Additionally, ASU 2016-09 changes the classification of excess tax benefits presented in the Company's consolidated statements of cash flows from a financing activity to an operating activity. The Company applied this change in classification on a retrospective basis by reclassifying excess tax benefits of $0.3 million and $10.2 million from cash flows from financing activities to cash flows from operating activities for Fiscal 2017 and Fiscal 2016, respectively.
Lastly, as permitted, the Company has elected to continue to estimate the impact of expected forfeitures when determining the amount of compensation cost to be recognized each period, as opposed to reflecting the impact of forfeitures only as they occur.
The remaining provisions of ASU 2016-09 did not have a material impact on the Company's consolidated financial statements.
Leases
In February 2016, the FASB issued ASU No. 2016-02, "Leases" ("ASU 2016-02"). ASU 2016-02 requires that a lessee's rights and fixed payment obligations under most leases be recognized as right-of-use assets and lease liabilities on the consolidated balance sheet. ASU 2016-02 retains a dual model for classifying leases as either financing or operating, which governs the pattern of expense recognition to be reflected in the consolidated statement of operations. Variable lease payments based on performance, such as percentage-of-sales-based payments, will not be included in the measurement of right-of-use assets and lease liabilities. Rather, consistent with current practice, such amounts will be recognized as an expense in the period incurred. ASU 2016-02 is effective for the Company beginning in Fiscal 2020, with early adoption permitted, and is to be adopted using a modified retrospective transition approach, which requires application of the guidance at the beginning of the earliest comparative period presented. However, the FASB recently approved an optional transition alternative, which allows for application of the guidance at the beginning of the period in which it is adopted, rather than at the beginning of the earliest comparative period presented.
The Company is currently in the process of evaluating the impact that ASU 2016-02 will have on its consolidated financial statements and related disclosures. The Company's assessment efforts to date have included reviewing the standard's provisions and gathering information to evaluate the landscape of its real estate, personal property, and other arrangements that may meet the definition of a lease. Based on these efforts, the Company currently anticipates that the adoption of ASU 2016-02 will result in a significant increase to its long-term assets and liabilities as, at a minimum, most of its current operating lease commitments will be subject to balance sheet recognition. The standard is also expected to result in enhanced quantitative and qualitative lease-related disclosures. Recognition of lease expense in the consolidated statement of operations is not anticipated to significantly change.
F-17 | ||
RALPH LAUREN CORPORATION
NOTES TO CONSOLIDATED FINANCIAL STATEMENTS (Continued)
Revenue from Contracts with Customers
In May 2014, the FASB issued ASU No. 2014-09, "Revenue from Contracts with Customers" ("ASU 2014-09"). ASU 2014-09 provides a single, comprehensive accounting model for revenues arising from contracts with customers that will supersede most existing revenue recognition guidance, including industry-specific guidance. Under this model, revenue, representing the amount to which an entity expects to be entitled in exchange for providing promised goods or services (i.e., performance obligations), is recognized upon control of promised goods or services transferring to a customer. ASU 2014-09 also requires enhanced qualitative and quantitative revenue-related disclosures. Since its original issuance, the FASB has issued several additional related ASUs to address implementation concerns and further amend and clarify certain guidance within ASU 2014-09. ASU 2014-09 may be adopted on a full retrospective basis and applied to all prior periods presented, or on a modified retrospective basis through a cumulative adjustment recorded to opening retained earnings in the year of initial application.
The Company's process and efforts for assessing the impact that ASU 2014-09 will have on its consolidated financial statements and related disclosures have involved reviewing current revenue-related accounting policies, processes, arrangements, and disclosures to identify differences that will arise from its application. Based on these efforts, the Company has concluded that the performance obligations underlying its core revenue streams (i.e., its retail and wholesale businesses), and the timing of recognition thereof, will remain substantially unchanged. Revenues for these businesses are generated through the sale of finished products, and will continue to be recognized at the point in time when merchandise is transferred to the customer and in an amount that considers the impacts of estimated returns, end-of-season markdowns, and other allowances that are variable in nature. For its licensing business, which has historically comprised approximately 2% of total revenues, the Company will continue to recognize the related revenue, including any contractually-guaranteed minimum royalty amounts, over time consistent with current practice.
Overall, the adoption of ASU 2014-09 will not have a significant impact on the Company's consolidated financial statements, although the accounting for certain ancillary items will be impacted. Specifically, revenue relating to estimated unredeemed gift card balances will be recognized over time in proportion to the amounts ultimately redeemed by customers, rather than when the likelihood of redemption becomes remote. Additionally, certain costs associated with the marketing of merchandise to wholesale customers for a particular selling season will be expensed as incurred, rather than deferred and expensed over the course of the related season. Finally, inventory amounts associated with estimated sales returns will be presented within prepaid expenses and other current assets in the consolidated balance sheets, rather than within inventories.
The Company will adopt ASU 2014-09 in the first quarter of its Fiscal 2019 using the modified retrospective method, under which the cumulative effect of initially applying the standard will be recognized as an adjustment to opening Fiscal 2019 retained earnings, which is not expected to be material.
5. | Property and Equipment |
Property and equipment, net consists of the following:
March 31, 2018 | April 1, 2017 | |||||||
(millions) | ||||||||
Land and improvements | $ | 16.8 | $ | 16.8 | ||||
Buildings and improvements | 460.5 | 457.2 | ||||||
Furniture and fixtures | 671.0 | 687.2 | ||||||
Machinery and equipment | 430.4 | 414.0 | ||||||
Capitalized software | 578.4 | 549.0 | ||||||
Leasehold improvements | 1,181.2 | 1,179.1 | ||||||
Construction in progress | 41.5 | 33.4 | ||||||
3,379.8 | 3,336.7 | |||||||
Less: accumulated depreciation | (2,193.5 | ) | (2,020.7 | ) | ||||
Property and equipment, net | $ | 1,186.3 | $ | 1,316.0 | ||||
Depreciation expense was $271.2 million, $283.4 million, and $285.7 million during Fiscal 2018, Fiscal 2017, and Fiscal 2016, respectively, and is recorded primarily within SG&A expenses in the consolidated statements of operations.
F-18 | ||
RALPH LAUREN CORPORATION
NOTES TO CONSOLIDATED FINANCIAL STATEMENTS (Continued)
6. | Goodwill and Other Intangible Assets |
Goodwill
The following table details the changes in goodwill for each of the Company's segments during Fiscal 2018 and Fiscal 2017:
Wholesale | Retail | Licensing | North America | Europe | Asia | Other Non-reportable Segments | Total | |||||||||||||||||||||||||
(millions) | ||||||||||||||||||||||||||||||||
Balance at April 2, 2016 | $ | 581.8 | $ | 202.8 | $ | 133.3 | $ | — | $ | — | $ | — | $ | — | $ | 917.9 | ||||||||||||||||
Foreign currency translation | (14.3 | ) | (2.6 | ) | (1.3 | ) | — | — | — | — | (18.2 | ) | ||||||||||||||||||||
Balance at December 31, 2016 | 567.5 | 200.2 | 132.0 | — | — | — | — | 899.7 | ||||||||||||||||||||||||
Segment reallocation(a) | (567.5 | ) | (200.2 | ) | (132.0 | ) | 421.8 | 269.2 | 71.5 | 137.2 | — | |||||||||||||||||||||
Impairments | — | — | — | — | — | — | (5.2 | ) | (5.2 | ) | ||||||||||||||||||||||
Foreign currency translation | — | — | — | — | 6.7 | 3.4 | — | 10.1 | ||||||||||||||||||||||||
Balance at April 1, 2017 | — | — | — | 421.8 | 275.9 | 74.9 | 132.0 | 904.6 | ||||||||||||||||||||||||
Foreign currency translation | — | — | — | — | 42.0 | 3.9 | — | 45.9 | ||||||||||||||||||||||||
Balance at March 31, 2018 | $ | — | $ | — | $ | — | $ | 421.8 | $ | 317.9 | $ | 78.8 | $ | 132.0 | $ | 950.5 | ||||||||||||||||
(a) | In connection with the realignment of the Company's segment reporting structure, the Company reallocated the carrying amount of goodwill to its new reporting units based upon each reporting unit's relative fair value as of the first day of its fourth quarter of Fiscal 2017. |
Based on the results of the Company's goodwill impairment testing, the Company recorded an impairment charge of $5.2 million during Fiscal 2017 to fully write off the carrying value of reallocated goodwill related to one of its reporting units. No goodwill impairment charges were recorded during Fiscal 2018 or Fiscal 2016. See Note 12 for further discussion of the Company's goodwill impairment testing.
Other Intangible Assets
Other intangible assets consist of the following:
March 31, 2018 | April 1, 2017 | |||||||||||||||||||||||
Gross Carrying Amount | Accum. Amort. | Net | Gross Carrying Amount | Accum. Amort. | Net | |||||||||||||||||||
(millions) | ||||||||||||||||||||||||
Intangible assets subject to amortization: | ||||||||||||||||||||||||
Re-acquired licensed trademarks | $ | 232.7 | $ | (140.0 | ) | $ | 92.7 | $ | 231.1 | $ | (130.2 | ) | $ | 100.9 | ||||||||||
Customer relationships | 256.5 | (171.4 | ) | 85.1 | 252.1 | (152.9 | ) | 99.2 | ||||||||||||||||
Other | 10.1 | (7.2 | ) | 2.9 | 26.9 | (14.5 | ) | 12.4 | ||||||||||||||||
Total intangible assets subject to amortization | 499.3 | (318.6 | ) | 180.7 | 510.1 | (297.6 | ) | 212.5 | ||||||||||||||||
Intangible assets not subject to amortization: | ||||||||||||||||||||||||
Trademarks and brands | 7.3 | N/A | 7.3 | 7.3 | N/A | 7.3 | ||||||||||||||||||
Total intangible assets | $ | 506.6 | $ | (318.6 | ) | $ | 188.0 | $ | 517.4 | $ | (297.6 | ) | $ | 219.8 | ||||||||||
F-19 | ||
RALPH LAUREN CORPORATION
NOTES TO CONSOLIDATED FINANCIAL STATEMENTS (Continued)
Amortization
Amortization expense was $24.0 million, $24.1 million, and $23.7 million during Fiscal 2018, Fiscal 2017, and Fiscal 2016, respectively, and is recorded within SG&A expenses in the consolidated statements of operations.
Based on the balance of the Company's intangible assets subject to amortization as of March 31, 2018, the expected amortization expense for each of the next five fiscal years and thereafter is as follows:
Amortization Expense | ||||
(millions) | ||||
Fiscal 2019 | $ | 23.6 | ||
Fiscal 2020 | 22.9 | |||
Fiscal 2021 | 20.1 | |||
Fiscal 2022 | 18.1 | |||
Fiscal 2023 | 14.4 | |||
Fiscal 2024 and thereafter | 81.6 | |||
Total | $ | 180.7 | ||
The expected future amortization expense above reflects weighted-average estimated remaining useful lives of 11.8 years for re-acquired licensed trademarks, 8.6 years for customer relationships, and 10.4 years for the Company's finite-lived intangible assets in total.
7. | Other Assets and Liabilities |
Prepaid expenses and other current assets consist of the following:
March 31, 2018 | April 1, 2017 | |||||||
(millions) | ||||||||
Other taxes receivable | $ | 171.4 | $ | 127.8 | ||||
Prepaid rent expense | 37.0 | 37.4 | ||||||
Restricted cash | 15.5 | 9.8 | ||||||
Derivative financial instruments | 12.3 | 23.0 | ||||||
Prepaid samples | 11.2 | 5.9 | ||||||
Prepaid software maintenance | 8.7 | 6.5 | ||||||
Prepaid advertising and marketing | 6.8 | 4.1 | ||||||
Tenant allowances receivable | 4.3 | 16.4 | ||||||
Other prepaid expenses and current assets | 56.5 | 49.5 | ||||||
Total prepaid expenses and other current assets | $ | 323.7 | $ | 280.4 | ||||
F-20 | ||
RALPH LAUREN CORPORATION
NOTES TO CONSOLIDATED FINANCIAL STATEMENTS (Continued)
Other non-current assets consist of the following:
March 31, 2018 | April 1, 2017 | |||||||
(millions) | ||||||||
Non-current investments | $ | 86.2 | $ | 21.4 | ||||
Restricted cash | 35.4 | 33.7 | ||||||
Security deposits | 27.3 | 26.5 | ||||||
Derivative financial instruments | — | 9.6 | ||||||
Other non-current assets | 34.6 | 40.0 | ||||||
Total other non-current assets | $ | 183.5 | $ | 131.2 | ||||
Accrued expenses and other current liabilities consist of the following:
March 31, 2018 | April 1, 2017 | |||||||
(millions) | ||||||||
Accrued payroll and benefits | $ | 227.8 | $ | 173.5 | ||||
Accrued operating expenses | 225.8 | 188.0 | ||||||
Other taxes payable | 194.2 | 172.2 | ||||||
Accrued inventory | 174.0 | 154.9 | ||||||
Restructuring reserve | 69.6 | 140.8 | ||||||
Derivative financial instruments | 60.8 | 12.3 | ||||||
Dividends payable | 40.6 | 40.5 | ||||||
Accrued capital expenditures | 37.0 | 45.7 | ||||||
Deferred income | 30.4 | 29.7 | ||||||
Capital lease obligations | 19.5 | 22.6 | ||||||
Other accrued expenses and current liabilities | 3.7 | 2.5 | ||||||
Total accrued expenses and other current liabilities | $ | 1,083.4 | $ | 982.7 | ||||
Other non-current liabilities consist of the following:
March 31, 2018 | April 1, 2017 | |||||||
(millions) | ||||||||
Capital lease obligations | $ | 236.4 | $ | 250.9 | ||||
Deferred rent obligations | 212.2 | 211.1 | ||||||
Derivative financial instruments | 49.2 | 9.4 | ||||||
Deferred tax liabilities | 36.5 | 11.8 | ||||||
Deferred compensation | 7.0 | 7.8 | ||||||
Other non-current liabilities | 65.4 | 50.6 | ||||||
Total other non-current liabilities | $ | 606.7 | $ | 541.6 | ||||
F-21 | ||
RALPH LAUREN CORPORATION
NOTES TO CONSOLIDATED FINANCIAL STATEMENTS (Continued)
8. | Impairment of Assets |
During Fiscal 2018, the Company recorded non-cash impairment charges of $41.2 million to write off certain fixed assets related to its domestic and international stores, shop-within-shops, and corporate offices, of which $16.0 million was recorded in connection with the Way Forward Plan (see Note 9) and $25.2 million was recorded in connection with underperforming stores and shop-within-shops as a result of its on-going store portfolio evaluation. Additionally, as a result of a change in the planned usage of a certain intangible asset, the Company recorded a non-cash impairment charge of $8.8 million to reduce the carrying value of the intangible asset to its estimated fair value.
During Fiscal 2017, the Company recorded non-cash impairment charges of $248.6 million to write off certain fixed assets related to its domestic and international stores, shop-within-shops, and corporate offices, as well as its in-house global digital commerce platform which was in development, of which $234.6 million was recorded in connection with the Way Forward Plan (see Note 9) and $14.0 million was recorded in connection with underperforming stores that were subject to potential future closure. Additionally, as a result of the realignment of its segment reporting structure, the Company recorded a non-cash goodwill impairment charge of $5.2 million during Fiscal 2017.
During Fiscal 2016, the Company recorded non-cash impairment charges of $48.8 million, primarily to write off certain fixed assets related to its domestic and international stores and shop-within-shops, of which $27.2 million was recorded in connection with the Global Reorganization Plan (see Note 9) and $21.6 million was recorded in connection with underperforming stores that were subject to potential future closure.
See Note 12 for further discussion of the non-cash impairment charges recorded during the fiscal years presented.
9. | Restructuring and Other Charges |
A description of significant restructuring and other activities and related costs is included below.
Way Forward Plan
On June 2, 2016, the Company's Board of Directors approved a restructuring plan with the objective of delivering sustainable, profitable sales growth and long-term value creation for shareholders (the "Way Forward Plan"). The Company is refocusing on its core brands and evolving its product, marketing, and shopping experience to increase desirability and relevance. It is also evolving its operating model to enable sustainable, profitable sales growth by significantly improving quality of sales, reducing supply chain lead times, improving its sourcing, and executing a disciplined multi-channel distribution and expansion strategy. As part of the Way Forward Plan, the Company is rightsizing its cost structure and implementing a return on investment-driven financial model to free up resources to invest in the brand and drive high-quality sales. The Way Forward Plan includes strengthening the Company's leadership team and creating a more nimble organization by moving from an average of nine to six layers of management. The Way Forward Plan also includes the discontinuance of the Company's Denim & Supply brand and the integration of its denim product offerings into its Polo Ralph Lauren brand. Collectively, these actions, which were substantially completed during Fiscal 2017, resulted in a reduction in workforce and the closure of certain stores and shop-within-shops.
On March 30, 2017, the Company's Board of Directors approved the following additional restructuring-related activities associated with its Way Forward Plan: (i) the restructuring of its in-house global digital commerce platform which was in development and shifting to a more cost-effective, flexible platform through a new agreement with Salesforce's Commerce Cloud, formerly known as Demandware; (ii) the closure of its Polo store at 711 Fifth Avenue in New York City; and (iii) the further streamlining of the organization and the execution of other key corporate actions in line with the Company's Way Forward Plan. Together, these actions are an important part of the Company's efforts to achieve its stated objective to return to sustainable, profitable growth and invest in the future. These additional restructuring-related activities were largely completed during Fiscal 2018 and resulted in a further reduction in workforce and the closure of certain corporate office and store locations. The remaining activities, which are primarily lease-related, are expected to be completed during Fiscal 2019.
F-22 | ||
RALPH LAUREN CORPORATION
NOTES TO CONSOLIDATED FINANCIAL STATEMENTS (Continued)
In connection with the Way Forward Plan, the Company currently expects to incur total estimated charges of approximately $770 million, comprised of cash-related restructuring charges of approximately $450 million and non-cash charges of approximately $320 million. Cumulative charges incurred since inception were $669.2 million and the Company expects to incur the remaining charges of approximately $100 million during Fiscal 2019. In addition to these charges, the Company also incurred an additional non-cash charge of $155.2 million during Fiscal 2017 associated with the destruction of inventory out of current liquidation channels in line with its Way Forward Plan.
A summary of the charges recorded in connection with the Way Forward Plan during Fiscal 2018 and Fiscal 2017, as well as the cumulative charges recorded since its inception, is as follows:
Fiscal Year Ended | Cumulative Charges | |||||||||||
March 31, 2018 | April 1, 2017 | |||||||||||
(millions) | ||||||||||||
Cash-related restructuring charges: | ||||||||||||
Severance and benefits costs | $ | 39.0 | $ | 182.7 | $ | 221.7 | ||||||
Lease termination and store closure costs | 33.2 | 87.3 | 120.5 | |||||||||
Other cash charges | 6.3 | 19.1 | 25.4 | |||||||||
Total cash-related restructuring charges | 78.5 | 289.1 | 367.6 | |||||||||
Non-cash charges: | ||||||||||||
Impairment of assets (see Note 8) | 16.0 | 234.6 | 250.6 | |||||||||
Inventory-related charges(a) | 7.6 | 197.9 | 205.5 | |||||||||
Accelerated stock-based compensation expense(b) | 0.7 | — | 0.7 | |||||||||
Total non-cash charges | 24.3 | 432.5 | 456.8 | |||||||||
Total charges | $ | 102.8 | $ | 721.6 | $ | 824.4 | ||||||
(a) | Includes charges of $155.2 million associated with the destruction of inventory out of current liquidation channels during Fiscal 2017. Inventory-related charges are recorded within cost of goods sold in the consolidated statements of operations. |
(b) | Accelerated stock-based compensation expense, which is recorded within restructuring and other charges in the consolidated statements of operations, was recorded in connection with vesting provisions associated with certain separation agreements. |
A summary of the activity in the restructuring reserve related to the Way Forward Plan is as follows:
Severance and Benefits Costs | Lease Termination and Store Closure Costs | Other Cash Charges | Total | |||||||||||||
(millions) | ||||||||||||||||
Balance at April 2, 2016 | $ | — | $ | — | $ | — | $ | — | ||||||||
Additions charged to expense | 182.7 | 87.3 | 19.1 | 289.1 | ||||||||||||
Cash payments charged against reserve | (87.4 | ) | (52.2 | ) | (11.5 | ) | (151.1 | ) | ||||||||
Non-cash adjustments | (1.0 | ) | (0.8 | ) | (1.0 | ) | (2.8 | ) | ||||||||
Balance at April 1, 2017 | 94.3 | 34.3 | 6.6 | 135.2 | ||||||||||||
Additions charged to expense | 39.0 | 33.2 | 6.3 | 78.5 | ||||||||||||
Cash payments charged against reserve | (97.9 | ) | (22.8 | ) | (11.1 | ) | (131.8 | ) | ||||||||
Non-cash adjustments | 2.2 | 8.8 | — | 11.0 | ||||||||||||
Balance at March 31, 2018 | $ | 37.6 | $ | 53.5 | $ | 1.8 | $ | 92.9 | ||||||||
F-23 | ||
RALPH LAUREN CORPORATION
NOTES TO CONSOLIDATED FINANCIAL STATEMENTS (Continued)
Global Reorganization Plan
On May 12, 2015, the Company's Board of Directors approved a reorganization and restructuring plan comprised of the following major actions: (i) the reorganization of the Company's operating structure in order to streamline the Company's business processes to better align its cost structure with its long-term growth strategy; (ii) a strategic store and shop-within-shop performance review conducted by region and brand; (iii) a targeted corporate functional area review; and (iv) the consolidation of certain of the Company's luxury lines (collectively, the "Global Reorganization Plan"). The Global Reorganization Plan resulted in a reduction in workforce and the closure of certain stores and shop-within-shops.
Actions associated with the Global Reorganization Plan were completed by the end of the first quarter of Fiscal 2017 and no additional charges are expected to be incurred in relation to this plan. A summary of the charges recorded in connection with the Global Reorganization Plan during Fiscal 2017 and Fiscal 2016, as well as the cumulative charges recorded since its inception, is as follows:
Fiscal Years Ended | Cumulative Charges | |||||||||||
April 1, 2017 | April 2, 2016 | |||||||||||
(millions) | ||||||||||||
Cash-related restructuring charges: | ||||||||||||
Severance and benefits costs | $ | 4.7 | $ | 64.4 | $ | 69.1 | ||||||
Lease termination and store closure costs | 0.2 | 7.8 | 8.0 | |||||||||
Other cash charges | — | 13.8 | 13.8 | |||||||||
Total cash-related restructuring charges | 4.9 | 86.0 | 90.9 | |||||||||
Non-cash charges: | ||||||||||||
Impairment of assets (see Note 8) | — | 27.2 | 27.2 | |||||||||
Inventory-related charges(a) | — | 20.4 | 20.4 | |||||||||
Accelerated stock-based compensation expense(b) | — | 8.9 | 8.9 | |||||||||
Total non-cash charges | — | 56.5 | 56.5 | |||||||||
Total charges | $ | 4.9 | $ | 142.5 | $ | 147.4 | ||||||
(a) | Inventory-related charges are recorded within cost of goods sold in the consolidated statements of operations. |
(b) | Accelerated stock-based compensation expense, which is recorded within restructuring and other charges in the consolidated statements of operations, was recorded in connection with vesting provisions associated with certain separation agreements. |
A summary of the activity in the restructuring reserve related to the Global Reorganization Plan is as follows:
Severance and Benefits Costs | Lease Termination and Store Closure Costs | Other Cash Charges | Total | |||||||||||||
(millions) | ||||||||||||||||
Balance at March 28, 2015 | $ | — | $ | — | $ | — | $ | — | ||||||||
Additions charged to expense | 64.4 | 7.8 | 13.8 | 86.0 | ||||||||||||
Cash payments charged against reserve | (33.2 | ) | (2.5 | ) | (10.7 | ) | (46.4 | ) | ||||||||
Non-cash adjustments | — | 0.7 | — | 0.7 | ||||||||||||
Balance at April 2, 2016 | 31.2 | 6.0 | 3.1 | 40.3 | ||||||||||||
Additions charged to expense | 4.7 | 0.2 | — | 4.9 | ||||||||||||
Cash payments charged against reserve | (27.3 | ) | (2.8 | ) | (2.9 | ) | (33.0 | ) | ||||||||
Balance at April 1, 2017 | 8.6 | 3.4 | 0.2 | 12.2 | ||||||||||||
Cash payments charged against reserve | (5.5 | ) | (1.9 | ) | (0.2 | ) | (7.6 | ) | ||||||||
Balance at March 31, 2018 | $ | 3.1 | $ | 1.5 | $ | — | $ | 4.6 | ||||||||
F-24 | ||
RALPH LAUREN CORPORATION
NOTES TO CONSOLIDATED FINANCIAL STATEMENTS (Continued)
Other Charges
During Fiscal 2018, the Company recorded other charges of $14.1 million related to depreciation expense associated with the Company's former Polo store at 711 Fifth Avenue in New York City, recorded after the store closed during the first quarter of Fiscal 2018 in connection with the Way Forward Plan. Although the Company is no longer generating revenue or has any other economic activity associated with its former Polo store, it continues to incur depreciation expense due to its involvement at the time of construction.
Additionally, during Fiscal 2018, the Company recorded other charges of $10.2 million related to its pending customs audit (see Note 14) and $6.7 million (inclusive of accelerated stock-based compensation expense of $2.1 million) primarily related to the departure of Mr. Stefan Larsson as the Company's President and Chief Executive Officer and as a member of its Board of Directors, effective as of May 1, 2017. Refer to the Form 8-K filed on February 2, 2017 for additional discussion regarding the departure of Mr. Larsson.
These other charges recorded in Fiscal 2018 were partially offset by the favorable impact of $2.2 million related to the reversal of reserves associated with the settlement of certain non-income tax issues.
During Fiscal 2017, the Company recorded other charges of $13.2 million related to the anticipated settlement of certain non-income tax issues and $11.4 million (inclusive of accelerated stock-based compensation expense of $4.3 million) related to Mr. Larsson's departure.
During Fiscal 2016, the Company recorded other charges of $34.1 million related to its pending customs audit (see Note 14) and $13.6 million primarily related to the settlement of certain litigation claims.
10. | Income Taxes |
U.S. Tax Reform
On December 22, 2017, President Trump signed into law new tax legislation commonly referred to as the Tax Cuts and Jobs Act (the "TCJA"), which became effective January 1, 2018. The TCJA significantly revised U.S. tax law by, among other provisions, lowering the U.S. federal statutory income tax rate from 35% to 21%, creating a territorial tax system that includes a one-time mandatory transition tax on previously deferred foreign earnings, and eliminating or reducing certain income tax deductions.
ASC Topic 740, "Income Taxes," requires the effects of changes in tax laws to be recognized in the period in which the legislation is enacted. However, due to the complexity and significance of the TCJA's provisions, the SEC staff issued Staff Accounting Bulletin No. 118 ("SAB 118") on December 22, 2017, which allows companies to record the tax effects of the TCJA on a provisional basis based on a reasonable estimate, and then, if necessary, subsequently adjust such amounts during a limited measurement period as more information becomes available. The measurement period ends when a company has obtained, prepared, and analyzed the information necessary to finalize its accounting, but cannot extend beyond one year from enactment.
During the third quarter of Fiscal 2018, the Company recorded charges of $231.3 million within its income tax provision in connection with the TCJA, of which $215.5 million related to the mandatory transition tax, which it expects to pay over an eight-year period (see Note 14) and $15.8 million related to the revaluation of the Company's deferred tax assets and liabilities. Subsequently, as a result of finalizing its full Fiscal 2018 operating results, the issuance of new interpretive guidance, and other analyses performed, the Company recorded immaterial measurement period adjustments during the fourth quarter of Fiscal 2018, whereby it reversed $6.2 million of the charges related to the mandatory transition tax and $5.5 million related to the revaluation of its deferred taxes. These reversals were partially offset by an incremental charge of $1.8 million related to the expected future remittance of certain previously deferred foreign earnings. Collectively, these net charges of $221.4 million, which were recorded on a provisional basis, negatively impacted the Company's effective tax rate by 4,520 basis points and lowered its diluted earnings per share by $2.68 during Fiscal 2018. The provisional amounts were based on the Company's present interpretations of the TCJA, current available information, and assumptions about future events, and are subject to further refinement as additional information becomes available, including potential new or interpretative guidance issued by the FASB or the Internal Revenue Service and other tax agencies, and as further analyses are completed.
F-25 | ||
RALPH LAUREN CORPORATION
NOTES TO CONSOLIDATED FINANCIAL STATEMENTS (Continued)
Additionally, the Company reevaluated its permanent reinvestment assertion and determined that undistributed foreign earnings that were subject to the one-time mandatory transition tax were no longer considered to be permanently reinvested, effective December 31, 2017. In connection with this decision, the Company repatriated $252.0 million of cash to the U.S. from certain of its foreign subsidiaries during the fourth quarter of Fiscal 2018, and it repatriated an additional $400.0 million during the first quarter of Fiscal 2019. The mandatory transition tax does not apply to undistributed foreign earnings generated after December 31, 2017, and therefore the Company intends to permanently reinvest such earnings. See "Deferred Taxes" for additional discussion.
The Company is also in the process of assessing various international taxation provisions of the TCJA that are effective for the Company beginning in the first quarter of Fiscal 2019, including a minimum tax on global intangible low-taxed income ("GILTI"). The Company has tentatively decided to account for GILTI tax in the period in which it is incurred and therefore has not provided any deferred tax impacts of GILTI in its consolidated financial statements for Fiscal 2018. The Company will continue to evaluate this policy election during Fiscal 2019.
Taxes on Income (Loss)
Domestic and foreign pretax income (loss) are as follows:
Fiscal Years Ended | ||||||||||||
March 31, 2018 | April 1, 2017 | April 2, 2016 | ||||||||||
(millions) | ||||||||||||
Domestic | $ | 16.4 | $ | (155.3 | ) | $ | 274.8 | |||||
Foreign | 472.8 | 50.4 | 277.0 | |||||||||
Total income (loss) before income taxes | $ | 489.2 | $ | (104.9 | ) | $ | 551.8 | |||||
Benefits (provisions) for current and deferred income taxes are as follows:
Fiscal Years Ended | ||||||||||||
March 31, 2018 | April 1, 2017 | April 2, 2016 | ||||||||||
(millions) | ||||||||||||
Current: | ||||||||||||
Federal(a) | $ | (154.6 | ) | $ | 29.1 | $ | (87.9 | ) | ||||
State and local(a) | (5.0 | ) | 2.3 | 3.2 | ||||||||
Foreign | (82.7 | ) | (64.7 | ) | (78.6 | ) | ||||||
(242.3 | ) | (33.3 | ) | (163.3 | ) | |||||||
Deferred: | ||||||||||||
Federal | (64.1 | ) | 25.1 | 4.6 | ||||||||
State and local | (12.6 | ) | 2.9 | 1.4 | ||||||||
Foreign | (7.4 | ) | 10.9 | 1.9 | ||||||||
(84.1 | ) | 38.9 | 7.9 | |||||||||
Total income tax benefit (provision) | $ | (326.4 | ) | $ | 5.6 | $ | (155.4 | ) | ||||
(a) | Excludes federal, state, and local tax provisions of $17.3 million in Fiscal 2017 and federal, state, and local tax benefits of $10.2 million in Fiscal 2016 resulting from stock-based compensation arrangements. Such amounts were recorded within equity. In Fiscal 2018, the Company adopted ASU 2016-09, which requires such excess tax benefits and shortfalls be reflected prospectively in the income tax benefit (provision) in the statement of operations. See Note 4 for further discussion of the Company's adoption of ASU 2016-09. |
F-26 | ||
RALPH LAUREN CORPORATION
NOTES TO CONSOLIDATED FINANCIAL STATEMENTS (Continued)
Tax Rate Reconciliation
The differences between income taxes expected at the U.S. federal statutory income tax rate and income taxes provided are as set forth below:
Fiscal Years Ended | ||||||||||||
March 31, 2018 | April 1, 2017 | April 2, 2016 | ||||||||||
(millions) | ||||||||||||
Benefit (provision) for income taxes at the U.S. federal statutory rate(a) | $ | (154.3 | ) | $ | 36.7 | $ | (193.2 | ) | ||||
Change due to: | ||||||||||||
State and local income taxes, net of federal benefit | (1.6 | ) | 2.7 | (10.9 | ) | |||||||
Foreign income taxed at different rates, net of U.S. foreign tax credits | 74.7 | (25.4 | ) | 33.6 | ||||||||
Unrecognized tax benefits and settlements of tax examinations | (14.4 | ) | 0.5 | 12.7 | ||||||||
Changes in valuation allowance on deferred tax assets | 2.5 | (7.3 | ) | — | ||||||||
TCJA enactment-related charges | (221.4 | ) | — | — | ||||||||
Stock-based compensation | (15.4 | ) | — | — | ||||||||
Other | 3.5 | (1.6 | ) | 2.4 | ||||||||
Total income tax benefit (provision) | $ | (326.4 | ) | $ | 5.6 | $ | (155.4 | ) | ||||
Effective tax rate(b) | 66.7 | % | 5.3 | % | 28.2 | % | ||||||
(a) | The U.S. federal statutory income tax rate for the Company's Fiscal 2017 and Fiscal 2016 was 35.0%. The TCJA reduced the statutory tax rate from 35.0% to 21.0%, effective January 1, 2018, and resulted in a blended statutory rate of 31.5% for the Company's Fiscal 2018. |
(b) | Effective tax rate is calculated by dividing the income tax benefit (provision) by income (loss) before income taxes. |
The Company's Fiscal 2018 effective tax rate was higher than the blended statutory rate primarily due to the enactment-related charges recorded in connection with the TCJA, as previously discussed, the negative impact of the adoption of ASU 2016-09 (see Note 4), and the unfavorable impact of additional income tax reserves associated with certain income tax audits, partially offset by the favorable impact of the proportion of earnings generated in lower taxed foreign jurisdictions versus the U.S. and tax benefits associated with adjustments recorded on deferred tax assets and provision to tax return adjustments. The Company's Fiscal 2017 effective tax rate was lower than the statutory rate primarily due to the tax impact of earnings in foreign jurisdictions, valuation allowances and adjustments recorded on deferred tax assets, and income tax reserves largely associated with an income tax settlement and certain income tax audits, partially offset by the reversal of an income tax reserve resulting from a change in tax law that impacted an interest assessment on a prior year withholding tax. The Company's Fiscal 2016 effective tax rate was lower than the statutory tax rate primarily due to the tax impact of earnings in foreign jurisdictions and the favorable impact of a change to the assessment period associated with certain tax liabilities, partially offset by the reversal of certain deferred tax assets that were determined to not be realizable.
During the second quarter of Fiscal 2016, the Company concluded, with the assistance of a third-party consultant, that based on recent audit settlements and taxpayer audit trends, the assessment period associated with certain tax liabilities established under ASC Topic 740, "Income Taxes," should be reduced. This change is considered a change in estimate for accounting purposes and the related impact was recorded during the second quarter of Fiscal 2016. This change lowered the Company's provision for income taxes by $7.7 million, including interest and penalties, and net of deferred tax asset reversals, and increased basic and diluted earnings per share by $0.09 for Fiscal 2016.
F-27 | ||
RALPH LAUREN CORPORATION
NOTES TO CONSOLIDATED FINANCIAL STATEMENTS (Continued)
Deferred Taxes
Significant components of the Company's deferred tax assets and liabilities are as follows:
March 31, 2018 | April 1, 2017 | |||||||
(millions) | ||||||||
Goodwill and other intangible assets | $ | (149.2 | ) | $ | (217.1 | ) | ||
Property and equipment | (36.2 | ) | (61.6 | ) | ||||
Undistributed foreign earnings | (7.1 | ) | — | |||||
Net operating loss carryforwards | 54.8 | 64.1 | ||||||
Lease obligations | 49.6 | 80.7 | ||||||
Deferred compensation | 45.7 | 141.6 | ||||||
Receivable allowances and reserves | 38.5 | 65.8 | ||||||
Inventory basis difference | 16.0 | 21.8 | ||||||
Cumulative translation adjustment and hedges | 15.0 | (10.8 | ) | |||||
Accrued expenses | 12.1 | 9.8 | ||||||
Unrecognized tax benefits | 10.8 | 16.0 | ||||||
Transfer pricing | 9.0 | 5.6 | ||||||
Deferred rent | 6.9 | 14.3 | ||||||
Deferred income | 5.2 | 9.0 | ||||||
Excess foreign tax credits | — | 7.9 | ||||||
Other | 14.4 | 5.1 | ||||||
Valuation allowance | (35.4 | ) | (38.1 | ) | ||||
Net deferred tax assets(a) | $ | 50.1 | $ | 114.1 | ||||
(a) | The net deferred tax balances as of March 31, 2018 and April 1, 2017 were comprised of non-current deferred tax assets of $86.6 million and $125.9 million, respectively, recorded within deferred tax assets, and non-current deferred tax liabilities of $36.5 million and $11.8 million, respectively, recorded within other non-current liabilities in the consolidated balance sheets. |
The Company has available state and foreign net operating loss carryforwards of $237.4 million and $71.5 million, respectively, for tax purposes to offset future taxable income. The net operating loss carryforwards expire beginning in Fiscal 2019.
The Company also has available state and foreign net operating loss carryforwards of $44.2 million and $204.6 million, respectively, for which no net deferred tax asset has been recognized. A full valuation allowance has been recorded against these carryforwards since management does not believe that the Company will more likely than not be able to utilize these carryforwards to offset future taxable income. Subsequent recognition of these deferred tax assets would result in an income tax benefit in the year of such recognition. The valuation allowances relating to state and foreign net operating loss carryforwards increased by $5.3 million and $2.3 million, respectively, largely as a result of additional net operating losses in certain jurisdictions where management does not believe that the Company will more likely than not be able to utilize these carryforwards in the future.
In connection with the Company's decision to no longer permanently reinvest undistributed foreign earnings that were subject to the TCJA's one-time mandatory transition tax, the Company recorded a deferred tax liability of $7.1 million on a provisional basis for the expected future remittance of previously taxed foreign earnings. The mandatory transition tax does not apply to undistributed foreign earnings generated after December 31, 2017. Accordingly, provision has not been made for U.S. or additional foreign taxes on approximately $98 million of undistributed earnings of foreign subsidiaries generated after December 31, 2017, as such earnings are expected to be permanently reinvested. These earnings could become subject to tax if they were remitted as dividends, if foreign earnings were lent to RLC, a subsidiary or a U.S. affiliate of RLC, or if the stock of the subsidiaries were sold. Determination of the amount of unrecognized deferred tax liability with respect to such earnings is not practicable.
F-28 | ||
RALPH LAUREN CORPORATION
NOTES TO CONSOLIDATED FINANCIAL STATEMENTS (Continued)
Uncertain Income Tax Benefits
Fiscal 2018, Fiscal 2017, and Fiscal 2016 Activity
Reconciliations of the beginning and ending amounts of unrecognized tax benefits, excluding interest and penalties, for Fiscal 2018, Fiscal 2017, and Fiscal 2016 are presented below:
Fiscal Years Ended | ||||||||||||
March 31, 2018 | April 1, 2017 | April 2, 2016 | ||||||||||
(millions) | ||||||||||||
Unrecognized tax benefits beginning balance | $ | 49.9 | $ | 49.7 | $ | 68.0 | ||||||
Additions related to current period tax positions | 6.8 | 5.3 | 5.0 | |||||||||
Additions related to prior period tax positions | 9.5 | 15.3 | 6.9 | |||||||||
Reductions related to prior period tax positions | (1.3 | ) | (3.4 | ) | (11.3 | ) | ||||||
Reductions related to expiration of statutes of limitations | (3.3 | ) | (4.1 | ) | (7.2 | ) | ||||||
Reductions related to settlements with taxing authorities | (0.7 | ) | (12.0 | ) | (12.0 | ) | ||||||
Additions (reductions) related to foreign currency translation | 3.3 | (0.9 | ) | 0.3 | ||||||||
Unrecognized tax benefits ending balance | $ | 64.2 | $ | 49.9 | $ | 49.7 | ||||||
The Company classifies interest and penalties related to unrecognized tax benefits as part of its provision for income taxes. Reconciliations of the beginning and ending amounts of accrued interest and penalties related to unrecognized tax benefits for Fiscal 2018, Fiscal 2017, and Fiscal 2016 are presented below:
Fiscal Years Ended | ||||||||||||
March 31, 2018 | April 1, 2017 | April 2, 2016 | ||||||||||
(millions) | ||||||||||||
Accrued interest and penalties beginning balance | $ | 12.8 | $ | 30.9 | $ | 47.6 | ||||||
Net additions charged to expense | 3.8 | 2.3 | 4.0 | |||||||||
Reductions related to prior period tax positions | (1.6 | ) | (18.3 | ) | (a) | (15.4 | ) | |||||
Reductions related to settlements with taxing authorities | (0.3 | ) | (0.8 | ) | (5.3 | ) | ||||||
Additions (reductions) related to foreign currency translation | 0.3 | (1.3 | ) | — | ||||||||
Accrued interest and penalties ending balance | $ | 15.0 | $ | 12.8 | $ | 30.9 | ||||||
(a) | Includes a $15.9 million reversal of an income tax reserve resulting from a change in tax law that impacted an interest assessment on a prior year withholding tax. |
The total amount of unrecognized tax benefits, including interest and penalties, was $79.2 million and $62.7 million as of March 31, 2018 and April 1, 2017, respectively, and is included within the non-current liability for unrecognized tax benefits in the consolidated balance sheets. The total amount of unrecognized tax benefits that, if recognized, would affect the Company's effective tax rate was $68.4 million and $46.7 million as of March 31, 2018 and April 1, 2017, respectively.
Future Changes in Unrecognized Tax Benefits
The total amount of unrecognized tax benefits relating to the Company's tax positions is subject to change based on future events including, but not limited to, settlements of ongoing tax audits and assessments and the expiration of applicable statutes of limitations. Although the outcomes and timing of such events are highly uncertain, the Company does not anticipate that the balance of gross unrecognized tax benefits, excluding interest and penalties, will change significantly during the next twelve months. However, changes in the occurrence, expected outcomes, and timing of such events could cause the Company's current estimate to change materially in the future.
F-29 | ||
RALPH LAUREN CORPORATION
NOTES TO CONSOLIDATED FINANCIAL STATEMENTS (Continued)
The Company files a consolidated U.S. federal income tax return, as well as tax returns in various state, local, and foreign jurisdictions. The Company is generally no longer subject to examinations by the relevant tax authorities for years prior to its fiscal year ended April 3, 2010.
11. | Debt |
Debt consists of the following:
March 31, 2018 | April 1, 2017 | |||||||
(millions) | ||||||||
$300 million 2.125% Senior Notes(a) | $ | 298.1 | $ | 298.1 | ||||
$300 million 2.625% Senior Notes(b) | 288.0 | 290.1 | ||||||
Borrowings outstanding under credit facilities | 10.1 | — | ||||||
Total debt | 596.2 | 588.2 | ||||||
Less: short-term debt and current portion of long-term debt | 308.2 | — | ||||||
Total long-term debt | $ | 288.0 | $ | 588.2 | ||||
(a) | During Fiscal 2016, the Company entered into an interest rate swap contract which it designated as a hedge against changes in the fair value of its fixed-rate 2.125% Senior Notes (see Note 13). Accordingly, the carrying value of the 2.125% Senior Notes as of March 31, 2018 and April 1, 2017 reflects adjustments of $1.6 million and $1.2 million, respectively, for the change in fair value attributable to the benchmark interest rate. The carrying value of the 2.125% Senior Notes is also net of unamortized debt issuance costs and discount of $0.3 million and $0.7 million as of March 31, 2018 and April 1, 2017, respectively. |
(b) | During Fiscal 2016, the Company entered into an interest rate swap contract which it designated as a hedge against changes in the fair value of its fixed-rate 2.625% Senior Notes (see Note 13). Accordingly, the carrying value of the 2.625% Senior Notes as of March 31, 2018 and April 1, 2017 reflects adjustments of $10.8 million and $8.2 million, respectively, for the change in fair value attributable to the benchmark interest rate. The carrying value of the 2.625% Senior Notes is also net of unamortized debt issuance costs and discount of $1.2 million and $1.7 million as of March 31, 2018 and April 1, 2017, respectively. |
Senior Notes
In September 2013, the Company completed a registered public debt offering and issued $300 million aggregate principal amount of unsecured senior notes due September 26, 2018, which bear interest at a fixed rate of 2.125%, payable semi-annually (the "2.125% Senior Notes"). The 2.125% Senior Notes were issued at a price equal to 99.896% of their principal amount. The proceeds from this offering were used for general corporate purposes, including repayment of the Company's previously outstanding €209 million principal amount of 4.5% Euro-denominated notes, which matured on October 4, 2013.
In August 2015, the Company completed a second registered public debt offering and issued an additional $300 million aggregate principal amount of unsecured senior notes due August 18, 2020, which bear interest at a fixed rate of 2.625%, payable semi-annually (the "2.625% Senior Notes"). The 2.625% Senior Notes were issued at a price equal to 99.795% of their principal amount. The proceeds from this offering were used for general corporate purposes.
The Company has the option to redeem the 2.125% Senior Notes and 2.625% Senior Notes (collectively, the "Senior Notes"), in whole or in part, at any time at a price equal to accrued and unpaid interest on the redemption date, plus the greater of (i) 100% of the principal amount of the series of Senior Notes to be redeemed or (ii) the sum of the present value of Remaining Scheduled Payments, as defined in the supplemental indentures governing such Senior Notes (together with the indenture governing the Senior Notes, the "Indenture"). The Indenture contains certain covenants that restrict the Company's ability, subject to specified exceptions, to incur certain liens; enter into sale and leaseback transactions; consolidate or merge with another party; or sell, lease, or convey all or substantially all of the Company's property or assets to another party. However, the Indenture does not contain any financial covenants.
F-30 | ||
RALPH LAUREN CORPORATION
NOTES TO CONSOLIDATED FINANCIAL STATEMENTS (Continued)
Commercial Paper
In May 2014, the Company initiated a commercial paper borrowing program (the "Commercial Paper Program") that allowed it to issue up to $300 million of unsecured commercial paper notes through private placement using third-party broker-dealers. In May 2015, the Company expanded its Commercial Paper Program to allow for a total issuance of up to $500 million of unsecured commercial paper notes.
Borrowings under the Commercial Paper Program are supported by the Global Credit Facility, as defined below. Accordingly, the Company does not expect combined borrowings outstanding under the Commercial Paper Program and Global Credit Facility to exceed $500 million. Commercial Paper Program borrowings may be used to support the Company's general working capital and corporate needs. Maturities of commercial paper notes vary, but cannot exceed 397 days from the date of issuance. Commercial paper notes issued under the Commercial Paper Program rank equally with the Company's other forms of unsecured indebtedness. As of March 31, 2018, there were no borrowings outstanding under the Commercial Paper Program.
Revolving Credit Facilities
Global Credit Facility
In February 2015, the Company entered into an amended and restated credit facility (which was further amended in March 2016) that provides for a $500 million senior unsecured revolving line of credit through February 11, 2020 (the "Global Credit Facility") under terms and conditions substantially similar to those previously in effect. The Global Credit Facility is also used to support the issuance of letters of credit and the maintenance of the Commercial Paper Program. Borrowings under the Global Credit Facility may be denominated in U.S. Dollars and other currencies, including Euros, Hong Kong Dollars, and Japanese Yen. The Company has the ability to expand its borrowing availability under the Global Credit Facility to $750 million, subject to the agreement of one or more new or existing lenders under the facility to increase their commitments. There are no mandatory reductions in borrowing ability throughout the term of the Global Credit Facility. As of March 31, 2018, there were no borrowings outstanding under the Global Credit Facility and the Company was contingently liable for $8.3 million of outstanding letters of credit.
U.S. Dollar-denominated borrowings under the Global Credit Facility bear interest, at the Company's option, either at (a) a base rate, by reference to the greatest of: (i) the annual prime commercial lending rate of JPMorgan Chase Bank, N.A. in effect from time to time, (ii) the weighted-average overnight Federal funds rate plus 50 basis points, or (iii) the one-month London Interbank Offered Rate ("LIBOR") plus 100 basis points; or (b) LIBOR, adjusted for the Federal Reserve Board's Eurocurrency liabilities maximum reserve percentage, plus a spread of 87.5 basis points, subject to adjustment based on the Company's credit ratings ("Adjusted LIBOR"). Foreign currency-denominated borrowings bear interest at Adjusted LIBOR.
In addition to paying interest on any outstanding borrowings under the Global Credit Facility, the Company is required to pay a commitment fee to the lenders under the Global Credit Facility with respect to the unutilized commitments. The commitment fee rate of 7 basis points under the terms of the Global Credit Facility is subject to adjustment based on the Company's credit ratings.
The Global Credit Facility contains a number of covenants that, among other things, restrict the Company's ability, subject to specified exceptions, to incur additional debt; incur liens; sell or dispose of assets; merge with or acquire other companies; liquidate or dissolve itself; engage in businesses that are not in a related line of business; make loans, advances, or guarantees; engage in transactions with affiliates; and make certain investments. The Global Credit Facility also requires the Company to maintain a maximum ratio of Adjusted Debt to Consolidated EBITDAR (the "leverage ratio") of no greater than 3.75 as of the date of measurement for the four most recent consecutive fiscal quarters. Adjusted Debt is defined generally as consolidated debt outstanding plus four times consolidated rent expense for the four most recent consecutive fiscal quarters. Consolidated EBITDAR is defined generally as consolidated net income plus (i) income tax expense, (ii) net interest expense, (iii) depreciation and amortization expense, (iv) consolidated rent expense, (v) restructuring and other non-recurring expenses, and (vi) acquisition-related costs. As of March 31, 2018, no Event of Default (as such term is defined pursuant to the Global Credit Facility) has occurred under the Company's Global Credit Facility.
Upon the occurrence of an Event of Default under the Global Credit Facility, the lenders may cease making loans, terminate the Global Credit Facility, and declare all amounts outstanding to be immediately due and payable. The Global Credit Facility specifies a number of events of default (many of which are subject to applicable grace periods), including, among others, the failure to make timely principal, interest, and fee payments or to satisfy the covenants, including the financial covenant described above.
F-31 | ||
RALPH LAUREN CORPORATION
NOTES TO CONSOLIDATED FINANCIAL STATEMENTS (Continued)
Additionally, the Global Credit Facility provides that an Event of Default will occur if Mr. Ralph Lauren, the Company's Executive Chairman and Chief Creative Officer, and entities controlled by the Lauren family fail to maintain a specified minimum percentage of the voting power of the Company's common stock.
Pan-Asia Credit Facilities
Certain of the Company's subsidiaries in Asia have uncommitted credit facilities with regional branches of JPMorgan Chase (the "Banks") in China and South Korea (the "Pan-Asia Credit Facilities"). These credit facilities are subject to annual renewal and may be used to fund general working capital and corporate needs of the Company's operations in the respective countries. Borrowings under the Pan-Asia Credit Facilities are guaranteed by the parent company and are granted at the sole discretion of the Banks, subject to availability of the Banks' funds and satisfaction of certain regulatory requirements. The Pan-Asia Credit Facilities do not contain any financial covenants. The Company's Pan-Asia Credit Facilities by country are as follows:
• | China Credit Facility — provides Ralph Lauren Trading (Shanghai) Co., Ltd. with a revolving line of credit of up to 50 million Chinese Renminbi (approximately $8 million) through April 3, 2019, which is also able to be used to support bank guarantees. |
• | South Korea Credit Facility — provides Ralph Lauren (Korea) Ltd. with a revolving line of credit of up to 47 billion South Korean Won (approximately $44 million) through October 31, 2018. |
As of March 31, 2018, borrowings outstanding under the Pan-Asia Credit Facilities were $10.1 million, which have been classified as short-term debt in the Company's consolidated balance sheet.
12. | Fair Value Measurements |
U.S. GAAP establishes a three-level valuation hierarchy for disclosure of fair value measurements. The determination of the applicable level within the hierarchy for a particular asset or liability depends on the inputs used in its valuation as of the measurement date, notably the extent to which the inputs are market-based (observable) or internally-derived (unobservable). A financial instrument's categorization within the valuation hierarchy is based upon the lowest level of input that is significant to the fair value measurement. The three levels are defined as follows:
• | Level 1 — inputs to the valuation methodology based on quoted prices (unadjusted) for identical assets or liabilities in active markets. |
• | Level 2 — inputs to the valuation methodology based on quoted prices for similar assets or liabilities in active markets for substantially the full term of the financial instrument; quoted prices for identical or similar instruments in markets that are not active for substantially the full term of the financial instrument; and model-derived valuations whose inputs or significant value drivers are observable. |
• | Level 3 — inputs to the valuation methodology based on unobservable prices or valuation techniques that are significant to the fair value measurement. |
The following table summarizes the Company's financial assets and liabilities that are measured and recorded at fair value on a recurring basis, excluding accrued interest components:
March 31, 2018 | April 1, 2017 | |||||||
(millions) | ||||||||
Investments in commercial paper(a)(b) | $ | 234.2 | $ | — | ||||
Derivative assets(a) | 12.3 | 32.6 | ||||||
Derivative liabilities(a) | 110.0 | 21.7 | ||||||
(a) | Based on Level 2 measurements. |
(b) | $15.0 million included within cash and cash equivalents and $219.2 million included within short-term investments in the consolidated balance sheet as of March 31, 2018. |
F-32 | ||
RALPH LAUREN CORPORATION
NOTES TO CONSOLIDATED FINANCIAL STATEMENTS (Continued)
The Company's investments in commercial paper are classified as available-for-sale and recorded at fair value in its consolidated balance sheets using external pricing data, based on interest rates and credit ratings for similar issuances with the same remaining term as the Company's investments. To the extent the Company invests in bonds, such investments are also classified as available-for-sale and recorded at fair value in its consolidated balance sheets based on quoted prices in active markets.
The Company's derivative financial instruments are recorded at fair value in its consolidated balance sheets and are valued using pricing models that are primarily based on market observable external inputs, including spot and forward currency exchange rates, benchmark interest rates, and discount rates consistent with the instrument's tenor, and consider the impact of the Company's own credit risk, if any. Changes in counterparty credit risk are also considered in the valuation of derivative financial instruments.
The Company's cash and cash equivalents, restricted cash, and time deposits are recorded at carrying value, which approximates fair value based on Level 1 measurements.
The Company's debt instruments are recorded at their carrying values in its consolidated balance sheets, which may differ from their respective fair values. The fair values of the Senior Notes are estimated based on external pricing data, including available quoted market prices, and with reference to comparable debt instruments with similar interest rates, credit ratings, and trading frequency, among other factors. The fair values of the Company's commercial paper notes and borrowings outstanding under its credit facilities, if any, are estimated using external pricing data, based on interest rates and credit ratings for similar issuances with the same remaining term as the Company's outstanding borrowings. Due to their short-term nature, the fair values of the Company's commercial paper notes and borrowings outstanding under its credit facilities, if any, generally approximate their carrying values.
The following table summarizes the carrying values and the estimated fair values of the Company's debt instruments:
March 31, 2018 | April 1, 2017 | |||||||||||||||
Carrying Value | Fair Value(a) | Carrying Value | Fair Value(a) | |||||||||||||
(millions) | ||||||||||||||||
$300 million 2.125% Senior Notes | $ | 298.1 | (b) | $ | 299.4 | $ | 298.1 | (b) | $ | 302.2 | ||||||
$300 million 2.625% Senior Notes | 288.0 | (b) | 298.7 | 290.1 | (b) | 302.8 | ||||||||||
Borrowings outstanding under credit facilities | 10.1 | 10.1 | — | — | ||||||||||||
(a) | Based on Level 2 measurements. |
(b) | See Note 11 for discussion of the carrying values of the Company's Senior Notes. |
Unrealized gains or losses resulting from changes in the fair value of the Company's debt do not result in the realization or expenditure of cash, unless the debt is retired prior to its maturity.
Non-financial Assets and Liabilities
The Company's non-financial assets, which primarily consist of goodwill, other intangible assets, and property and equipment, are not required to be measured at fair value on a recurring basis and are reported at carrying value. However, on a periodic basis or whenever events or changes in circumstances indicate that their carrying value may not be fully recoverable (and at least annually for goodwill and indefinite-lived intangible assets), non-financial assets are assessed for impairment and, if applicable, written down to and recorded at fair value, considering external market participant assumptions.
During Fiscal 2018, Fiscal 2017, and Fiscal 2016, the Company recorded non-cash impairment charges of $41.2 million, $248.6 million, and $48.8 million, respectively, to fully write off the carrying values of certain long-lived assets based upon their assumed fair values of zero. Additionally, as a result of a change in the planned usage of a certain intangible asset, the Company recorded a non-cash impairment charge of $8.8 million to reduce the carrying value of the intangible asset from $11.7 million to its estimated fair value of $2.9 million. The fair values of these long-lived and intangible assets were determined based on Level 3 measurements. Inputs to these fair value measurements included estimates of the amount and timing of the assets' net future discounted cash flows based on historical experience, current trends, and market conditions. See Note 8 for further discussion of the non-cash impairment charges recorded by the Company during the fiscal years presented.
F-33 | ||
RALPH LAUREN CORPORATION
NOTES TO CONSOLIDATED FINANCIAL STATEMENTS (Continued)
In Fiscal 2018, the Company performed its annual goodwill impairment assessment as of the beginning of the second quarter of the fiscal year using a qualitative approach. In performing the assessment, the Company identified and considered the significance of relevant key factors, events, and circumstances that affected the fair values and/or carrying amounts of its reporting units with allocated goodwill. These factors included external factors such as macroeconomic, industry, and market conditions, as well as entity-specific factors, such as the Company's actual and expected financial performance. Additionally, the results of the Company's most recent quantitative goodwill impairment test indicated that the fair values of these reporting units significantly exceeded their respective carrying values. Based on the results of its qualitative goodwill impairment assessment, the Company concluded that it is not more likely than not that the fair values of its reporting units are less than their respective carrying values, and there were no reporting units at risk of impairment. No goodwill impairment charges were recorded during any of the three fiscal years presented in connection with the Company's annual goodwill impairment assessments.
Subsequent to the Company's Fiscal 2017 annual goodwill impairment assessment, the Company realigned its segment reporting structure during the fourth quarter of Fiscal 2017 as a result of significant organizational changes implemented in connection with the Way Forward Plan. As a result of the realignment of its segment reporting structure, the Company reallocated the carrying amount of goodwill to its new reporting units based upon each reporting unit's relative fair value as of the first day of the Company's fourth quarter of Fiscal 2017. In connection with this reallocation, the Company performed an interim assessment of the recoverability of goodwill assigned to its new reporting units using a quantitative approach. The estimated fair values of the Company's new reporting units were determined using discounted cash flows and market comparisons. Based on the results of the quantitative impairment assessment performed, the Company concluded that the fair value of one of its new reporting units was less than its carrying value. As a result, a goodwill impairment charge of $5.2 million was recorded to fully write off the carrying value of the reporting unit's reallocated goodwill. The fair values of the remaining new reporting units significantly exceeded their respective carrying values and were not at risk of impairment.
13. | Financial Instruments |
Derivative Financial Instruments
The Company is exposed to changes in foreign currency exchange rates, primarily relating to certain anticipated cash flows and the value of the reported net assets of its international operations, as well as changes in the fair value of its fixed-rate debt attributed to changes in the benchmark interest rate. Consequently, the Company uses derivative financial instruments to manage and mitigate such risks. The Company does not enter into derivative transactions for speculative or trading purposes.
The following table summarizes the Company's outstanding derivative instruments on a gross basis as recorded in its consolidated balance sheets as of March 31, 2018 and April 1, 2017:
Notional Amounts | Derivative Assets | Derivative Liabilities | ||||||||||||||||||||||||||||||
Derivative Instrument(a) | March 31, 2018 | April 1, 2017 | March 31, 2018 | April 1, 2017 | March 31, 2018 | April 1, 2017 | ||||||||||||||||||||||||||
Balance Sheet Line(b) | Fair Value | Balance Sheet Line(b) | Fair Value | Balance Sheet Line(b) | Fair Value | Balance Sheet Line(b) | Fair Value | |||||||||||||||||||||||||
(millions) | ||||||||||||||||||||||||||||||||
Designated Hedges: | ||||||||||||||||||||||||||||||||
FC — Cash flow hedges | $ | 514.5 | $ | 533.2 | PP | $ | 1.1 | PP | $ | 17.7 | (e) | $ | 13.5 | AE | $ | 3.7 | ||||||||||||||||
IRS — Fixed-rate debt | 600.0 | 600.0 | — | — | (f) | 12.4 | ONCL | 9.4 | ||||||||||||||||||||||||
Net investment hedges(c) | 1,081.2 | 591.2 | PP | 0.1 | ONCA | 9.6 | (g) | 82.6 | — | |||||||||||||||||||||||
Total Designated Hedges | 2,195.7 | 1,724.4 | 1.2 | 27.3 | 108.5 | 13.1 | ||||||||||||||||||||||||||
Undesignated Hedges: | ||||||||||||||||||||||||||||||||
FC — Undesignated hedges(d) | 459.2 | 375.1 | PP | 11.1 | PP | 5.3 | AE | 1.5 | AE | 8.6 | ||||||||||||||||||||||
Total Hedges | $ | 2,654.9 | $ | 2,099.5 | $ | 12.3 | $ | 32.6 | $ | 110.0 | $ | 21.7 | ||||||||||||||||||||
(a) | FC = Forward foreign currency exchange contracts; IRS = Interest rate swap contracts. |
(b) | PP = Prepaid expenses and other current assets; AE = Accrued expenses and other current liabilities; ONCA = Other non-current assets; ONCL = Other non-current liabilities. |
F-34 | ||
RALPH LAUREN CORPORATION
NOTES TO CONSOLIDATED FINANCIAL STATEMENTS (Continued)
(c) | Includes cross-currency swaps and forward foreign currency exchange contracts designated as hedges of the Company's net investment in certain foreign operations. |
(d) | Primarily includes undesignated hedges of foreign currency-denominated intercompany loans and other intercompany balances. |
(e) | $12.9 million included within accrued expenses and other current liabilities and $0.6 million included within other non-current liabilities. |
(f) | $1.6 million included within accrued expenses and other current liabilities and $10.8 million included within other non-current liabilities. |
(g) | $44.8 million included within accrued expenses and other current liabilities and $37.8 million included within other non-current liabilities. |
The Company records and presents the fair values of all of its derivative assets and liabilities in its consolidated balance sheets on a gross basis, even when they are subject to master netting arrangements. However, if the Company were to offset and record the asset and liability balances of all of its derivative instruments on a net basis in accordance with the terms of each of its master netting arrangements, spread across eight separate counterparties, the amounts presented in the consolidated balance sheets as of March 31, 2018 and April 1, 2017 would be adjusted from the current gross presentation as detailed in the following table:
March 31, 2018 | April 1, 2017 | |||||||||||||||||||||||
Gross Amounts Presented in the Balance Sheet | Gross Amounts Not Offset in the Balance Sheet that are Subject to Master Netting Agreements | Net Amount | Gross Amounts Presented in the Balance Sheet | Gross Amounts Not Offset in the Balance Sheet that are Subject to Master Netting Agreements | Net Amount | |||||||||||||||||||
(millions) | ||||||||||||||||||||||||
Derivative assets | $ | 12.3 | $ | (10.7 | ) | $ | 1.6 | $ | 32.6 | $ | (18.3 | ) | $ | 14.3 | ||||||||||
Derivative liabilities | 110.0 | (10.7 | ) | 99.3 | 21.7 | (18.3 | ) | 3.4 | ||||||||||||||||
The Company's master netting arrangements do not require cash collateral to be pledged by the Company or its counterparties. See Note 3 for further discussion of the Company's master netting arrangements.
The following tables summarize the pretax impact of the effective portion of gains and losses from the Company's designated derivative instruments on its consolidated financial statements for the fiscal years presented:
Gains (Losses) Recognized in OCI | ||||||||||||
Fiscal Years Ended | ||||||||||||
March 31, 2018 | April 1, 2017 | April 2, 2016 | ||||||||||
(millions) | ||||||||||||
Designated Hedges: | ||||||||||||
FC — Cash flow hedges | $ | (45.5 | ) | $ | 30.4 | $ | (20.5 | ) | ||||
Net investment hedges(a) | (90.9 | ) | 37.7 | (28.4 | ) | |||||||
Total Designated Hedges | $ | (136.4 | ) | $ | 68.1 | $ | (48.9 | ) | ||||
Gains (Losses) Reclassified from AOCI to Earnings | Location of Gains (Losses) Reclassified from AOCI to Earnings | |||||||||||||
Fiscal Years Ended | ||||||||||||||
March 31, 2018 | April 1, 2017 | April 2, 2016 | ||||||||||||
(millions) | ||||||||||||||
Designated Hedges: | ||||||||||||||
FC — Cash flow hedges | $ | (8.2 | ) | $ | 0.5 | $ | 43.7 | Cost of goods sold | ||||||
FC — Cash flow hedges | (2.9 | ) | 0.5 | (4.7 | ) | Other expense, net | ||||||||
Total Designated Hedges | $ | (11.1 | ) | $ | 1.0 | $ | 39.0 | |||||||
(a) | Amounts recognized in OCI would be recognized in earnings only upon the sale or liquidation of the hedged net investment. |
F-35 | ||
RALPH LAUREN CORPORATION
NOTES TO CONSOLIDATED FINANCIAL STATEMENTS (Continued)
As of March 31, 2018, it is estimated that $17.6 million of pretax net losses on both outstanding and matured derivative instruments deferred in AOCI will be recognized in earnings over the next twelve months. The amounts ultimately recognized in earnings will depend on exchange rates in effect when outstanding derivative instruments are settled. No material gains or losses relating to ineffective cash flow hedges were recognized during any of the fiscal years presented.
The following table summarizes the pretax impact of gains and losses from the Company's undesignated derivative instruments on its consolidated financial statements for the fiscal years presented:
Gains (Losses) Recognized in Earnings | Location of Gains (Losses) Recognized in Earnings | |||||||||||||
Fiscal Years Ended | ||||||||||||||
March 31, 2018 | April 1, 2017 | April 2, 2016 | ||||||||||||
(millions) | ||||||||||||||
Undesignated Hedges: | ||||||||||||||
FC — Undesignated hedges | $ | 2.4 | $ | (3.6 | ) | $ | (6.6 | ) | Other expense, net | |||||
Total Undesignated Hedges | $ | 2.4 | $ | (3.6 | ) | $ | (6.6 | ) | ||||||
Risk Management Strategies
Forward Foreign Currency Exchange Contracts
The Company uses forward foreign currency exchange contracts to reduce its risk related to exchange rate fluctuations on inventory transactions made in an entity's non-functional currency, intercompany royalty payments made by certain of its international operations, the settlement of foreign currency-denominated balances, and the translation of certain foreign operations' net assets into U.S. Dollars. As part of its overall strategy to manage the level of exposure to the risk of foreign currency exchange rate fluctuations, primarily to changes in the value of the Euro, the Japanese Yen, the South Korean Won, the Australian Dollar, the Canadian Dollar, the British Pound Sterling, the Swiss Franc, the Swedish Krona, the Chinese Renminbi, the New Taiwan Dollar, and the Hong Kong Dollar, the Company hedges a portion of its foreign currency exposures anticipated over a two-year period. In doing so, the Company uses forward foreign currency exchange contracts that generally have maturities of two months to two years to provide continuing coverage throughout the hedging period of the respective exposure.
Interest Rate Swap Contracts
During Fiscal 2016, the Company entered into two pay-floating rate, receive-fixed rate interest rate swap contracts which it designated as hedges against changes in the respective fair values of its fixed-rate 2.125% Senior Notes and its fixed-rate 2.625% Senior Notes attributed to changes in the benchmark interest rate (the "Interest Rate Swaps"). The Interest Rate Swaps, which mature on September 26, 2018 and August 18, 2020, respectively, both have notional amounts of $300 million and swap the fixed interest rates on the Company's 2.125% Senior Notes and 2.625% Senior Notes for variable interest rates based on the 3-month LIBOR plus a fixed spread. Changes in the fair values of the Interest Rate Swaps were offset by changes in the fair values of the 2.125% Senior Notes and 2.625% Senior Notes attributed to changes in the benchmark interest rate, with no resulting ineffectiveness recognized in earnings during any of the fiscal years presented.
Cross-Currency Swap Contracts
During Fiscal 2016, the Company entered into two pay-floating rate, receive-floating rate cross-currency swap contracts, with notional amounts of €280 million and €274 million, which it designated as hedges of its net investment in certain of its European subsidiaries (the "Cross-Currency Swaps"). The Cross-Currency Swaps, which mature on September 26, 2018 and August 18, 2020, respectively, swap the U.S. Dollar-denominated variable interest rate payments based on 3-month LIBOR plus a fixed spread (as paid under the Interest Rate Swaps described above) for Euro-denominated variable interest rate payments based on the 3-month Euro Interbank Offered Rate plus a fixed spread. As a result, the Cross-Currency Swaps, in conjunction with the Interest Rate Swaps, economically convert the Company's $300 million fixed-rate 2.125% and $300 million fixed-rate 2.625% obligations to €280 million and €274 million floating-rate Euro-denominated liabilities, respectively. No material gains or losses related to the ineffective portion, or the amount excluded from effectiveness testing, were recognized in interest expense within the consolidated statements of operations during any of the fiscal years presented.
F-36 | ||
RALPH LAUREN CORPORATION
NOTES TO CONSOLIDATED FINANCIAL STATEMENTS (Continued)
See Note 3 for further discussion of the Company's accounting policies relating to its derivative financial instruments.
Investments
As of March 31, 2018, the Company's short-term investments consisted of $480.2 million of time deposits and $219.2 million of commercial paper, and its non-current investments consisted of $86.2 million of time deposits. As of April 1, 2017, the Company held short-term investments of $684.7 million and non-current investments of $21.4 million, both consisting of time deposits.
No significant realized or unrealized gains or losses on available-for-sale investments or other-than-temporary impairment charges were recorded in any of the fiscal years presented.
See Note 3 for further discussion of the Company's accounting policies relating to its investments.
14. | Commitments and Contingencies |
Leases
The Company operates most of its retail stores under various leasing arrangements. The Company also occupies various office and warehouse facilities and uses certain equipment under numerous lease agreements. Such leasing arrangements are accounted for as either operating leases or capital leases. In this context, capital leases include leases whereby the Company is considered to have the substantive risks of ownership during construction of a leased property. Information on the Company's operating and capital leasing activities is set forth below.
Operating Leases
The Company is typically required to make minimum rental payments, and often contingent rental payments, under its operating leases. Many of the Company's retail store leases provide for contingent rental payments based upon sales, and certain rental agreements require payment based solely on a percentage of sales. Terms of the Company's leases generally contain renewal options, rent escalation clauses, and landlord incentives. Rent expense, net of sublease income, was $443.1 million, $460.5 million, and $472.4 million in Fiscal 2018, Fiscal 2017, and Fiscal 2016, respectively. Such amounts include contingent rental charges of $175.9 million, $164.0 million, and $163.4 million in Fiscal 2018, Fiscal 2017, and Fiscal 2016, respectively. In addition to such amounts, the Company is normally required to pay taxes, insurance, and certain occupancy costs relating to the leased real estate properties.
As of March 31, 2018, future minimum rental payments under noncancelable operating leases with lease terms in excess of one year were as follows:
Minimum Operating Lease Payments(a) | ||||
(millions) | ||||
Fiscal 2019 | $ | 343.8 | ||
Fiscal 2020 | 318.1 | |||
Fiscal 2021 | 262.6 | |||
Fiscal 2022 | 220.1 | |||
Fiscal 2023 | 199.1 | |||
Fiscal 2024 and thereafter | 504.5 | |||
Total net minimum rental payments | $ | 1,848.2 | ||
(a) | Net of sublease income, which is not significant in any period. |
F-37 | ||
RALPH LAUREN CORPORATION
NOTES TO CONSOLIDATED FINANCIAL STATEMENTS (Continued)
Capital Leases
Assets under capital leases, including build-to-suit leases, amounted to $243.2 million and $264.9 million at the end of Fiscal 2018 and Fiscal 2017, respectively, net of accumulated depreciation of $104.5 million and $77.6 million, respectively. Such assets are classified within property and equipment, net in the consolidated balance sheets based on their nature.
As of March 31, 2018, future minimum rental payments under noncancelable capital leases, including build-to-suit leases, with lease terms in excess of one year were as follows:
Minimum Capital Lease Payments(a)(b) | ||||
(millions) | ||||
Fiscal 2019 | $ | 29.6 | ||
Fiscal 2020 | 31.9 | |||
Fiscal 2021 | 30.5 | |||
Fiscal 2022 | 29.4 | |||
Fiscal 2023 | 28.9 | |||
Fiscal 2024 and thereafter | 78.5 | |||
Total net minimum rental payments | 228.8 | |||
Less: amount representing interest | (73.4 | ) | ||
Present value of net minimum rental payments | $ | 155.4 | ||
(a) | Net of sublease income, which is not significant in any period. |
(b) | Includes lease payments related to the Company's build-to-suit lease agreement for its former Polo store on Fifth Avenue in New York City, which was closed during the first quarter of Fiscal 2018. The total remaining commitment related to this lease was $135.1 million as of March 31, 2018, comprised of a $41.2 million operating lease obligation related to the land portion of the lease (included in the minimum operating lease payments table above) and a $93.9 million obligation related to the building portion of the lease (included in this minimum capital lease payments table). |
U.S. Tax Reform
In connection with the TCJA's provision that subjects previously deferred foreign earnings to a one-time mandatory transition tax, the Company recorded net charges of $209.3 million within its income tax provision during Fiscal 2018 on a provisional basis (as described in Note 10). The related income tax payable obligation of $147.8 million, which is net of foreign tax credits and other federal income tax activity of $61.5 million that the Company expects to utilize to partially reduce this tax obligation, is expected to be paid over an eight-year period as follows:
Mandatory Transition Tax Payments(a) | ||||
(millions) | ||||
Fiscal 2019 | $ | 23.0 | ||
Fiscal 2020 | 11.6 | |||
Fiscal 2021 | 11.6 | |||
Fiscal 2022 | 11.6 | |||
Fiscal 2023 | 19.2 | |||
Fiscal 2024 and thereafter | 70.8 | |||
Total mandatory transition tax payments | $ | 147.8 | ||
(a) | Included within current and non-current income tax payable in the consolidated balance sheets based upon the estimating timing of payments. |
See Note 10 for further discussion of the TCJA and its enactment-related impacts on the Company's consolidated financial statements.
F-38 | ||
RALPH LAUREN CORPORATION
NOTES TO CONSOLIDATED FINANCIAL STATEMENTS (Continued)
Employee Agreements
The Company has employment agreements with certain executives in the normal course of business which provide for compensation and certain other benefits. These agreements also provide for severance payments under certain circumstances.
Other Commitments
Other off-balance sheet firm commitments amounted to $880.9 million as of March 31, 2018, including inventory purchase commitments of $741.7 million, outstanding letters of credit of $9.3 million, interest payments related to the Company's Senior Notes of $22.9 million, and other commitments of $107.0 million, comprised of the Company's legally-binding obligations under sponsorship, licensing, and other marketing and advertising agreements, distribution-related agreements, information technology-related service agreements, and pension-related obligations.
Customs Audit
In September 2014, one of the Company's international subsidiaries received a pre-assessment notice from the relevant customs officials concerning the method used to determine the dutiable value of imported inventory. The notice communicated the customs officials' assertion that the Company should have applied an alternative duty method, which could result in up to $46 million in incremental duty and non-creditable value-added tax, including $11 million in interest and penalties. The Company believes that the alternative duty method claimed by the customs officials is not applicable to the Company's facts and circumstances and is vigorously contesting their asserted methodology.
In October 2014, the Company filed an appeal of the pre-assessment notice in accordance with the standard procedures established by the relevant customs authorities. In response to the filing of the Company's appeal of the pre-assessment notice, the review committee instructed the customs officials to reconsider their assertion of the alternative duty method and conduct a re-audit to evaluate the facts and circumstances noted in the pre-assessment notice. In December 2015, the Company received the results of the re-audit conducted and a customs audit assessment notice in the amount of $34.1 million, which the Company recorded within restructuring and other charges in its consolidated statements of operations during the third quarter of Fiscal 2016 (see Note 9). Although the Company disagrees with the assessment notice, in order to secure the Company's rights, the Company was required to pay the assessment amount and then subsequently file an appeal with the customs authorities.
In October 2017, the tax tribunal presiding over the Company's appeal instructed the customs officials to reconsider their assertions under the alternative duty method and conduct a second re-audit to evaluate the facts and circumstances noted in the pre-assessment notice. In March 2018, the Company received the results of the second re-audit conducted and a related net refund in the amount of $15.6 million. Also in March 2018, the Company filed voluntary disclosure requests to the relevant customs authorities for certain post-audit periods and made related payments of $40.6 million, which included recoverable value-added tax of $14.8 million. In connection with the re-audit refund received and the non-tax portion of the voluntary disclosure payment made, the Company recorded a net charge of $10.2 million within restructuring and other charges in its consolidated statements of operations during the fourth quarter of Fiscal 2018 (see Note 9).
The Company continues to maintain its original filing position and is assessing its options to contest the proposed methodology asserted by the customs officials, including further appeal of the re-audit decision within the courts. Should the Company be successful in its merits, a full refund for the amounts paid plus interest will be required to be paid by the customs authorities. At this time, while the Company believes that the customs officials' claims are not meritorious and that the Company should prevail, the outcome of the appeals process is subject to risk and uncertainty.
Other Matters
The Company is involved, from time to time, in litigation, other legal claims, and proceedings involving matters associated with or incidental to its business, including, among other things, matters involving credit card fraud, trademark and other intellectual property, licensing, importation and exportation of its products, taxation, unclaimed property, and employee relations. The Company believes at present that the resolution of currently pending matters will not individually or in the aggregate have a material adverse effect on its consolidated financial statements. However, the Company's assessment of the current litigation or other legal claims could potentially change in light of the discovery of facts not presently known or determinations by judges, juries, or other finders of fact which are not in accord with management's evaluation of the possible liability or outcome of such litigation or claims.
F-39 | ||
RALPH LAUREN CORPORATION
NOTES TO CONSOLIDATED FINANCIAL STATEMENTS (Continued)
In the normal course of business, the Company enters into agreements that provide general indemnifications. The Company has not made any significant indemnification payments under such agreements in the past, and does not currently anticipate incurring any material indemnification payments.
15. | Equity |
Capital Stock
The Company's capital stock consists of two classes of common stock. There are 500 million shares of Class A common stock and 100 million shares of Class B common stock authorized to be issued. Shares of Class A and Class B common stock have substantially identical rights, except with respect to voting rights. Holders of Class A common stock are entitled to one vote per share and holders of Class B common stock are entitled to ten votes per share. Holders of both classes of stock vote together as a single class on all matters presented to the stockholders for their approval, except with respect to the election and removal of directors or as otherwise required by applicable law. All outstanding shares of Class B common stock are owned by Mr. Ralph Lauren, the Company's Executive Chairman and Chief Creative Officer, and entities controlled by the Lauren family, and are convertible at any time into shares of Class A common stock on a one-for-one basis.
Common Stock Repurchase Program
In June 2016, as part of its common stock repurchase program, the Company entered into an accelerated share repurchase program with a third-party financial institution under which it made an upfront payment of $100 million in exchange for an initial delivery of 0.9 million shares of its Class A common stock, representing 90% of the total shares ultimately expected to be delivered over the program's term (the "ASR Program"). The initial shares received, which had an aggregate cost of $90 million based on the June 20, 2016 closing share price, were immediately retired and recorded as an increase to treasury stock.
In September 2016, at the ASR Program's conclusion, the Company received 0.1 million additional shares and recorded a related $10 million increase to treasury stock. The number of additional shares delivered was based on the volume-weighted average price per share of the Company's Class A common stock over the term of the ASR Program, less an agreed upon discount. The average price per share paid for all of the shares delivered under the ASR Program was $98.48.
A summary of the Company's repurchases of Class A common stock under its common stock repurchase program, including the ASR Program, is as follows:
Fiscal Years Ended | ||||||||||||
March 31, 2018 | April 1, 2017 | April 2, 2016 | ||||||||||
(in millions) | ||||||||||||
Cost of shares repurchased | $ | — | $ | 200.0 | $ | 479.9 | ||||||
Number of shares repurchased | 0.0 | 2.2 | 4.2 | |||||||||
As of March 31, 2018, the remaining availability under the Company's Class A common stock repurchase program was approximately $100 million. Repurchases of shares of Class A common stock are subject to overall business and market conditions.
In addition, during each of Fiscal 2018, Fiscal 2017, and Fiscal 2016, 0.2 million shares of Class A common stock at a cost of $17.1 million, $15.2 million, and $20.5 million, respectively, were surrendered to or withheld by the Company in satisfaction of withholding taxes in connection with the vesting of awards under the Company's 1997 Long-Term Stock Incentive Plan, as amended (the "1997 Incentive Plan"), and its Amended and Restated 2010 Long-Term Stock Incentive Plan (the "2010 Incentive Plan").
Repurchased and surrendered shares are accounted for as treasury stock at cost and held in treasury for future use.
Dividends
Since 2003, the Company has maintained a regular quarterly cash dividend program on its common stock. During Fiscal 2018, Fiscal 2017, and Fiscal 2016, the quarterly cash dividend was $0.50 per share. Dividends paid amounted to $162.4 million, $164.8 million, and $170.3 million in Fiscal 2018, Fiscal 2017, and Fiscal 2016, respectively.
F-40 | ||
RALPH LAUREN CORPORATION
NOTES TO CONSOLIDATED FINANCIAL STATEMENTS (Continued)
16. | Accumulated Other Comprehensive Income (Loss) |
The following table presents OCI activity, net of tax, which is accumulated in equity:
Foreign Currency Translation Gains (Losses)(a) | Net Unrealized Gains (Losses) on Cash Flow Hedges(b) | Net Unrealized Gains (Losses) on Defined Benefit Plans(c) | Total Accumulated Other Comprehensive Income (Loss) | |||||||||||||
(millions) | ||||||||||||||||
Balance at March 28, 2015 | $ | (194.0 | ) | $ | 43.2 | $ | (14.8 | ) | $ | (165.6 | ) | |||||
Other comprehensive income (loss), net of tax: | ||||||||||||||||
OCI before reclassifications | 36.4 | (18.8 | ) | 1.4 | 19.0 | |||||||||||
Amounts reclassified from AOCI to earnings | — | (36.4 | ) | 1.5 | (34.9 | ) | ||||||||||
Other comprehensive income (loss), net of tax | 36.4 | (55.2 | ) | 2.9 | (15.9 | ) | ||||||||||
Balance at April 2, 2016 | (157.6 | ) | (12.0 | ) | (11.9 | ) | (181.5 | ) | ||||||||
Other comprehensive income (loss), net of tax: | ||||||||||||||||
OCI before reclassifications | (48.6 | ) | 28.2 | 1.8 | (18.6 | ) | ||||||||||
Amounts reclassified from AOCI to earnings | — | (1.6 | ) | 3.3 | 1.7 | |||||||||||
Other comprehensive income (loss), net of tax | (48.6 | ) | 26.6 | 5.1 | (16.9 | ) | ||||||||||
Balance at April 1, 2017 | (206.2 | ) | 14.6 | (6.8 | ) | (198.4 | ) | |||||||||
Other comprehensive income (loss), net of tax: | ||||||||||||||||
OCI before reclassifications | 126.9 | (40.5 | ) | 0.9 | 87.3 | |||||||||||
Amounts reclassified from AOCI to earnings | — | 9.9 | 2.7 | 12.6 | ||||||||||||
Other comprehensive income (loss), net of tax | 126.9 | (30.6 | ) | 3.6 | 99.9 | |||||||||||
Balance at March 31, 2018 | $ | (79.3 | ) | $ | (16.0 | ) | $ | (3.2 | ) | $ | (98.5 | ) | ||||
(a) | OCI before reclassifications to earnings related to foreign currency translation gains (losses) includes income tax benefits of $23.3 million and $10.7 million for Fiscal 2018 and Fiscal 2016, respectively, and includes an income tax provision of $15.0 million for Fiscal 2017. OCI before reclassifications to earnings includes losses of $59.6 million (net of a $31.3 million income tax benefit) and $17.4 million (net of an $11.0 million income tax benefit) for Fiscal 2018 and Fiscal 2016, respectively, and includes a gain of $23.4 million (net of a $14.3 million income tax provision) for Fiscal 2017, related to the effective portion of changes in the fair values of instruments designated as hedges of the Company's net investment in certain foreign operations (see Note 13). |
(b) | OCI before reclassifications to earnings related to net unrealized gains (losses) on cash flow hedges are presented net of income tax benefits of $5.0 million and $1.7 million for Fiscal 2018 and Fiscal 2016, respectively, and are presented net of an income tax provision of $2.2 million for Fiscal 2017. The tax effects on amounts reclassified from AOCI to earnings are presented in a table below. |
(c) | Activity is presented net of taxes, which were immaterial for all periods presented. |
The following table presents reclassifications from AOCI to earnings for cash flow hedges, by component:
Fiscal Years Ended | ||||||||||||||
March 31, 2018 | April 1, 2017 | April 2, 2016 | Location of Gains (Losses) Reclassified from AOCI to Earnings | |||||||||||
(millions) | ||||||||||||||
Gains (losses) on cash flow hedges(a): | ||||||||||||||
FC — Cash flow hedges | $ | (8.2 | ) | $ | 0.5 | $ | 43.7 | Cost of goods sold | ||||||
FC — Cash flow hedges | (2.9 | ) | 0.5 | (4.7 | ) | Other expense, net | ||||||||
Tax effect | 1.2 | 0.6 | (2.6 | ) | Income tax benefit (provision) | |||||||||
Net of tax | $ | (9.9 | ) | $ | 1.6 | $ | 36.4 | |||||||
(a) | FC = Forward foreign currency exchange contracts. |
F-41 | ||
RALPH LAUREN CORPORATION
NOTES TO CONSOLIDATED FINANCIAL STATEMENTS (Continued)
17. | Stock-based Compensation |
Long-term Stock Incentive Plans
The Company's stock-based compensation awards are currently issued under the 2010 Incentive Plan, which was approved by its stockholders on August 5, 2010. However, any prior awards granted under the 1997 Incentive Plan remain subject to the terms of that plan. Any awards that expire, are forfeited, or are surrendered to the Company in satisfaction of taxes are available for issuance under the 2010 Incentive Plan. On September 1, 2016, the Company registered with the Securities and Exchange Commission an additional 0.9 million shares of its Class A common stock for issuance pursuant to the 2010 Incentive Plan. As of March 31, 2018, 3.1 million shares remained available for future issuance under the Company's incentive plans.
Stock-based compensation awards that may be made under the 2010 Incentive Plan include, but are not limited to, (i) stock options, (ii) restricted stock, and (iii) RSUs. Beginning in Fiscal 2016, annual grants consisted entirely of RSUs, as the Company elected to issue service-based RSUs in lieu of stock options. Additionally, new vesting provisions for certain awards granted to retirement-eligible employees were introduced. Specifically, beginning in Fiscal 2016, for certain service-based and performance-based RSUs granted to retirement-eligible employees, or employees who become retirement-eligible prior to the end of the awards' respective stated vesting periods, vesting continues post-retirement for all or a portion of the remaining unvested RSUs.
Impact on Results
A summary of stock-based compensation expense and the related income tax benefits recognized is as follows:
Fiscal Years Ended | ||||||||||||
March 31, 2018 | April 1, 2017 | April 2, 2016 | ||||||||||
(millions) | ||||||||||||
Compensation expense(a) | $ | 74.5 | $ | 63.6 | $ | 97.0 | ||||||
Income tax benefit | (25.3 | ) | (22.6 | ) | (36.8 | ) | ||||||
(a) | Fiscal 2018, Fiscal 2017, and Fiscal 2016 includes $2.8 million, $4.3 million, and $8.9 million, respectively, of accelerated stock-based compensation expense recorded within restructuring and other charges in the consolidated statements of operations (see Note 9). All other stock-based compensation expense was recorded within SG&A expenses. |
The Company issues its annual grants of stock-based compensation awards in the first half of each fiscal year. Due to the timing of the annual grants and other factors, including the timing and magnitude of forfeiture and performance goal achievement adjustments, as well as changes to the size and composition of the eligible employee population, stock-based compensation expense recognized during any given fiscal period is not indicative of the level of compensation expense expected to be incurred in future periods.
Stock Options
Stock options are granted to employees and non-employee directors with exercise prices equal to the fair market value of the Company's Class A common stock on the date of grant. Generally, options become exercisable ratably (graded-vesting schedule) over a three-year vesting period, subject to the employee's continuing employment. Stock options generally expire seven years from the date of grant. No stock options were granted during any of the fiscal years presented.
F-42 | ||
RALPH LAUREN CORPORATION
NOTES TO CONSOLIDATED FINANCIAL STATEMENTS (Continued)
A summary of stock option activity during Fiscal 2018 is as follows:
Number of Shares | Weighted-Average Exercise Price | Weighted-Average Remaining Contractual Term | Aggregate Intrinsic Value(a) | ||||||||||
(thousands) | (years) | (millions) | |||||||||||
Options outstanding at April 1, 2017 | 1,720 | $ | 146.35 | 2.6 | $ | 1.0 | |||||||
Granted | — | N/A | |||||||||||
Exercised | — | N/A | |||||||||||
Cancelled/Forfeited | (569 | ) | 122.91 | ||||||||||
Options outstanding at March 31, 2018 | 1,151 | $ | 157.86 | 2.1 | $ | — | |||||||
Options vested at March 31, 2018(b) | 1,151 | $ | 157.86 | 2.1 | $ | — | |||||||
Options exercisable at March 31, 2018 | 1,151 | $ | 157.86 | 2.1 | $ | — | |||||||
(a) | Aggregate intrinsic value is the amount by which the market price of the Company's Class A common stock at the end of the period exceeds the exercise price of the stock option, multiplied by the number of options. |
(b) | There were no nonvested stock options as of March 31, 2018. Accordingly, there was no related unrecognized compensation expense as of March 31, 2018. |
Additional information pertaining to the Company's stock option plans is as follows:
Fiscal Years Ended | ||||||||||||
March 31, 2018 | April 1, 2017 | April 2, 2016 | ||||||||||
(millions) | ||||||||||||
Aggregate intrinsic value of stock options exercised(a) | $ | — | $ | 3.0 | $ | 43.8 | ||||||
Cash received from the exercise of stock options | 0.1 | 5.0 | 33.2 | |||||||||
Tax benefits realized on exercise of stock options | — | 1.0 | 16.8 | |||||||||
(a) | Aggregate intrinsic value is the amount by which the market price of the Company's Class A common stock exceeded the stock option's exercise price when exercised, multiplied by the number of options. |
Restricted Stock Awards and Service-based RSUs
Restricted shares granted to non-employee directors vest ratably over a three-year period, subject to the director's continued service to the Company. The fair values of restricted stock awards are based on the fair value of the Company's Class A common stock on the date of grant. Holders of restricted shares are entitled to receive cash dividends in connection with the payments of dividends on the Company's Class A common stock.
Service-based RSUs granted to certain of the Company's senior executives and other employees generally vest over a three-year period, subject to the employee's continuing employment (except for awards granted to retirement-eligible employees, or employees who become retirement-eligible prior to the end of the awards' respective stated vesting periods, as previously discussed). The fair values of service-based RSUs are based on the fair value of the Company's Class A common stock on the date of grant, adjusted to reflect the absence of dividends for any awards not entitled to accrue dividend equivalents while outstanding.
F-43 | ||
RALPH LAUREN CORPORATION
NOTES TO CONSOLIDATED FINANCIAL STATEMENTS (Continued)
A summary of restricted stock and service-based RSU activity during Fiscal 2018 is as follows:
Restricted Stock | Service- based RSUs | |||||||||||||
Number of Shares | Weighted-Average Grant Date Fair Value | Number of Shares | Weighted-Average Grant Date Fair Value | |||||||||||
(thousands) | (thousands) | |||||||||||||
Nonvested at April 1, 2017 | 19 | $ | 92.11 | 922 | $ | 94.31 | ||||||||
Granted | — | N/A | 701 | 73.59 | ||||||||||
Vested | — | N/A | (366 | ) | 98.65 | |||||||||
Forfeited | — | N/A | (185 | ) | 83.64 | |||||||||
Nonvested at March 31, 2018 | 19 | $ | 92.11 | 1,072 | $ | 81.27 | ||||||||
Restricted Stock | Service- based RSUs | |||||||
Total unrecognized compensation expense at March 31, 2018 (millions) | $ | 0.4 | $ | 26.8 | ||||
Weighted-average period expected to be recognized over (years) | 1.5 | 1.6 | ||||||
Additional information pertaining to restricted stock and service-based RSU activity is as follows:
Fiscal Years Ended | ||||||||||||
March 31, 2018 | April 1, 2017 | April 2, 2016 | ||||||||||
Restricted Stock: | ||||||||||||
Weighted-average grant date fair value of awards granted | N/A | $ | 81.78 | $ | 111.94 | |||||||
Total fair value of awards vested (millions) | N/A | $ | 0.5 | $ | 0.7 | |||||||
Service-based RSUs: | ||||||||||||
Weighted-average grant date fair value of awards granted | $ | 73.59 | $ | 82.89 | $ | 125.19 | ||||||
Total fair value of awards vested (millions) | $ | 30.0 | $ | 13.8 | $ | 2.1 | ||||||
Performance-based RSUs
The Company grants performance-based RSUs to its senior executives and other key executives. Performance-based RSUs generally vest (i) upon the completion of a three-year period of time (cliff vesting), subject to the employee's continuing employment (except for awards granted to retirement-eligible employees, or employees who become retirement-eligible prior to the end of the awards' respective stated vesting periods, as previously discussed) and the Company's achievement of certain performance goals established at the beginning of the three-year performance period or (ii) ratably, over a three-year period of time (graded vesting), subject to the employee's continuing employment during the applicable vesting period (except for awards granted to retirement-eligible employees, or employees who become retirement-eligible prior to the end of the awards' respective stated vesting periods, as previously discussed) and the achievement by the Company of certain performance goals in the initial year of the three-year vesting period. For performance-based RSUs subject to cliff vesting, the number of shares that may be earned ranges between 0% (if the specified threshold performance level is not attained) and 150% (if performance meets or exceeds the maximum achievement level) of the awards originally granted. If actual performance exceeds the pre-established threshold, the number of shares earned is calculated based on the relative performance between specified levels of achievement.
Cliff vesting performance-based RSU awards granted by the Company, in addition to being subject to continuing employment requirements and the Company's performance goals noted above, may also be subject to a market condition in the form of a total shareholder return ("TSR") modifier. The actual number of shares that vest at the end of the respective three-year period is determined based on the Company's achievement of the three-year performance goals described above, as well as its TSR relative to the S&P 500 over the related three-year performance period. At the end of the three-year performance period, if the performance condition is achieved at or above the pre-established threshold, the number of shares earned is further adjusted by a TSR modifier payout percentage, which ranges between 75% and 125%, based on the Company's TSR performance relative to that of the S&P 500 index
F-44 | ||
RALPH LAUREN CORPORATION
NOTES TO CONSOLIDATED FINANCIAL STATEMENTS (Continued)
over the respective three-year period. Depending on the total level of achievement, the actual number of shares that vest for performance-based RSU awards with a TSR modifier may range from 0% to 187.5% of the awards originally granted.
The fair value of the Company's performance-based RSUs that are not subject to a TSR modifier is based on the fair value of the Company's Class A common stock on the date of grant, adjusted to reflect the absence of dividends for those securities that are not entitled to dividend equivalents. The fair value of the Company's performance-based RSUs with a TSR modifier is determined on the date of grant using a Monte Carlo simulation valuation model. This pricing model uses multiple simulations to evaluate the probability of the Company achieving various stock price levels to determine its expected TSR performance ranking. No such performance-based RSUs with a TSR modifier were granted during any of the fiscal years presented.
A summary of performance-based RSUs without TSR Modifier and performance-based RSUs with TSR Modifier activity during Fiscal 2018 is as follows:
Performance-based RSUs — without TSR Modifier | Performance-based RSUs — with TSR Modifier | |||||||||||||
Number of Shares | Weighted-Average Grant Date Fair Value | Number of Shares | Weighted-Average Grant Date Fair Value | |||||||||||
(thousands) | (thousands) | |||||||||||||
Nonvested at April 1, 2017 | 788 | $ | 109.87 | 61 | $ | 170.03 | ||||||||
Granted | 585 | 69.40 | — | N/A | ||||||||||
Change due to performance/market condition achievement | (12 | ) | 158.76 | (21 | ) | 170.03 | ||||||||
Vested | (149 | ) | 142.08 | (40 | ) | 170.03 | ||||||||
Forfeited | (55 | ) | 90.90 | — | N/A | |||||||||
Nonvested at March 31, 2018 | 1,157 | $ | 85.73 | — | N/A | |||||||||
Performance-based RSUs — without TSR Modifier | Performance-based RSUs — with TSR Modifier | |||||||
Total unrecognized compensation expense at March 31, 2018 (millions) | $ | 39.6 | $ | — | ||||
Weighted-average period expected to be recognized over (years) | 1.8 | N/A | ||||||
Additional information pertaining to performance-based RSUs without TSR Modifier and performance-based RSUs with TSR Modifier activity is as follows:
Fiscal Years Ended | ||||||||||||
March 31, 2018 | April 1, 2017 | April 2, 2016 | ||||||||||
Performance-based RSUs — without TSR Modifier: | ||||||||||||
Weighted-average grant date fair value of awards granted | $ | 69.40 | $ | 86.11 | $ | 126.48 | ||||||
Total fair value of awards vested (millions) | $ | 10.3 | $ | 19.7 | $ | 38.3 | ||||||
Performance-based RSUs — with TSR Modifier: | ||||||||||||
Weighted-average grant date fair value of awards granted | N/A | N/A | N/A | |||||||||
Total fair value of awards vested (millions) | $ | 2.6 | $ | 4.7 | $ | 6.6 | ||||||
F-45 | ||
RALPH LAUREN CORPORATION
NOTES TO CONSOLIDATED FINANCIAL STATEMENTS (Continued)
18. | Employee Benefit Plans |
Defined Contribution Plans
The Company sponsors defined contribution benefit plans covering substantially all eligible employees in the U.S. and Puerto Rico who are not covered by a collective bargaining agreement. The plans include a savings plan feature under Section 401(k) of the Internal Revenue Code. The Company makes matching contributions to the plans equal to 50% of the first 6% of salary contributed by an eligible employee. Additionally, the Company makes a supplemental matching contribution for plan years in which the Company achieves a "stretch" or a "maximum" performance target based on certain goals established at the beginning of each fiscal year, increasing the matching contribution to 75% or 100%, respectively, of the first 6% of salary contributed by eligible employees, not to exceed the maximum contribution permitted by the plan.
Under the terms of the plans, a participant becomes 100% vested in the Company's matching contributions after five years of credited service. Contributions made by the Company under these plans were $10.6 million, $10.1 million, and $10.5 million in Fiscal 2018, Fiscal 2017, and Fiscal 2016, respectively.
International Defined Benefit Plans
The Company sponsors certain single-employer defined benefit plans and cash balance plans at international locations which are not considered to be material individually or in the aggregate to the Company's financial statements. Pension benefits under these plans are based on formulas that reflect the employees' years of service and compensation levels during their employment period. The aggregate funded status of the single-employer defined benefit plans reflected net liabilities of $1.1 million and $3.0 million as of March 31, 2018 and April 1, 2017, respectively, and were primarily recorded within other non-current liabilities in the Company's consolidated balance sheets. These single-employer defined benefit plans had aggregate projected benefit obligations of $43.4 million and aggregate fair values of plan assets of $42.3 million as of March 31, 2018, compared to aggregate projected benefit obligations of $55.6 million and aggregate fair values of plan assets of $52.6 million as of April 1, 2017. The asset portfolio of the single-employer defined benefit plans primarily consists of fixed income securities, which have been measured at fair value largely using Level 2 inputs, as described in Note 12. Net pension expense for these plans was $6.6 million, $9.2 million, and $5.8 million in Fiscal 2018, Fiscal 2017, and Fiscal 2016, respectively. The service cost component of $4.6 million, $6.7 million, and $4.9 million in Fiscal 2018, Fiscal 2017, and Fiscal 2016, respectively, was recorded within SG&A expenses in the Company's consolidated statements of operations. All other components of net pension expense during the fiscal years presented were recorded within other expense, net, in the Company's consolidated statement of operations.
Union Pension Plan
The Company participates in a multi-employer pension plan and is required to make contributions to the Workers United union (which was previously known as UNITE HERE) (the "Union") for dues based on wages paid to union employees. A portion of these dues is allocated by the Union to a retirement fund which provides defined benefits to substantially all unionized workers. The Company does not participate in the management of the plan and has not been furnished with information with respect to the type of benefits provided, vested and non-vested benefits, or assets.
Under the Employee Retirement Income Security Act of 1974, as amended, an employer, upon withdrawal from or termination of a multi-employer plan, is required to continue funding its proportionate share of the plan's unfunded vested benefits. Such liability was assumed in conjunction with the acquisition of certain assets from a non-affiliated licensee. The Company has no current intention of withdrawing from the plan.
Other Compensation Plans
The Company had a non-qualified supplemental retirement plan for certain highly compensated employees whose benefits under the 401(k) profit sharing retirement savings plans were expected to be constrained by the operation of Internal Revenue Code limitations. These supplemental benefits vested over time and the related compensation expense was recognized over the vesting period. Effective August 2008, the Company amended this plan, resulting in a suspension of the annual contributions for substantially all plan participants. Further, affected participants were provided with a one-time election to either withdraw all benefits vested in the plan in a lump sum amount or remain in the plan and receive future distributions of benefits. As of March 31, 2018 and April 1, 2017, amounts accrued under this plan totaled $7.0 million and $7.8 million, respectively, and were classified within other non-current liabilities in the consolidated balance sheets. Total compensation expense recognized related to these benefits was not material in any of the three fiscal years presented.
F-46 | ||
RALPH LAUREN CORPORATION
NOTES TO CONSOLIDATED FINANCIAL STATEMENTS (Continued)
19. | Segment Information |
The Company has three reportable segments based on its business activities and organization:
• | North America — The North America segment primarily consists of sales of Ralph Lauren branded apparel, accessories, home furnishings, and related products made through the Company's wholesale and retail businesses in the U.S. and Canada, excluding Club Monaco. In North America, the Company's wholesale business is comprised primarily of sales to department stores, and to a lesser extent, specialty stores. The Company's retail business in North America is comprised of its Ralph Lauren stores, its factory stores, and its digital commerce site, www.RalphLauren.com. |
• | Europe — The Europe segment primarily consists of sales of Ralph Lauren branded apparel, accessories, home furnishings, and related products made through the Company's wholesale and retail businesses in Europe and the Middle East, excluding Club Monaco. In Europe, the Company's wholesale business is comprised of a varying mix of sales to both department stores and specialty stores, depending on the country. The Company's retail business in Europe is comprised of its Ralph Lauren stores, its factory stores, its concession-based shop-within-shops, and its various digital commerce sites. |
• | Asia — The Asia segment primarily consists of sales of Ralph Lauren branded apparel, accessories, home furnishings, and related products made through the Company's wholesale and retail businesses in Asia, Australia, and New Zealand. The Company's retail business in Asia is comprised of its Ralph Lauren stores, its factory stores, and its concession-based shop-within-shops. In addition, the Company sells its products online through various third-party digital partner commerce sites. In Asia, the Company's wholesale business is comprised primarily of sales to department stores, with related products distributed through shop-within-shops. |
No operating segments were aggregated to form the Company's reportable segments. In addition to these reportable segments, the Company also has other non-reportable segments, which primarily consist of (i) sales of Club Monaco branded products made through its retail businesses in the U.S., Canada, and Europe, and its licensing alliances in Europe and Asia, (ii) sales of Ralph Lauren branded products made through its wholesale business in Latin America, and (iii) royalty revenues earned through its global licensing alliances, excluding Club Monaco.
The Company's segment reporting structure is consistent with how it establishes its overall business strategy, allocates resources, and assesses performance of its business. The accounting policies of the Company's segments are consistent with those described in Notes 2 and 3. Sales and transfers between segments are generally recorded at cost and treated as transfers of inventory. All intercompany revenues are eliminated in consolidation and are not reviewed when evaluating segment performance. Each segment's performance is evaluated based upon net revenues and operating income before restructuring-related charges, impairment of assets, and certain other one-time items, if any. Certain corporate overhead expenses related to global functions, most notably the Company's executive office, information technology, finance and accounting, human resources, and legal departments, largely remain at corporate. Additionally, other costs that cannot be allocated to the segments based on specific usage are also maintained at corporate, including corporate advertising and marketing expenses, depreciation and amortization of corporate assets, and other general and administrative expenses resulting from corporate-level activities and projects. Asset information by segment is not utilized for purposes of assessing performance or allocating resources, and therefore such information has not been presented.
Net revenues for each of the Company's segments are as follows:
Fiscal Years Ended | ||||||||||||
March 31, 2018 | April 1, 2017 | April 2, 2016 | ||||||||||
(millions) | ||||||||||||
Net revenues: | ||||||||||||
North America | $ | 3,231.0 | $ | 3,783.0 | $ | 4,479.6 | ||||||
Europe | 1,585.0 | 1,543.4 | 1,561.7 | |||||||||
Asia | 933.7 | 882.5 | 892.4 | |||||||||
Other non-reportable segments | 432.6 | 443.9 | 471.5 | |||||||||
Total net revenues(a) | $ | 6,182.3 | $ | 6,652.8 | $ | 7,405.2 | ||||||
F-47 | ||
RALPH LAUREN CORPORATION
NOTES TO CONSOLIDATED FINANCIAL STATEMENTS (Continued)
(a) | The Company's sales to its largest wholesale customer, Macy's, accounted for approximately 8%, 10%, and 11%, of its total net revenues in Fiscal 2018, Fiscal 2017, and Fiscal 2016, respectively. Substantially all of the Company's sales to Macy's related to its North America segment. |
Operating income (loss) for each of the Company's segments is as follows:
Fiscal Years Ended | ||||||||||||
March 31, 2018 | April 1, 2017 | April 2, 2016 | ||||||||||
(millions) | ||||||||||||
Operating income (loss)(a): | ||||||||||||
North America | $ | 677.6 | $ | 666.8 | $ | 941.3 | ||||||
Europe | 356.7 | 305.2 | 281.0 | |||||||||
Asia | 137.2 | (86.3 | ) | (1.2 | ) | |||||||
Other non-reportable segments | 107.5 | 81.0 | 119.3 | |||||||||
1,279.0 | 966.7 | 1,340.4 | ||||||||||
Unallocated corporate expenses | (672.8 | ) | (740.4 | ) | (615.0 | ) | ||||||
Unallocated restructuring and other charges(b) | (108.0 | ) | (318.6 | ) | (142.6 | ) | ||||||
Total operating income (loss) | $ | 498.2 | $ | (92.3 | ) | $ | 582.8 | |||||
(a) | Segment operating income (loss) and unallocated corporate expenses during the fiscal years presented included certain restructuring-related inventory charges (see Note 9) and asset impairment charges (see Note 8), which are detailed below: |
Fiscal Years Ended | ||||||||||||
March 31, 2018 | April 1, 2017 | April 2, 2016 | ||||||||||
(millions) | ||||||||||||
Restructuring-related inventory charges: | ||||||||||||
North America | $ | (2.8 | ) | $ | (33.9 | ) | $ | (7.2 | ) | |||
Europe | (1.5 | ) | (20.1 | ) | (2.4 | ) | ||||||
Asia | (2.9 | ) | (137.6 | ) | (10.8 | ) | ||||||
Other non-reportable segments | (0.4 | ) | (6.3 | ) | — | |||||||
Total restructuring-related inventory charges | $ | (7.6 | ) | $ | (197.9 | ) | $ | (20.4 | ) | |||
Fiscal Years Ended | ||||||||||||
March 31, 2018 | April 1, 2017 | April 2, 2016 | ||||||||||
(millions) | ||||||||||||
Asset impairment charges: | ||||||||||||
North America | $ | (4.7 | ) | $ | (62.5 | ) | $ | (20.5 | ) | |||
Europe | (1.2 | ) | (3.1 | ) | (8.2 | ) | ||||||
Asia | (1.0 | ) | (42.0 | ) | (18.2 | ) | ||||||
Other non-reportable segments | (22.4 | ) | (29.2 | ) | (1.9 | ) | ||||||
Unallocated corporate expenses | (20.7 | ) | (117.0 | ) | — | |||||||
Total asset impairment charges | $ | (50.0 | ) | $ | (253.8 | ) | $ | (48.8 | ) | |||
F-48 | ||
RALPH LAUREN CORPORATION
NOTES TO CONSOLIDATED FINANCIAL STATEMENTS (Continued)
(b) | The fiscal years presented included certain unallocated restructuring and other charges (see Note 9), which are detailed below: |
Fiscal Years Ended | ||||||||||||
March 31, 2018 | April 1, 2017 | April 2, 2016 | ||||||||||
(millions) | ||||||||||||
Unallocated restructuring and other charges: | ||||||||||||
North America-related | $ | (15.5 | ) | $ | (34.7 | ) | $ | (26.1 | ) | |||
Europe-related | (4.5 | ) | (27.7 | ) | (5.6 | ) | ||||||
Asia-related | 2.5 | (68.3 | ) | (3.2 | ) | |||||||
Other non-reportable segment-related | (8.5 | ) | (7.7 | ) | (5.6 | ) | ||||||
Corporate operations-related | (53.2 | ) | (155.6 | ) | (54.4 | ) | ||||||
Unallocated restructuring charges | (79.2 | ) | (294.0 | ) | (94.9 | ) | ||||||
Other charges (see Note 9) | (28.8 | ) | (24.6 | ) | (47.7 | ) | ||||||
Total unallocated restructuring and other charges | $ | (108.0 | ) | $ | (318.6 | ) | $ | (142.6 | ) | |||
The following tables summarize depreciation and amortization expense and capital expenditures for each of the Company's segments:
Fiscal Years Ended | ||||||||||||
March 31, 2018 | April 1, 2017 | April 2, 2016 | ||||||||||
(millions) | ||||||||||||
Depreciation and amortization: | ||||||||||||
North America | $ | 82.5 | $ | 110.0 | $ | 112.4 | ||||||
Europe | 34.8 | 31.8 | 35.2 | |||||||||
Asia | 50.3 | 47.8 | 58.2 | |||||||||
Other non-reportable segments | 10.7 | 14.5 | 13.7 | |||||||||
Unallocated corporate | 102.8 | 103.4 | 89.9 | |||||||||
Unallocated restructuring and other charges (see Note 9) | 14.1 | — | — | |||||||||
Total depreciation and amortization | $ | 295.2 | $ | 307.5 | $ | 309.4 | ||||||
Fiscal Years Ended | ||||||||||||
March 31, 2018 | April 1, 2017 | April 2, 2016 | ||||||||||
(millions) | ||||||||||||
Capital expenditures: | ||||||||||||
North America | $ | 41.9 | $ | 62.8 | $ | 84.9 | ||||||
Europe | 28.5 | 43.6 | 48.2 | |||||||||
Asia | 40.7 | 30.2 | 49.1 | |||||||||
Other non-reportable segments | 5.3 | 20.1 | 38.0 | |||||||||
Unallocated corporate | 45.2 | 127.3 | 197.5 | |||||||||
Total capital expenditures | $ | 161.6 | $ | 284.0 | $ | 417.7 | ||||||
F-49 | ||
RALPH LAUREN CORPORATION
NOTES TO CONSOLIDATED FINANCIAL STATEMENTS (Continued)
Net revenues and long-lived assets by geographic location of the reporting subsidiary are as follows:
Fiscal Years Ended | ||||||||||||
March 31, 2018 | April 1, 2017 | April 2, 2016 | ||||||||||
(millions) | ||||||||||||
Net revenues(a): | ||||||||||||
The Americas(b) | $ | 3,652.1 | $ | 4,214.7 | $ | 4,938.2 | ||||||
Europe(c) | 1,595.2 | 1,554.1 | 1,572.7 | |||||||||
Asia(d) | 935.0 | 884.0 | 894.3 | |||||||||
Total net revenues | $ | 6,182.3 | $ | 6,652.8 | $ | 7,405.2 | ||||||
March 31, 2018 | April 1, 2017 | |||||||
(millions) | ||||||||
Long-lived assets(a): | ||||||||
The Americas(b) | $ | 915.4 | $ | 1,061.7 | ||||
Europe(c) | 154.8 | 141.8 | ||||||
Asia(d) | 116.1 | 112.5 | ||||||
Total long-lived assets | $ | 1,186.3 | $ | 1,316.0 | ||||
(a) | Net revenues and long-lived assets for certain of the Company's licensed operations are included within the geographic location of the reporting subsidiary which holds the respective license. |
(b) | Includes the U.S., Canada, and Latin America. Net revenues earned in the U.S. were $3.427 billion, $3.990 billion, and $4.688 billion in Fiscal 2018, Fiscal 2017, and Fiscal 2016, respectively. Long-lived assets located in the U.S. were $889.7 million and $1.033 billion as of March 31, 2018 and April 1, 2017, respectively. |
(c) | Includes the Middle East. |
(d) | Includes Australia and New Zealand. |
20. | Additional Financial Information |
Reconciliation of Cash, Cash Equivalents, and Restricted Cash
A reconciliation of cash, cash equivalents, and restricted cash as of March 31, 2018 and April 1, 2017 from the consolidated balance sheets to the consolidated statements of cash flows is as follows:
March 31, 2018 | April 1, 2017 | |||||||
(millions) | ||||||||
Cash and cash equivalents | $ | 1,304.6 | $ | 668.3 | ||||
Restricted cash included within prepaid expenses and other current assets | 15.5 | 9.8 | ||||||
Restricted cash included within other non-current assets | 35.4 | 33.7 | ||||||
Total cash, cash equivalents, and restricted cash | $ | 1,355.5 | $ | 711.8 | ||||
Amounts included in restricted cash relate to cash placed in escrow with certain banks as collateral, primarily to secure guarantees in connection with certain international tax matters.
F-50 | ||
RALPH LAUREN CORPORATION
NOTES TO CONSOLIDATED FINANCIAL STATEMENTS (Continued)
Cash Interest and Taxes
Cash paid for interest and income taxes is as follows:
Fiscal Years Ended | ||||||||||||
March 31, 2018 | April 1, 2017 | April 2, 2016 | ||||||||||
(millions) | ||||||||||||
Cash paid for interest | $ | 11.7 | $ | 13.0 | $ | 15.0 | ||||||
Cash paid for income taxes | 54.0 | 81.7 | 171.7 | |||||||||
Non-cash Transactions
Non-cash investing activities included capital expenditures incurred but not yet paid of $37.0 million, $45.7 million, and $65.2 million as of the end of Fiscal 2018, Fiscal 2017, and Fiscal 2016, respectively.
Additionally, during Fiscal 2018, Fiscal 2017, and Fiscal 2016, the Company recorded capital lease assets and corresponding capital lease obligations of $3.3 million, $10.9 million, and $48.7 million, respectively, within its consolidated balance sheet.
There were no other significant non-cash investing or financing activities for any of the fiscal years presented.
F-51 | ||
MANAGEMENT'S REPORT ON RESPONSIBILITY FOR FINANCIAL STATEMENTS
The management of Ralph Lauren Corporation is responsible for the preparation, objectivity, and integrity of the consolidated financial statements and other information contained in this Annual Report. The consolidated financial statements have been prepared in accordance with accounting principles generally accepted in the United States and include some amounts that are based on management's informed judgments and best estimates.
These consolidated financial statements have been audited by Ernst & Young LLP in Fiscal 2018, Fiscal 2017, and Fiscal 2016, which is an independent registered public accounting firm. They conducted their audits in accordance with the standards of the Public Company Accounting Oversight Board (United States) and have expressed herein their unqualified opinions on those financial statements.
The Audit Committee of the Board of Directors, which oversees all of the Company's financial reporting process on behalf of the Board of Directors, consists solely of independent directors, meets with the independent registered accountants, internal auditors, and management periodically to review their respective activities and the discharge of their respective responsibilities. Both the independent registered public accountants and the internal auditors have unrestricted access to the Audit Committee, with or without management, to discuss the scope and results of their audits and any recommendations regarding the system of internal controls.
May 23, 2018
/s/ PATRICE LOUVET | /s/ JANE HAMILTON NIELSEN | ||
Patrice Louvet | Jane Hamilton Nielsen | ||
President and Chief Executive Officer | Chief Financial Officer | ||
(Principal Executive Officer) | (Principal Financial and Accounting Officer) | ||
F-52 | ||
REPORT OF INDEPENDENT REGISTERED PUBLIC ACCOUNTING FIRM
The Board of Directors and Shareholders of Ralph Lauren Corporation
Opinion on the Financial Statements
We have audited the accompanying consolidated balance sheets of Ralph Lauren Corporation and subsidiaries (the "Company") as of March 31, 2018 and April 1, 2017, and the related consolidated statements of operations, comprehensive income (loss), equity, and cash flows for each of the three years in the period ended March 31, 2018, and the related notes (collectively referred to as the "consolidated financial statements"). In our opinion, the consolidated financial statements present fairly, in all material respects, the financial position of the Company at March 31, 2018 and April 1, 2017, and the results of its operations and its cash flows for each of the three years in the period ended March 31, 2018, in conformity with U.S. generally accepted accounting principles.
We also have audited, in accordance with the standards of the Public Company Accounting Oversight Board (United States) (PCAOB), the Company's internal control over financial reporting as of March 31, 2018, based on the criteria established in Internal Control-Integrated Framework issued by the Committee of Sponsoring Organizations of the Treadway Commission and our report dated May 23, 2018 expressed an unqualified opinion thereon.
Basis for Opinion
These financial statements are the responsibility of the Company's management. Our responsibility is to express an opinion on the Company's financial statements based on our audits. We are a public accounting firm registered with the PCAOB and are required to be independent with respect to the Company in accordance with the U.S. federal securities laws and the applicable rules and regulations of the Securities and Exchange Commission and the PCAOB.
We conducted our audits in accordance with the standards of the PCAOB. Those standards require that we plan and perform the audit to obtain reasonable assurance about whether the financial statements are free of material misstatement, whether due to error or fraud. Our audits included performing procedures to assess the risks of material misstatement of the financial statements, whether due to error or fraud, and performing procedures that respond to those risks. Such procedures included examining, on a test basis, evidence regarding the amounts and disclosures in the financial statements. Our audits also included evaluating the accounting principles used and significant estimates made by management, as well as evaluating the overall presentation of the financial statements. We believe that our audits provide a reasonable basis for our opinion.
/s/ Ernst & Young LLP
We have served as the Company's auditor since 2009.
New York, New York
May 23, 2018
F-53 | ||
REPORT OF INDEPENDENT REGISTERED PUBLIC ACCOUNTING FIRM
The Board of Directors and Shareholders of Ralph Lauren Corporation
Opinion on Internal Control over Financial Reporting
We have audited Ralph Lauren Corporation and subsidiaries internal control over financial reporting as of March 31, 2018, based on criteria established in Internal Control — Integrated Framework issued by the Committee of Sponsoring Organizations of the Treadway Commission (2013 framework) (the COSO criteria). In our opinion, Ralph Lauren Corporation and subsidiaries (the Company) maintained, in all material respects, effective internal control over financial reporting as of March 31, 2018, based on the COSO criteria.
We have also audited, in accordance with the standards of the Public Company Accounting Oversight Board (United States) (PCAOB), the consolidated balance sheets of the Company as of March 31, 2018 and April 1, 2017, and the related consolidated statements of operations, comprehensive income (loss), equity, and cash flows for each of the three years in the period ended March 31, 2018, and the related notes and our report dated May 23, 2018 expressed an unqualified opinion thereon.
Basis for Opinion
The Company's management is responsible for maintaining effective internal control over financial reporting and for its assessment of the effectiveness of internal control over financial reporting included in the accompanying Management's Report on Internal Control Over Financial Reporting. Our responsibility is to express an opinion on the Company's internal control over financial reporting based on our audit. We are a public accounting firm registered with the PCAOB and are required to be independent with respect to the Company in accordance with the U.S. federal securities laws and the applicable rules and regulations of the Securities and Exchange Commission and the PCAOB.
We conducted our audit in accordance with the standards of the PCAOB. Those standards require that we plan and perform the audit to obtain reasonable assurance about whether effective internal control over financial reporting was maintained in all material respects.
Our audit included obtaining an understanding of internal control over financial reporting, assessing the risk that a material weakness exists, testing and evaluating the design and operating effectiveness of internal control based on the assessed risk, and performing such other procedures as we considered necessary in the circumstances. We believe that our audit provides a reasonable basis for our opinion.
Definition and Limitations of Internal Control Over Financial Reporting
A company's internal control over financial reporting is a process designed to provide reasonable assurance regarding the reliability of financial reporting and the preparation of financial statements for external purposes in accordance with generally accepted accounting principles. A company's internal control over financial reporting includes those policies and procedures that (1) pertain to the maintenance of records that, in reasonable detail, accurately and fairly reflect the transactions and dispositions of the assets of the company; (2) provide reasonable assurance that transactions are recorded as necessary to permit preparation of financial statements in accordance with generally accepted accounting principles, and that receipts and expenditures of the company are being made only in accordance with authorizations of management and directors of the company; and (3) provide reasonable assurance regarding prevention or timely detection of unauthorized acquisition, use, or disposition of the company's assets that could have a material effect on the financial statements.
Because of its inherent limitations, internal control over financial reporting may not prevent or detect misstatements. Also, projections of any evaluation of effectiveness to future periods are subject to the risk that controls may become inadequate because of changes in conditions, or that the degree of compliance with the policies or procedures may deteriorate.
/s/ Ernst & Young LLP
New York, New York
May 23, 2018
F-54 | ||
RALPH LAUREN CORPORATION
SELECTED FINANCIAL INFORMATION
The following table sets forth selected historical financial information as of the dates and for the periods indicated.
The consolidated statement of operations data for each of the three fiscal years in the period ended March 31, 2018, as well as the consolidated balance sheet data as of March 31, 2018 and April 1, 2017 have been derived from, and should be read in conjunction with, the audited financial statements, notes, and other financial information presented elsewhere herein. The consolidated statements of operations data for the fiscal years ended March 28, 2015 and March 29, 2014 and the consolidated balance sheet data at April 2, 2016, March 28, 2015, and March 29, 2014 have been derived from audited financial statements not included herein. Capitalized terms are as defined and described in the consolidated financial statements or elsewhere herein. The historical results are not necessarily indicative of the results to be expected in any future period.
Fiscal Years Ended(a)(b) | ||||||||||||||||||||
March 31, 2018(c) | April 1, 2017 | April 2, 2016 | March 28, 2015 | March 29, 2014(d) | ||||||||||||||||
(millions, except per share data) | ||||||||||||||||||||
Statement of Operations Data: | ||||||||||||||||||||
Net revenues | $ | 6,182.3 | $ | 6,652.8 | $ | 7,405.2 | $ | 7,620.3 | $ | 7,449.8 | ||||||||||
Gross profit(e) | 3,751.7 | 3,651.1 | 4,186.7 | 4,377.9 | 4,310.1 | |||||||||||||||
Impairment of assets | (50.0 | ) | (253.8 | ) | (48.8 | ) | (6.9 | ) | (1.3 | ) | ||||||||||
Restructuring and other charges | (108.0 | ) | (318.6 | ) | (142.6 | ) | (10.1 | ) | (17.8 | ) | ||||||||||
Operating income (loss) | 498.2 | (92.3 | ) | 582.8 | 1,035.5 | 1,130.1 | ||||||||||||||
Interest expense, net | (5.9 | ) | (5.1 | ) | (14.7 | ) | (9.0 | ) | (14.7 | ) | ||||||||||
Net income (loss) | $ | 162.8 | $ | (99.3 | ) | $ | 396.4 | $ | 702.2 | $ | 775.5 | |||||||||
Net income (loss) per common share: | ||||||||||||||||||||
Basic | $ | 1.99 | $ | (1.20 | ) | $ | 4.65 | $ | 7.96 | $ | 8.55 | |||||||||
Diluted | $ | 1.97 | $ | (1.20 | ) | $ | 4.62 | $ | 7.88 | $ | 8.43 | |||||||||
Weighted average common shares outstanding: | ||||||||||||||||||||
Basic | 81.7 | 82.7 | 85.2 | 88.2 | 90.7 | |||||||||||||||
Diluted | 82.5 | 82.7 | 85.9 | 89.1 | 92.0 | |||||||||||||||
Dividends declared per common share | $ | 2.00 | $ | 2.00 | $ | 2.00 | $ | 1.85 | $ | 1.70 | ||||||||||
(a) | Fiscal 2016 consisted of 53 weeks. All other fiscal years presented consisted of 52 weeks. The inclusion of the 53rd week in Fiscal 2016 resulted in incremental net revenues of $72.2 million and net income of $8.3 million, or $0.10 per diluted share. |
(b) | Reflects the Company's adoption of ASU No. 2017-07, "Improving the Presentation of Net Periodic Pension Cost and Net Periodic Postretirement Benefit Cost" during Fiscal 2018 on a retrospective basis, which requires that certain components of net pension expense be presented outside of operating income (see Note 4 to the accompanying consolidated financial statements). |
(c) | Reflects TCJA enactment-related charges of $221.4 million recorded within the income tax provision (see Note 10 to the accompanying consolidated financial statements). |
(d) | Reflects the acquisition of the North American Chaps-branded men's sportswear business effective in April 2013, which resulted in the recognition of a $16.4 million gain on acquisition, as well as the acquisition of the Ralph Lauren-branded apparel and accessories business in Australia and New Zealand effective in July 2013. |
(e) | Fiscal 2018, Fiscal 2017, and Fiscal 2016 reflect non-cash inventory-related charges of $7.6 million, $197.9 million, and $20.4 million, respectively, recorded in connection with the Company's restructuring plans (see Note 9 to the accompanying consolidated financial statements). |
F-55 | ||
RALPH LAUREN CORPORATION
SELECTED FINANCIAL INFORMATION (Continued)
March 31, 2018 | April 1, 2017 | April 2, 2016 | March 28, 2015 | March 29, 2014 | ||||||||||||||||
(millions) | ||||||||||||||||||||
Balance Sheet Data: | ||||||||||||||||||||
Cash and cash equivalents | $ | 1,304.6 | $ | 668.3 | $ | 456.3 | $ | 499.7 | $ | 797.4 | ||||||||||
Investments | 785.6 | 706.1 | 816.0 | 652.2 | 490.1 | |||||||||||||||
Working capital(a) | 1,961.2 | 1,794.6 | 1,854.4 | 2,137.4 | 2,359.0 | |||||||||||||||
Total assets | 6,143.3 | 5,652.0 | 6,213.1 | 6,105.8 | 6,087.7 | |||||||||||||||
Total debt (including current maturities of debt) | 596.2 | 588.2 | 713.1 | 532.3 | 297.9 | |||||||||||||||
Other non-current obligations(b) | 361.2 | 250.9 | 265.7 | 237.5 | 255.0 | |||||||||||||||
Equity | 3,457.4 | 3,299.6 | 3,743.5 | 3,891.6 | 4,034.3 | |||||||||||||||
(a) | Working capital is calculated as total current assets less total current liabilities (including current maturities of debt). Working capital as of March 31, 2018, April 1, 2017, and April 2, 2016 reflect the Company's adoption of ASU No. 2015-17, "Balance Sheet Classification of Deferred Taxes," which requires all deferred tax assets and liabilities, together with any related valuation allowances, to be classified as non-current on the consolidated balance sheet (past guidance required deferred tax assets and liabilities to be broken out as current and non-current on the consolidated balance sheet). Prior periods were not retrospectively adjusted. |
(b) | Comprised of the Company's non-current capital lease and income tax payable obligations. |
F-56 | ||
RALPH LAUREN CORPORATION
QUARTERLY FINANCIAL INFORMATION (UNAUDITED)
The following table sets forth the quarterly financial information of the Company:
Quarterly Periods Ended(a)(b) | ||||||||||||||||
July 1, 2017 | September 30, 2017 | December 30, 2017(c) | March 31, 2018(c) | |||||||||||||
(millions, except per share data) | ||||||||||||||||
Net revenues | $ | 1,347.1 | $ | 1,664.2 | $ | 1,641.8 | $ | 1,529.2 | ||||||||
Gross profit | 851.2 | 995.8 | 996.2 | 908.5 | ||||||||||||
Net income (loss) | 59.5 | 143.8 | (81.8 | ) | 41.3 | |||||||||||
Net income (loss) per common share(d): | ||||||||||||||||
Basic | $ | 0.73 | $ | 1.76 | $ | (1.00 | ) | $ | 0.51 | |||||||
Diluted | $ | 0.72 | $ | 1.75 | $ | (1.00 | ) | $ | 0.50 | |||||||
Dividends declared per common share | $ | 0.50 | $ | 0.50 | $ | 0.50 | $ | 0.50 | ||||||||
Quarterly Periods Ended(a)(e) | ||||||||||||||||
July 2, 2016 | October 1, 2016 | December 31, 2016 | April 1, 2017 | |||||||||||||
(millions, except per share data) | ||||||||||||||||
Net revenues | $ | 1,552.2 | $ | 1,820.6 | $ | 1,714.6 | $ | 1,565.4 | ||||||||
Gross profit | 894.6 | 954.2 | 983.2 | 819.1 | ||||||||||||
Net income (loss) | (22.3 | ) | 45.7 | 81.3 | (204.0 | ) | ||||||||||
Net income (loss) per common share(d): | ||||||||||||||||
Basic | $ | (0.27 | ) | $ | 0.55 | $ | 0.98 | $ | (2.48 | ) | ||||||
Diluted | $ | (0.27 | ) | $ | 0.55 | $ | 0.98 | $ | (2.48 | ) | ||||||
Dividends declared per common share | $ | 0.50 | $ | 0.50 | $ | 0.50 | $ | 0.50 | ||||||||
(a) | All fiscal quarters presented consisted of 13 weeks. |
(b) | Net income (loss) and net income (loss) per common share for the three-month periods ended July 1, 2017, September 30, 2017, December 30, 2017, and March 31, 2018 were negatively impacted by pretax restructuring-related charges, impairment of assets, and certain other charges of $47.2 million, $30.4 million, $27.2 million, and $60.8 million, respectively (see Notes 8 and 9 to the accompanying consolidated financial statements). |
(c) | Net loss and net loss per common share for the three months ended December 30, 2017 reflected the negative impact of TCJA enactment-related charges of $231.3 million. During the three months ended March 31, 2018, net income and net income per common share were favorably impacted by TCJA measurement period adjustments of $9.9 million (see Note 10 to the accompanying consolidated financial statements). |
(d) | Per common share amounts for the quarters and full years have been calculated separately. Accordingly, quarterly amounts may not add to the annual amount because of differences in the average number of common shares outstanding during each period. |
(e) | Net income (loss) and net income (loss) per common share for the three-month periods ended July 2, 2016, October 1, 2016, December 31, 2016, and April 1, 2017 were negatively impacted by pretax restructuring-related charges, impairment of assets, and certain other charges of $159.1 million, $149.5 million, $91.4 million, and $370.3 million, respectively (see Notes 8 and 9 to the accompanying consolidated financial statements). |
F-57 | ||