Attached files
| file | filename |
|---|---|
| 8-K - FORM 8-K - Village Bank & Trust Financial Corp. | tv494839_8k.htm |
Exhibit 99.1

You're a Neighbor, Not a Number May 2018 Annual Shareholders Meeting

Agenda Results 2017 Accomplishments and 2018 Priorities Plan for Completing our Work of Becoming A Top Performer Questions? I II III IV

Cautionary Statement Regarding Forward - Looking Statements This presentation contains forward - looking statements within the meaning of the Private Securities Litigation Reform Act of 1995. These forward - looking statements include, but are not limited to, statements about ( i ) the Company’s plans, objectives, expectations and intentions and other statements contained in this presentation that are not historical facts; and (ii) other statements identified by words such as “expects” “anticipates,” “intends,” “plans,” “believes,” “seeks,” “estimates,” “targets,” “projects,” or words of similar meaning generally intended to identify forward - looking statements. These forward - looking statements are based on the current beliefs and expectations of the Company’s management and are inherently subject to significant business, economic and competitive uncertainties and contingencies, many of which are beyond management’s control. In addition, these forward - looking statements are subject to assumptions with respect to future business strategies and decisions that are subject to change. Actual results may differ materially from the anticipated results discussed or implied in these forward - looking statements because of numerous possible uncertainties. The following factors, among others, could cause actual results to differ materially from the anticipated results or other expectations expressed in the forward - looking statements: (1) adverse governmental or regulatory policies may be enacted; (2) the interest rate environment may compress margins and adversely affect net interest income; (3) results may be adversely affected by continued diversification of assets and adverse changes to credit quality; (4) competition from other financial services companies in the Company’s markets could adversely affect operations; (5) a change in the current economic environment could adversely affect credit quality and loan originations; and (6) social and political conditions such as war, political unrest and terrorism or natural disasters could have unpredictable negative effects on our businesses and the economy. Additional factors that could cause actual results to differ materially from those expressed in the forward - looking statements are discussed in the Company’s reports (such as our Annual Report on Form 10 - K, Quarterly Reports on Form 10 - Q and Current Reports on Form 8 - K) filed with the Securities and Exchange Commission and available on the SEC’s website at www.sec.gov.
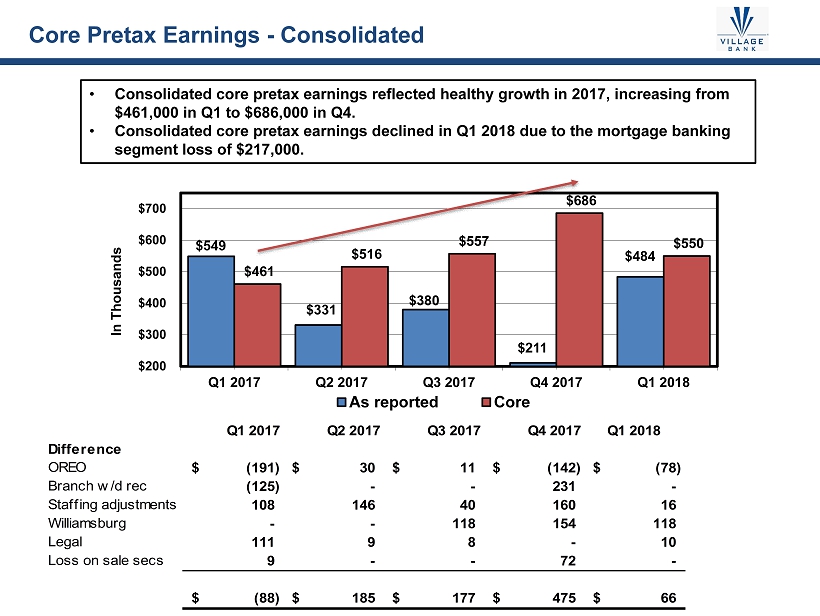
4 $549 $331 $380 $211 $484 $461 $516 $557 $686 $550 $200 $300 $400 $500 $600 $700 Q1 2017 Q2 2017 Q3 2017 Q4 2017 Q1 2018 In Thousands As reported Core Core Pretax Earnings - Consolidated • Consolidated core pretax earnings reflected healthy growth in 2017, increasing from $461,000 in Q1 to $686,000 in Q4. • Consolidated core pretax earnings declined in Q1 2018 due to the mortgage banking segment loss of $217,000. Q1 2017 Q2 2017 Q3 2017 Q4 2017 Q1 2018 Difference OREO (191)$ 30$ 11$ (142)$ (78)$ Branch w/d rec (125) - - 231 - Staffing adjustments 108 146 40 160 16 Williamsburg - - 118 154 118 Legal 111 9 8 - 10 Loss on sale secs 9 - - 72 - (88)$ 185$ 177$ 475$ 66$

5 $591 $194 $406 $236 $701 $396 $294 $480 $551 $751 $- $100 $200 $300 $400 $500 $600 $700 $800 $900 Q1 2017 Q2 2017 Q3 2017 Q4 2017 Q1 2018 In Thousands As reported Core Core Pretax Earnings – Commercial Banking Segment • Commercial Banking Segment core pretax earnings was the driver for the healthy growth in consolidated pretax earnings in 2017, increasing from $396,000 in Q1 2017 to $551,000 in Q1 2018. • The growth continued in Q1 2018, increasing to $751,000. Q1 2017 Q2 2017 Q3 2017 Q4 2017 Q1 2018 Difference OREO (191)$ 30$ 11$ (142)$ (78)$ Branch w/d rec (125) - - 231 - Staffing adjusts. 1 61 (63) - - Williamsburg - - 118 154 118 Legal 111 9 8 - 10 Loss on sale secs 9 - - 72 - (195)$ 100$ 74$ 315$ 50$

6 $(42) $137 $(27) $(25) $(217) $65 $222 $77 $135 $(201) $(300) $(200) $(100) $- $100 $200 $300 Q1 2017 Q2 2017 Q3 2017 Q4 2017 Q1 2018 In Thousands As reported Core Core Pretax Earnings – Mortgage Banking Segment • Historically, the mortgage banking segment has been a significant contributor to pretax earnings, with pretax earnings of $1.0 million in 2015 and $1.2 million in 2016. • In February 2017, the long time President retired which resulted in disruption to its operations. • A new President was named in late 2017 which we believe will allow the mortgage banking segment to regain its earnings momentum. Q1 2017 Q2 2017 Q3 2017 Q4 2017 Q1 2018 Difference Staffing adjusts. 107$ 85$ 104$ 160$ 16$
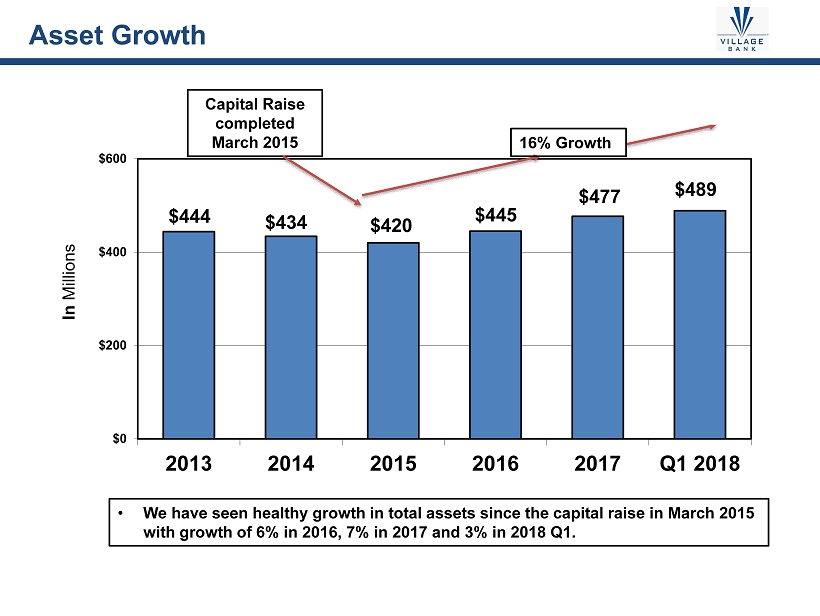
7 $444 $434 $420 $445 $477 $489 $0 $200 $400 $600 2013 2014 2015 2016 2017 Q1 2018 In Millions Asset Growth 1 6% Growth • We have seen healthy growth in total assets since the capital raise in March 2015 with growth of 6% in 2016, 7% in 2017 and 3% in 2018 Q1. Capital Raise completed March 2015

8 $105,411 $114,026 $115,921 $112,481 $121,510 $131,322 $67,078 $64,862 $65,963 $68,223 $80,501 $86,894 $81,250 $77,841 $77,500 $81,708 $88,228 $90,358 $33,862 $35,840 $34,950 $35,048 $30,817 $33,284 $47,398 $45,364 $43,422 $47,643 $45,805 $43,896 $2,101 $1,971 $1,985 $1,899 $1,848 $1,973 $0 $50,000 $100,000 $150,000 $200,000 $250,000 $300,000 $350,000 $400,000 $450,000 $500,000 Q4 2016 2017 Q1 2017 Q2 2017 Q3 2017 Q4 Q1 2018 In Millions C&I + Owner Occ Nonowner Occ Cons/Residential AD&C Student Other $339,741 $347,002 Loan Growth • We have seen healthy growth in loans overall, with growth of 9 % in 2017, and 5% in 2018 Q1. • Our core loan growth, which excludes purchased loans, was 12% in 2017 and 7% for the first quarter of 2018. We are allowing our purchased loans to pay out. • Commercial and Industrial plus Owner Occupied Real Estate loans continue to be the largest segment of our loan portfolio at 34% at the end of Q1 2018. $339,904 $368,709 $387,727 1 5 % Growth $337,100

9 $92,574 $95,472 $100,488 $103,396 $104,138 $114,088 $44,390 $44,040 $48,916 $48,673 $48,042 $50,145 $71,290 $73,142 $81,673 $81,423 $82,523 $81,722 $26,598 $27,601 $27,653 $27,601 $27,596 $29,043 $13,372 $12,803 $14,290 $15,348 $21,592 $21,743 $135,053 $135,550 $132,371 $130,963 $127,733 $124,757 $0 $50,000 $100,000 $150,000 $200,000 $250,000 $300,000 $350,000 $400,000 $450,000 $500,000 2016 Q4 2017 Q1 2017 Q2 2017 Q3 2017 Q4 Q1 2018 In Millions Nonint DDA Int bearing DDA MMA Savings Time > $250,000 Other time $405,391 $407,404 $383,277 Deposit Growth • We have seen healthy growth in deposits with growth of 7% in 2017, and 2% in 2018 Q1. • Low cost relationship deposits (DDA, NOW, MMA and Savings) grew by 12% in 2017 and by 5% in 2018 Q1. • Noninterest bearing demand represents 27% of deposits at March 31, 2018. $388,608 $411,624 $421,498 10% Growth

10 $3,448 $3,493 $3,522 $3,692 $3,870 $4,011 3.43% 3.58% 3.49% 3.53% 3.66% 3.74% 0.00% 1.00% 2.00% 3.00% 4.00% 5.00% $0 $500 $1,000 $1,500 $2,000 $2,500 $3,000 $3,500 $4,000 $4,500 Q4 2016 Q1 2017 Q2 2017 Q3 2017 Q4 2017 Q1 2018 Net interest income NIM Net Interest Income and Margin • Net interest income increased $518,000, or 15%, to $4.0 million in Q1 2018 compared to Q1 2017. • Net interest margin increased 16 basis points to 3.74% for Q1 2018 compared to Q1 2017. 16% Growth
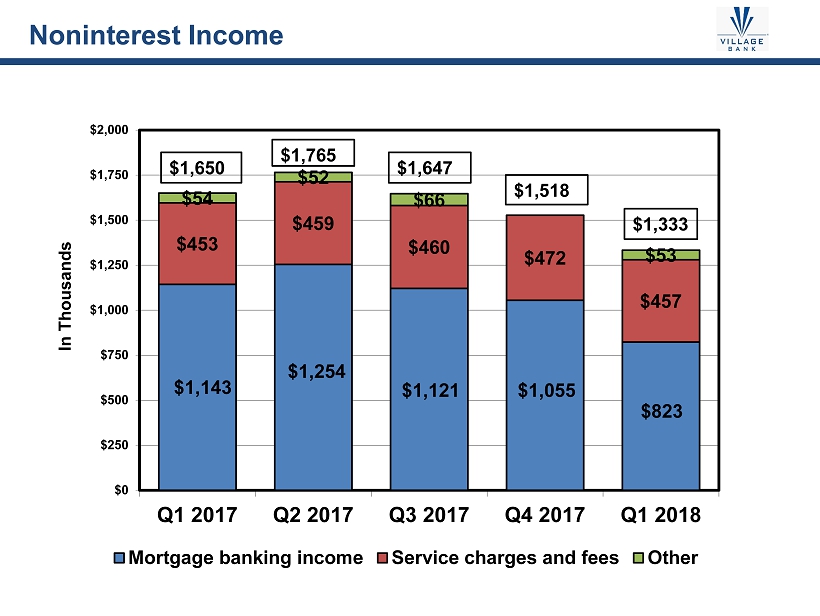
11 $1,143 $1,254 $1,121 $1,055 $823 $453 $459 $460 $472 $457 $54 $52 $66 $53 $0 $250 $500 $750 $1,000 $1,250 $1,500 $1,750 $2,000 Q1 2017 Q2 2017 Q3 2017 Q4 2017 Q1 2018 In Thousands Mortgage banking income Service charges and fees Other $1,765 $1,518 Noninterest Income $1,650 $1,647 $1,333
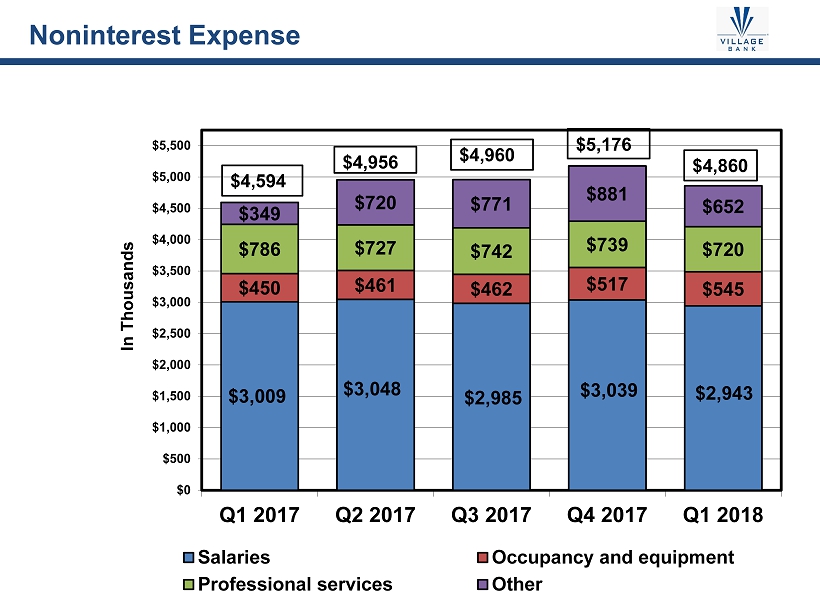
12 $3,009 $3,048 $2,985 $3,039 $2,943 $450 $461 $462 $517 $545 $786 $727 $742 $739 $720 $349 $720 $771 $881 $652 $0 $500 $1,000 $1,500 $2,000 $2,500 $3,000 $3,500 $4,000 $4,500 $5,000 $5,500 Q1 2017 Q2 2017 Q3 2017 Q4 2017 Q1 2018 In Thousands Salaries Occupancy and equipment Professional services Other $4,956 $5,176 Noninterest E xpense $4,594 $4,960 $4,860

$26.68 $26.89 $26.98 $23.98 $23.87 $- $5 $10 $15 $20 $25 $30 Q1 2017 Q2 2017 Q3 2017 Q4 2017 Q1 2018 13 Tangible Common Equity • In Q4 2017, tangible common equity was negatively impacted by the write down of the net deferred tax asset of $4.2 million as a result of the reduction in the corporate income tax rate . • Market price at March 31, 2018 was $32.25 per share which was 135% of TBV. Tangible Book Value per Share 8.45% 8.32% 8.31% 7.19% 7.00% 0% 1% 2% 3% 4% 5% 6% 7% 8% 9% 10% Q1 2017 Q2 2017 Q3 2017 Q4 2017 Q1 2018 TCE to Total Assets
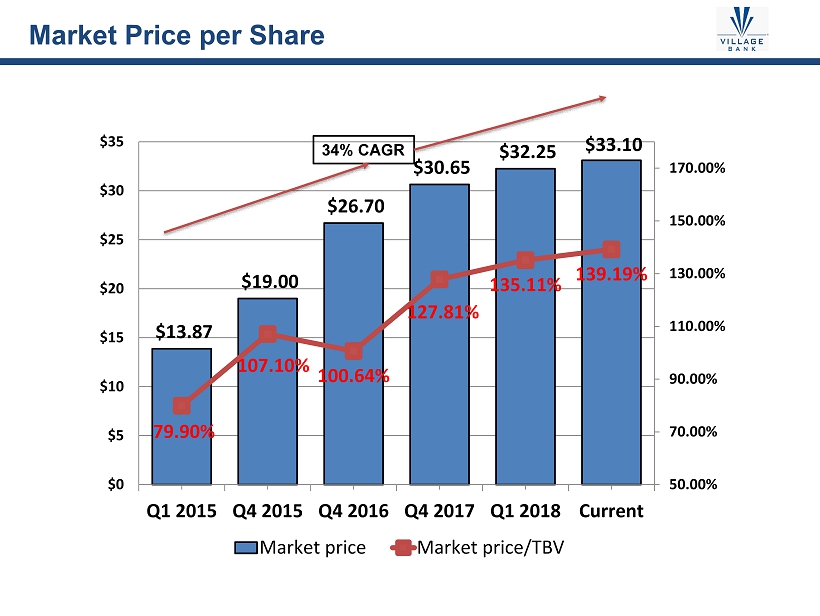
14 $13.87 $19.00 $26.70 $30.65 $32.25 $33.10 79.90% 107.10% 100.64% 127.81% 135.11% 139.19% 50.00% 70.00% 90.00% 110.00% 130.00% 150.00% 170.00% $0 $5 $10 $15 $20 $25 $30 $35 Q1 2015 Q4 2015 Q4 2016 Q4 2017 Q1 2018 Current Market price Market price/TBV Market Price per Share 34% CAGR

9.33% 10.47% 9.18% 9.08% 14.02% 15.33% 12.88% 12.61% 0.03 0.04 0.05 0.06 0.07 0.08 0.09 0.1 0.11 0.12 0.13 0.14 0.15 0.16 0.17 2015 2016 2017 2018 Q1 Leverage ratio Total risk based ratio Bank Capital Ratios Well Capitalized 10% Total Risk - Based Well Capitalized 5% Leverage 15 • 2016 was positively impacted by the reversal of a $12.0 million valuation allowance • 2017 was negatively impacted by the write down of the net deferred tax asset of $4.2 million as a result of the reduction in the corporate income tax rate.

Bank Peer Information 16 Year Ended December 31, 2017 Village Peer Balance sheet Loan growth 9.38% 9.03% Deposit growth 7.40% 7.03% Loans/deposits 89.57% 83.28% Capitalization Tangible equity/Tangible assets 7.19% 11.01% Leverage ratio 9.18% 11.15% Total risk based ratio 12.88% 18.35% Performance Interest earn assets/interest bear liabilities 130.76% 137.92% Yield on interest earning assets 4.23% 4.17% Cost of interest bearing liabilities 0.87% 0.65% Net interest margin 3.56% 3.69% Efficiency ratio 93.51% 65.60% Asset quality ALLL/Loans (excluding purchased loans) 1.04% 1.31% NPAs/Total assets 0.86% 1.08% Net charge-offs/Average loans 0.04% 0.13% Source for Peer information - S&P Global Market Intelligence US commercial banks $300M - $500M

• Generate strong, quality growth in earnings available to common shareholders by: • Growing core loans and deposits at rates comparable to 2016 • Realizing additional operating efficiencies • Growing the mortgage business • Redeeming preferred stock as rapidly and prudently as we can • Benefiting from rate increases • Position for future growth by: • Recruiting commercial bankers • Recruiting mortgage loan officers • Retaining mortgage loan officers • Evaluating other markets for expansion (loan production office, team liftouts ) • Preparing ourselves for successful M&A to complement organic growth (whole bank, branches/deposits and fee businesses) • Committing to a strategy for serving the broader financial needs of our clients (financial advisory, investments, insurance, etc.) 2017 Priorities 17

Accomplishments during 2017 • Core loans (Excludes government guaranteed student and USDA) +12.1% in 2017. Up 27.4% from 2015 to 2017. • Low cost relationship deposits (excludes CDs) +11.9% in 2017. Up 27.1% from 2015 to 2017. Keeping up with loan growth. • Loan growth is occurring in the targeted categories • NIM +23 bp from 3.43% in Q4 2016 to 3.66% Q4 2017 • Bank and Holding Company noninterest expense/average assets improved from 3.63% to 3.28% • 5 new commercial relationship manager hires (including Williamsburg) • A leader in SBA production in the Virginia Region • Achieved Asset Quality Metrics in line with peers Q1 2018 • Core loans +6.7% vs. Q4 2017 • Linked quarter loan growth of +5.2% outpacing Mid - Atlantic region total of 1.2% • Low cost relationship deposits +4.8% from Q4 2017 • Non interest bearing deposits now account for 27% of deposits • NIM of 3.74% was +8 bp from Q4 2017 and +16 bp from Q1 2017 • Net interest income + 15% over Q1 2017 • Noninterest expense to average assets improved to 3.21% • Asset quality better than peer average (per S&P Global) • NPA/Assets .64% vs. .99% for Virginia Banks <$1B • ALLL/NPLs 159% vs. 141% for Virginia Banks <$1B 2018 Priorities & Goals • NIM expansion and volume growth drive >15% NII growth • Noninterest income growth initiatives implemented second half of 2018 • Mid single digit NIE growth • Positioned to generate 10%+ ROTCE from commercial & consumer banking segment in 2019 Commercial Banking Segment 18
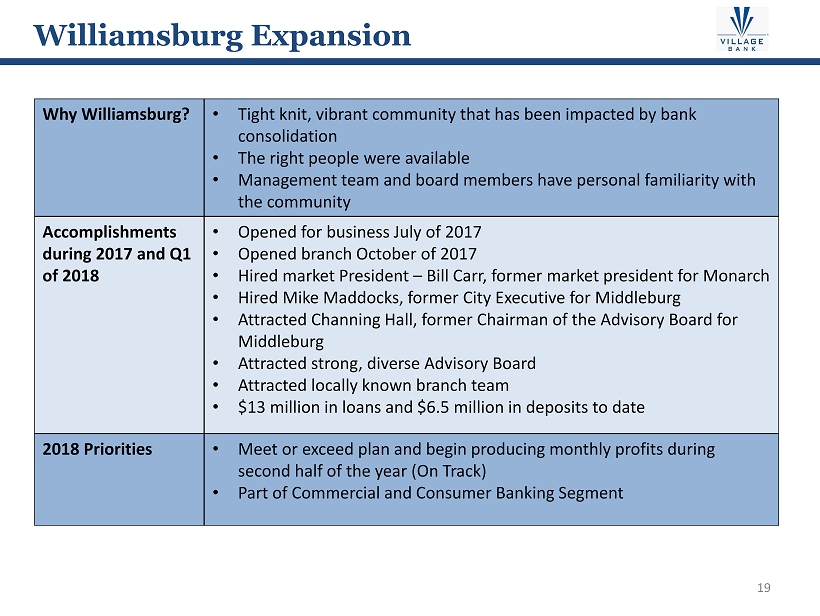
Why Williamsburg? • Tight knit, vibrant community that has been impacted by bank consolidation • The right people were available • Management team and board members have personal familiarity with the community Accomplishments during 2017 and Q1 of 2018 • Opened for business July of 2017 • Opened branch October of 2017 • Hired market President – Bill Carr, former market president for Monarch • Hired Mike Maddocks, former City Executive for Middleburg • Attracted Channing Hall, former Chairman of the Advisory Board for Middleburg • Attracted strong, diverse Advisory Board • Attracted locally known branch team • $13 million in loans and $6.5 million in deposits to date 2018 Priorities • Meet or exceed plan and begin producing monthly profits during second half of the year (On Track) • Part of Commercial and Consumer Banking Segment Williamsburg Expansion 19

What Happened in 2017? • Leadership transition did not go smoothly • Resulted in some loss of production talent, retention and recruiting costs and ultimately a change in leadership in December 2017 Accomplishments during 2017 • Implemented paperless production process • Improved operating efficiencies • Recruited new loan production manager and 3 loan officers • Introduced several product enhancements that expand offerings • Increased referrals from retail and commercial bankers • Made a small profit despite all of the disruption and distraction, retention, recruiting, training and severance Q1 2018 • Loss as a result of seasonality and entering the year with low inventory of loans available for sale. Strong, profitably March. • Recruited 2 loan officers • Application volumes up 10% vs. Q1 2017 2018 Priorities • Regain profit momentum • Recruit 2 - 3 more loan officers before year - end • Product enhancements – portfolio product, one - close construction/permanent loan • Install CRM to help loan officers produce more business • Enhanced Loan Officer Assistant role to help loan officers grow production Mortgage Banking 20

• Significant profit contributor during last 10 years • 85/15 split purchase/refi • Balanced government/conventional originations • Best practices grant program execution • Almost all volume originated by self sourcing loan officers • Excellent operations, compliance and risk management track record • Highly regarded leadership, producers and operations team members • Strong value proposition for improving new talent • Several active growth initiatives – Loan officer recruiting – CRM and marketing to help all loan officers grow their business – Enhanced product offerings (portfolio product, second D/T, one close construction/perm) – Increased internal referrals – Expansion to Williamsburg Village Bank Mortgage Opportunity 21

Factor Why? ROE • Indicates how productively we invest shareholder capital • Internal capital generation to support growth • Capacity to pay dividends • Building book value per share • Hurdle rate of return Growth • Growing earnings per share and book value per share • Today’s value is net present value of future earnings and cash flow Risk • Uncertainty about the true value of assets, quality of earnings, sustainability of earnings gets reflected in price/book value and price to earnings multiples. • Today’s value is really the net present value of expected future earnings and cash flows. Greater risk and uncertainty gets reflected in higher discount rate. Factors That Drive Long Term Shareholder Returns 22

Factors That Drive Long Term Shareholder Returns 23 Factor Village Strategic Goals How We Accomplish This ROE • Top quartile ROTCE in 2019 A 12% ROTCE would have placed us in top quartile of Virginia Banks <$1B in Q1 2018 • Expand net interest margin through: • improving asset and funding mix • low cost deposit growth • maintaining asset sensitive position • disciplined loan and deposit pricing • capital efficiency • Profitable and growing mortgage business • Grow revenues faster than expenses Growth • Sustained earnings growth in high single digits • Competitively differentiated commercial, consumer and mortgage banking offerings • Excellent execution of sales process Risk • Best quartile earnings volatility • Best quartile asset quality in worst part of cycle • Exceptional, disciplined risk management • Limit exposure to highest risk loan categories (land acquisition & development, construction of “for sale” product, spec construction) • Build diverse sources of revenues and earnings

Levers to Improve ROA and ROTCE 24 Metric 2015 2016 2017 Q1 2018 2019 Goals Bank & Holdco NII/Assets 2.88% 3.03% 3.15% 3.37% >3.50% Provision/Assets .47% -- -- -- <(.15%) NonII /Assets .76%* .86%* .44% .43% >.50% NIE/Assets (4.20%) (3.63%) (3.28%) (3.21%) <(2.90%) Mortgage NIBT/Assets .24% .29% .01% (.18%) >.30% Plan for hitting 2019 goal of ROTCE >12% • Continue to grow core loans and low cost deposits at strong double digit pace through Q4 2018, moderating to high single digits in 2019 • Maintain credit disciplines on underwriting, pricing, concentration risk management • Trim low yielding assets as appropriate to expand margins and increase ROAA • Anticipate three rate increases by Fed between now and March 2019 • Implement bank noninterest income initiatives • Manage commercial banking segment noninterest expenses to deliver NIE/Assets <2.90% in 2019 • Grow mortgage banking production to $230MM or more in 2019 by recruiting additional loan officers and enabling existing loan officers to grow their own production through CRM, marketing, enhanced product offerings, internal referrals and additional support from loan officer assistants • This should result in metrics in line with 2019 goals, which would produce a ROTCE >12% *2015 & 2016 Noninterest Income includes rent and gain on sale of old HQ Building

25 Net Charge - offs for Virginia Banks 22 - Year Average Average 2007 - 2013 Worst Two Years 2007 - 2013 3/31/2018 Portfolio Mix 1 - 4 Residential Construction .85% 2.69% 17.01% 1.1% Other Land Acquisition, Development & Construction .59% 1.63% 5.84% 7.5% C & I .56% .86% 2.33% 10.5% Other Consumer (excl. Student) .67% .91% 2.16% .43% Multifamily .19% .38% 1.27% 2.6% Commercial RE (owner occupied & non - owner occupied) .20% .33% 1.25% 42.9% 1 - 4 Residential First Mortgage .13% .30% 1.07% 15.0% Home Equity/2nds .07% .23% .72% 8.3% Gov’t Guaranteed (Student, USDA, SBA) 15.7%* *Gov’t Guaranteed Loans includes some balances also included in other categories Source of loss history: S &P Global Higher Risk Loans = more provision expense, more capital, more earnings volatility Credit Strategy to Achieve Best Quartile Asset Quality in Worst Part of Cycle

Loan Portfolio Composition Close to Target 31 34 40 13 23 25 55 31 30 0 12 5 2012 Q1 2018 TARGET LOAN PORTFOLIO (% TOTAL LOANS) Commercial Consumer CRE Other • Growing the right categories (C&I + Owner Occupied CRE, Consumer and Income Producing CRE) • Real Estate Concentrations in line – ADC 72% of RBC vs. 100% Regulatory Policy – Total CRE 260% of RBC vs. 300% Regulatory Policy • Other includes $44 million in Student Loans, which have attractive risk and return characteristics: – ~70% floating – ~98% government guaranteed – 3.80% yield Q1 2018 vs. 3.18% Q1 2017 – 20% Risk Weighting – Returning cash flow 26

Relationship Deposit Growth Lowers COF 7 26 25 30 36 50 57 35 20 6 3 5 2012 Q1 2018 TARGET % OF TOTAL FUNDING FUNDING MIX Noninterest Bearing Non-CD Interest Bearing Time Deposits Borrowings 2012 Q1 2018 Noninterest Bearing Deposits t o Total Deposits 13% 27% Noninterest Bearing Deposits to Total Funding 7% 26% Transaction Deposits to Total Deposits 24% 39% Cost of Funds (consolidated including sub debt ) 1.21% .71% 27 Borrowings in Funding Mix graph exclude sub debt at Holding C ompany
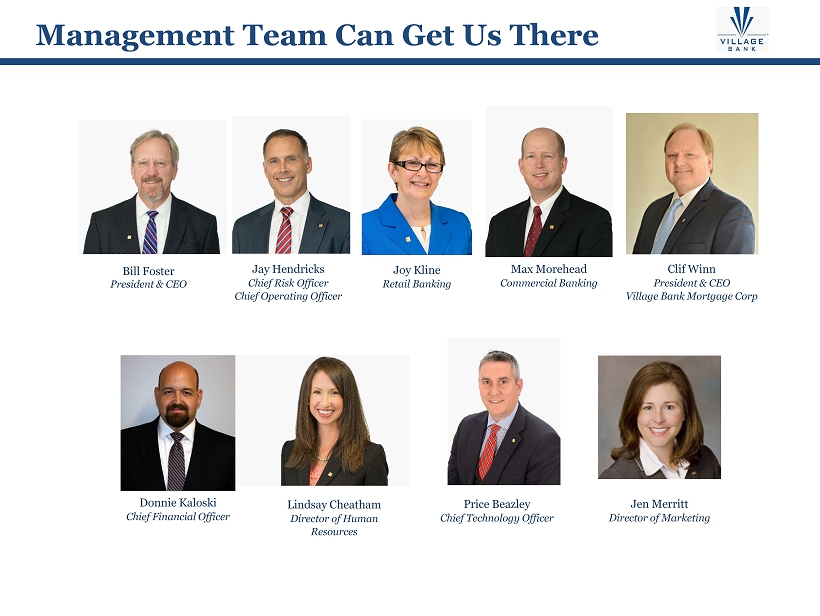
Management Team Can Get Us There Bill Foster President & CEO Donnie Kaloski Chief Financial Officer Jay Hendricks Chief Risk Officer Chief Operating Officer Lindsay Cheatham Director of Human Resources Max Morehead Commercial Banking Joy Kline Retail Banking Clif Winn President & CEO Village Bank Mortgage Corp Price Beazley Chief Technology Officer Jen Merritt Director of Marketing

• We believe that we have the talent, market and franchise to do what is necessary to achieve our objectives. • After several years of hard work, our balance sheet is positioned to be a high return balance sheet – Earning asset mix – Funding mix – Asset sensitivity – Credit profile • Our organic loan and low cost deposit growth is among the best Virginia. • Our board has been doing the delicate work of reconfiguring itself and building a board for the future. This will continue in 2018 and 2019. • We will revisit our strategy of growth through bank M&A, expansion into wealth management, insurance or other lines of business once we hit our performance targets. Right now, we are focused on hitting our return and profitability targets. • Our stock price appreciation has been very strong, and we believe that hitting our targets will produce very attractive upside. Conclusion 29

Question and Answer Session Each questioner is asked to state his or her name and affiliation. Out of respect for other shareholders , we ask that each questioner be brief and to the point. Thank You Questions 30