Attached files
| file | filename |
|---|---|
| EX-99.4 - EX-99.4 - EQM Midstream Partners, LP | a18-13962_1ex99d4.htm |
| EX-99.3 - EX-99.3 - EQM Midstream Partners, LP | a18-13962_1ex99d3.htm |
| EX-99.2 - EX-99.2 - EQM Midstream Partners, LP | a18-13962_1ex99d2.htm |
| EX-23.1 - EX-23.1 - EQM Midstream Partners, LP | a18-13962_1ex23d1.htm |
| 8-K - 8-K - EQM Midstream Partners, LP | a18-13962_18k.htm |
Cautionary Statements Disclosures in this presentation contain certain forward-looking statements within the meaning of Section 21E of the Securities Exchange Act of 1934, as amended, and Section 27A of the Securities Act of 1933, as amended. Statements that do not relate strictly to historical or current facts are forward-looking. Without limiting the generality of the foregoing, forward-looking statements contained in this presentation specifically include the expectations of plans, strategies, objectives and growth and anticipated financial and operational performance of EQT Corporation (EQT) and its subsidiaries, including EQT GP Holdings, LP (EQGP), EQT Midstream Partners, LP (EQM), and Rice Midstream Partners LP (RMP), including whether the midstream transactions described in this presentation are completed, as expected or at all, and the timing of any such transactions; whether the conditions to the midstream transactions can be satisfied; whether the operational, financial and strategic benefits of the midstream transactions can be achieved; whether the costs and expenses of the midstream transactions can be controlled within expectations; potential adverse reactions or changes to business or employee relationships, including those resulting from the announcement or completion of the midstream transactions; competitive responses to the transactions; the possibility that the anticipated benefits of the transactions are not realized when expected or at all; the possibility that the transactions may be more expensive to complete than anticipated, including as a result of unexpected factors or events; diversion of management’s attention from ongoing business operations and opportunities; potential adverse reactions or changes to business or employee relationships, including those resulting from the announcement or completion of the transactions; litigation relating to the transactions; guidance regarding EQM’s volumes and related growth; infrastructure programs (including the timing, cost, capacity and sources of funding with respect to gathering, transmission and water projects); the cost, capacity, timing of regulatory approvals and anticipated in-service date of the Mountain Valley Pipeline (MVP) and the MVP Southgate project; the ultimate terms, partners and structure of the MVP joint venture; internal rate of return (IRR); compound annual growth rate (CAGR); capital commitments, projected capital contributions and capital and operating expenditures, including the amount and timing of capital expenditures reimbursable by EQT, capital budget and sources of funds for capital expenditures; liquidity and financing requirements, including funding sources and availability; distribution amounts, rates and growth; projected net income, projected adjusted EBITDA, projected EBITDA for EQT’s retained midstream assets, projected distributable cash flow, projected distributable cash flow per unit and projected synergies; the timing of future debt or equity issuances and the expected proceeds and terms of such offerings; changes in EQM’s credit ratings; the effects of government regulation and litigation; and tax position. These forward looking statements involve risks and uncertainties that could cause actual results to differ materially from projected results. Accordingly, investors should not place undue reliance on forward-looking statements as a prediction of actual results. EQM and EQGP have based these forward-looking statements on current expectations and assumptions about future events. While EQM and EQGP consider these expectations and assumptions to be reasonable, they are inherently subject to significant business, economic, competitive, regulatory and other risks and uncertainties, many of which are difficult to predict and beyond the partnerships’ control. The risks and uncertainties that may affect the operations, performance and results of EQM’s and EQGP’s business and forward-looking statements include, but are not limited to, those set forth under Item 1A, “Risk Factors” of the Form 10-K for the year ended December 31, 2017 as filed with the Securities and Exchange Commission (SEC) of each of EQT, EQGP, EQM and RMP, in each case as may be updated by any subsequent Form 10-Qs. Any forward-looking statement speaks only as of the date on which such statement is made, and none of EQT, EQGP, EQM or RMP intends to correct or update any forward-looking statement, whether as a result of new information, future events or otherwise.
Important Information for Investors No Offer or Solicitation This communication is for informational purposes only and shall not constitute an offer to sell or the solicitation of an offer to buy any securities pursuant to the proposed transaction or otherwise, nor shall there be any sale of securities in any jurisdiction in which the offer, solicitation or sale would be unlawful prior to the registration or qualification under the securities laws of any such jurisdiction. No offer of securities shall be made except by means of a prospectus meeting the requirements of Section 10 of the Securities Act of 1933, as amended. Important Additional Information In connection with the proposed business combination transaction between EQM and RMP, EQM has filed a registration on Form 4 containing a registration statement on Form S-4, containing a proxy statement/prospectus (the Form S-4) with the SEC. This communication is not a substitute for the registration statement, definitive proxy statement/prospectus or any other documents that EQM or RMP may file with the SEC or send to RMP unitholders in connection with the proposed transaction. UNITHOLDERS OF RMP ARE URGED TO READ ALL RELEVANT DOCUMENTS FILED WITH THE SEC, INCLUDING THE FORM S-4 AND THE DEFINITIVE PROXY STATEMENT/PROSPECTUS INCLUDED THEREIN IF AND WHEN FILED, AND ANY OTHER RELEVANT DOCUMENTS FILED WITH THE SEC, BECAUSE THEY WILL CONTAIN IMPORTANT INFORMATION ABOUT THE PROPOSED TRANSACTION. When available, investors and security holders will be able to obtain copies of these documents, including the proxy statement/prospectus and the registration statement, and any other documents that may be filed with the SEC with respect to the proposed transaction free of charge at the SEC’s website, http://www.sec.gov or as described in the following paragraph. The documents filed with the SEC by EQT and its publicly traded subsidiaries (including EQM, RMP and EQGP) may be obtained free of charge at the applicable website (www.eqt.com for EQT, www.eqtmidstreampartners.com for EQGP and EQM, and www.ricemidstream.com for RMP) or by requesting them by mail at EQT Corporation, 625 Liberty Avenue, Suite 1700, Pittsburgh, PA 15222, Attention: Investor Relations, or by telephone at (412) 553-5700. Participants in the Solicitation EQT, EQM, RMP and EQGP (EQM, RMP and EQGP collectively, the Partnerships) and certain of their respective directors and executive officers may be deemed to be participants in the solicitation of proxies from the unitholders of RMP in connection with the proposed transaction. Information about the directors and executive officers of the general partners of EQM, RMP and EQGP is set forth, respectively, in the Annual Report on Form 10-K for the year ended December 31, 2017 filed by such Partnership with the SEC on February 15, 2018 and certain of the Partnerships’ respective Current Reports on Form 8-K. Information regarding EQT’s directors and executive officers is available in its Annual Report on Form 10-K for the year ended December 31, 2017 filed by EQT with the SEC on February 15, 2018, EQT’s definitive proxy statement for its 2018 annual meeting of shareholders filed with the SEC on April 27, 2018 and certain of EQT’s Current Reports on Form 8-K. These documents can be obtained free of charge from the sources indicated above. Other information regarding the participants in the proxy solicitation and a description of their direct and indirect interests, by security holdings or otherwise, are contained in the proxy statement/prospectus and other relevant materials filed or to be filed with the SEC.
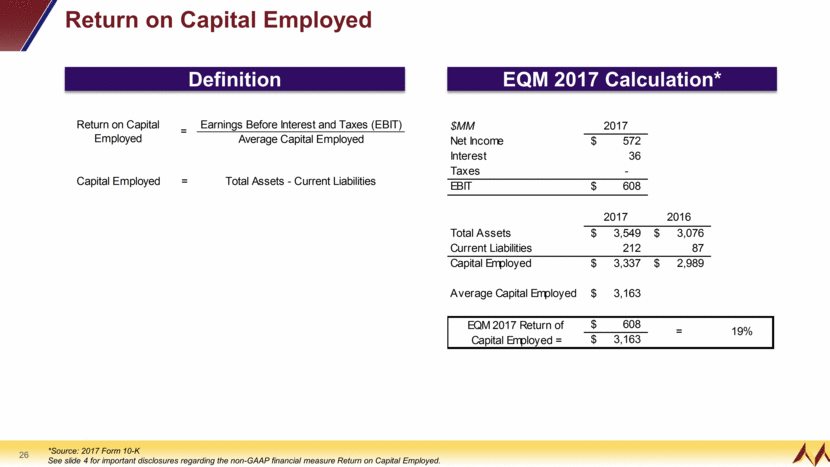
EQT Midstream Partners, LP Non-GAAP Measures EQM adjusted EBITDA means EQM’s net income plus net interest expense, depreciation and amortization expense, income tax expense, preferred interest payments received post conversion and non-cash long-term compensation expense less equity income, AFUDC – equity, pre-acquisition capital lease payments for Allegheny Valley Connector, LLC (AVC) and adjusted EBITDA of assets prior to acquisition. As used in this presentation, distributable cash flow means EQM adjusted EBITDA less net interest expense excluding interest income on the preferred interest, capitalized interest and AFUDC - debt, and ongoing maintenance capital expenditures net of expected reimbursements. Distributable cash flow should not be viewed as indicative of the actual amount of cash that EQM has available for distributions from operating surplus or that EQM plans to distribute. Adjusted EBITDA and distributable cash flow are non-GAAP supplemental financial measures that management and external users of EQM’s consolidated financial statements, such as industry analysts, investors, lenders and rating agencies, use to assess: EQM’s operating performance as compared to other publicly traded partnerships in the midstream energy industry without regard to historical cost basis or, in the case of adjusted EBITDA, financing methods; the ability of EQM’s assets to generate sufficient cash flow to make distributions to EQM unitholders; EQM’s ability to incur and service debt and fund capital expenditures; and the viability of acquisitions and other capital expenditure projects and the returns on investment of various investment opportunities. EQM believes that adjusted EBITDA and distributable cash flow provide useful information to investors in assessing EQM’s results of operations and financial condition. Adjusted EBITDA and distributable cash flow should not be considered as alternatives to net income, operating income, net cash provided by operating activities or any other measure of financial performance or liquidity presented in accordance with GAAP. Adjusted EBITDA and distributable cash flow have important limitations as analytical tools because they exclude some, but not all, items that affect net income and net cash provided by operating activities. Additionally, because adjusted EBITDA and distributable cash flow may be defined differently by other companies in its industry, EQM’s definitions of adjusted EBITDA and distributable cash flow may not be comparable to similarly titled measures of other companies, thereby diminishing the utility of the measures. EQM is unable to project net cash provided by operating activities or provide the related reconciliation of projected net cash provided by operating activities to projected distributable cash flow, the most comparable financial measure calculated in accordance with GAAP, because net cash provided by operating activities includes the impact of changes in operating assets and liabilities. Changes in operating assets and liabilities relate to the timing of EQM’s cash receipts and disbursements that may not relate to the period in which the operating activities occurred, and EQM is unable to project these timing differences with any reasonable degree of accuracy to a specific day, three or more months in advance. EQM is also unable to provide a reconciliation of its projected adjusted EBITDA to projected net income, the most comparable financial measure calculated in accordance with GAAP, because EQM does not provide guidance with respect to the intra-year timing of its or Mountain Valley Pipeline, LLC’s capital spending, which impact AFUDC-debt and equity and equity earnings, among other items, that are reconciling items between adjusted EBITDA and net income. The timing of capital expenditures is volatile as it depends on weather, regulatory approvals, contractor availability, system performance and various other items. EQM provides a range for the forecasts of net income, adjusted EBITDA and distributable cash flow to allow for the variability in the timing of cash receipts and disbursements, capital spending and the impact on the related reconciling items, many of which interplay with each other. Therefore, the reconciliations of projected distributable cash flow and adjusted EBITDA to projected net cash provided by operating activities and net income are not available without unreasonable effort. Return on capital employed (ROCE) as used in this presentation means a ratio, the numerator of which is EQM’s net income less income taxes and interest expense (EBIT), and the denominator of which is the average of total assets less current liabilities for the beginning and end of the applicable measurement period. EBIT is a non-GAAP supplemental financial measure that management and external users of EQM’s consolidated financial statements use to assess the items listed above with respect to EQM adjusted EBITDA. EQM believes that ROCE is a useful measure for investors in assessing how effectively EQM has invested its capital including in relation to EQM’s peers. EBIT should not be considered as an alternative to net income, operating income or any other measure of financial performance presented in accordance with GAAP. Because ROCE may be defined differently by other companies in its industry, EQM’s definition of ROCE may not be comparable to similarly titled measures of other companies, thereby diminishing the utility of the measure.
EQT Midstream Partners, LP Non-GAAP Measures (cont.) As used in this presentation, EBITDA means the earnings before interest, taxes and depreciation of EQT’s retained midstream assets acquired from Rice. EBITDA of these assets is a non-GAAP supplemental financial measure that management and external users of EQM’s consolidated financial statements, such as industry analysts, investors, lenders and rating agencies, use to assess the impact of EQT's potential drop-down of the retained midstream assets to EQM on EQM’s future results of operations. EQM believes that the projected EBITDA of the retained midstream assets provides useful information to investors in assessing the impact of the potential drop-down transaction or transactions on EQM’s future results of operations. EBITDA should not be considered as an alternative to net income, operating income, or any other measure of financial performance or liquidity presented in accordance with GAAP. EBITDA has important limitations as an analytical tool because it excludes some, but not all, items that affect net income. Additionally, because EBITDA may be defined differently by other companies in EQM’s industry, the definition of EBITDA may not be comparable to similarly titled measures of other companies, thereby diminishing the utility of the measure. EQM has not provided projected net income from the Rice retained midstream assets, the most comparable financial measure calculated in accordance with GAAP, or a reconciliation of projected EBITDA to projected net income of the assets. The retained midstream assets are operated as part of EQT’s Production business segment, and EQT does not allocate certain costs, such as interest and tax, to individual assets within its business segments. Therefore, projected net income of the retained midstream assets and a reconciliation of projected EBITDA of the assets to projected net income from those assets are not available without unreasonable effort.
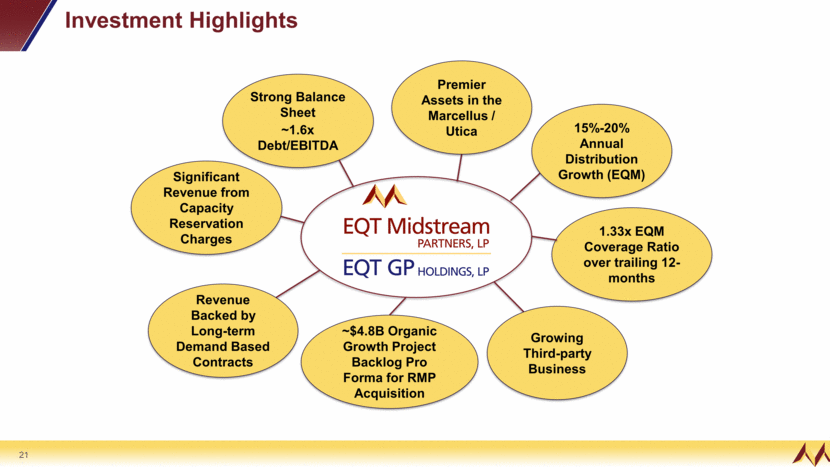
Investment Highlights Growing Third-party Business Significant Revenue from Capacity Reservation Charges 15%-20% Annual Distribution Growth (EQM) ~$4.8B Organic Growth Project Backlog Pro Forma for RMP Acquisition Premier Assets in the Marcellus / Utica Revenue Backed by Long-term Demand Based Contracts Strong Balance Sheet ~1.6x Debt/EBITDA 1.33x EQM Coverage Ratio over trailing 12-months

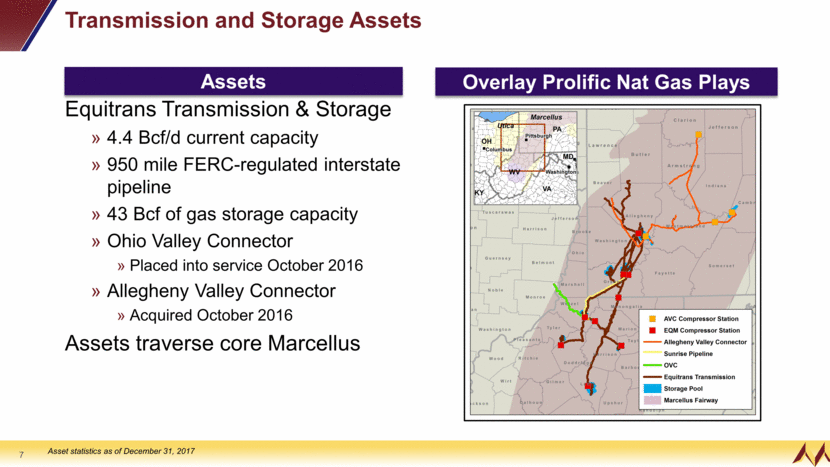
Assets Overlay Prolific Nat Gas Plays Equitrans Transmission & Storage 4.4 Bcf/d current capacity 950 mile FERC-regulated interstate pipeline 43 Bcf of gas storage capacity Ohio Valley Connector Placed into service October 2016 Allegheny Valley Connector Acquired October 2016 Assets traverse core Marcellus Transmission and Storage Assets Asset statistics as of December 31, 2017
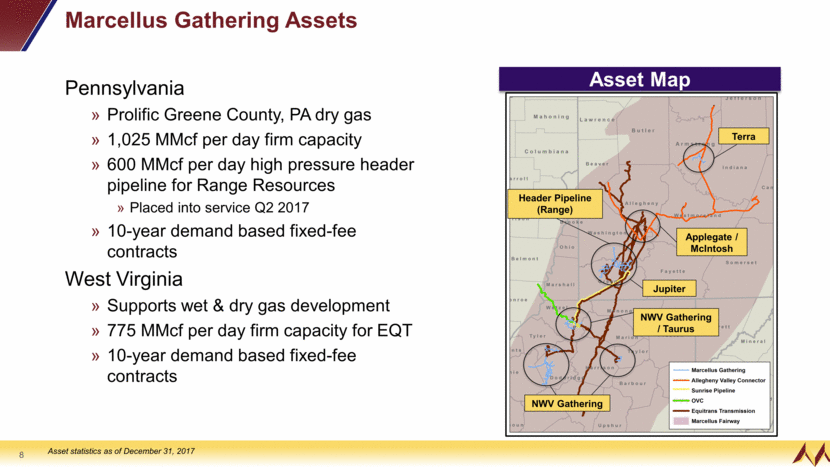
Pennsylvania Prolific Greene County, PA dry gas 1,025 MMcf per day firm capacity 600 MMcf per day high pressure header pipeline for Range Resources Placed into service Q2 2017 10-year demand based fixed-fee contracts West Virginia Supports wet & dry gas development 775 MMcf per day firm capacity for EQT 10-year demand based fixed-fee contracts Marcellus Gathering Assets Asset Map Jupiter Applegate / McIntosh Terra NWV Gathering / Taurus NWV Gathering Header Pipeline (Range) Asset statistics as of December 31, 2017
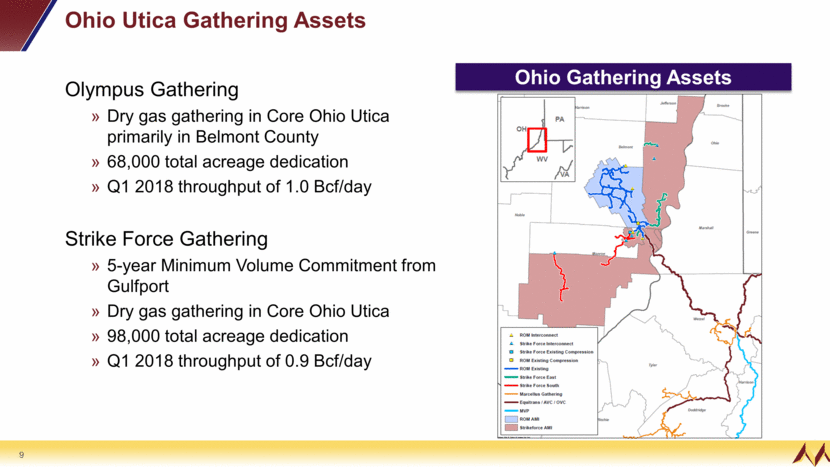
Ohio Utica Gathering Assets Olympus Gathering Dry gas gathering in Core Ohio Utica primarily in Belmont County 68,000 total acreage dedication Q1 2018 throughput of 1.0 Bcf/day Strike Force Gathering 5-year Minimum Volume Commitment from Gulfport Dry gas gathering in Core Ohio Utica 98,000 total acreage dedication Q1 2018 throughput of 0.9 Bcf/day Ohio Gathering Assets
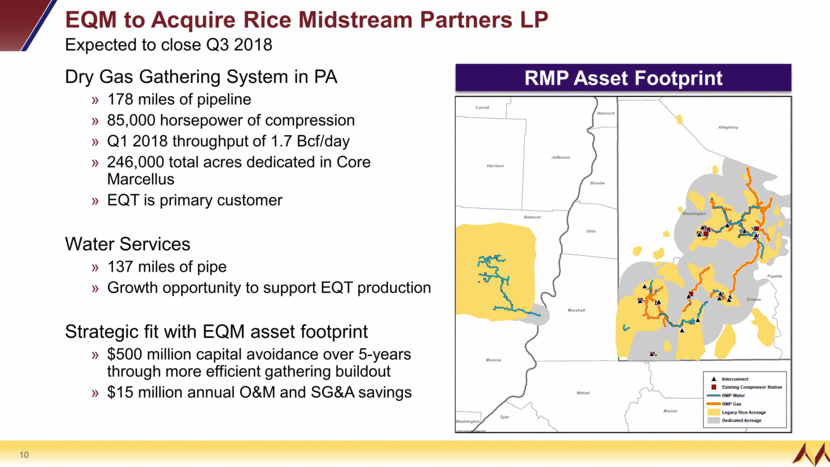
EQM to Acquire Rice Midstream Partners LP Expected to close Q3 2018 RMP Asset Footprint Dry Gas Gathering System in PA 178 miles of pipeline 85,000 horsepower of compression Q1 2018 throughput of 1.7 Bcf/day 246,000 total acres dedicated in Core Marcellus EQT is primary customer Water Services 137 miles of pipe Growth opportunity to support EQT production Strategic fit with EQM asset footprint $500 million capital avoidance over 5-years through more efficient gathering buildout $15 million annual O&M and SG&A savings
Leverage existing asset footprint to expand Marcellus/Utica supply hub Gathering 6.2 Bcf/d (EQM & RMP) Transmission capacity of 4.4 Bcf/d is a 7-fold increase from 2009 Access to diverse sales points and providing shipper optionality Targeting 1.5 Bcf/d of incremental capacity 2018-2019 Hammerhead Pipeline Project Equitrans Expansion Project Extend network to connect supply hub to growing demand markets Assets interconnect with all major interstate pipelines in basin Ohio Valley Connector provides access to Midwest markets Mountain Valley Pipeline will provide access to growing Southeast markets Direct connects with power plants and industrial users Potential demand driven partnership opportunities Growth Strategies Connect Supply and Demand Expand Supply Hub
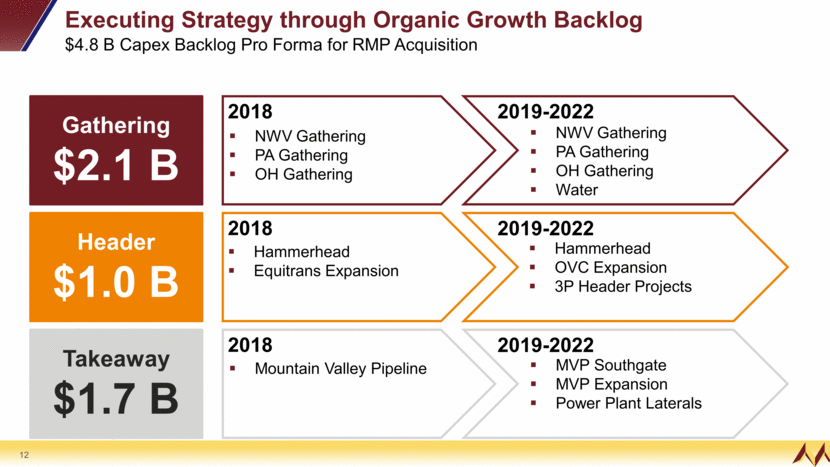
Executing Strategy through Organic Growth Backlog $4.8 B Capex Backlog Pro Forma for RMP Acquisition Gathering $2.1 B Header $1.0 B Takeaway $1.7 B 2018 2018 2018 NWV Gathering PA Gathering OH Gathering Hammerhead Equitrans Expansion Mountain Valley Pipeline 2019-2022 2019-2022 2019-2022 NWV Gathering PA Gathering OH Gathering Water Hammerhead OVC Expansion 3P Header Projects MVP Southgate MVP Expansion Power Plant Laterals
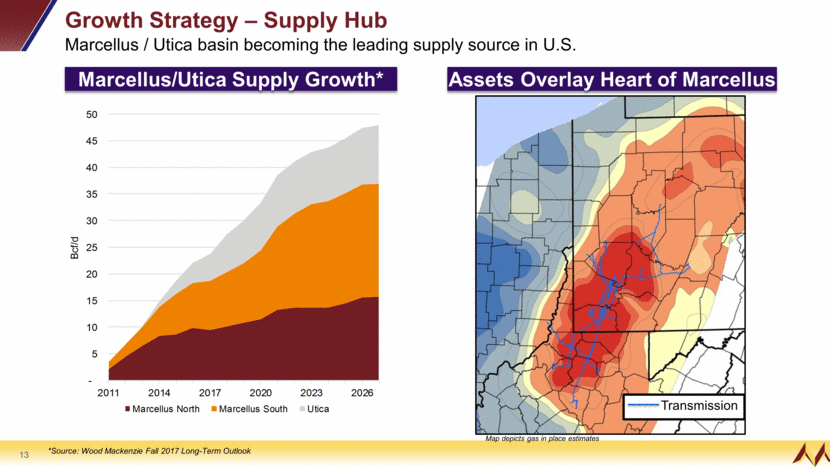
Growth Strategy – Supply Hub Marcellus / Utica basin becoming the leading supply source in U.S. Map depicts gas in place estimates Transmission *Source: Wood Mackenzie Fall 2017 Long-Term Outlook Assets Overlay Heart of Marcellus Marcellus/Utica Supply Growth*
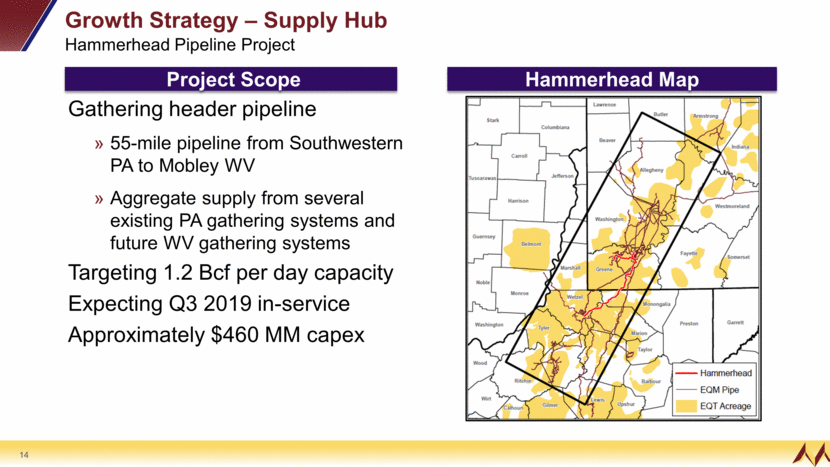
Gathering header pipeline 55-mile pipeline from Southwestern PA to Mobley WV Aggregate supply from several existing PA gathering systems and future WV gathering systems Targeting 1.2 Bcf per day capacity Expecting Q3 2019 in-service Approximately $460 MM capex Growth Strategy – Supply Hub Hammerhead Pipeline Project Hammerhead Map Project Scope
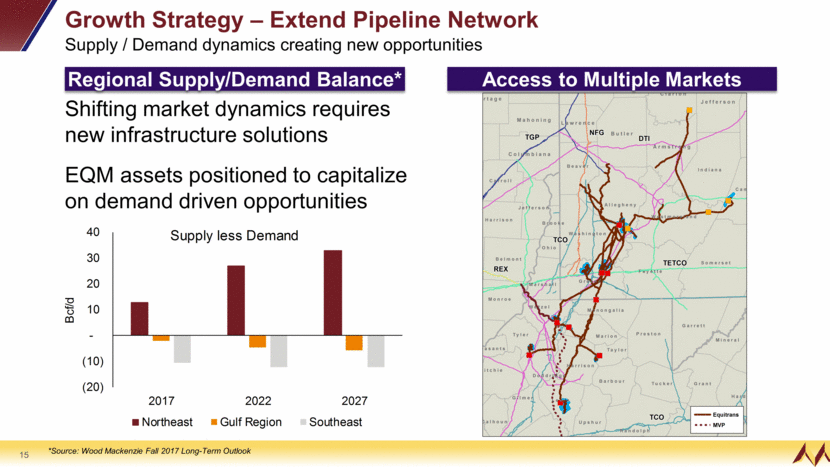
Shifting market dynamics requires new infrastructure solutions EQM assets positioned to capitalize on demand driven opportunities Growth Strategy – Extend Pipeline Network Supply / Demand dynamics creating new opportunities *Source: Wood Mackenzie Fall 2017 Long-Term Outlook Access to Multiple Markets Regional Supply/Demand Balance*
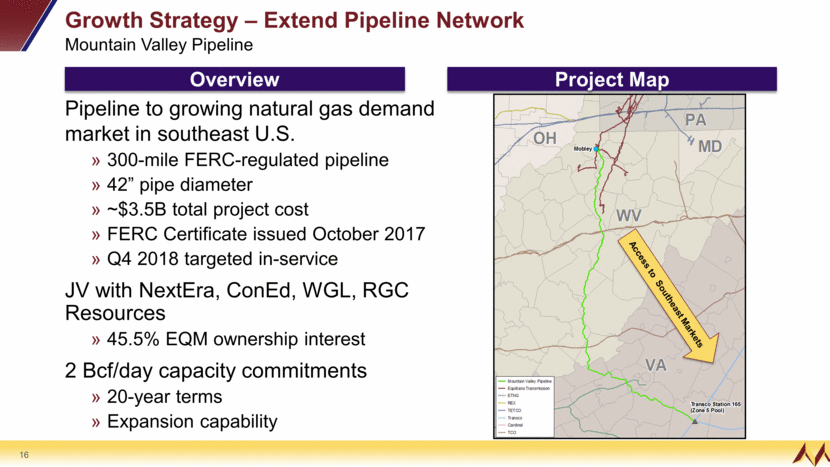
Pipeline to growing natural gas demand market in southeast U.S. 300-mile FERC-regulated pipeline 42” pipe diameter ~$3.5B total project cost FERC Certificate issued October 2017 Q4 2018 targeted in-service JV with NextEra, ConEd, WGL, RGC Resources 45.5% EQM ownership interest 2 Bcf/day capacity commitments 20-year terms Expansion capability Growth Strategy – Extend Pipeline Network Mountain Valley Pipeline Access to Southeast Markets Project Map Overview
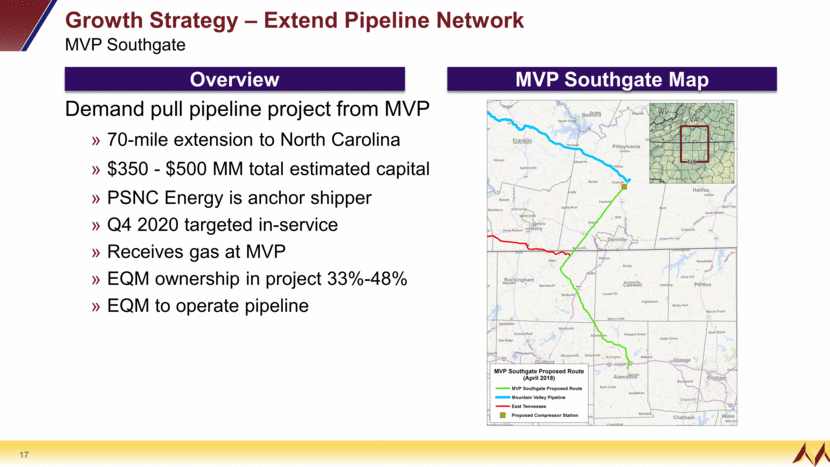
Demand pull pipeline project from MVP 70-mile extension to North Carolina $350 - $500 MM total estimated capital PSNC Energy is anchor shipper Q4 2020 targeted in-service Receives gas at MVP EQM ownership in project 33%-48% EQM to operate pipeline Growth Strategy – Extend Pipeline Network MVP Southgate MVP Southgate Map Overview
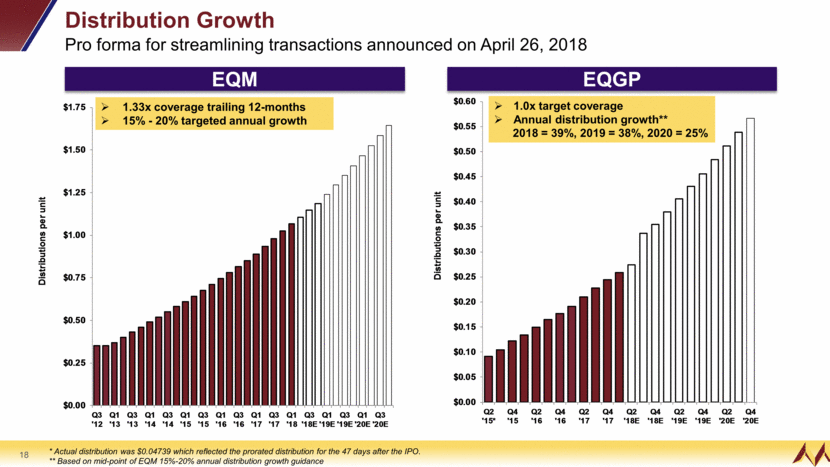
Distribution Growth Pro forma for streamlining transactions announced on April 26, 2018 1.0x target coverage Annual distribution growth** 2018 = 39%, 2019 = 38%, 2020 = 25% 1.33x coverage trailing 12-months 15% - 20% targeted annual growth * Actual distribution was $0.04739 which reflected the prorated distribution for the 47 days after the IPO. ** Based on mid-point of EQM 15%-20% annual distribution growth guidance EQGP EQM
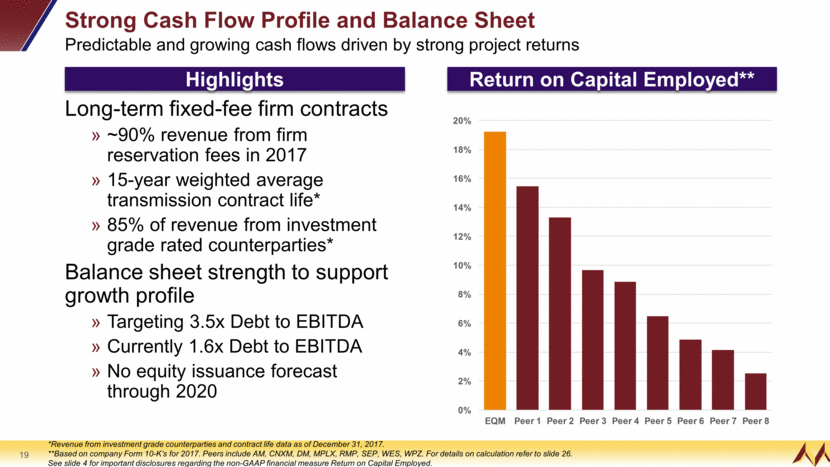
Long-term fixed-fee firm contracts ~90% revenue from firm reservation fees in 2017 15-year weighted average transmission contract life* 85% of revenue from investment grade rated counterparties* Balance sheet strength to support growth profile Targeting 3.5x Debt to EBITDA Currently 1.6x Debt to EBITDA No equity issuance forecast through 2020 Strong Cash Flow Profile and Balance Sheet Predictable and growing cash flows driven by strong project returns *Revenue from investment grade counterparties and contract life data as of December 31, 2017. **Based on company Form 10-K’s for 2017. Peers include AM, CNXM, DM, MPLX, RMP, SEP, WES, WPZ. For details on calculation refer to slide 26. See slide 4 for important disclosures regarding the non-GAAP financial measure Return on Capital Employed. Return on Capital Employed** Highlights
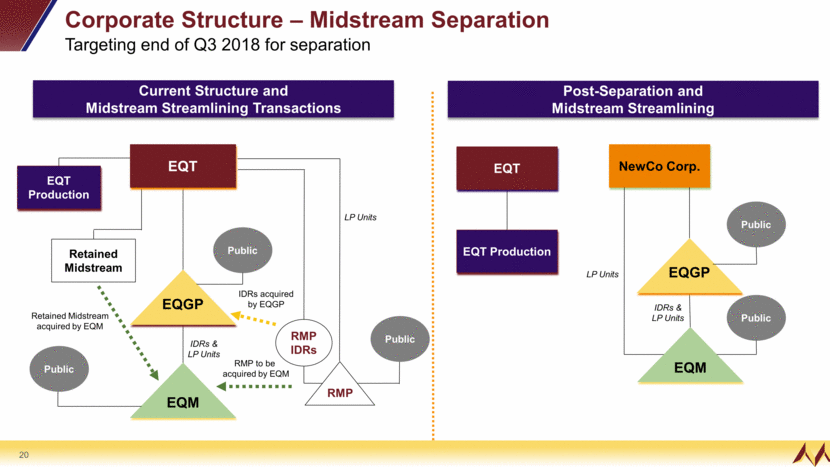
Corporate Structure – Midstream Separation Targeting end of Q3 2018 for separation EQGP Retained Midstream Public RMP IDRs RMP EQM EQT Production NewCo Corp. Public Public Public Public EQT EQT Production EQT RMP to be acquired by EQM EQGP EQM LP Units LP Units IDRs & LP Units IDRs & LP Units Current Structure and Midstream Streamlining Transactions Post-Separation and Midstream Streamlining Retained Midstream acquired by EQM IDRs acquired by EQGP
Investment Highlights Growing Third-party Business Significant Revenue from Capacity Reservation Charges 15%-20% Annual Distribution Growth (EQM) ~$4.8B Organic Growth Project Backlog Pro Forma for RMP Acquisition Premier Assets in the Marcellus / Utica Revenue Backed by Long-term Demand Based Contracts Strong Balance Sheet ~1.6x Debt/EBITDA 1.33x EQM Coverage Ratio over trailing 12-months
APPENDIX

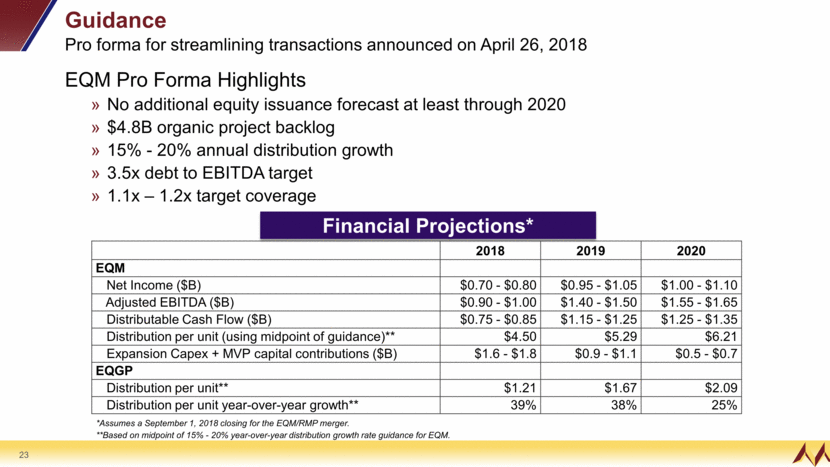
Guidance Pro forma for streamlining transactions announced on April 26, 2018 EQM Pro Forma Highlights No additional equity issuance forecast at least through 2020 $4.8B organic project backlog 15% - 20% annual distribution growth 3.5x debt to EBITDA target 1.1x – 1.2x target coverage Financial Projections* 2018 2019 2020 EQM Net Income ($B) $0.70 - $0.80 $0.95 - $1.05 $1.00 - $1.10 Adjusted EBITDA ($B) $0.90 - $1.00 $1.40 - $1.50 $1.55 - $1.65 Distributable Cash Flow ($B) $0.75 - $0.85 $1.15 - $1.25 $1.25 - $1.35 Distribution per unit (using midpoint of guidance)** $4.50 $5.29 $6.21 Expansion Capex + MVP capital contributions ($B) $1.6 - $1.8 $0.9 - $1.1 $0.5 - $0.7 EQGP Distribution per unit** $1.21 $1.67 $2.09 Distribution per unit year-over-year growth** 39% 38% 25% *Assumes a September 1, 2018 closing for the EQM/RMP merger. **Based on midpoint of 15% - 20% year-over-year distribution growth rate guidance for EQM.
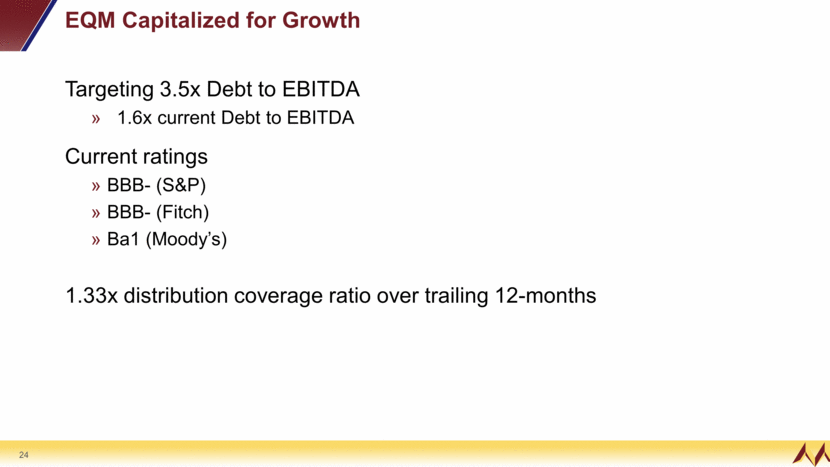
EQM Capitalized for Growth Targeting 3.5x Debt to EBITDA 1.6x current Debt to EBITDA Current ratings BBB- (S&P) BBB- (Fitch) Ba1 (Moody’s) 1.33x distribution coverage ratio over trailing 12-months
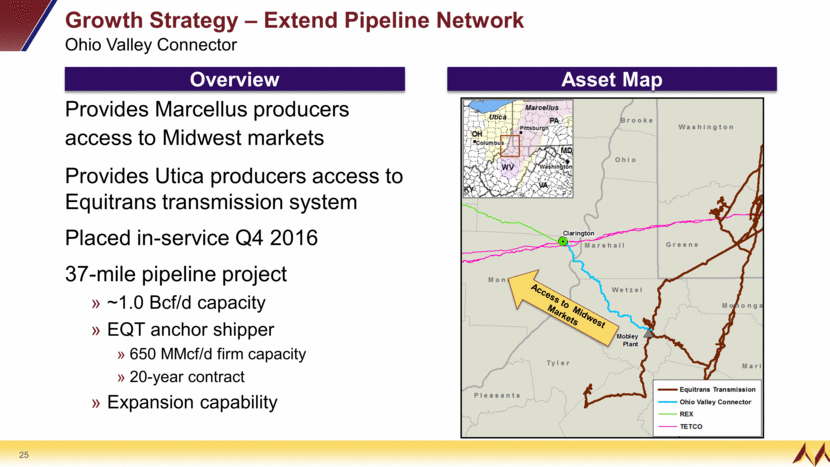
Provides Marcellus producers access to Midwest markets Provides Utica producers access to Equitrans transmission system Placed in-service Q4 2016 37-mile pipeline project ~1.0 Bcf/d capacity EQT anchor shipper 650 MMcf/d firm capacity 20-year contract Expansion capability Growth Strategy – Extend Pipeline Network Ohio Valley Connector Access to Midwest Markets Asset Map Overview
Return on Capital Employed EQM 2017 Calculation* Definition *Source: 2017 Form 10-K See slide 4 for important disclosures regarding the non-GAAP financial measure Return on Capital Employed. Earnings Before Interest and Taxes (EBIT) Average Capital Employed Capital Employed = Total Assets - Current Liabilities Return on Capital Employed =