Attached files
| file | filename |
|---|---|
| 8-K - 8-K - BBVA USA Bancshares, Inc. | bbvacompass8-k20180518.htm |

Fixed Income Investor Update BBVA Compass Bancshares, Inc. May 2018
“Safe Harbor” Forward Looking Statements The following should be read in conjunction with the financial statements, notes and other information contained in BBVA Compass Bancshares, Inc.’s (the “Company”) Annual Report on Form 10-K, Quarterly Reports on Form 10-Q and Current Reports on Form 8-K. This presentation includes non-GAAP financial measures to describe the Company’s performance. Reconciliation of those non-GAAP measures are provided within or in the appendix of this presentation. Additionally, certain ratios are presented on an annualized basis for comparison, which is the preferred industry standard. Certain statements in this presentation may contain forward-looking statements about the Company and its industry that involve substantial risks and uncertainties. Statements other than statements of current or historical fact, including statements regarding our future financial condition, results of operations, business plans, liquidity, cash flows, projected costs, and the impact of any laws or regulations applicable to the Company, constitute forward-looking statements as defined by the Private Securities Litigation Reform Act of 1995. Words such as “anticipates,” “believes,” “estimates,” “expects,” “forecasts,” “intends,” “plans,” “projects,” “may,” “will,” “should,” and other similar expressions are intended to identify these forward-looking statements. These forward-looking statements reflect the Company’s views regarding future events and financial performance. Such statements are subject to risks, uncertainties, assumptions and other important factors, many of which may be beyond the Company’s control, that could cause actual results to differ materially from anticipated results. If the Company’s assumptions and estimates are incorrect, or if the Company becomes subject to significant limitations as the result of litigation or regulatory action, then the Company’s actual results could vary materially from those expressed or implied in these forward-looking statements. The forward-looking statements are and will be based on the Company’s then current views and assumptions regarding future events and speak only as of their dates made. The Company assumes no obligation to update any forward-looking statement, whether as a result of new information, future events or otherwise, except as required by securities law. For further information regarding risks and uncertainties associated with the Company’s business, please refer to the “Risk Factors” section of the Company’s Annual Report on Form 10-K filed with the U.S. Securities and Exchange Commission on 2/28/18, as updated by the Company’s subsequent SEC filings. 1Q18 Financial Update / 2

Index 4 Overview and Organizational Structure 10 1Q18 Financial Summary 14 Margin & Balance Sheet Trends 21 Asset Quality Overview 25 Liquidity & Capital 1Q18 Financial Update / 3

BBVA: Overview of BBVA Data as of Mar 31, 2018 1Q18 Financial Update / 4
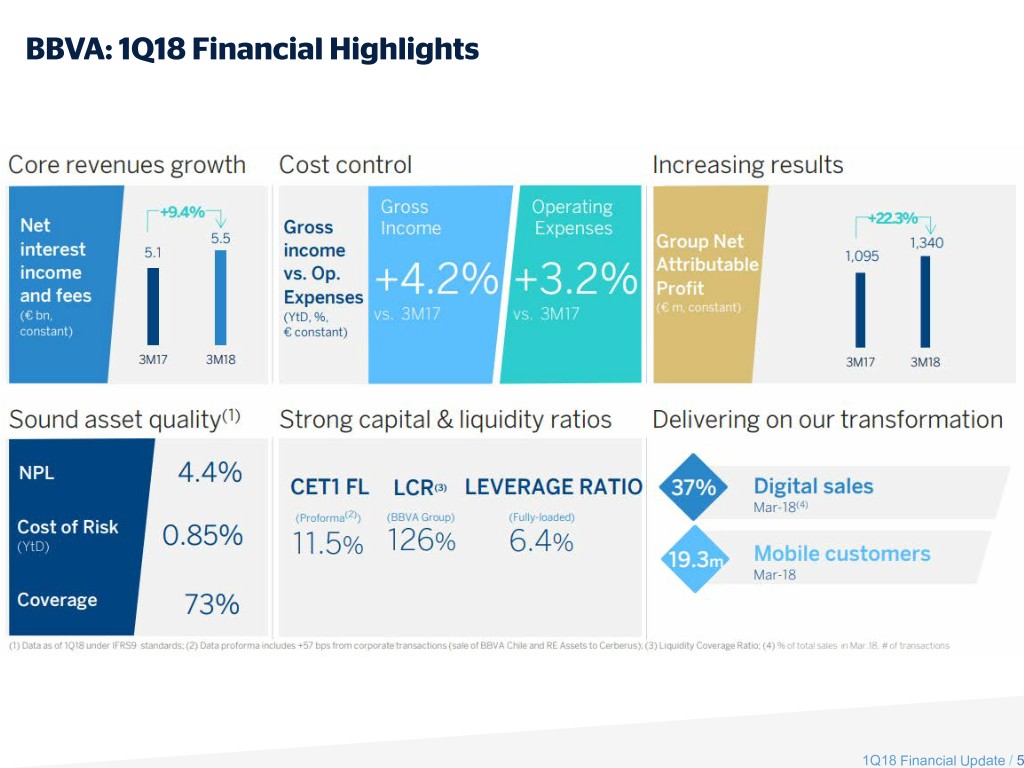
BBVA: 1Q18 Financial Highlights 1Q18 Financial Update / 5

BBVA: Improving Ratings Profile (1) A security rating is not a recommendation to buy, sell or hold securities. The rating is subject to revision or withdrawal at any time by the assigning rating organization. 1Q18 Financial Update / 6
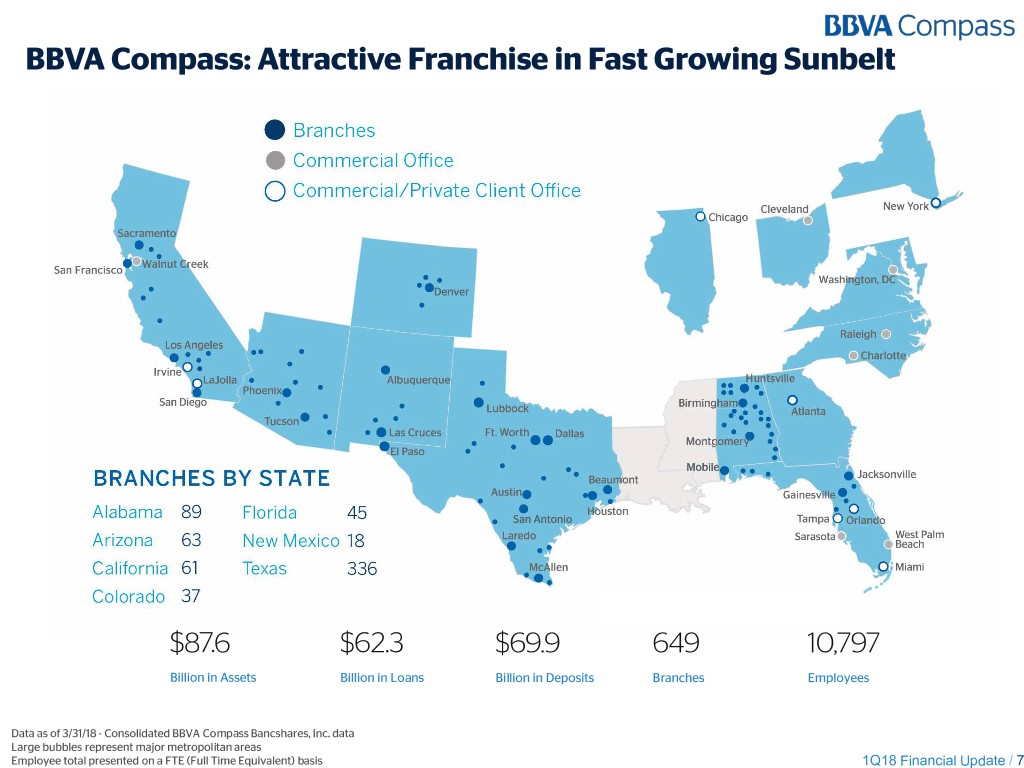
BBVA Compass: Attractive Franchise in Fast Growing Sunbelt $87.6 $62.3 $69.9 649 10,797 Billion in Assets Billion in Loans Billion in Deposits Branches Employees Data as of 3/31/18 - Consolidated BBVA Compass Bancshares, Inc. data Large bubbles represent major metropolitan areas Employee total presented on a FTE (Full Time Equivalent) basis 1Q18 Financial Update / 7
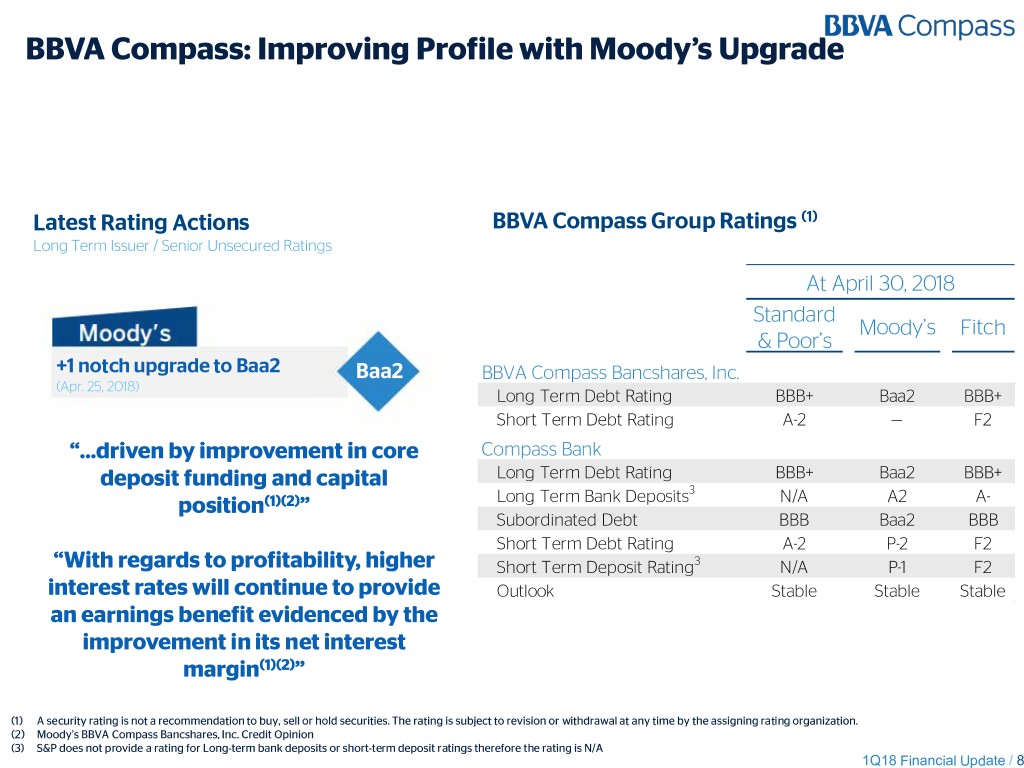
BBVA Compass: Improving Profile with Moody’s Upgrade Latest Rating Actions BBVA Compass Group Ratings (1) Long Term Issuer / Senior Unsecured Ratings At April 30, 2018 Standard Moody’s Fitch & Poor’s +1 notch upgrade to Baa2 Baa2 BBVA Compass Bancshares, Inc. (Apr. 25, 2018) Long Term Debt Rating BBB+ Baa2 BBB+ Short Term Debt Rating A-2 — F2 “…driven by improvement in core Compass Bank Long Term Debt Rating BBB+ Baa2 BBB+ deposit funding and capital 3 position(1)(2)” Long Term Bank Deposits N/A A2 A- Subordinated Debt BBB Baa2 BBB Short Term Debt Rating A-2 P-2 F2 “With regards to profitability, higher Short Term Deposit Rating3 N/A P-1 F2 interest rates will continue to provide Outlook Stable Stable Stable an earnings benefit evidenced by the improvement in its net interest margin(1)(2)” (1) A security rating is not a recommendation to buy, sell or hold securities. The rating is subject to revision or withdrawal at any time by the assigning rating organization. (2) Moody’s BBVA Compass Bancshares, Inc. Credit Opinion (3) S&P does not provide a rating for Long-term bank deposits or short-term deposit ratings therefore the rating is N/A 1Q18 Financial Update / 8
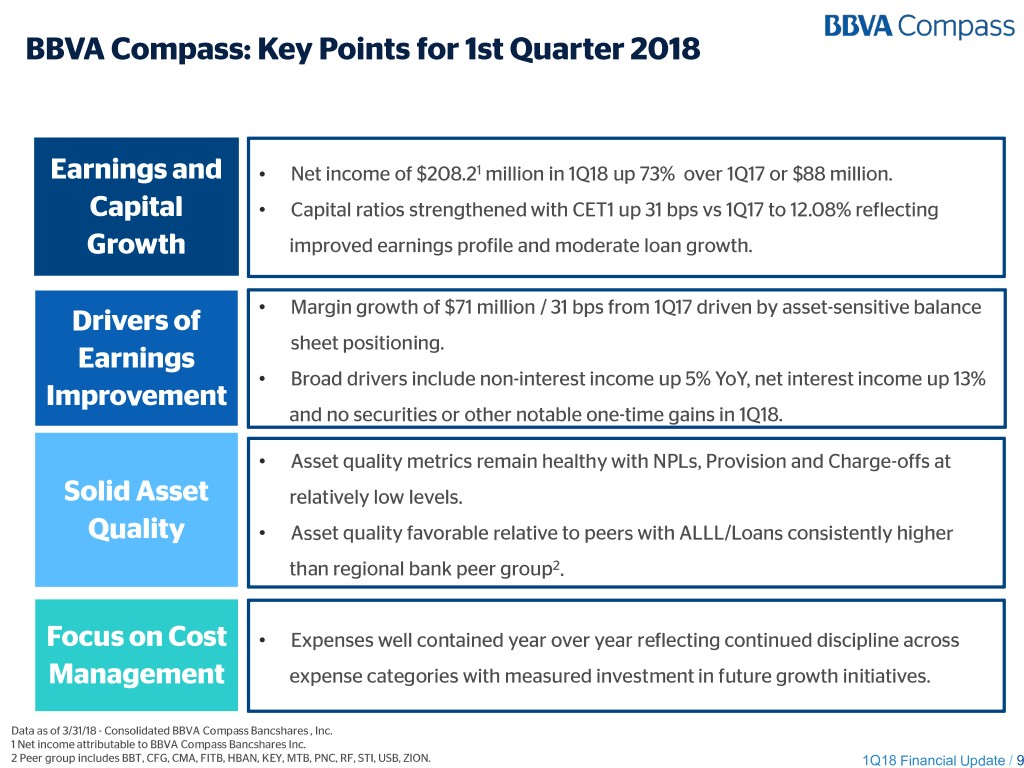
BBVA Compass: Key Points for 1st Quarter 2018 Earnings and • Net income of $208.21 million in 1Q18 up 73% over 1Q17 or $88 million. Capital • Capital ratios strengthened with CET1 up 31 bps vs 1Q17 to 12.08% reflecting Growth improved earnings profile and moderate loan growth. Margin growth of $71 million / 31 bps from 1Q17 driven by asset-sensitive balance Drivers of • sheet positioning. Earnings • Broad drivers include non-interest income up 5% YoY, net interest income up 13% Improvement and no securities or other notable one-time gains in 1Q18. • Asset quality metrics remain healthy with NPLs, Provision and Charge-offs at Solid Asset relatively low levels. Quality • Asset quality favorable relative to peers with ALLL/Loans consistently higher than regional bank peer group2. Focus on Cost • Expenses well contained year over year reflecting continued discipline across Management expense categories with measured investment in future growth initiatives. Data as of 3/31/18 - Consolidated BBVA Compass Bancshares , Inc. 1 Net income attributable to BBVA Compass Bancshares Inc. 2 Peer group includes BBT, CFG, CMA, FITB, HBAN, KEY, MTB, PNC, RF, STI, USB, ZION. 1Q18 Financial Update / 9

1Q18 Financial Update / 10 1Q18 Financial Summary

1Q18 Financial Summary % Change % Change $ in millions 1Q17 4Q17 1Q18 QoQ YoY Net interest income 551.4 603.5 622.6 3 13 Noninterest income 244.7 297.2 257.8 (13) 5 Revenues 796.1 900.7 880.4 (2) 11 Noninterest expense 549.3 615.8 562.9 (9) 2 Operating income 246.8 284.9 317.5 11 29 Provision 80.1 58.8 57.0 (3) (29) Pre-Tax income 166.7 226.1 260.5 15 56 Tax expense 45.8 174.0 51.8 (70) 13 Noncontrolling interest 0.4 0.5 0.5 - 25 Net income attributable to BBVA 120.4 51.5 208.2 304 73 Compass Bancshares, Inc. Total loans ($B) 59.8 61.7 62.3 1 4 Total deposits ($B) 67.5 69.3 69.9 1 4 Net Interest Margin (%) 2.96 3.22 3.27 5 bps 31 bps Solid asset quality metrics with Solid growth in operating NPLs/Loans down 38 bps YoY Favorable tax rate following last income. Improved margin improving ALLL/NPL year’s tax law resulting in income helping drive operating coverage and provision benefit to 1Q18 net income leverage on revenue gains expense down 29% from 1Q17 1Q18 Financial Update / 11

1Q18 Noninterest Income % Change % Change $ in millions 1Q17 4Q17 1Q18 QoQ YoY Service charges on deposits 55.2 56.1 56.2 - 2 Card/Merchant processing fees 30.0 33.4 39.7 19 32 Retail investment sales 27.5 26.3 30.1 14 9 Investment banking & advisory fees 28.3 25.0 23.9 (4) (16) Money transfer income 25.2 24.1 20.7 (14) (18) Asset management fees 9.8 10.3 10.8 5 10 Corp. and Corr. investment sales 8.9 11.8 12.1 3 36 Mortgage banking income 2.9 4.7 8.4 79 190 Other income1 57.0 105.5 56.1 (47) (2) Total noninterest income 244.7 297.2 257.8 (13) 5 Broad based improvement in Higher Card/Merchant fees Increase in Corporate & key fee consumer income driven by strong growth in Correspondent investment categories net checking accounts and sales driven by higher bond gains from 2H17 campaigns trading activity 1 Other income includes all noninterest income items not specifically broken out, as detailed in BBVA Compass Bancshares, Inc. public filings. 1Q18 Financial Update / 12
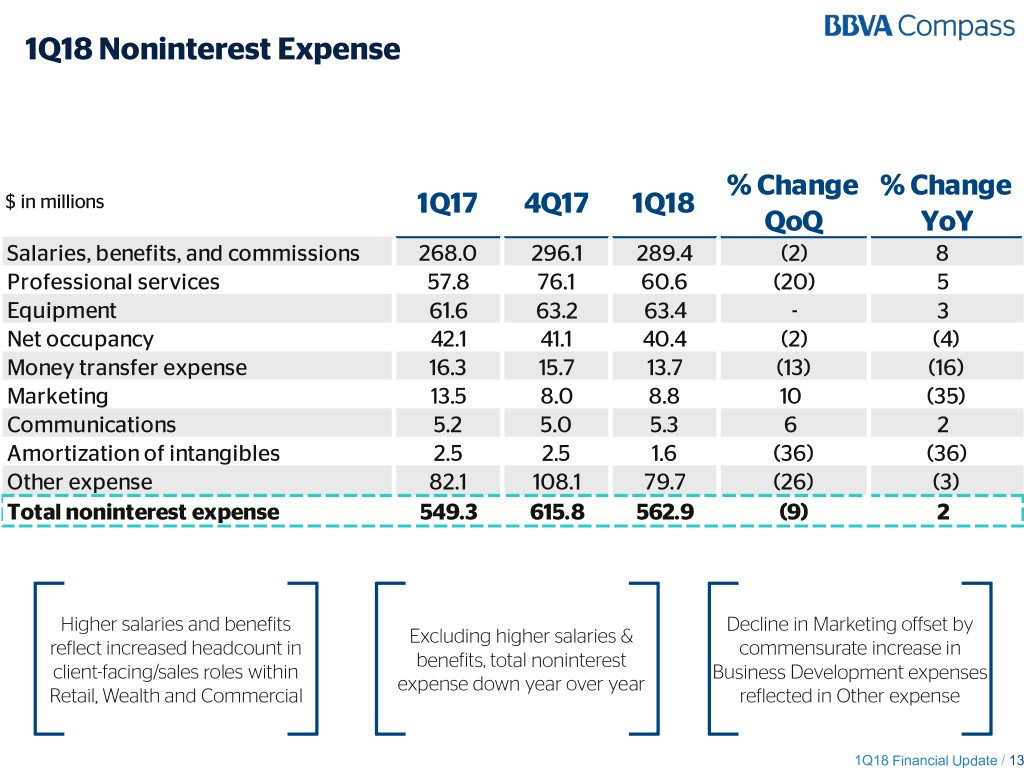
1Q18 Noninterest Expense % Change % Change $ in millions 1Q17 4Q17 1Q18 QoQ YoY Salaries, benefits, and commissions 268.0 296.1 289.4 (2) 8 Professional services 57.8 76.1 60.6 (20) 5 Equipment 61.6 63.2 63.4 - 3 Net occupancy 42.1 41.1 40.4 (2) (4) Money transfer expense 16.3 15.7 13.7 (13) (16) Marketing 13.5 8.0 8.8 10 (35) Communications 5.2 5.0 5.3 6 2 Amortization of intangibles 2.5 2.5 1.6 (36) (36) Other expense 82.1 108.1 79.7 (26) (3) Total noninterest expense 549.3 615.8 562.9 (9) 2 Higher salaries and benefits Decline in Marketing offset by Excluding higher salaries & reflect increased headcount in commensurate increase in benefits, total noninterest client-facing/sales roles within Business Development expenses expense down year over year Retail, Wealth and Commercial reflected in Other expense 1Q18 Financial Update / 13
1Q18 Financial Update / 14 Margin & Balance Sheet Trends
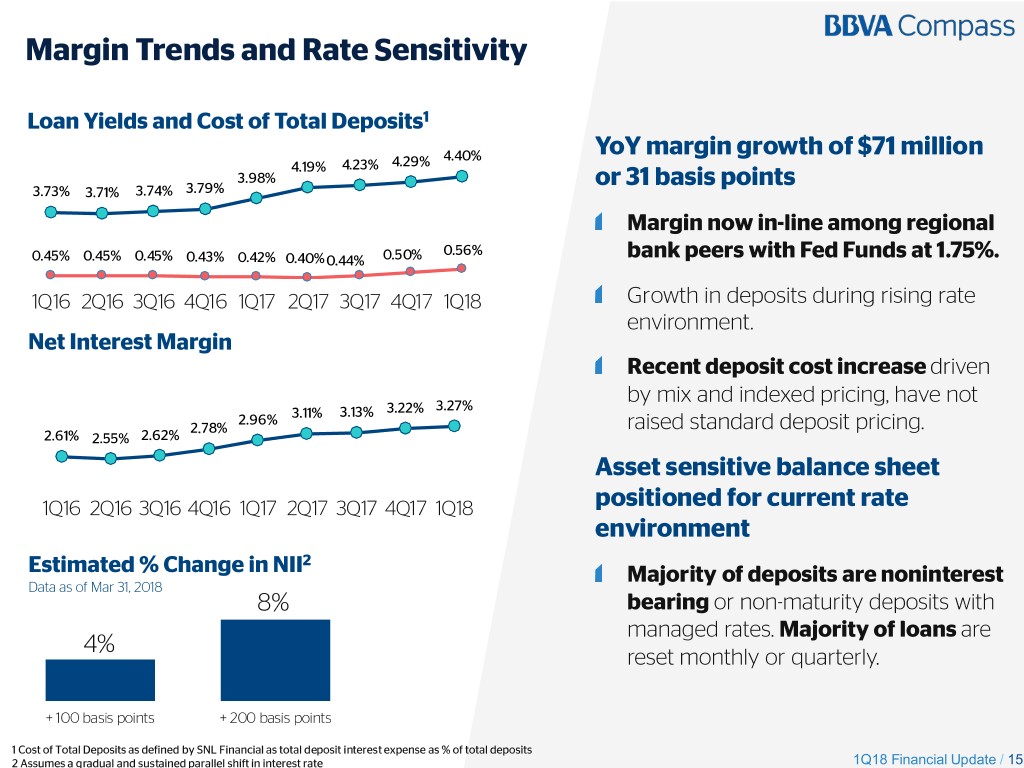
Margin Trends and Rate Sensitivity Loan Yields and Cost of Total Deposits1 % 4.40% 2.90% YoY margin growth of $71 million 4.19% 4.23% 4.29% % 3.98% 2.40% or 31 basis points 3.73% 3.71% 3.74% 3.79% 0% 1.90% % 1.40% Margin now in-line among regional % 0.56% 0.90% 0.45% 0.45% 0.45% 0.43% 0.42% 0.40% 0.44% 0.50% bank peers with Fed Funds at 1.75%. % 0.40% 1Q16 2Q16 3Q16 4Q16 1Q17 2Q17 3Q17 4Q17 1Q18 Growth in deposits during rising rate environment. Net Interest Margin Recent deposit cost increase driven by mix and indexed pricing, have not 3.13% 3.22% 3.27% 2.96% 3.11% 2.78% raised standard deposit pricing. 2.61% 2.55% 2.62% Asset sensitive balance sheet 1Q16 2Q16 3Q16 4Q16 1Q17 2Q17 3Q17 4Q17 1Q18 positioned for current rate environment 2 Estimated % Change in NII Majority of deposits are noninterest Data as of Mar 31, 2018 8% bearing or non-maturity deposits with managed rates. Majority of loans are 4% reset monthly or quarterly. + 100 basis points + 200 basis points 1 Cost of Total Deposits as defined by SNL Financial as total deposit interest expense as % of total deposits 2 Assumes a gradual and sustained parallel shift in interest rate 1Q18 Financial Update / 15

1Q18 Loan Portfolio Trends Loan Portfolio Historical CF&A CRE Resi Mortgage Other Consumer Loans Other $61.4 $60.4 $61.7 $62.3 $0.5 $60.2 $60.0 $0.1 $0.1 $57.5 $0.5 $59.8$0.4 $0.4 $0.1 +1.0% $0.7 $8.1 $8.5 $8.9 $8.0 $8.0 $8.1 $8.2 QoQ $50.8 $7.1 $0.9 $45.3 $6.2 $13.4 $13.3 $14.0 $13.3 $13.1 $13.1 $13.4 $13.9 $5.8 $12.7 +4.2% $14.0 $13.7 YoY $11.4 $12.8 $13.3 $13.6 $13.8 $13.5 $12.0 $10.8 $9.6 $26.4 $23.8 $26.0 $25.1 $24.7 $24.6 $25.1 $25.7 $20.2 $17.0 2012 2013 2014 2015 2016 1Q17 2Q17 3Q17 4Q17 1Q18 Annual Quarterly Modest year over year loan growth driven by CF&A and Consumer Lending CF&A: Commercial, Financial & Agricultural “CRE” consists of Commercial Real Estate Mortgage and Commercial Real Estate Construction 1Q18 Financial Update // 16
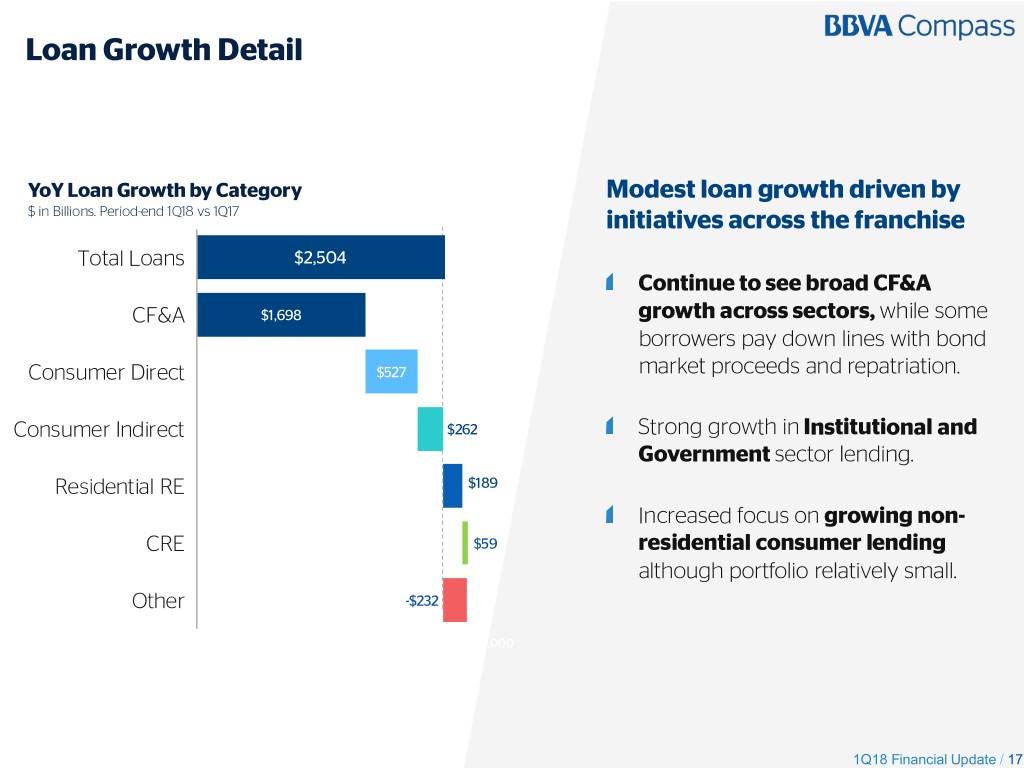
Loan Growth Detail YoY Loan Growth by Category Modest loan growth driven by $ in Billions. Period-end 1Q18 vs 1Q17 initiatives across the franchise Total Loans $2,504 Continue to see broad CF&A CF&A $1,698 growth across sectors, while some borrowers pay down lines with bond Consumer Direct $527 market proceeds and repatriation. Consumer Indirect $262 Strong growth in Institutional and Government sector lending. Residential RE $189 Increased focus on growing non- CRE $59 residential consumer lending although portfolio relatively small. Other -$232 $0 $500 $1,000 $1,500 $2,000 $2,500 $3,000 1Q18 Financial Update / 17

Growth Focus: Small Business Lending Market leading small business Small Business Loan & Deposit Detail franchise with high return $ in Billions. Period-end 1Q18 profile helping drive profitable growth. Solid year over year growth in small business loans coupled with notably low cost deposit composition (~75% DDA balances). Several marketing partnerships to help raise profile for Small Business In 2017, BBVA Compass was the th lending and deposit growth. 6 most-active lender by total number of loans and 10th by dollar volume1 in the SBA flagship 7(a) loan program. 1 Small Business Loan Administration Data Small Business Lending is defined within the Retail Segment as Small Business Administration ("SBA") eligible loans and other lending products to small businesses with revenues up to $10mm. 1Q18 Financial Update / 18

Commercial Real Estate Growth Slightly lower balances reflecting industry-wide trend of borrowers paying off Commercial Real Estate Loan Trends existing CRE commitments. $ in Billions. Period-end balances Annual Quarterly Geographic growth trends Commercial real estate – mortgage Real estate – construction mixed, with solid recent $14.9 $13.8 $14.0 $13.7 $13.3 $13.6 $13.5 performance led by California, $12.8 $12.0 $2.3 $2.3 $2.2 with modestly lower balances $11.6 $2.1 $2.2 $2.2 $10.6 $10.8 $2.4 in Alabama. $7.8 $2.2 $9.6 $1.7 $4.5 Industries mixed with healthy $3.4 $1.9 growth in Industrial and Office, offset by slower trends in $11.2 $11.4 $11.5 $11.3 $11.7 $11.5 $9.9 $10.5 Multi-Family, Retail and $9.1 $7.7 Hotel/Motel. $7.1 $7.1 $7.2 2009 2010 2011 2012 2013 2014 2015 2016 1Q17 2Q17 3Q17 4Q17 1Q18 1Q18 Financial Update / 19

Deposit Funding Mix $ in Billions. Period-end Noninterest DDA Savings & Money Market Time Deposits Interest Bearing DDA $69.3 $69.9 $66.0 $67.3 $67.5 $65.6 $67.2 Customer deposit growth in $8.6 $61.2 $8.6 $7.9 $8.4 $7.4 $8.2 $7.8 second half of last year outpaced $54.4 $7.7 $51.6 $13.8 $13.4 $12.1 $13.5 $13.9 $7.7 $14.0 $12.1 loan growth. $6.7 $12.7 $12.0 $12.1 Loan & deposit trends continued $25.4 $25.4 $25.8 $25.2 $25.3 $24.7 $24.7 $23.4 into the first quarter of 2018. $18.3 $19.3 Expect historical seasonal trends to $21.5 $21.0 $21.1 $21.6 $21.8 $17.2 $19.3 $20.3 $14.4 $15.4 play out in second quarter. 2012 2013 2014 2015 2016 1Q17 2Q17 3Q17 4Q17 1Q18 Customer deposits up 2% QoQ Annual Quarterly and 1% YoY. Avg. 1M LIBOR Total Cost of Deposits 1.65% 1.23% 1.33% 1.06% 0.83% 0.60% 0.45% 0.45% 0.45% 0.43% 0.56% 0.44% 0.45% 0.43% 0.42% 0.40% 0.44% 0.50% 1Q16 2Q16 3Q16 4Q16 1Q17 2Q17 3Q17 4Q17 1Q18 Definitions | DDA: Demand Deposit Account, CD: Certificate of Deposit, Customer Deposits: Total deposits minus brokered deposits Total Cost of Deposits per SNL Financial as defined by total deposit interest expense over total deposits 1Q18 Financial Update / 20

1Q18 Financial Update / 21 Asset Quality Overview
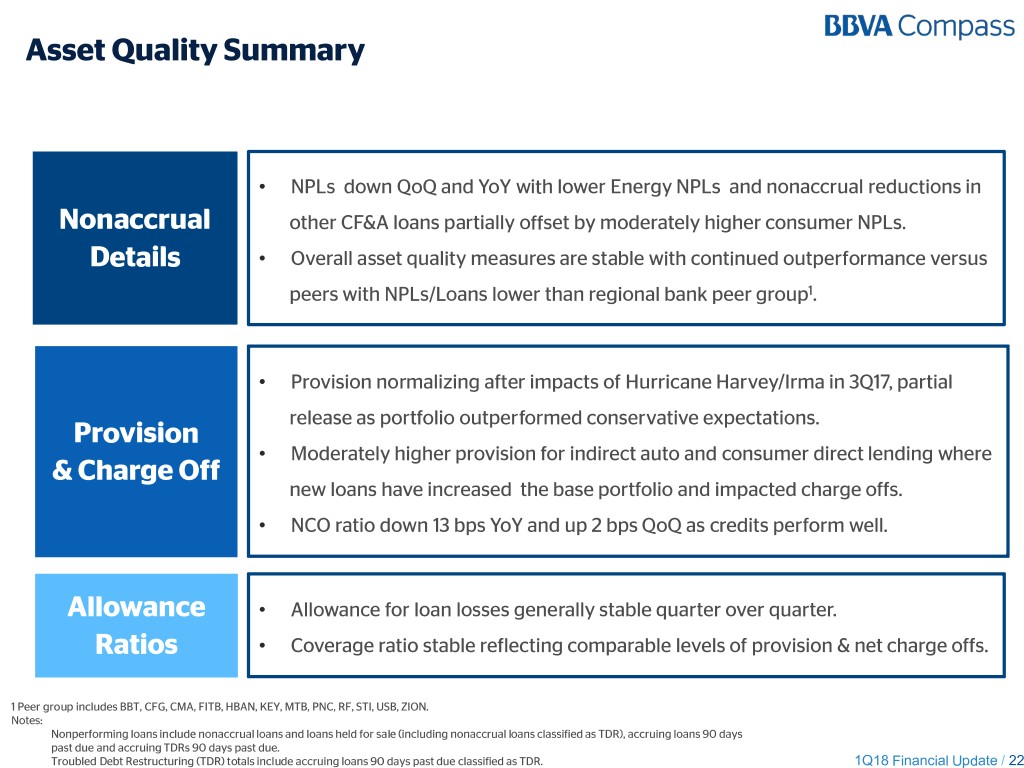
Asset Quality Summary • NPLs down QoQ and YoY with lower Energy NPLs and nonaccrual reductions in Nonaccrual other CF&A loans partially offset by moderately higher consumer NPLs. Details • Overall asset quality measures are stable with continued outperformance versus peers with NPLs/Loans lower than regional bank peer group1. • Provision normalizing after impacts of Hurricane Harvey/Irma in 3Q17, partial release as portfolio outperformed conservative expectations. Provision • Moderately higher provision for indirect auto and consumer direct lending where & Charge Off new loans have increased the base portfolio and impacted charge offs. • NCO ratio down 13 bps YoY and up 2 bps QoQ as credits perform well. Allowance • Allowance for loan losses generally stable quarter over quarter. Ratios • Coverage ratio stable reflecting comparable levels of provision & net charge offs. 1 Peer group includes BBT, CFG, CMA, FITB, HBAN, KEY, MTB, PNC, RF, STI, USB, ZION. Notes: Nonperforming loans include nonaccrual loans and loans held for sale (including nonaccrual loans classified as TDR), accruing loans 90 days past due and accruing TDRs 90 days past due. Troubled Debt Restructuring (TDR) totals include accruing loans 90 days past due classified as TDR. 1Q18 Financial Update / 22

Asset Quality Metrics Nonperforming Loans Nonaccrual loans + Past dues 90 days TDRs 90 Days Past Due & Accruing 2,554 Loans 90 Days Past Due & Accruing Energy Nonccruals 2,050 Nonaccruals 1,549 Credit quality remains solid Combined Separate Energy 983 893 869 821 711 718 694 Continued moderation of 526 477 396 problem loans following recovery in oil portfolio. 2009 2010 2011 2012 2013 2014 2015 2016 1Q17 2Q17 3Q17 4Q17 1Q18 Nonperforming Loans Hurricane Harvey and Irma proving Nonaccrual loans + Past dues 90 days to be less of a credit issue than initial 5.97% Annual Quarterly estimates. 5.07% 3.68% 1.92% 1.63% 1.49% 1.37% 1.03% 0.78% 1.18% 1.16% 1.11% 0.69% 2009 2010 2011 2012 2013 2014 2015 2016 1Q17 2Q17 3Q17 4Q17 1Q18 1Q18 Financial Update / 23

Reserve Coverage and Provision Metrics Net Charge Offs Provision Expense Quarters Percentage Annualized as a % of average loans ($ in millions) 2.87% $1,686 $1,151 2.37% Annual Quarterly $984 Annual Quarterly 1.19% 0.63% $825 0.44% 0.57% 0.47% 0.40% 0.42% 0.42% 0.44% $486 0.22% 0.19% $429 $278 $227 $210 $303 $122 $116 $194 $84 $62 $71 $65 $108 $106 $103 $68 $29 $80 $45 $59 $57 2009 2010 2011 2012 2013 2014 2015 2016 1Q17 2Q17 3Q17 4Q17 1Q18 2009 2010 2011 2012 2013 2014 2015 2016 1Q17 2Q17 3Q17 4Q17 1Q18 ALLL and ALLL / Total Loans ALLL to NPLs ($ in millions) Annual Quarterly 2.97% 2.75% 173% 2.51% 160% 135% $1,268 1.78% $1,109 119% 117% 120% 1.40% 1.37% 1.38% 1.24% 1.40% 1.36% 1.41% 1.34% $1,052 1.19% 93% 90% 93% 100% $803 $838 $834 $817 $849 $843 $701 $685 $763 $832 69% 55% 50% Annual Quarterly 2009 2010 2011 2012 2013 2014 2015 2016 1Q17 2Q17 3Q17 4Q17 1Q18 2009 2010 2011 2012 2013 2014 2015 2016 1Q17 2Q17 3Q17 4Q17 1Q18 1Q18 Financial Update / 24
1Q18 Financial Update / 25 Liquidity & Capital
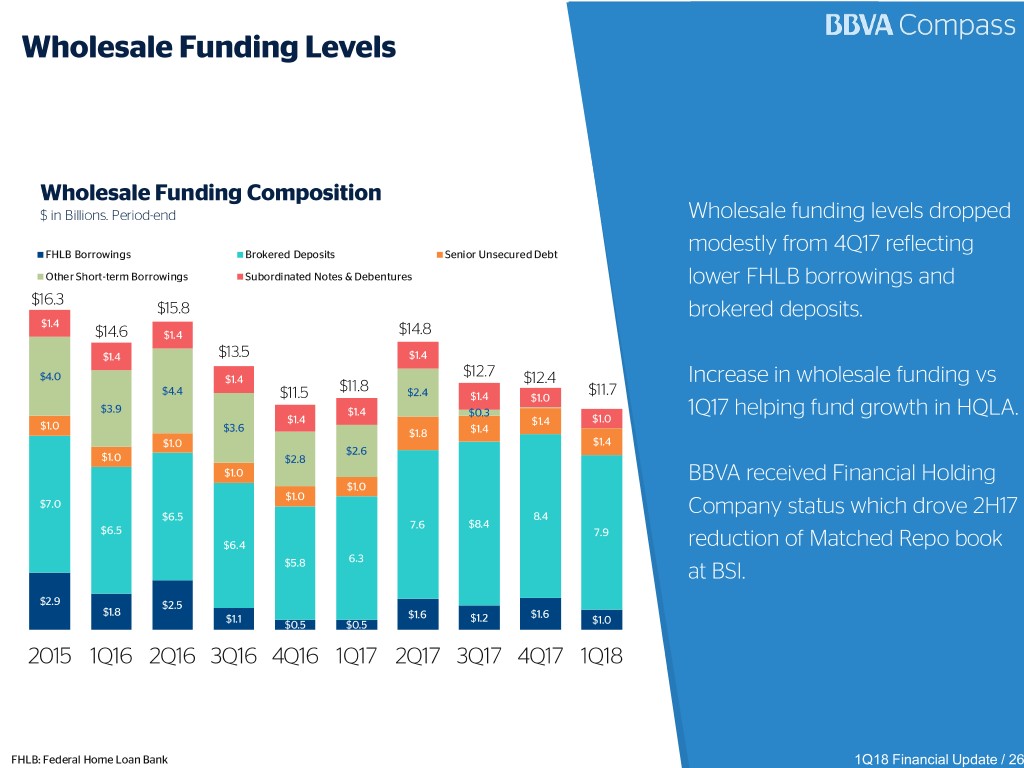
Wholesale Funding Levels Wholesale Funding Composition $ in Billions. Period-end Wholesale funding levels dropped .0 modestly from 4Q17 reflecting FHLB Borrowings Brokered Deposits Senior Unsecured Debt .0 Other Short-term Borrowings Subordinated Notes & Debentures lower FHLB borrowings and $16.3 $15.8 .0 brokered deposits. $1.4 $14.6 $1.4 $14.8 .0 $1.4 $13.5 $1.4 $12.7 $4.0 $1.4 $12.4 Increase in wholesale funding vs $4.4 $11.8 $2.4 $11.7 .0 $11.5 $1.4 $1.0 $3.9 $1.4 $0.3 1Q17 helping fund growth in HQLA. $1.4 $1.4 $1.0 $1.0 $3.6 .0 $1.8 $1.4 $1.0 $1.4 $2.6 $1.0 $2.8 .0 $1.0 BBVA received Financial Holding $1.0 $1.0 $7.0 Company status which drove 2H17 .0 $6.5 8.4 7.6 $8.4 $6.5 7.9 $6.4 reduction of Matched Repo book .0 6.3 $5.8 at BSI. .0 $2.9 $2.5 $1.8 $1.6 $1.1 $1.6 $1.2 $1.0 .0 $0.5 $0.5 2015 1Q16 2Q16 3Q16 4Q16 1Q17 2Q17 3Q17 4Q17 1Q18 FHLB: Federal Home Loan Bank 1Q18 Financial Update / 26

Senior and Subordinated Debt Maturity Schedule 350 750 700 600 400 228 71 2017 2018 2019 2020 2021 2022 2023 2024 2025 2026 Senior Subordinated Original par amounts on 2020 and 2026 Subordinated notes prior to tender offers were $300 mm and $275 mm, respectively. 1Q18 Financial Update / 27

Organizational Structure1 BBVA, S.A. $845 B in Assets (USD)2 BBVA Compass Bancshares, Inc. (Financial Holding Company Status) $88 B in Assets (USD) Compass Bank BBVA Compass Payments Inc. (BBVA Compass) $228 M in Assets (USD) Non-bank Financial Entity $87 B in Assets (USD) Insured Depository Institution BBVA Securities Inc. $480 MM in Assets (USD) Broker/Dealer 1 Abridged organizational representation of primary subsidiaries, does not include all entities, trusts, property companies, leasing companies or other holding entities. 2 BBVA assets reported in dollars under IFRS 9 with Euro at 1.2321 1Q18 Financial Update / 28
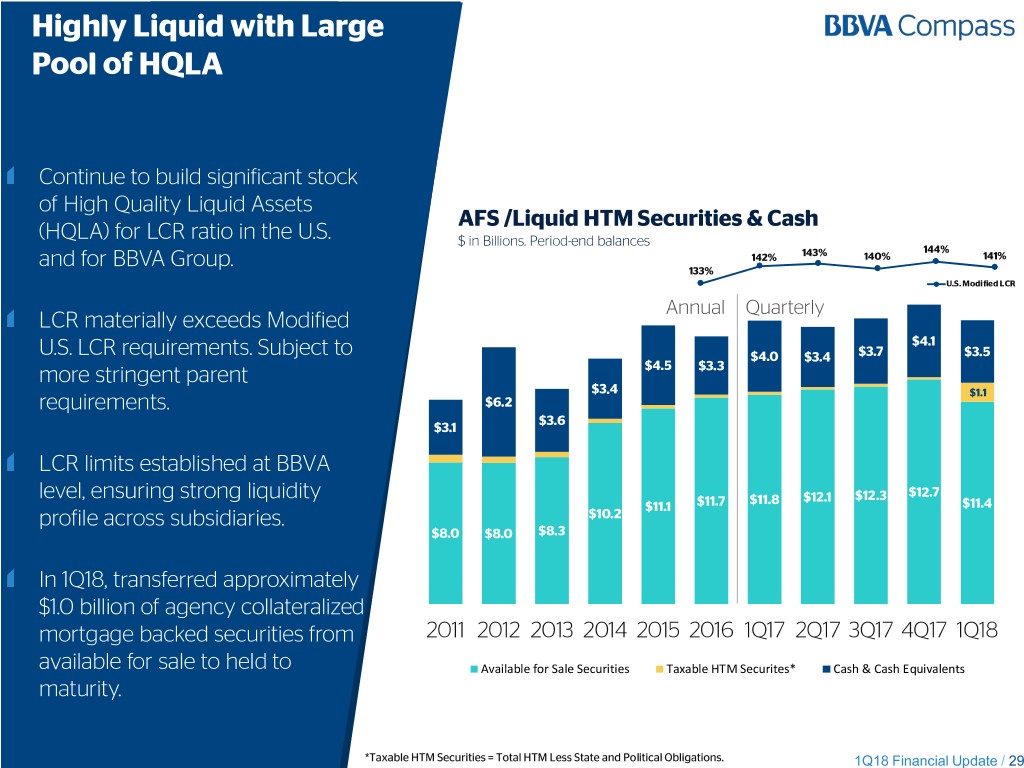
Highly Liquid with Large Pool of HQLA Continue to build significant stock of High Quality Liquid Assets AFS /Liquid HTM Securities & Cash (HQLA) for LCR ratio in the U.S. $ in Billions. Period-end balances 144% and for BBVA Group. 142% 143% 140% 141% 133% U.S. Modified LCR Annual Quarterly LCR materially exceeds Modified $4.1 U.S. LCR requirements. Subject to $4.0 $3.4 $3.7 $3.5 more stringent parent $4.5 $3.3 $3.4 $1.1 requirements. $6.2 $3.6 $3.1 LCR limits established at BBVA $12.7 level, ensuring strong liquidity $11.8 $12.1 $12.3 $11.1 $11.7 $11.4 profile across subsidiaries. $10.2 $8.0 $8.0 $8.3 In 1Q18, transferred approximately $1.0 billion of agency collateralized mortgage backed securities from 2011 2012 2013 2014 2015 2016 1Q17 2Q17 3Q17 4Q17 1Q18 available for sale to held to Available for Sale Securities Taxable HTM Securites* Cash & Cash Equivalents maturity. *Taxable HTM Securities = Total HTM Less State and Political Obligations. 1Q18 Financial Update / 29

Strong Capital Levels Tier 1 Common Equity Ratio (%) Period End 12.07 12.08 11.49 11.77 11.90 11.80 10.70 2014 2015 2016 1Q17 2Q17 3Q17 4Q17 1Q18 Tier 1 Capital Ratio (%) Period End 12.43 12.25 12.42 12.15 11.85 12.12 10.94 11.08 2014 2015 2016 1Q17 2Q17 3Q17 4Q17 1Q18 Total Capital Ratio (%) Period End 14.31 14.53 14.62 14.63 14.36 14.67 13.68 12.81 2014 2015 2016 1Q17 2Q17 3Q17 4Q17 1Q18 Buybacks not feasible reflecting ownership structure, making total capital distribution levels lower than regional peers1. 1 Peer group includes BBT, CFG, CMA, FITB, HBAN, KEY, MTB, PNC, RF, STI, USB, ZION. Note: 2014 Tier 1 Common Equity Ratio not calculated under BASEL III 1Q18 Financial Update / 30

Fixed Income Investor Update BBVA Compass Bancshares, Inc. May 2018
