Attached files
| file | filename |
|---|---|
| 8-K - 8-K - TRUSTCO BANK CORP N Y | form8k.htm |
Exhibit 99(a)

Welcome to the 2018 Annual Meeting

Shareholder Assembly Agenda Branch Growth & Future PlansIncome Statement & Ratio AnalysisDividends & CapitalStock PerformanceSome Things to be Proud ofQuestions and Answers

Deposit and Loan Growth($-000)

Number of Branches & Average Size
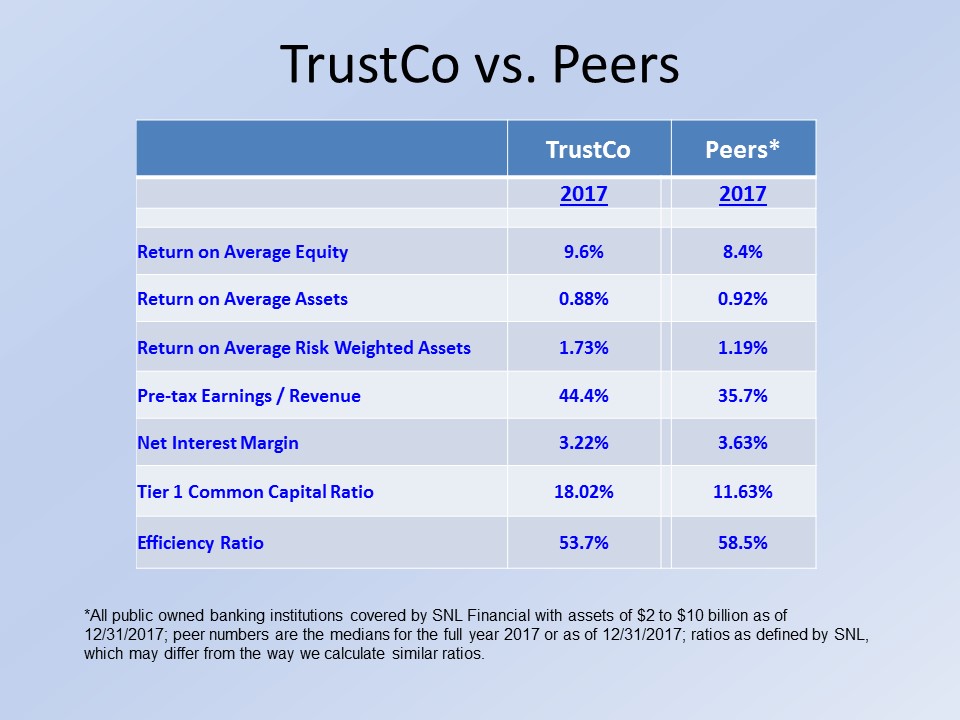
TrustCo vs. Peers *All public owned banking institutions covered by SNL Financial with assets of $2 to $10 billion as of 12/31/2017; peer numbers are the medians for the full year 2017 or as of 12/31/2017; ratios as defined by SNL, which may differ from the way we calculate similar ratios. TrustCo Peers* 2017 2017 Return on Average Equity 9.6% 8.4% Return on Average Assets 0.88% 0.92% Return on Average Risk Weighted Assets 1.73% 1.19% Pre-tax Earnings / Revenue 44.4% 35.7% Net Interest Margin 3.22% 3.63% Tier 1 Common Capital Ratio 18.02% 11.63% Efficiency Ratio 53.7% 58.5%
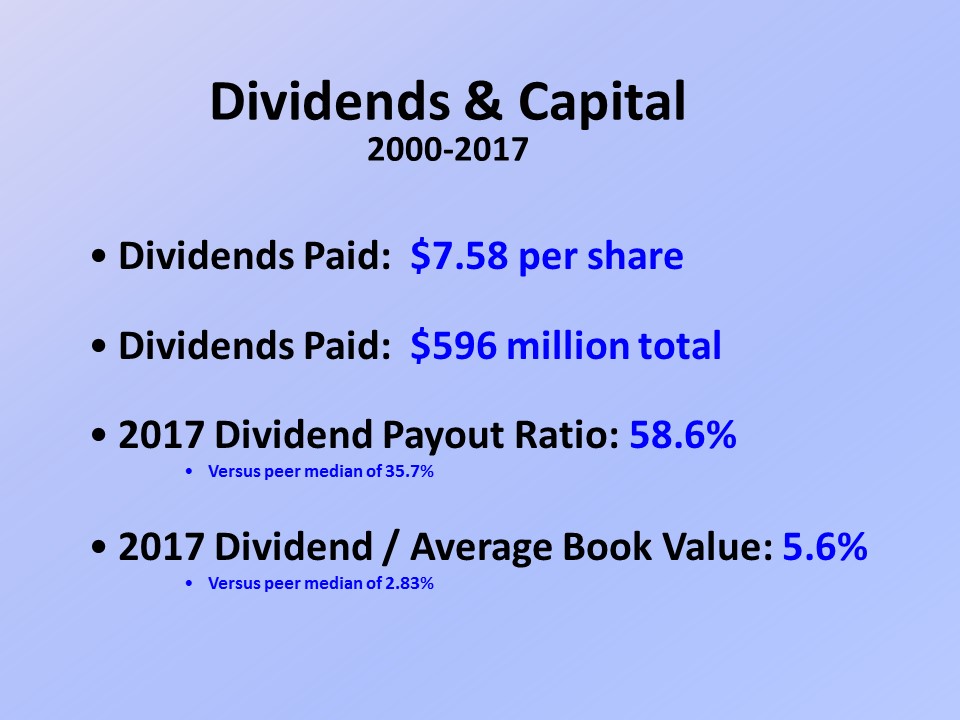
Dividends & Capital2000-2017 Dividends Paid: $7.58 per shareDividends Paid: $596 million total2017 Dividend Payout Ratio: 58.6%Versus peer median of 35.7%2017 Dividend / Average Book Value: 5.6%Versus peer median of 2.83%

2017 Stock PerformanceTRST Total Return %

Some Things To Be Proud Of 2017 Schenectady Holiday Parade
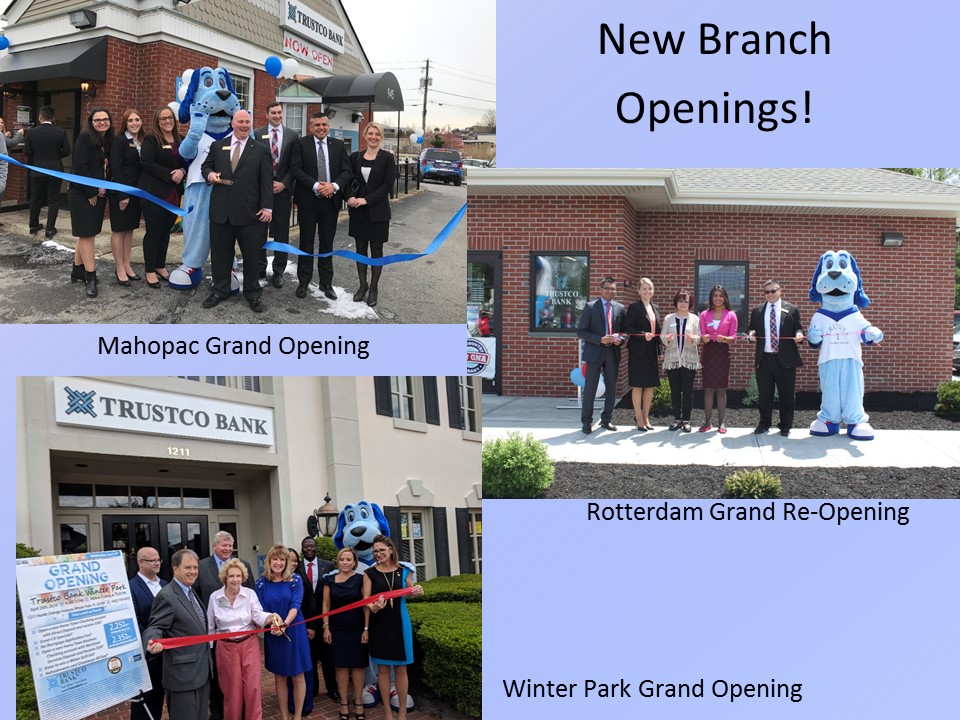
Mahopac Grand Opening Rotterdam Grand Re-Opening Winter Park Grand Opening New BranchOpenings!
Forward Looking Statements Safe Harbor Regarding Forward-Looking StatementsThis presentation may contain forward-looking information about TrustCo Bank Corp NY (“the Company”) that is intended to be covered by the safe harbor for forward-looking statements provided by the Private Securities Litigation Reform Act of 1995. Actual results and trends could differ materially from those set forth in such statements due to various risks, uncertainties and other factors. Such risks, uncertainties and other factors that could cause actual results and experience to differ from those projected include, but are not limited to, the following: credit risk, the effects of and changes in, trade, monetary and fiscal policies and laws, inflation, interest rates, market and monetary fluctuations, competition, the effect of changes in financial services laws and regulations, real estate and collateral values, changes in accounting policies and practices, changes in local market areas and general business and economic trends and the matters described under the heading “Risk Factors” in our most recent annual report on Form 10-K and our other securities filings. The statements are valid only as of the date hereof and the Company disclaims any obligation to update this information except as may be required by applicable law. Note: Data in this presentation was obtained from SNL Financial and from the Company’s SEC filings. Ratios use SNL definitions and may differ from definitions used by the Company in its own SEC filings. SNL definitions are available upon request.

2018 Annual Meeting Thank You for Attending