Attached files
| file | filename |
|---|---|
| 8-K - FORM 8-K - Quorum Health Corp | d590885d8k.htm |
Exhibit 99.1

Earnings Presentation First Quarter 2018 May 2018 Investor Presentation
Forward Looking Statements & Non-GAAP Financial Measures Except as otherwise indicated or unless the context otherwise requires, all references in this presentation to “we,” “our,” “us,” “QHC,” the “Company” or “Quorum Health” refer to Quorum Health Corporation and its subsidiaries. Forward-Looking Statements This presentation may contain certain forward-looking statements within the meaning the safe-harbor provisions of the Private Securities Litigation Reform Act of 1995. Forward-looking statements include all statements that do not relate solely to historical or current facts, including, but not limited to, statements regarding projections, future operations, financial results, cash flows, costs and cost management initiatives, capital structure management, growth rates and operational and strategic initiatives, and can also be identified by the use of words such as “may,” “will,” “projects,” “expects,” “anticipates,” “intends,” “plans,” “believes,” “estimates,” “continues,” “thinks,” and words or phrases of similar meaning. These forward-looking statements speak only as of the date hereof and are based on our current plans and expectations and are subject to a number of known and unknown risks, uncertainties and other factors, many of which are difficult or impossible to predict and may be beyond our control. These risks and uncertainties are described under headings such as “Risk Factors” in our Annual Report on Form 10-K for the year ended December 31, 2017, our current form 10-Q and other filings with the Securities and Exchange Commission (the “SEC”). As a consequence, current plans, anticipated actions and future financial position and results of operations may differ materially from any future results or performance expressed or implied in any forward-looking statements in today’s presentation. Given these uncertainties, you are cautioned not to place undue reliance on these forward-looking statements. We undertake no obligation to revise or update any of these statements, or to make any other forward-looking statements, whether as a result of new information, future events or otherwise. Non-GAAP Financial Measures This presentation may include certain financial information defined as “non-GAAP financial measures” by the SEC. These measures may be different from non-GAAP financial measures used by other companies and should not be considered in isolation or as a substitute for net income, operating income, cash flows from operating, investing or financing activities or any other measure calculated in accordance with U.S. GAAP. A reconciliation of these non-GAAP measurements to the nearest comparable GAAP measure is available at the end of this presentation. 2
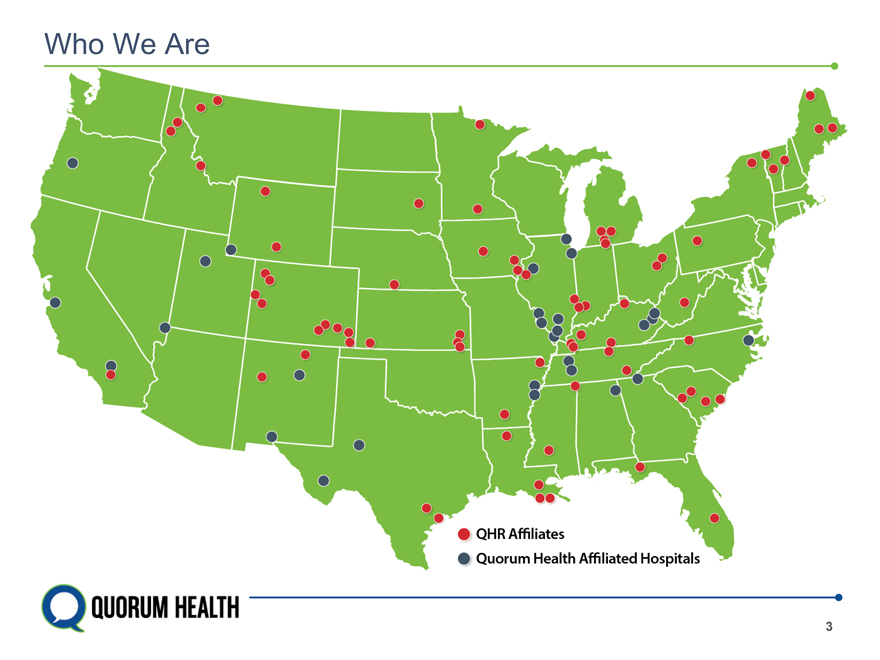
Who We Are QHR Affiliates Quorum Health Affiliated Hospitals 3
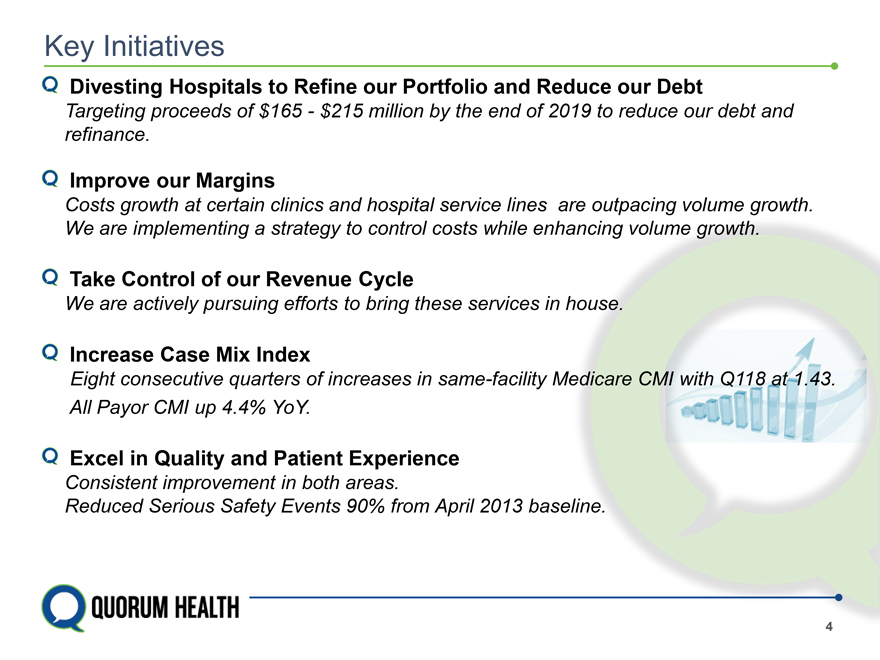
Key Initiatives Divesting Hospitals to Refine our Portfolio and Reduce our Debt Targeting proceeds of $165—$215 million by the end of 2019 to reduce our debt and refinance. Improve our Margins Costs growth at certain clinics and hospital service lines are outpacing volume growth. We are implementing a strategy to control costs while enhancing volume growth. Take Control of our Revenue Cycle We are actively pursuing efforts to bring these services in house. Increase Case Mix Index Eight consecutive quarters of increases in same-facility Medicare CMI with Q118 at 1.43. All Payor CMI up 4.4% YoY. Excel in Quality and Patient Experience Consistent improvement in both areas. Reduced Serious Safety Events 90% from April 2013 baseline. 4
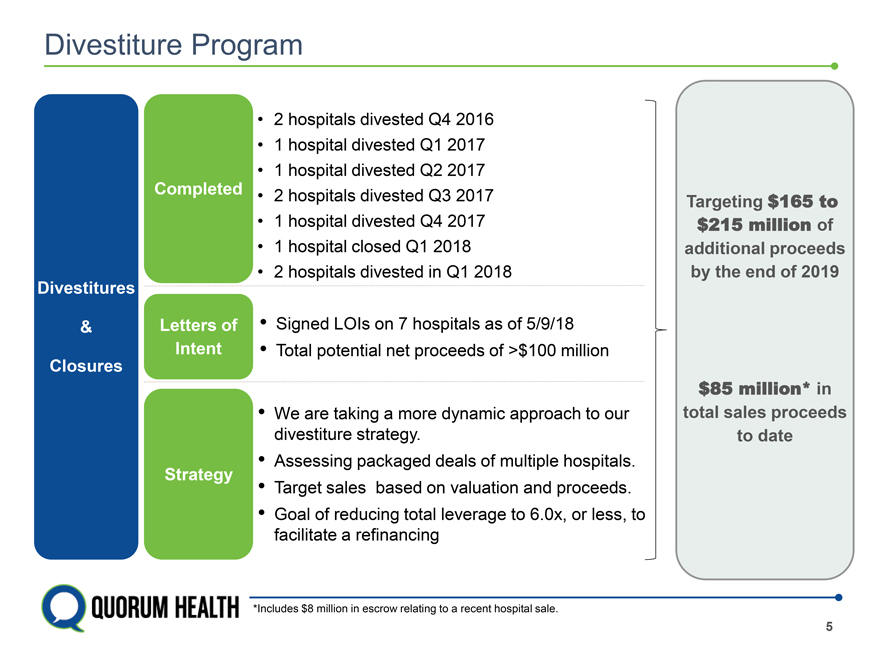
Divestiture Program • 2 hospitals divested Q4 2016 • 1 hospital divested Q1 2017 • 1 hospital divested Q2 2017 Completed • 2 hospitals divested Q3 2017 Targeting $165 to • 1 hospital divested Q4 2017 $215 million of • 1 hospital closed Q1 2018 additional proceeds • 2 hospitals divested in Q1 2018 by the end of 2019 Divestitures & Letters of • Signed LOIs on 7 hospitals as of 5/9/18 Intent • Total potential net proceeds of >$100 million Closures $85 million* in • We are taking a more dynamic approach to our total sales proceeds divestiture strategy. to date Strategy • Assessing packaged deals of multiple hospitals. • Target sales based on valuation and proceeds. • Goal of reducing total leverage to 6.0x, or less, to facilitate a refinancing *Includes $8 million in escrow relating to a recent hospital sale. 5
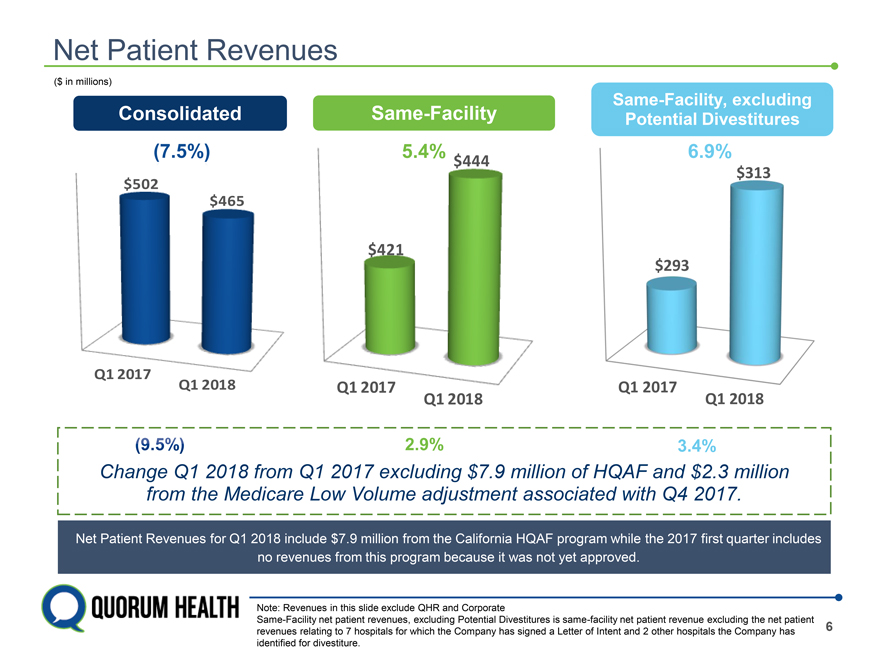
Net Patient Revenues ($ in millions) Same-Facility, excluding Consolidated Same-Facility Potential Divestitures $444 $313 $465 $421 $293 Q1 2017 Q1 2018 Q1 2017 Q1 2017 Q1 2018 Q1 2018 2018 from Q1 2017 7.9 million of HQAF llion from the Medicare Low Volume adjustment associated with Q4 2017. Net Patient Revenues for Q1 2018 include $7.9 million from the California HQAF program while the 2017 first quarter includes no revenues from this program because it was not yet approved. Note: Revenues in this slide exclude QHR and Corporate Same-Facility net patient revenues, excluding Potential Divestitures is same-facility net patient revenue excluding the net patient revenues relating to 7 hospitals for which the Company has signed a Letter of Intent and 2 other hospitals the Company has 6 identified for divestiture.
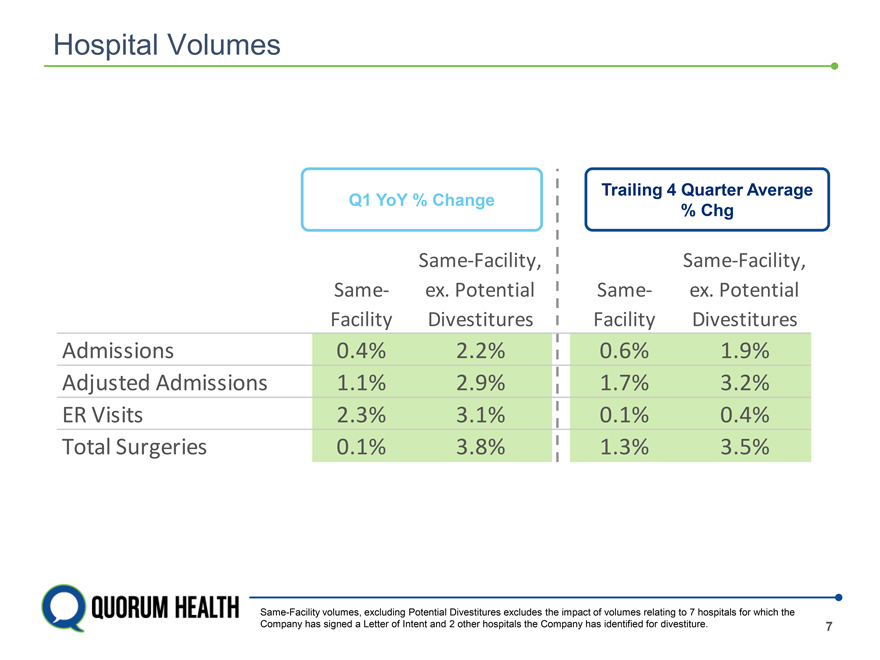
Hospital Volumes Trailing 4 Quarter Average Q1 YoY % Change % Chg Same-Facility, Same-Facility, Same- ex. Potential Same- ex. Potential Facility Divestitures Facility Divestitures Admissions 0.4% 2.2% 0.6% 1.9% Adjusted Admissions 1.1% 2.9% 1.7% 3.2% ER Visits 2.3% 3.1% 0.1% 0.4% Total Surgeries 0.1% 3.8% 1.3% 3.5% Same-Facility volumes, excluding Potential Divestitures excludes the impact of volumes relating to 7 hospitals for which the Company has signed a Letter of Intent and 2 other hospitals the Company has identified for divestiture. 7
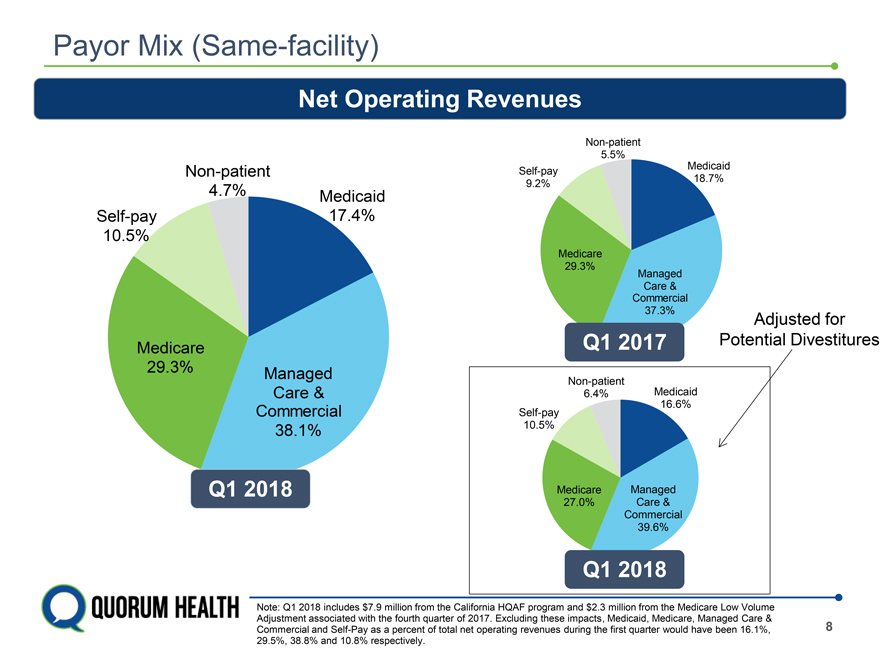
Payor Mix (Same-facility) Net Operating Revenues Non-patient 5.5% Medicaid Non-patient Self-pay 18.7% 4.7% Medicaid 9.2% Self-pay 17.4% 10.5% Medicare 29.3% Managed Care & Commercial 37.3% Adjusted for Q1 2017 Potential Divestitures Medicare 29.3% Managed Non-patient Care & 6.4% Medicaid 16.6% Commercial Self-pay 38.1% 10.5% Q1 2018 Medicare Managed 27.0% Care & Commercial 39.6% Q1 2018 Note: Q1 2018 includes $7.9 million from the California HQAF program and $2.3 million from the Medicare Low Volume Adjustment associated with the fourth quarter of 2017. Excluding these impacts, Medicaid, Medicare, Managed Care & Commercial and Self-Pay as a percent of total net operating revenues during the first quarter would have been 16.1%, 8 29.5%, 38.8% and 10.8% respectively.
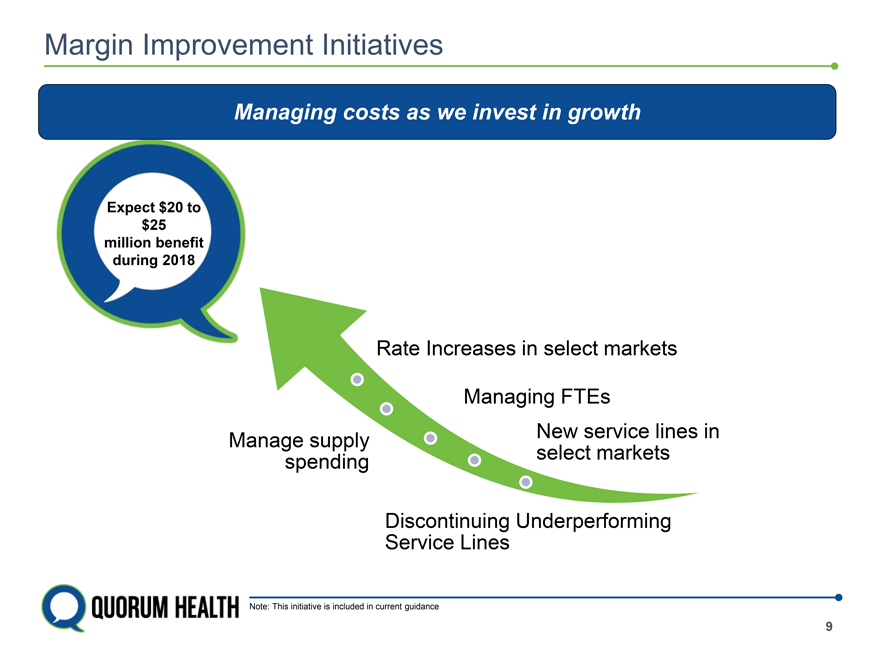
Margin Improvement Initiatives Managing costs as we invest in growth Expect $20 to $25 million benefit during 2018 Rate Increases in select markets Managing FTEs New service lines in Manage supply select markets spending Discontinuing Underperforming Service Lines Note: This initiative is included in current guidance 9
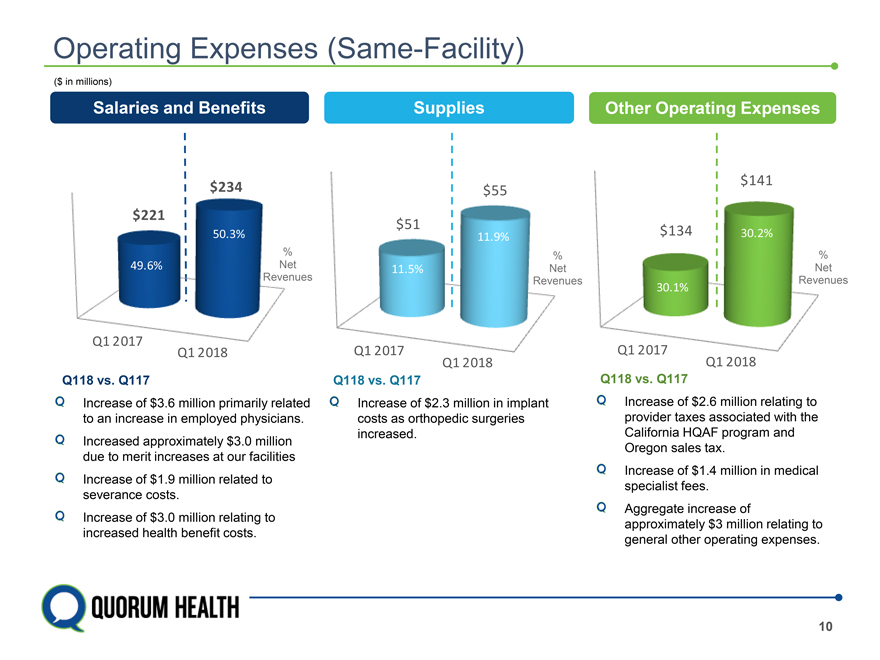
Operating Expenses (Same-Facility) ($ in millions) Salaries and Benefits Supplies Other Operating Expenses $141 $234 $55 $221 $51 50.3% $134 30.2% 11.9% % % % 49.6% Net 11.5% Net Net Revenues Revenues Revenues 30.1% Q1 2017 Q1 2018 Q1 2017 Q1 2017 Q1 2018 Q1 2018 Q118 vs. Q117 Q118 vs. Q117 Q118 vs. Q117 Increase of $2.6 million relating to provider taxes associated with the California HQAF program and Oregon sales tax. Increase of $1.4 million in medical specialist fees. Aggregate increase of approximately $3 million relating to general other operating expenses. Increase of $2.3 million in implant costs as orthopedic surgeries increased. Increase of $3. Million primarily related to an increase in employed physicians. Increased approximately $3.0 million due to merit increases at our facilities Increase of $1.9 million related to severance costs. Increase of $3.0 million relating to increased health benefit costs.
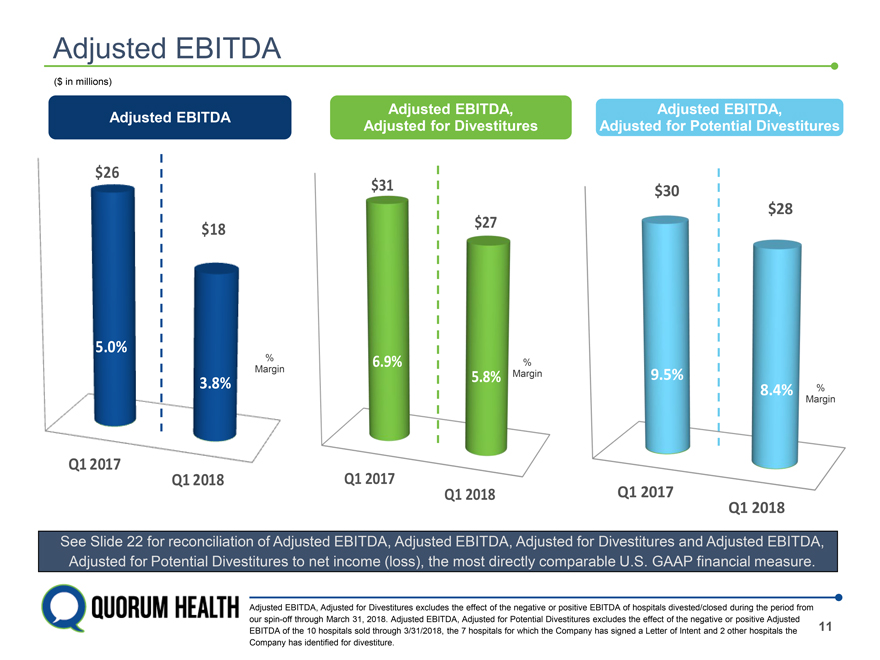
Adjusted EBITDA ($ in millions) Adjusted EBITDA, Adjusted EBITDA, Adjusted EBITDA Adjusted for Divestitures Adjusted for Potential Divestitures $26 $31 $30 $28 $27 $18 6.9% % 5.8% Margin 9.5% 8.4% % Margin Q1 2017 Q1 2017 Q1 2018 Q1 2018 ed EBITDA, Adjusted EBITDA, Adjusted for Divestitures and Adjusted EBITDA, net income (loss), the most directly comparable U.S. GAAP financial measure. DA, Adjusted for Divestitures excludes the effect of the negative or positive EBITDA of hospitals divested/closed during the period from rough March 31, 2018. Adjusted EBITDA, Adjusted for Potential Divestitures excludes the effect of the negative or positive Adjusted EBITDA of the 10 hospitals sold through 3/31/2018, the 7 hospitals for which the Company has signed a Letter of Intent and 2 other hospitals the 11 Company has identified for divestiture.
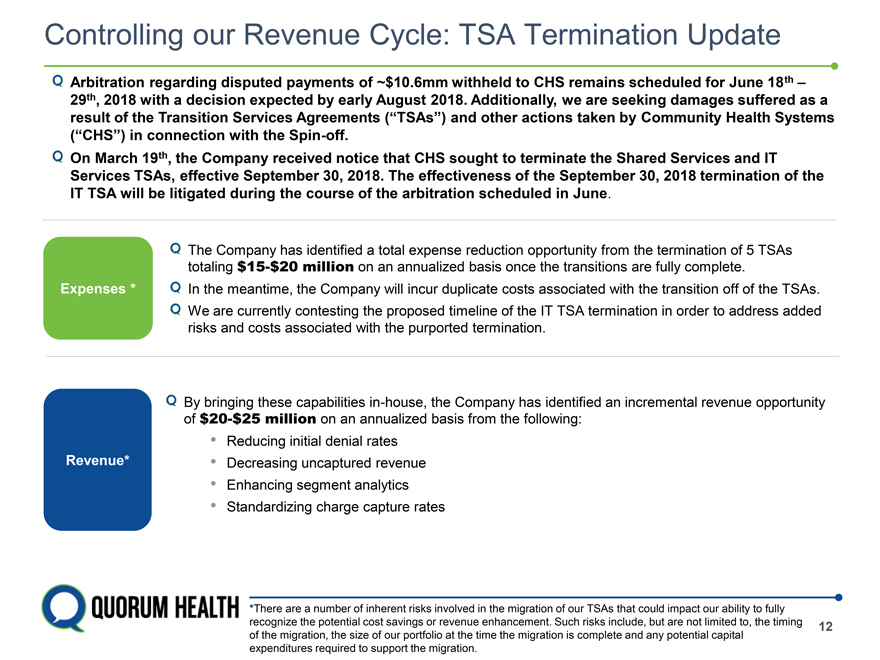
Controlling our Revenue Cycle: TSA Termination Update Arbitration regarding disputed payments of ~$10.6mm withheld to CHS remains scheduled for June 18th – 29th, 2018 with a decision expected by early August 2018. Additionally, we are seeking damages suffered as a result of the Transition Services Agreements (“TSAs”) and other actions taken by Community Health Systems (“CHS”) in connection with the Spin-off. On March 19th, the Company received notice that CHS sought to terminate the Shared Services and IT Services TSAs, effective September 30, 2018. The effectiveness of the September 30, 2018 termination of the IT TSA will be litigated during the course of the arbitration scheduled in June. The Company has identified a total expense reduction opportunity from the termination of 5 TSAs totaling $15-$20 million on an annualized basis once the transitions are fully complete. Expenses * In the meantime, the Company will incur duplicate costs associated with the transition off of the TSAs. We are currently contesting the proposed timeline of the IT TSA termination in order to address added risks and costs associated with the purported termination. By bringing these capabilities in-house, the Company has identified an incremental revenue opportunity of $20-$25 million on an annualized basis from the following: • Reducing initial denial rates Revenue* • Decreasing uncaptured revenue • Enhancing segment analytics • Standardizing charge capture rates *There are a number of inherent risks involved in the migration of our TSAs that could impact our ability to fully recognize the potential cost savings or revenue enhancement. Such risks include, but are not limited to, the timing 12 of the migration, the size of our portfolio at the time the migration is complete and any potential capital expenditures required to support the migration.
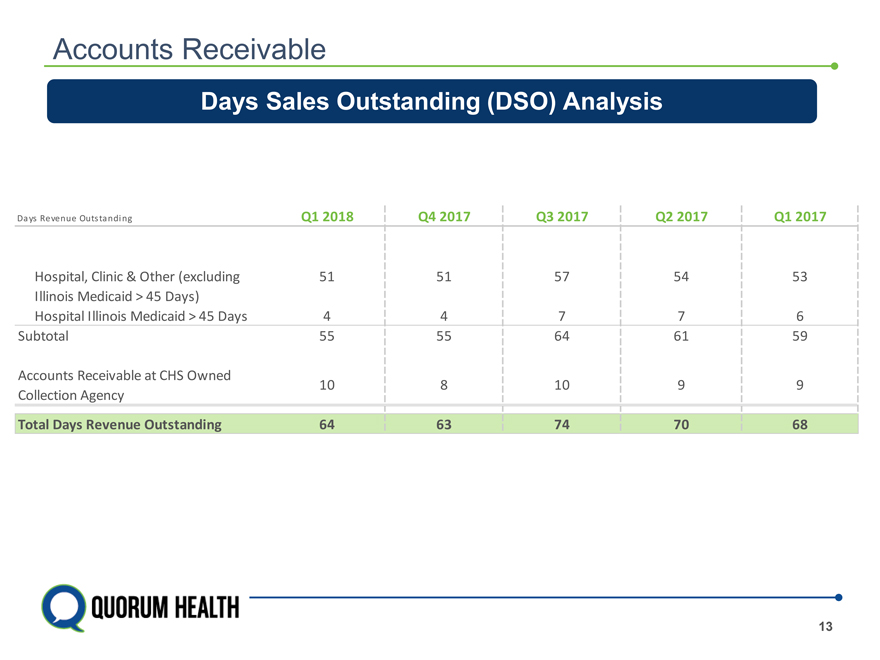
Accounts Receivable Days Sales Outstanding (DSO) Analysis Days Revenue Outstanding Q1 2018 Q4 2017 Q3 2017 Q2 2017 Q1 2017 Hospital, Clinic & Other (excluding 51 51 57 54 53 Illinois Medicaid > 45 Days) Hospital Illinois Medicaid > 45 Days 4 4 7 7 6 Subtotal 55 55 64 61 59 Accounts Receivable at CHS Owned 10 8 10 9 9 Collection Agency Total Days Revenue Outstanding 64 63 74 70 68 13
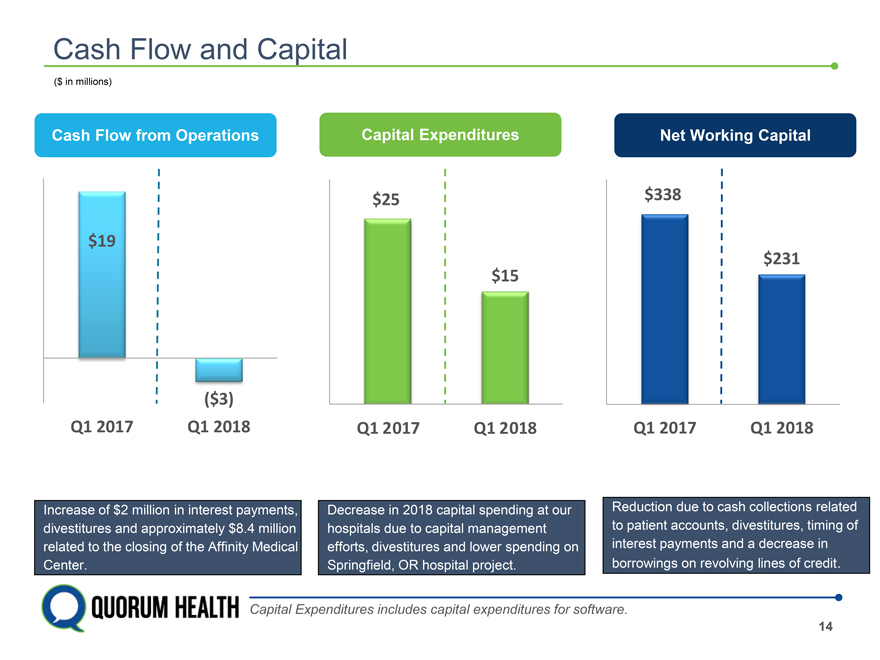
Cash Flow and Capital ($ in millions) Cash Flow from Operations Capital Expenditures Net Working Capital $25 $338 $19 $231 $15 ($3) Q1 2017 Q1 2018 Q1 2017 Q1 2018 Q1 2017 Q1 2018 of $2 milli est payments, Decrease in 2018 capital spending at our Reduction due to cash collections related es and ap y $8.4 million hospitals due to capital management to patient accounts, divestitures, timing of o the closi Affinity Medical efforts, divestitures and lower spending on interest payments and a decrease in Springfield, OR hospital project. borrowings on revolving lines of credit. Capital Expenditures includes capital expenditures for software. 14
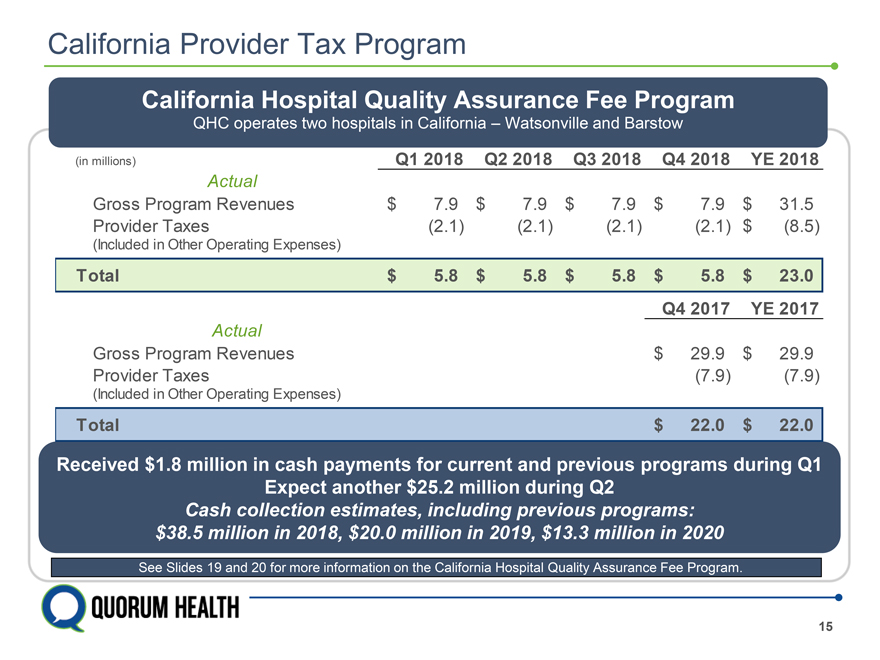
California Provider Tax Program California Hospital Quality Assurance Fee Program QHC operates two hospitals in California – Watsonville and Barstow (in millions) Q1 2018 Q2 2018 Q3 2018 Q4 2018 YE 2018 Actual Gross Program Revenues $ 7.9 $ 7.9 $ 7.9 $ 7.9 $ 31.5 Provider Taxes (2.1) (2.1) (2.1) (2.1) $ (8.5) (Included in Other Operating Expenses) Total $ 5.8 $ 5.8 $ 5.8 $ 5.8 $ 23.0 Q4 2017 YE 2017 Actual Gross Program Revenues $ 29.9 $ 29.9 Provider Taxes (7.9) (7.9) (Included in Other Operating Expenses) Total $ 22.0 $ 22.0 Received $1.8 million in cash payments for current and previous programs during Q1 Expect another $25.2 million during Q2 Cash collection estimates, including previous programs: $38.5 million in 2018, $20.0 million in 2019, $13.3 million in 2020 See Slides 19 and 20 for more information on the California Hospital Quality Assurance Fee Program. 15
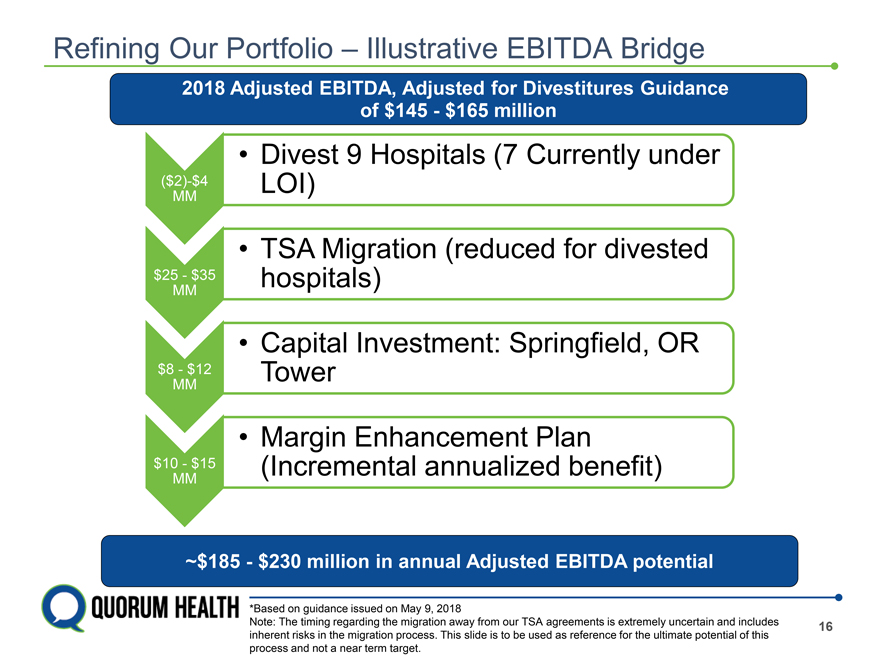
Refining Our Portfolio – Illustrative EBITDA Bridge 2018 Adjusted EBITDA, Adjusted for Divestitures Guidance of $145—$165 million • Divest 9 Hospitals (7 Currently under ($2)-$4 LOI) MM • TSA Migration (reduced for divested $25—$35 hospitals) MM • Capital Investment: Springfield, OR $8—$12 Tower MM • Margin Enhancement Plan $10—$15 (Incremental annualized benefit) MM ~$185—$230 million in annual Adjusted EBITDA potential *Based on guidance issued on May 9, 2018 Note: The timing regarding the migration away from our TSA agreements is extremely uncertain and includes 16 inherent risks in the migration process. This slide is to be used as reference for the ultimate potential of this process and not a near term target.
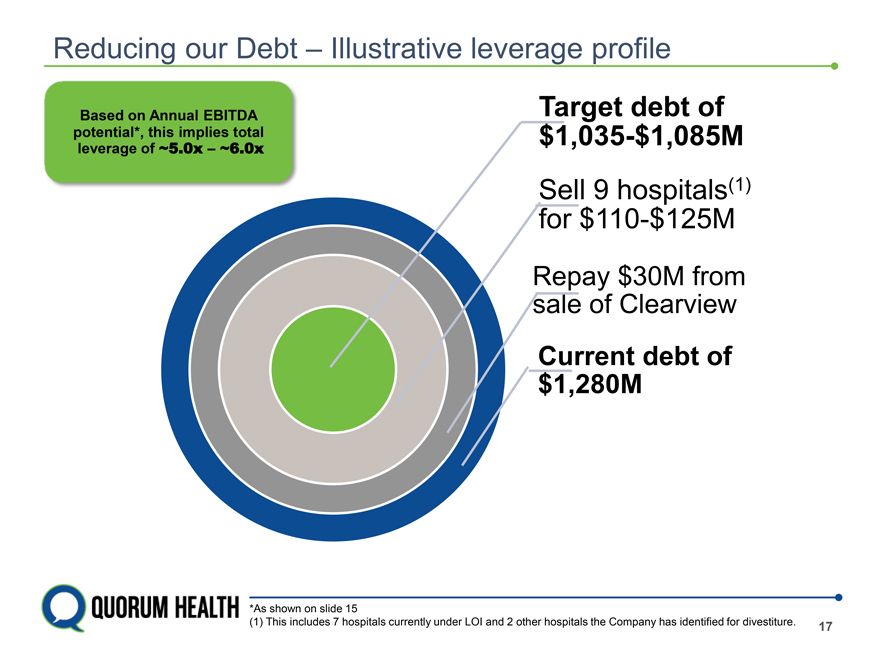
Reducing our Debt – Illustrative leverage profile Based on Annual EBITDA Target debt of potential*, this ~5.0x implies – ~6.0x total $1,035-$1,085M leverage of Sell 9 hospitals(1) for $110-$125M Repay $30M from sale of Clearview Current debt of $1,280M *As shown on slide 15 (1) This includes 7 hospitals currently under LOI and 2 other hospitals the Company has identified for divestiture. 17

QHC LISTED NYSE QUARUM HEALTH
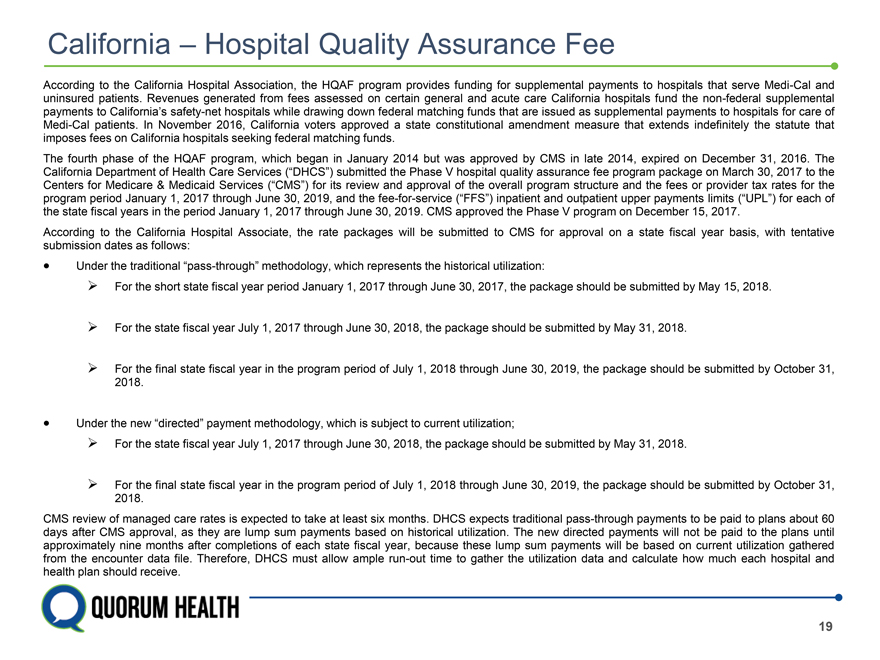
California – Hospital Quality Assurance Fee According to the California Hospital Association, the HQAF program provides funding for supplemental payments to hospitals that serve Medi-Cal and uninsured patients. Revenues generated from fees assessed on certain general and acute care California hospitals fund the non-federal supplemental payments to California’s safety-net hospitals while drawing down federal matching funds that are issued as supplemental payments to hospitals for care of Medi-Cal patients. In November 2016, California voters approved a state constitutional amendment measure that extends indefinitely the statute that imposes fees on California hospitals seeking federal matching funds. The fourth phase of the HQAF program, which began in January 2014 but was approved by CMS in late 2014, expired on December 31, 2016. The California Department of Health Care Services (“DHCS”) submitted the Phase V hospital quality assurance fee program package on March 30, 2017 to the Centers for Medicare & Medicaid Services (“CMS”) for its review and approval of the overall program structure and the fees or provider tax rates for the program period January 1, 2017 through June 30, 2019, and the fee-for-service (“FFS”) inpatient and outpatient upper payments limits (“UPL”) for each of the state fiscal years in the period January 1, 2017 through June 30, 2019. CMS approved the Phase V program on December 15, 2017. According to the California Hospital Associate, the rate packages will be submitted to CMS for approval on a state fiscal year basis, with tentative submission dates as follows: Under the traditional “pass-through” methodology, which represents the historical utilization: For the short state fiscal year period January 1, 2017 through June 30, 2017, the package should be submitted by May 15, 2018. For the state fiscal year July 1, 2017 through June 30, 2018, the package should be submitted by May 31, 2018. For the final state fiscal year in the program period of July 1, 2018 through June 30, 2019, the package should be submitted by October 31, 2018. Under the new “directed” payment methodology, which is subject to current utilization; For the state fiscal year July 1, 2017 through June 30, 2018, the package should be submitted by May 31, 2018. For the final state fiscal year in the program period of July 1, 2018 through June 30, 2019, the package should be submitted by October 31, 2018. CMS review of managed care rates is expected to take at least six months. DHCS expects traditional pass-through payments to be paid to plans about 60 days after CMS approval, as they are lump sum payments based on historical utilization. The new directed payments will not be paid to the plans until approximately nine months after completions of each state fiscal year, because these lump sum payments will be based on current utilization gathered from the encounter data file. Therefore, DHCS must allow ample run-out time to gather the utilization data and calculate how much each hospital and health plan should receive. 19
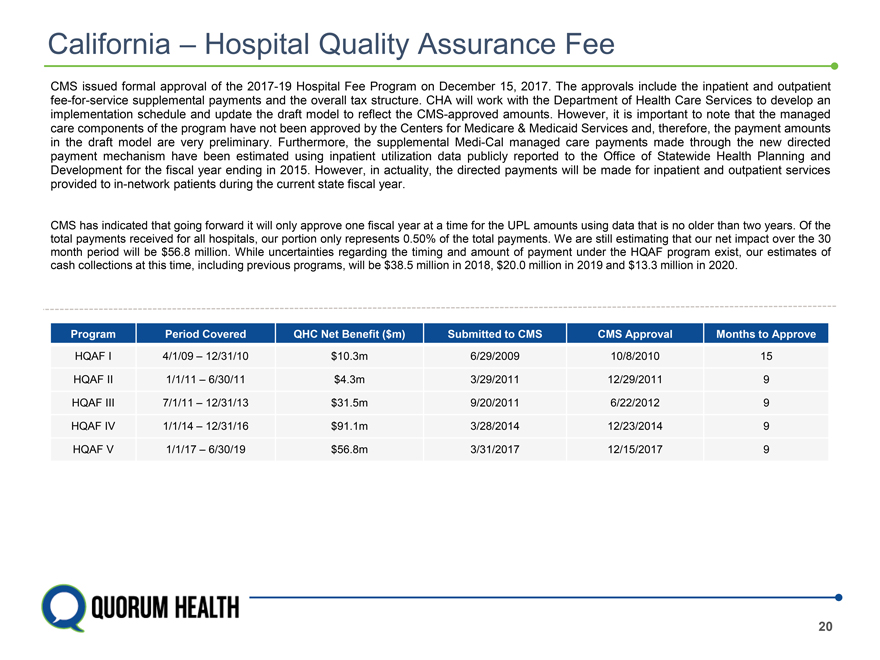
California – Hospital Quality Assurance Fee CMS issued formal approval of the 2017-19 Hospital Fee Program on December 15, 2017. The approvals include the inpatient and outpatient fee-for-service supplemental payments and the overall tax structure. CHA will work with the Department of Health Care Services to develop an implementation schedule and update the draft model to reflect the CMS-approved amounts. However, it is important to note that the managed care components of the program have not been approved by the Centers for Medicare & Medicaid Services and, therefore, the payment amounts in the draft model are very preliminary. Furthermore, the supplemental Medi-Cal managed care payments made through the new directed payment mechanism have been estimated using inpatient utilization data publicly reported to the Office of Statewide Health Planning and Development for the fiscal year ending in 2015. However, in actuality, the directed payments will be made for inpatient and outpatient services provided to in-network patients during the current state fiscal year. CMS has indicated that going forward it will only approve one fiscal year at a time for the UPL amounts using data that is no older than two years. Of the total payments received for all hospitals, our portion only represents 0.50% of the total payments. We are still estimating that our net impact over the 30 month period will be $56.8 million. While uncertainties regarding the timing and amount of payment under the HQAF program exist, our estimates of cash collections at this time, including previous programs, will be $38.5 million in 2018, $20.0 million in 2019 and $13.3 million in 2020. Program Period Covered QHC Net Benefit ($m) Submitted to CMS CMS Approval Months to Approve HQAF I 4/1/09 – 12/31/10 $10.3m 6/29/2009 10/8/2010 15 HQAF II 1/1/11 – 6/30/11 $4.3m 3/29/2011 12/29/2011 9 HQAF III 7/1/11 – 12/31/13 $31.5m 9/20/2011 6/22/2012 9 HQAF IV 1/1/14 – 12/31/16 $91.1m 3/28/2014 12/23/2014 9 HQAF V 1/1/17 – 6/30/19 $56.8m 3/31/2017 12/15/2017 9 20
Unaudited Supplemental Information EBITDA is a non-GAAP financial measure that consists of net income (loss) before interest, income taxes, depreciation and amortization. Adjusted EBITDA, also a non-GAAP financial measure, is EBITDA adjusted to add back the effect of certain legal, professional and settlement costs, impairment of long-lived assets and goodwill, net loss (gain) on sale of hospitals, net loss on closure of hospitals, transition of transition services agreements (“TSAs”), transaction costs related to the Spin-off, the change in estimate related to the collectability of patient accounts receivable, post-spin headcount reductions and executive severance. Transition of TSAs includes one-time transition costs as well as duplicative costs as the Company exits certain of the TSAs. The Company uses Adjusted EBITDA as a measure of financial performance. Adjusted EBITDA is a key measure used by the Company’s management to assess the operating performance of its hospital operations business and to make decisions on the allocation of resources. Additionally, management utilizes Adjusted EBITDA in assessing the Company’s results of operations and in comparing the Company’s results of operations between periods. Adjusted EBITDA, Adjusted for Divestitures, also a non-GAAP financial measure, is further adjusted to exclude the effect of EBITDA of hospitals divested as of March 31, 2018. Adjusted EBITDA, Adjusted for Potential Divestitures, also a non-GAAP financial measure, is further retrospectively adjusted to exclude the effect of EBITDA of seven hospitals for which the company has signed Letters of Intent to divest and two other hospitals that the company has identified for divestiture. The Company continually evaluates other hospitals for potential divestiture, which could result in changes to the hospitals included in this group in future periods. The Company has presented Adjusted EBITDA, Adjusted EBITDA, Adjusted for Divestitures and Adjusted EBITDA, Adjusted for Potential Divestitures in this presentation because it believes these measures provide investors and other users of the Company’s financial statements with additional information about how the Company’s management assesses its results of operations. Adjusted EBITDA, Adjusted EBITDA, Adjusted for Divestitures and Adjusted EBITDA, Adjusted for Potential Divestitures are not measurements of financial performance under U.S. GAAP. These calculations should not be considered in isolation or as a substitute for net income, operating income or any other measure calculated in accordance with U.S. GAAP. The items excluded from Adjusted EBITDA, Adjusted EBITDA, Adjusted for Divestitures and Adjusted EBITDA, Adjusted for Potential Divestitures are significant components in understanding and evaluating the Company’s financial performance. The Company believes such adjustments are appropriate, as the magnitude and frequency of such items can vary significantly and are not related to the assessment of normal operating performance. Additionally, the Company’s calculation of Adjusted EBITDA, Adjusted EBITDA, Adjusted for Divestitures and Adjusted EBITDA, Adjusted for Potential Divestitures may not be comparable to similarly titled measures reported by other companies. Our Credit Agreements use Adjusted EBITDA, Adjusted for Divestitures, subject to further permitted adjustments, for certain financial covenants. Management believes that it is useful to present Adjusted EBITDA, Adjusted EBITDA, Adjusted for Divestitures and Adjusted EBITDA, Adjusted for Potential Divestitures because these measures, as defined, provide investors with additional information about our ability to incur and service debt and make capital expenditures. 21
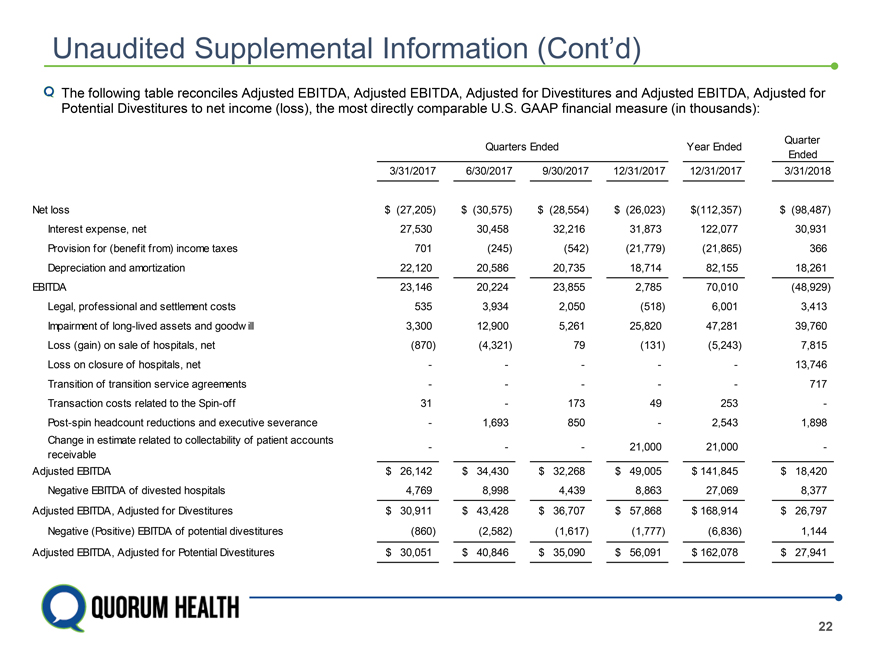
Unaudited Supplemental Information (Cont’d) The following table reconciles Adjusted EBITDA, Adjusted EBITDA, Adjusted for Divestitures and Adjusted EBITDA, Adjusted for Potential Divestitures to net income (loss), the most directly comparable U.S. GAAP financial measure (in thousands): Quarter Quarters Ended Year Ended Ended 3/31/2017 6/30/2017 9/30/2017 12/31/2017 12/31/2017 3/31/2018 Net loss $ (27,205) $ (30,575) $ (28,554) $ (26,023) $(112,357) $ (98,487) Interest expense, net 27,530 30,458 32,216 31,873 122,077 30,931 Provision for (benefit from) income taxes 701 (245) (542) (21,779) (21,865) 366 Depreciation and amortization 22,120 20,586 20,735 18,714 82,155 18,261 EBITDA 23,146 20,224 23,855 2,785 70,010 (48,929) Legal, professional and settlement costs 535 3,934 2,050 (518) 6,001 3,413 Impairment of long-lived assets and goodw ill 3,300 12,900 5,261 25,820 47,281 39,760 Loss (gain) on sale of hospitals, net (870) (4,321) 79 (131) (5,243) 7,815 Loss on closure of hospitals, net — — — — — 13,746 Transition of transition service agreements — — — — — 717 Transaction costs related to the Spin-off 31 — 173 49 253 -Post-spin headcount reductions and executive severance — 1,693 850 — 2,543 1,898 Change in estimate related to collectability of patient accounts — — — 21,000 21,000 -receivable Adjusted EBITDA $ 26,142 $ 34,430 $ 32,268 $ 49,005 $ 141,845 $ 18,420 Negative EBITDA of divested hospitals 4,769 8,998 4,439 8,863 27,069 8,377 Adjusted EBITDA, Adjusted for Divestitures $ 30,911 $ 43,428 $ 36,707 $ 57,868 $ 168,914 $ 26,797 Negative (Positive) EBITDA of potential divestitures (860) (2,582) (1,617) (1,777) (6,836) 1,144 Adjusted EBITDA, Adjusted for Potential Divestitures $ 30,051 $ 40,846 $ 35,090 $ 56,091 $ 162,078 $ 27,941 22
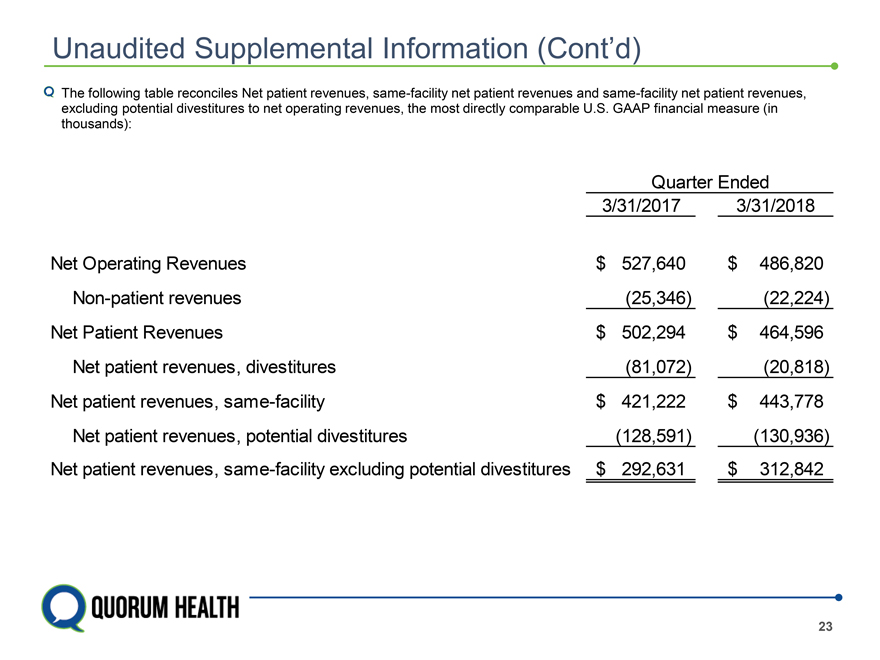
Unaudited Supplemental Information (Cont’d) The following table reconciles Net patient revenues, same-facility net patient revenues and same-facility net patient revenues, excluding potential divestitures to net operating revenues, the most directly comparable U.S. GAAP financial measure (in thousands): Quarter Ended 3/31/2017 3/31/2018 Net Operating Revenues $ 527,640 $ 486,820 Non-patient revenues (25,346) (22,224) Net Patient Revenues $ 502,294 $ 464,596 Net patient revenues, divestitures (81,072) (20,818) Net patient revenues, same-facility $ 421,222 $ 443,778 Net patient revenues, potential divestitures (128,591) (130,936) Net patient revenues, same-facility excluding potential divestitures $ 292,631 $ 312,842 23