Attached files
| file | filename |
|---|---|
| 8-K - FORM 8-K - JUNIATA VALLEY FINANCIAL CORP | tv494450_8k.htm |
Juniata Valley Financial Corp. Annual Shareholders Meeting May 15, 2018 Exhibit 99.1

Timothy I. Havice Chairman of the Board of Directors Shareholders’ Business Meeting

The presentation may contain “forward looking” information as defined by the Private Securities Litigation Reform Act of 1995 . When words such as “believes”, “expects”, “anticipates” or similar expressions are used in this release, Juniata Valley is making forward - looking statements . Such information is based on Juniata Valley’s current expectations, estimates and projections about future events and financial trends affecting the financial condition of its business . These statements are not historical facts or guarantees of future performance, events or results . Such statements involve potential risks and uncertainties and, accordingly, actual results may differ materially from this “forward looking” information . Many factors could affect future financial results . Juniata Valley undertakes no obligation to publicly update or revise forward looking information, whether as a result of new or updated information, future events, or otherwise . For a more complete discussion of certain risks and uncertainties affecting Juniata Valley, please see the sections entitled “Risk Factors” and “Management’s Discussion and Analysis of Financial Condition and Results of Operations – Forward - Looking Statements” set forth in the Juniata Valley’s filings with the Securities and Exchange Commission .

Marcie A. Barber President and Chief Executive Officer Building Blocks for the Future
JoAnn N. McMinn Executive Vice President and Chief Financial Officer Financial Performance
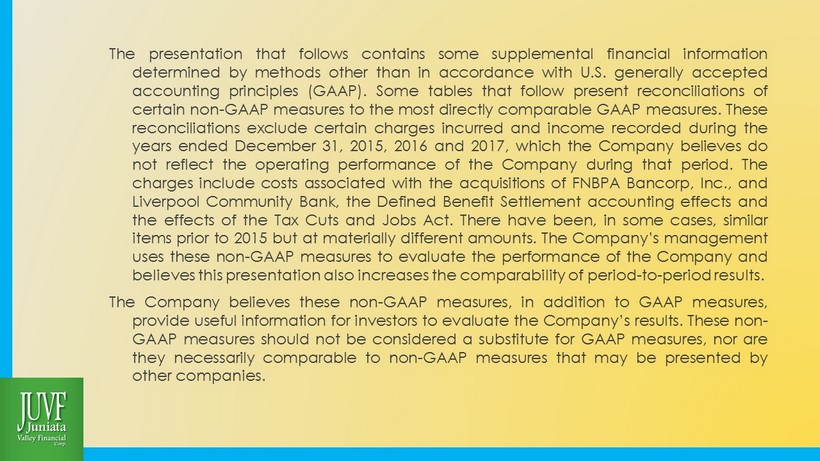
The presentation that follows contains some supplemental financial information determined by methods other than in accordance with U . S . generally accepted accounting principles (GAAP) . Some tables that follow present reconciliations of certain non - GAAP measures to the most directly comparable GAAP measures . These reconciliations exclude certain charges incurred and income recorded during the years ended December 31 , 2015 , 2016 and 2017 , which the Company believes do not reflect the operating performance of the Company during that period . The charges include costs associated with the acquisitions of FNBPA Bancorp, Inc . , and Liverpool Community Bank, the Defined Benefit Settlement accounting effects and the effects of the Tax Cuts and Jobs Act . There have been, in some cases, similar items prior to 2015 but at materially different amounts . The Company’s management uses these non - GAAP measures to evaluate the performance of the Company and believes this presentation also increases the comparability of period - to - period results . The Company believes these non - GAAP measures, in addition to GAAP measures, provide useful information for investors to evaluate the Company’s results . These non - GAAP measures should not be considered a substitute for GAAP measures, nor are they necessarily comparable to non - GAAP measures that may be presented by other companies .

Growth in Average Assets (In Thousands) $428,744 $435,285 $439,130 $447,323 $454,057 $450,031 $470,660 $489,323 $577,341 $593,923 $400,000 $420,000 $440,000 $460,000 $480,000 $500,000 $520,000 $540,000 $560,000 $580,000 $600,000 2008 2009 2010 2011 2012 2013 2014 2015 2016 2017
Long Term Strategic Focus and Attention to Detail At Juniata Valley, our Strategic Plan calls for Growth and Profitability. We plan and execute for Long Term results. To assess performance and expectations, we must have an understanding of the short - term and long - term effects of our strategic decisions, as well as changes that occur outside our control. Over the past three years, events have occurred that have materially affected our operating results – some strategically planned and some not. We believe it is meaningful to present a performance comparison that segregates the financial impact of all such items, to allow a view of comparative results between reporting periods.
Merger and Acquisition Activity - Strategic In 2015, Juniata Valley Financial Corp. acquired FNBPA, Inc. One - time merger costs related to that particular acquisition, occurred in 2015 and 2016 at significantly different levels. Also related to the FNBPA merger, were certain gains from the subsequent sale of a segment of the purchased loan portfolio in 2016. In 2017, Juniata Valley and Liverpool Community Bank executed a definitive merger agreement, in which Juniata would acquire the 60.8% of Liverpool’s shares that it did not already own. One - time merger costs related to that acquisition were incurred at both institutions in 2017, prior to the legal merger date. The legal merger was completed on April 30, 2018, and further merger and integration costs are expected in 2018
Defined Benefit Liability Reduction - Strategic In 2017, Juniata Valley Financial Corp. initiated a strategy to reduce the liability associated with it defined benefit pension plan. The first step of the initiative consisted of the purchase of a single - premium group annuity for a group of our retirees, transferring the associated pension liability to the issuer of the annuity. This step reduced our overall pension liability by approximately 12%, resulting in a pre - tax charge of $377,000. This charge represents an acceleration of pension expenses that would otherwise have impacted our future earnings. During 2018, we expect to further reduce the pension liability, that will likely result in another accelerated charge. These steps remove future volatility to the income statement that is associated with defined benefit accounting, while keeping the retirement benefit promise to our participants.
Insurance Gains – Possible but Unexpected Juniata carries life insurance on certain of its current and former executives and directors. The earnings and gains on the policies are intended to offset some of the cost of benefit programs for employees. Life insurance gains are infrequently received and at varying levels. During 2016, gains from life insurance were recorded in the amount of $364,000, while none were present in 2017.
Tax Cuts and Jobs Act - Unexpected Near the end of 2017, the Tax Cuts and Jobs Act was enacted, lowering Juniata’s and Liverpool’s future maximum corporate tax rate from 34% to 21%. The reduced rate will provide reductions in tax expense in future periods, beginning on January 1, 2018. For 2017, the tax rate reduction resulted in a write - down of Juniata’s and Liverpool’s net deferred tax assets, that were previously valued, based upon the projection of a 34% future tax benefit. A non - cash charge of $416,000 was included in our 2017 tax provision as a result. Liverpool’s write - down resulted in a reduction of $32,000 of Juniata’s pre - tax income, relating to our 39.2% equity ownership at that time.
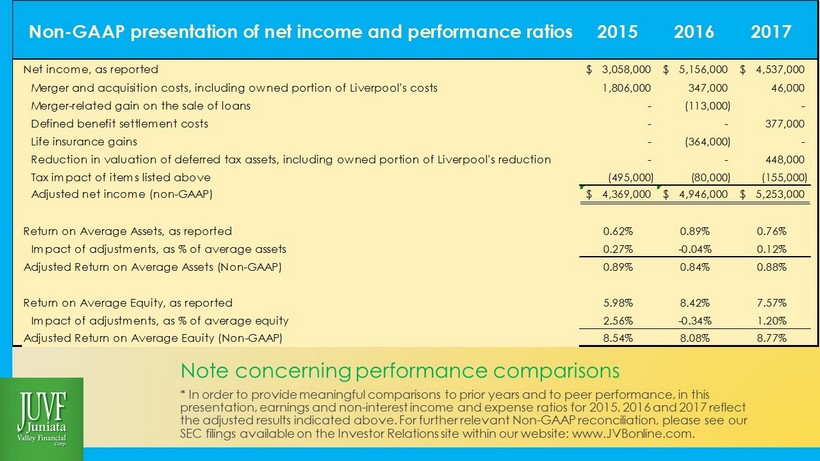
Note concerning performance comparisons * In order to provide meaningful comparisons to prior years and to peer performance, in this presentation, earnings and non - interest income and expense ratios for 2015, 2016 and 2017 reflect the adjusted results indicated above. For further relevant Non - GAAP reconciliation, please see our SEC filings available on the Investor Relations site within our website: www.JVBonline.com. Non-GAAP presentation of net income and performance ratios 2015 2016 2017 Net income, as reported 3,058,000$ 5,156,000$ 4,537,000$ Merger and acquisition costs, including owned portion of Liverpool's costs 1,806,000 347,000 46,000 Merger-related gain on the sale of loans - (113,000) - Defined benefit settlement costs - - 377,000 Life insurance gains - (364,000) - Reduction in valuation of deferred tax assets, including owned portion of Liverpool's reduction - - 448,000 Tax impact of items listed above (495,000) (80,000) (155,000) Adjusted net income (non-GAAP) 4,369,000$ 4,946,000$ 5,253,000$ Return on Average Assets, as reported 0.62% 0.89% 0.76% Impact of adjustments, as % of average assets 0.27% -0.04% 0.12% Adjusted Return on Average Assets (Non-GAAP) 0.89% 0.84% 0.88% Return on Average Equity, as reported 5.98% 8.42% 7.57% Impact of adjustments, as % of average equity 2.56% -0.34% 1.20% Adjusted Return on Average Eauity (Non-GAAP) 8.54% 8.08% 8.77%
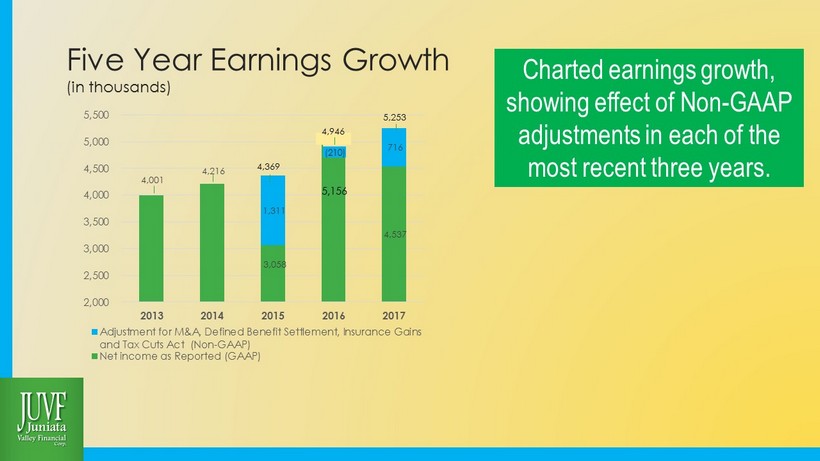
Five Year Earnings Growth (in thousands) 4,001 4,216 3,058 4,537 1,311 (210) 716 2,000 2,500 3,000 3,500 4,000 4,500 5,000 5,500 2013 2014 2015 2016 2017 Adjustment for M&A, Defined Benefit Settlement, Insurance Gains and Tax Cuts Act (Non-GAAP) Net income as Reported (GAAP) Charted earnings growth, showing effect of Non - GAAP adjustments in each of the most recent three years. 4,369 5,253 5,156 4,946
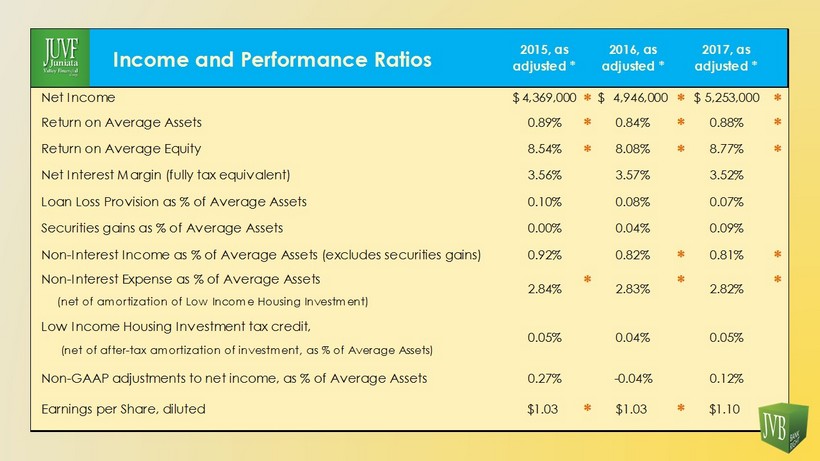
Income and Performance Ratios 2015, as adjusted * 2016, as adjusted * 2017, as adjusted * Net Income 4,369,000$ * 4,946,000$ * 5,253,000$ * Return on Average Assets 0.89% * 0.84% * 0.88% * Return on Average Equity 8.54% * 8.08% * 8.77% * Net Interest Margin (fully tax equivalent) 3.56% 3.57% 3.52% Loan Loss Provision as % of Average Assets 0.10% 0.08% 0.07% Securities gains as % of Average Assets 0.00% 0.04% 0.09% Non-Interest Income as % of Average Assets (excludes securities gains) 0.92% 0.82% * 0.81% * Non-Interest Expense as % of Average Assets * * * (net of amortization of Low Income Housing Investment) Low Income Housing Investment tax credit, (net of after-tax amortization of investment, as % of Average Assets) Non-GAAP adjustments to net income, as % of Average Assets 0.27% -0.04% 0.12% Earnings per Share, diluted $1.03 * $1.03 * $1.10 * 2.84% 2.83% 2.82% 0.05% 0.04% 0.05%
Peer Group Comparisons Important to assess our performance against other financial institutions of our relative size who are experiencing similar regulatory and compliance governance.

Local Peers Geographic Peers of similar size and complexity CBTC - CBT Financial Corporation CCFN – CCFNB Bancorp, Inc. DIMC – Dimeco, Inc. EMCF – Emclaire Financial Corp. ENBP – ENB Financial Corp FMFP – First Community Financial Corporation FRAF – Franklin Financial Services Corporation KISB – Kish Bancorp, Inc. MPB – Mid Penn Bancorp, Inc. RIVE – Riverview Financial Corporation Group of 10 Average Asset Size: $846 million Broad Group of Similar Sized Banking Organizations All commercial banking organizations within the state of Pennsylvania whose asset sizes are between $400 million and $1.1 billion . Group of 31 Peer Groups Defined
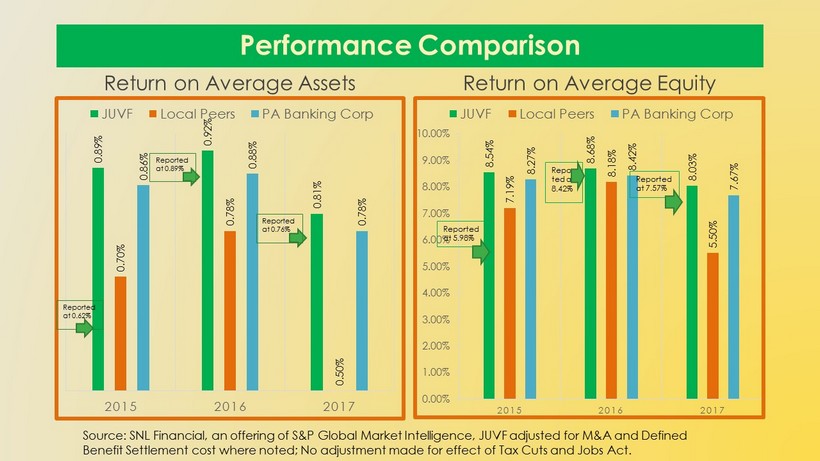
Performance Comparison Return on Average Assets 0.89% 0.92% 0.81% 0.70% 0.78% 0.50% 0.86% 0.88% 0.78% 2015 2016 2017 JUVF Local Peers PA Banking Corp Reported at 0.89% Reported at 0.62% Return on Average Equity 8.54% 8.68% 8.03% 7.19% 8.18% 5.50% 8.27% 8.42% 7.67% 0.00% 1.00% 2.00% 3.00% 4.00% 5.00% 6.00% 7.00% 8.00% 9.00% 10.00% 2015 2016 2017 JUVF Local Peers PA Banking Corp Repor ted at 8.42% Reported at 5.98% Source: SNL Financial, an offering of S&P Global Market Intelligence, JUVF adjusted for M&A and Defined Benefit Settlement cost where noted; No adjustment made for effect of Tax Cuts and Jobs Act. Reported at 0.76% Reported at 7.57%
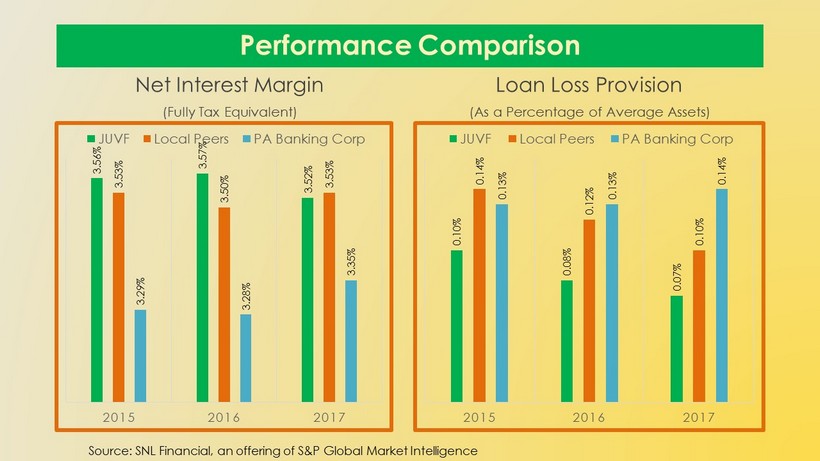
Performance Comparison Net Interest Margin (Fully Tax Equivalent) 3.56% 3.57% 3.52% 3.53% 3.50% 3.53% 3.29% 3.28% 3.35% 2015 2016 2017 JUVF Local Peers PA Banking Corp Loan Loss Provision (As a Percentage of Average Assets) 0.10% 0.08% 0.07% 0.14% 0.12% 0.10% 0.13% 0.13% 0.14% 2015 2016 2017 JUVF Local Peers PA Banking Corp Source: SNL Financial, an offering of S&P Global Market Intelligence
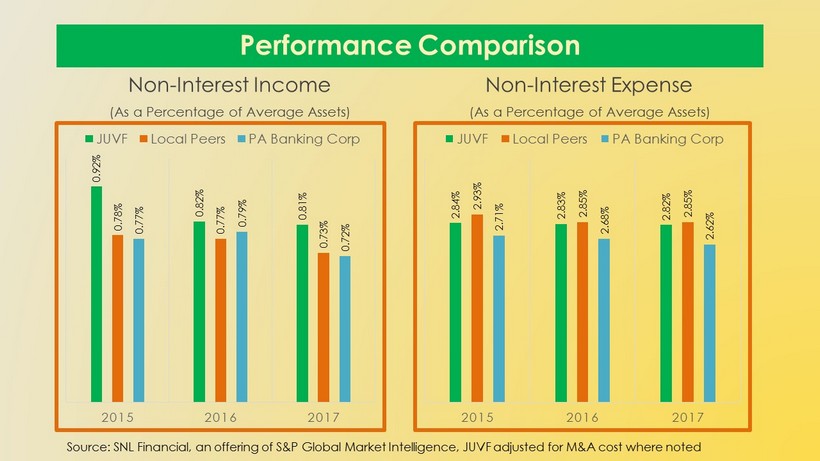
Performance Comparison Non - Interest Income (As a Percentage of Average Assets) 0.92% 0.82% 0.81% 0.78% 0.77% 0.73% 0.77% 0.79% 0.72% 2015 2016 2017 JUVF Local Peers PA Banking Corp Non - Interest Expense (As a Percentage of Average Assets) 2.84% 2.83% 2.82% 2.93% 2.85% 2.85% 2.71% 2.68% 2.62% 2015 2016 2017 JUVF Local Peers PA Banking Corp Source: SNL Financial, an offering of S&P Global Market Intelligence, JUVF adjusted for M&A cost where noted
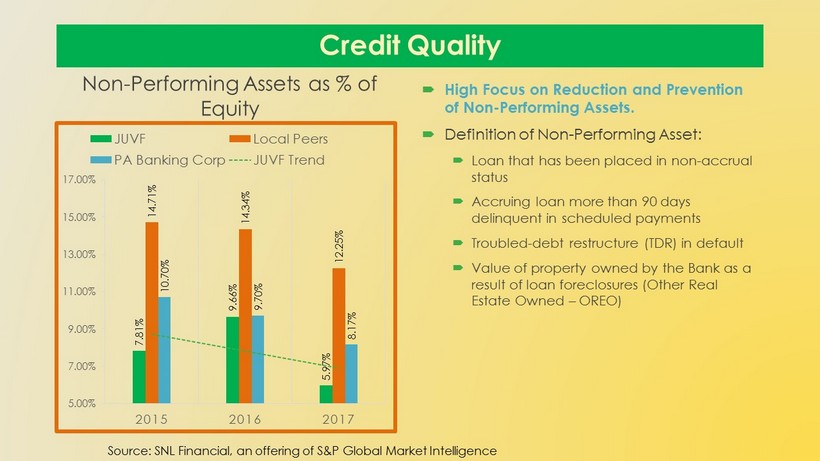
Credit Quality Non - Performing Assets as % of Equity 7.81% 9.66% 5.97% 14.71% 14.34% 12.25% 10.70% 9.70% 8.17% 5.00% 7.00% 9.00% 11.00% 13.00% 15.00% 17.00% 2015 2016 2017 JUVF Local Peers PA Banking Corp JUVF Trend High Focus on Reduction and Prevention of Non - Performing Assets. Definition of Non - Performing Asset: Loan that has been placed in non - accrual status Accruing loan more than 90 days delinquent in scheduled payments Troubled - debt restructure (TDR) in default Value of property owned by the Bank as a result of loan foreclosures (Other Real Estate Owned – OREO) Source: SNL Financial, an offering of S&P Global Market Intelligence
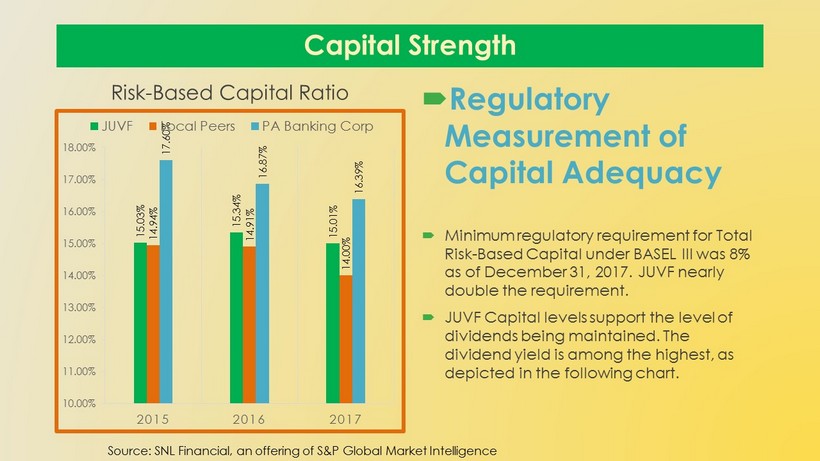
Capital Strength Risk - Based Capital Ratio 15.03% 15.34% 15.01% 14.94% 14.91% 14.00% 17.60% 16.87% 16.39% 10.00% 11.00% 12.00% 13.00% 14.00% 15.00% 16.00% 17.00% 18.00% 2015 2016 2017 JUVF Local Peers PA Banking Corp Regulatory Measurement of Capital Adequacy Minimum regulatory requirement for Total Risk - Based Capital under BASEL III was 8% as of December 31, 2017. JUVF nearly double the requirement. JUVF Capital levels support the level of dividends being maintained. The dividend yield is among the highest, as depicted in the following chart. Source: SNL Financial, an offering of S&P Global Market Intelligence
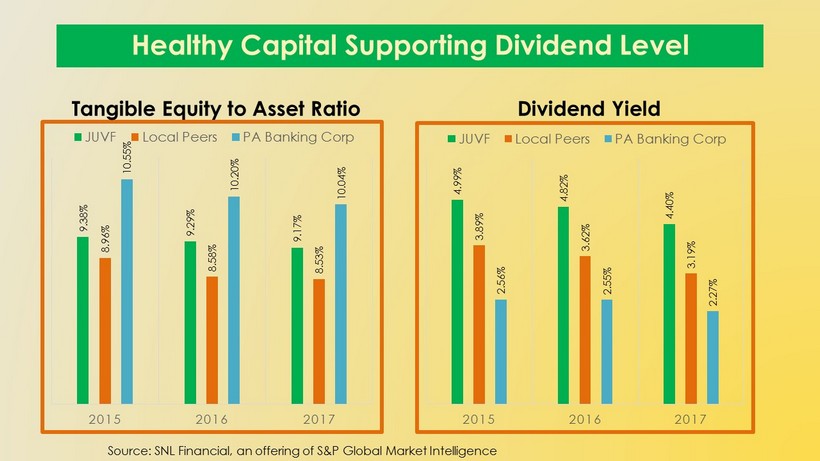
Healthy Capital Supporting Dividend Level 9.38% 9.29% 9.17% 8.96% 8.58% 8.53% 10.55% 10.20% 10.04% 2015 2016 2017 JUVF Local Peers PA Banking Corp Tangible Equity to Asset Ratio 4.99% 4.82% 4.40% 3.89% 3.62% 3.19% 2.56% 2.55% 2.27% 2015 2016 2017 JUVF Local Peers PA Banking Corp Dividend Yield Source: SNL Financial, an offering of S&P Global Market Intelligence
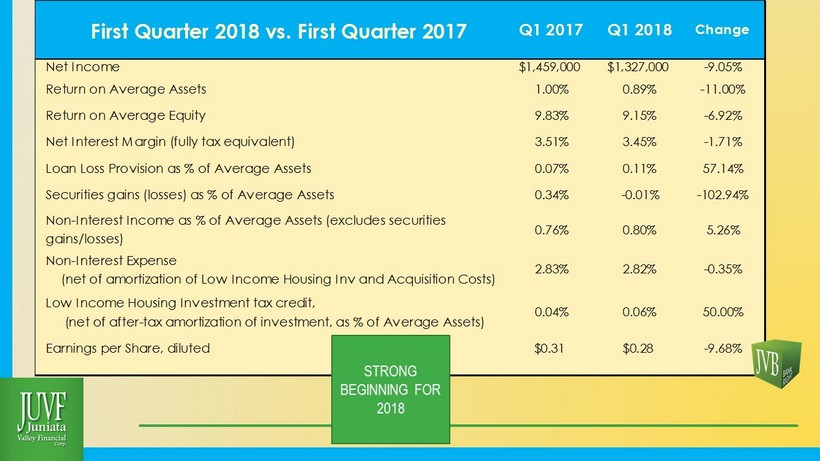
First Quarter 2018 vs. First Quarter 2017 Q1 2017 Q1 2018 Change Net Income $1,459,000 $1,327,000 -9.05% Return on Average Assets 1.00% 0.89% -11.00% Return on Average Equity 9.83% 9.15% -6.92% Net Interest Margin (fully tax equivalent) 3.51% 3.45% -1.71% Loan Loss Provision as % of Average Assets 0.07% 0.11% 57.14% Securities gains (losses) as % of Average Assets 0.34% -0.01% -102.94% Non-Interest Income as % of Average Assets (excludes securities gains/losses) 0.76% 0.80% 5.26% Non-Interest Expense (net of amortization of Low Income Housing Inv and Acquisition Costs) Low Income Housing Investment tax credit, (net of after-tax amortization of investment, as % of Average Assets) Earnings per Share, diluted $0.31 $0.28 -9.68% 2.83% 2.82% -0.35% 0.04% 0.06% 50.00% STRONG BEGINNING FOR 2018

Marcie A. Barber President and Chief Executive Officer Literal Blocks

Marcie A. Barber President and Chief Executive Officer Figurative Blocks
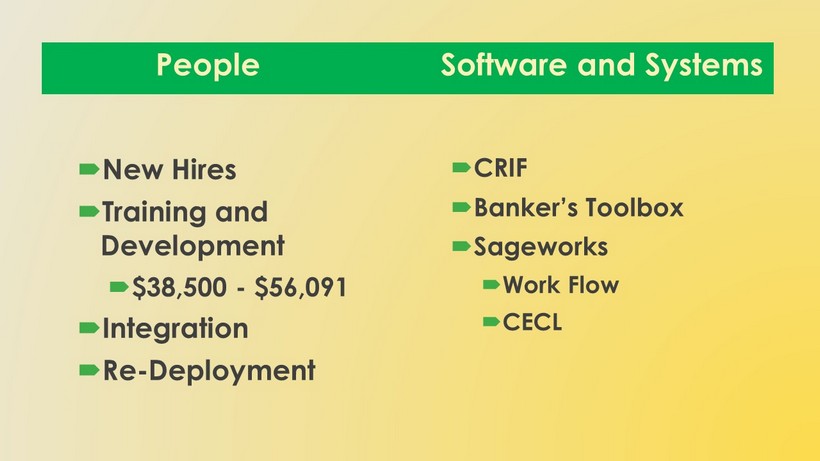
People Software and Systems New Hires Training and Development $38,500 - $56,091 Integration Re - Deployment CRIF Banker’s Toolbox Sageworks Work Flow CECL
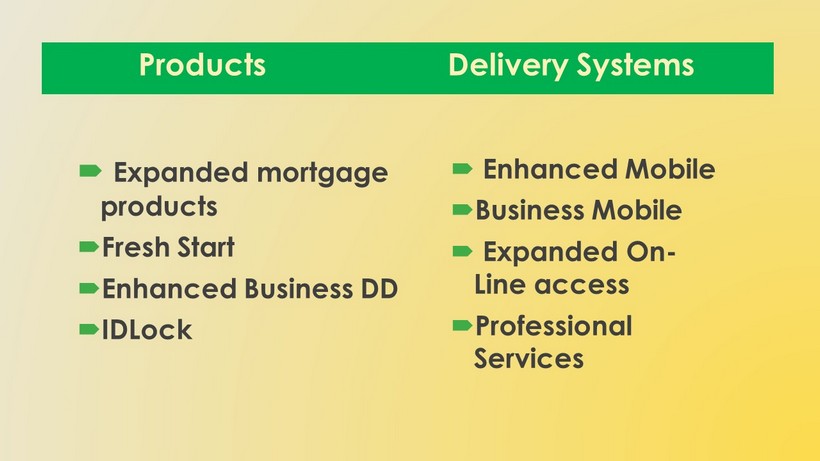
Products Delivery Systems Expanded mortgage products Fresh Start Enhanced Business DD IDLock Enhanced Mobile Business Mobile Expanded On - Line access Professional Services

Marcie A. Barber President and Chief Executive Officer Shareholder Blocks
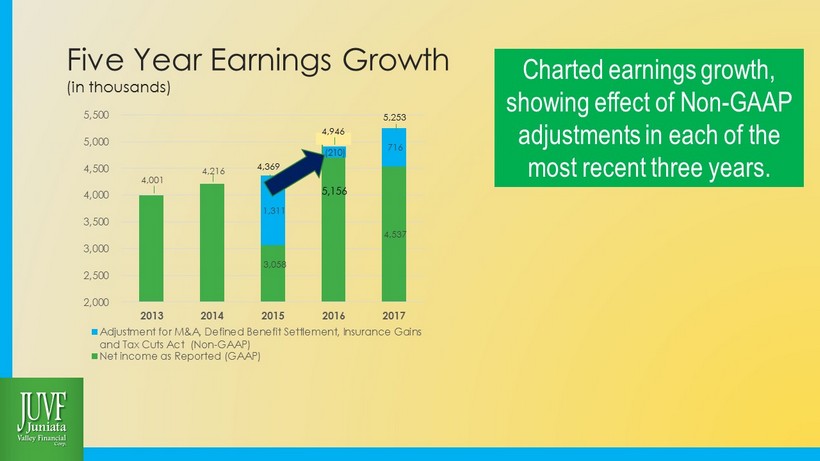
Five Year Earnings Growth (in thousands) 4,001 4,216 3,058 4,537 1,311 (210) 716 2,000 2,500 3,000 3,500 4,000 4,500 5,000 5,500 2013 2014 2015 2016 2017 Adjustment for M&A, Defined Benefit Settlement, Insurance Gains and Tax Cuts Act (Non-GAAP) Net income as Reported (GAAP) Charted earnings growth, showing effect of Non - GAAP adjustments in each of the most recent three years. 4,369 5,253 5,156 4,946

Primary Earnings Interest Spread Price Liabilities Price Earning Assets Fee Services Trust Wealth Management Deposit Services Exchange Income Manage Costs of: Facilities Personnel Security Compliance Capital Oversight


Hot off the Press

Questions?