Attached files
| file | filename |
|---|---|
| 8-K - CHINA FUND INC | fp0033547_8k.htm |

Data as of 4/30/18
Manager’s Commentary
Market Review
The Greater China equity space experienced significant sector rotations in April 2018, as investors remained cautious on the market outlook amid the escalating US and China trade tension. In particular, a US ban on sales to ZTE Corporation ("ZTE"), a Chinese multinational telecommunications equipment and systems company, triggered renewed concerns over the technology sector, which ended the month as the worst performer. On the other hand, commodity related sectors including materials and energy performed very well. In terms of country performance, it was not surprising to see Taiwan equities, which are very technology heavy, become the underperformer; while Hong Kong equities, especially Hong Kong domestic financial names, delivered strong performance.
Fund Review
The China Fund, Inc. (the "Fund") underperformed the benchmark in April 2018. The Fund's underweight position in Hong Kong financials was the main detractor from performance. In particular, Hong Kong domestic banking names performed strongly driven by a rising interest rate environment in Hong Kong and the United States. However, this is partially compensated by the Fund's strong stock selection in the Chinese banking space. Top contributors over the month included China Merchants Bank Co. Ltd., whose share price was aided by solid earnings results, steady improvement in credit cost, as well as China's Central Bank's Reserve Requirement Ratio (RRR) cut, which we believe will have a positive impact on the net interest margin of banks. We continue to favor Chinese banks which we believe should benefit from the improving asset quality trend in China. In particular, we like banks with strong franchises in asset management and retail banking, as well as those that focus on improving deposit base.
Another visible detractor in April was WIN Semiconductors Corp. This Taiwan-based company is a key component supplier enabling Apple iPhone's 3D sensing feature. Share price corrected significantly in April after a disappointing first quarter result announcement and the company's conservative near term outlook. Over the longer-term horizon, we do expect this company to be well positioned to benefit from the wider adoption of 3D sensing among Android smart devices. Further expansion to other business areas, including 5G and autonomous driving, could lead to more sustainable and balanced growth for the company. We have maintained our position in this stock.
Outlook
The United States ban on sales to ZTE opened a fresh front as tensions escalated between the United States and China. In our view, this is different from previous trade conflicts, in that the purpose is to ensure the technology leadership of the United States and therefore protect strategic national security. If tensions escalate further, it could increase the risk of equity markets and particularly selective sectors/companies that rely on US technology. It is still too early to turn pessimistic on Hong Kong/China equities given the situation at the moment is highly fluid and keeps changing. Our base case is that a full blown trade war will be avoided, but the United States and China tension will persist and remain a medium-/long-term overhang on the equity markets.
Under such a scenario, we believe the alpha opportunities in the China equity space will be increasingly micro-driven rather than macro-driven. In other words, earnings delivery and earnings surprise should be the key driver of equity performance. Our investment approach focuses on finding underappreciated companies, where the turnaround potential is yet to be reflected in its valuations. Typically, positive earnings surprises will trigger strong re-ratings, allowing us to benefit from both earnings growth and valuation expansion. Over the past two quarters, some of our portfolio holdings in consumer staples and materials spaces have started the early phase of re-rating. We have been utilizing the recent market volatility to add more to conviction names which have over-corrected, including automobile companies, smartphone component makers and Macau gaming names.
| In Brief | |
| Fund Data | |
| Description | Seeks to achieve longterm capital appreciation through investments in China companies. |
| Listing Date (NYSE) | July 10, 1992 |
| Total Fund Assets (millions) | $378.1 |
| Median Market Cap (in billions) | $15.7 |
| Distribution Frequency | Annual |
| Management Firm | Allianz Global Investors U.S. LLC |
| Portfolio Management | Christina Chung, CFA, CMA Lead Portfolio Manager |
|
Performance (US$ Returns) (as of 4/30/18) |
||
| Fund | Benchmark1 | |
| One Month | -0.58% | -0.44% |
| Three Month | -8.10% | -7.53% |
| One Year | 26.98% | 26.65% |
| Three Year | 3.42% | 6.59% |
| Net Asset Value / Market Price | |
| Net Asset Value (NAV) / Market Price at Inception | $13.15 / $14.26 |
| NAV / Market Price (as of 4/30/18) | $24.05 / $21.45 |
| High / Low Ranges (52-Week) | |
| High / Low NAV | $26.38 / $19.27 |
| High / Low Market Price | $24.70 / $17.38 |
| Premium/Discount to NAV (as of 4/30/18) | -10.81% |
| Fund Data (Common Shares) | |
| Shares Outstanding | 15,722,675 |
| Average Daily Volume | 24,047 |
| Expense Ratio | 1.49% |
Fund Manager

Christina Chung, CFA, CMA
Lead Portfolio Manager
| 1. | MSCI Golden Dragon Index. |

The China Fund, Inc.
Investment Objective
The investment objective of The China Fund, Inc. (the "Fund") is to achieve long-term capital appreciation. The Fund seeks to achieve its objective through investment in the equity securities of companies and other entities with significant assets, investments, production activities, trading or other business interests in China or which derive a significant part of their revenue from China.
The Fund has an operating policy that the Fund will invest at least 80% of its assets in China companies. For this purpose, 'China companies' are (i) companies for which the principal securities trading market is in China; (ii) companies for which the principal securities trading market is outside of China or in companies organized outside of China, that in both cases derive at least 50% of their revenues from goods or services sold or produced, or have at least 50% of their assets in China; or (iii) companies organized in China. Under the policy, China means the People's Republic of China, including Hong Kong, and Taiwan. The Fund will provide its stockholders with at least 60 days' prior notice of any change to this policy.
| Returns For Periods Ended April 30, 2018* | ||||||||
| 1 Month | 3 Month | YTD | 1 Year | 3 Year | 5 Year | 10 Year | Inception | |
| NAV | -0.58% | -8.10% | 2.65% | 26.98% | 3.42% | 10.40% | 6.53% | 10.74% |
| Market Price | -3.07% | -10.58% | -0.88% | 25.03% | 4.25% | 10.42% | 6.81% | 9.90% |
| MSCI Golden Dragon Index | -0.44% | -7.53% | 1.61% | 26.65% | 6.59% | 10.59% | 5.48% | — |
| Calendar Year Returns | ||||||||
| 2010 | 2011 | 2012 | 2013 | 2014 | 2015 | 2016 | 2017 | |
| NAV | 27.26% | -24.37% | 12.12% | 18.31% | 7.82% | -5.51% | 0.60% | 37.92% |
| Market Price | 23.60% | -27.51% | 20.52% | 12.70% | 5.29% | -6.38% | -0.47% | 47.41% |
| MSCI Golden Dragon Index | 13.60% | -18.35% | 22.65% | 7.25% | 8.06% | -7.12% | 5.75% | 44.19% |
Past performance is not a guide to future returns.
| * | Annualized for periods greater than one year. |
Source: State Street Bank and Trust Company. Source for index data: MSCI as at April 30, 2018. Investment returns are historical and do not guarantee future results. Investment returns reflect changes in net asset value and market price per share during each period and assumes that dividends and capital gains distributions, if any, were reinvested. The net asset value (NAV) percentages are not an indication of the performance of a shareholder's investment in the Fund, which is based on market price. NAV performance includes the deduction of management fees and other expenses. Market price performance does not include the deduction of brokerage commissions and other expenses of trading shares and would be lower had such commissions and expenses been deducted. It is not possible to invest directly in an index.
Premium/Discount

| Sector Allocation | ||
| Fund | Benchmark1 | |
| Information Technology | 38.29% | 36.68% |
| Financials | 22.94% | 24.37% |
| Consumer Discretionary | 10.97% | 8.33% |
| Industrials | 6.17% | 5.14% |
| Real Estate | 6.12% | 8.13% |
| Consumer Staples | 4.59% | 2.24% |
| Telecom Services | 3.28% | 3.87% |
| Energy | 2.44% | 3.25% |
| Utilities | 1.69% | 3.36% |
| Health Care | 1.50% | 1.61% |
| Materials | 1.06% | 3.01% |
| Other assets & liabilities | 0.95% | 0.00% |
Source: IDS GmbH - Analysis and Reporting Services, a subsidiary of Allianz SE.
| Country Allocation | ||
| Fund | Benchmark1 | |
| China | 80.18% | 78.10% |
| Hong Kong Red Chips | 12.03% | 8.06% |
| Hong Kong 'H' shares | 21.08% | 19.50% |
| Equity linked securities ('A' shares) | 0.00% | 0.00% |
| China 'A' & 'B' shares | 2.71% | 0.05% |
| Other Hong Kong securities | 44.36% | 34.42% |
| Others | 0.00% | 16.08% |
| Taiwan | 18.86% | 21.90% |
| Other assets & liabilities | 0.96% | 0.00% |
| Top 10 Holdings | |
| TENCENT HOLDINGS LTD (China) | 9.47% |
| TAIWAN SEMIC CO LTD (Taiwan) | 6.76% |
| CHINA CONSTRUCTION BANK CORP (China) | 6.70% |
| ALIBABA GROUP HOLDING LTD (China) | 6.40% |
| SUN HUNG KAI PROPERTIES LTD (H.K.) | 4.09% |
| CHINA MERCHANTS BANK CO LTD (China) | 3.91% |
| GLOBALWAFERS CO LTD (Taiwan) | 2.85% |
| HK EXCHANGES & CLEARING LTD (H.K.) | 2.55% |
| CHINA EVERBRIGHT INTL (China) | 2.29% |
| NANYA TECHNOLOGY CORP (Taiwan) | 2.26% |
| Portfolio Characteristics | ||
| Fund | Benchmark1 | |
| P/E Ratio | 13.96 | 13.73 |
| P/B Ratio | 1.85 | 1.68 |
| Issues in Portfolio | 52 | 290 |
| Foreign Holdings (%) | 99.05 | 100.00 |
| Other assets & liabilities (%) | 0.95 | 0.00 |
| Yield (%) | 2.27 | 3.41 |
Source: IDS GmbH - Analysis and Reporting Services, a subsidiary of Allianz SE.
| 1. | MSCI Golden Dragon Index. |
The China Fund, Inc.
Distribution History (10 Year)
| Declaration Date | Ex-dividend Date | Record Date | Payable Date |
Distribution/ Share |
Income | Long-term Capital Gain | Short-term Capital Gain |
| 12/8/08 | 12/22/08 | 12/24/08 | 1/23/09 | $5.81740 | $0.48130 | $5.33610 | — |
| 12/9/09 | 12/22/09 | 12/24/09 | 12/29/09 | $0.25570 | $0.25570 | — | — |
| 12/8/10 | 12/21/10 | 12/24/10 | 12/29/10 | $2.27420 | $0.37460 | $1.89960 | — |
| 12/8/11 | 12/21/11 | 12/23/11 | 12/29/11 | $2.99640 | $0.17420 | $2.82220 | — |
| 12/10/12 | 12/20/12 | 12/24/12 | 12/28/12 | $3.25170 | $0.34730 | $2.90440 | — |
| 12/13/13 | 12/19/13 | 12/23/13 | 12/27/13 | $3.31400 | $0.43870 | $2.87530 | — |
| 12/8/14 | 12/18/14 | 12/22/14 | 1/5/15 | $3.76510 | $0.29820 | $3.46690 | — |
| 12/16/15 | 12/23/15 | 12/28/15 | 1/6/16 | $1.49580 | $0.21330 | $0.84620 | $0.43630 |
| 12/9/16 | 12/19/16 | 12/21/16 | 1/5/17 | $0.46780 | $0.46780 | — | — |
| 12/8/17 | 12/18/17 | 12/19/17 | 1/4/18 | $0.54930 | $0.54930 | — | — |
Distribution/Share includes Income, Long-term Capital gains and Short-term Capital gains.
The China Fund NAV Performance of $10,000 since inception
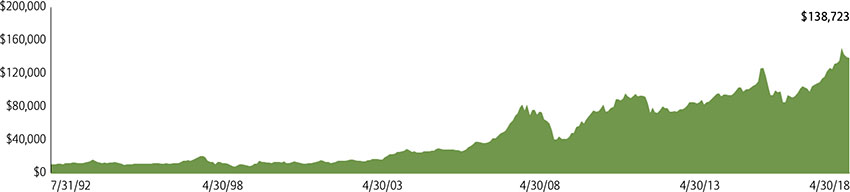
Past performance is not a guide to future returns.
Index Description
MSCI Golden Dragon Index
The MSCI Golden Dragon Index captures the equity market performance of large and mid cap China securities (H shares, B shares, Red-Chips and P-Chips) and non-domestic China securities listed in Hong Kong and Taiwan.
It is not possible to invest directly in an index.
The China Fund, Inc.
Portfolio in Full
| Sector | Company (exchange ticker) | Market Price | Holding | Value US$ | % of net assets |
| Information Technology | 38.30 | ||||
| TENCENT HOLDINGS LTD | 700 | 391.00 | 719,000 | 35,821,282 | 9.47 |
| TAIWAN SEMICONDUCTOR MANUFACTURING CO LTD | 2330 | 227.00 | 3,332,000 | 25,564,497 | 6.76 |
| ALIBABA GROUP HOLDING LTD ADR | BABA | 178.54 | 135,464 | 24,185,743 | 6.40 |
| GLOBALWAFERS CO LTD | 6488 | 483.00 | 660,000 | 10,774,509 | 2.85 |
| NANYA TECHNOLOGY CORP | 2408 | 93.00 | 2,724,000 | 8,562,419 | 2.26 |
| BAIDU INC ADR | BIDU | 250.90 | 24,101 | 6,046,941 | 1.60 |
| ASM PACIFIC TECHNOLOGY LTD | 522 | 108.00 | 433,500 | 5,965,520 | 1.58 |
| MEDIATEK INC | 2454 | 340.00 | 489,000 | 5,619,455 | 1.49 |
| DIGITAL CHINA HOLDINGS LTD | 861 | 4.49 | 9,305,000 | 5,323,511 | 1.41 |
| FOCUS MEDIA INFORMATION TE A | 002027 | 11.23 | 2,817,705 | 4,987,128 | 1.32 |
| WIN SEMICONDUCTORS CORP | 3105 | 224.50 | 501,000 | 3,801,548 | 1.01 |
| CHUNGHWA PRECISION TEST TECH CO LTD | 6510 | 762.00 | 138,000 | 3,554,189 | 0.94 |
| AAC TECHNOLOGIES HOLDINGS INC | 2018 | 114.30 | 208,500 | 3,036,601 | 0.80 |
| GOLDPAC GROUP LTD | 3315 | 2.42 | 4,970,000 | 1,532,524 | 0.41 |
| Financials | 22.95 | ||||
| CHINA CONSTRUCTION BANK CORP | 939 | 8.32 | 23,898,000 | 25,334,968 | 6.70 |
| CHINA MERCHANTS BANK CO LTD | 3968 | 34.60 | 3,356,500 | 14,797,836 | 3.91 |
| HONG KONG EXCHANGES & CLEARING LTD | 388 | 257.20 | 293,800 | 9,628,491 | 2.55 |
| BANK OF CHINA LTD | 3988 | 4.30 | 15,500,000 | 8,492,501 | 2.25 |
| PING AN INSURANCE GROUP CO OF CHINA LTD | 2318 | 77.55 | 817,000 | 8,073,081 | 2.14 |
| AIA GROUP LTD | 1299 | 70.70 | 873,600 | 7,869,869 | 2.08 |
| FUBON FINANCIAL HOLDING CO LTD | 2881 | 51.00 | 2,805,000 | 4,835,144 | 1.28 |
| CITIC SECURITIES CO LTD | 6030 | 19.36 | 1,640,000 | 4,045,616 | 1.07 |
| CATHAY FINANCIAL HOLDING CO LTD | 2882 | 53.50 | 2,030,000 | 3,670,762 | 0.97 |
| Consumer Discretionary | 10.97 | ||||
| GALAXY ENTERTAINMENT GROUP LTD | 27 | 69.40 | 747,000 | 6,605,650 | 1.75 |
| NEW ORIENTAL EDUCATION & TECHNOLOGY GROUP ADR | EDU | 89.84 | 67,468 | 6,061,325 | 1.60 |
| CHINA INTERNATIONAL TRAVEL A | 601888 | 52.11 | 640,632 | 5,261,444 | 1.39 |
| QINGLING MOTORS CO LTD | 1122 | 2.52 | 14,816,000 | 4,757,371 | 1.26 |
| MGM CHINA HOLDINGS LTD | 2282 | 21.70 | 1,536,000 | 4,247,041 | 1.12 |
| LI & FUNG LTD | 494 | 3.97 | 8,120,000 | 4,107,542 | 1.09 |
| BRILLIANCE CHINA AUTOMOTIVE HOLDINGS LTD | 1114 | 14.16 | 2,040,000 | 3,680,687 | 0.97 |
| JD.COM INC ADR | JD | 36.51 | 100,616 | 3,673,490 | 0.97 |
| SANDS CHINA LTD | 1928 | 45.75 | 532,400 | 3,103,592 | 0.82 |
| Industrials | 6.16 | ||||
| CHINA EVERBRIGHT INTERNATIONAL LTD | 257 | 11.08 | 6,146,000 | 8,676,964 | 2.29 |
| QINGDAO PORT INTERNATIONAL CO LTD | 6198 | 6.45 | 6,077,000 | 4,994,413 | 1.32 |
| CN STATE CONSTRUCTION INTERNATIONAL HOLDINGS LTD | 3311 | 10.26 | 3,602,000 | 4,708,977 | 1.25 |
| KING SLIDE WORKS CO LTD | 2059 | 419.50 | 185,000 | 2,623,071 | 0.69 |
| AIRTAC INTERNATIONAL GROUP | 1590 | 516.00 | 133,000 | 2,319,571 | 0.61 |
| Real Estate | 6.12 | ||||
| SUN HUNG KAI PROPERTIES LTD | 16 | 126.80 | 957,000 | 15,462,035 | 4.09 |
| CHINA OVERSEAS LAND & INVESTMENT LTD | 688 | 26.55 | 1,622,000 | 5,487,201 | 1.45 |
| COUNTRY GARDEN HOLDINGS CO LTD | 2007 | 16.22 | 1,062,000 | 2,194,880 | 0.58 |
| Consumer Staples | 4.59 | ||||
| CHINA MENGNIU DAIRY CO LTD | 2319 | 25.50 | 2,439,000 | 7,924,784 | 2.10 |
| WH GROUP LTD | 288 | 8.19 | 5,726,000 | 5,975,451 | 1.58 |
| VINDA INTERNATIONAL HOLDINGS LTD | 3331 | 13.60 | 1,984,000 | 3,438,081 | 0.91 |
| Telecom Services | 3.27 | ||||
| CHINA UNICOM HONG KONG LTD | 762 | 11.18 | 3,660,000 | 5,213,848 | 1.38 |
| PCCW LTD | 8 | 4.87 | 6,053,000 | 3,756,082 | 0.99 |
| CHINA MOBILE LTD | 941 | 75.20 | 356,500 | 3,415,961 | 0.90 |
The China Fund, Inc.
Portfolio in Full
| Sector | Company (exchange ticker) | Market Price | Holding | Value US$ | % of net assets |
| Energy | 2.44 | ||||
| CHINA OILFIELD SERVICES LTD | 2883 | 7.87 | 4,768,000 | 4,781,305 | 1.26 |
| CHINA PETROLEUM & CHEMICAL CORP | 386 | 7.67 | 4,552,000 | 4,448,700 | 1.18 |
| Utilities | 1.70 | ||||
| CHINA RESOURCES POWER HOLDINGS CO LTD | 836 | 15.12 | 1,778,000 | 3,425,461 | 0.91 |
| BEIJING ENTERPRISES HOLDINGS LTD | 392 | 39.50 | 591,000 | 2,974,542 | 0.79 |
| Health Care | 1.50 | ||||
| CSPC PHARMACEUTICAL GROUP LTD | 1093 | 20.20 | 2,208,000 | 5,683,108 | 1.50 |
| Materials | 1.06 | ||||
| TIANGONG INTERNATIONAL CO LTD | 826 | 1.75 | 17,970,000 | 4,007,021 | 1.06 |
Source: State Street Bank and Trust Company, IDS GmbH - Analysis and Reporting Services, a subsidiary of Allianz SE.
Important Information:
Holdings are subject to change daily. The Fund seeks to achieve its objective through investment in the equity securities of companies and other entities with significant assets, investments, production activities, trading or other business interests in China or which derive a significant part of their revenue from China. Investing in non-U.S. securities entails additional risks, including political and economic risk and the risk of currency fluctuations, as well as lower liquidity. These risks, which can result in greater price volatility, will generally be enhanced in less diversified funds that concentrate investments in a particular geographic region.
The information contained herein has been obtained from sources believed to be reliable but Allianz Global Investors U.S. LLC and its affiliates do not warrant the information to be accurate, complete or reliable. The opinions expressed herein are subject to change at any time and without notice. Past performance is not indicative of future results. This material is not intended as an offer or solicitation for the purchase or sale of any financial instrument. Investors should consider the investment objectives, risks, charges and expenses of any mutual fund carefully before investing. This and other information is contained in the Fund's annual and semiannual reports, proxy statement and other Fund information, which may be obtained by contacting your financial advisor or visiting the Fund's website at www.chinafundinc.com. This information is unaudited and is intended for informational purposes only. It is presented only to provide information on the Fund's holdings, performance and strategies. The Fund is a closed-end exchange traded management investment company. This material is presented only to provide information and is not intended for trading purposes. Closed-end funds, unlike open-end funds, are not continuously offered. After the initial public offering by a closed-end fund, its shares can be purchased and sold on the open market through a stock exchange, where shares may trade at a premium or a discount. The market price of holdings is subject to change daily.
P/E is a ratio of security price to earnings per share. Typically, an undervalued security is characterized by a low P/E ratio, while an overvalued security is characterized by a high P/E ratio. P/B is a ratio of the current stock price to the book value. This is used to identify undervalued stocks. Dividend yield is the annual percentage of return earned by an investor on a common or preferred stock. The average dividend yield is the dividend rate divided by current share price.
©2018 Allianz Global Investors Distributors LLC.
| Investment Products: Not FDIC Insured | May Lose Value | Not Bank Guaranteed | FS-CHN-0418 |