Attached files
Table of Contents
As filed with the Securities and Exchange Commission on May 17, 2018
Registration No. 333-
UNITED STATES
SECURITIES AND EXCHANGE COMMISSION
Washington, D.C. 20549
FORM S-1
REGISTRATION STATEMENT
UNDER
THE SECURITIES ACT OF 1933
BJ’s Wholesale Club Holdings, Inc.
(Exact name of registrant as specified in its charter)
| Delaware | 5331 | 45-2936287 | ||
| (State or other jurisdiction of incorporation or organization) |
(Primary Standard Industrial Classification Code Number) |
(I.R.S. Employer Identification No.) |
25 Research Drive
Westborough, Massachusetts 01581
(774) 512-7400
(Address, including zip code, and telephone number, including area code, of registrant’s principal executive offices)
Christopher J. Baldwin
Chairman, President & Chief Executive Officer
25 Research Drive
Westborough, Massachusetts 01581
(774) 512-7400
(Name, address, including zip code, and telephone number, including area code, of agent for service)
Copies to:
| Howard A. Sobel Gregory P. Rodgers Ryan K. deFord Latham & Watkins LLP 885 Third Avenue New York, New York 10022 Telephone: (212) 906-1200 Fax: (212) 751-4864 |
Graham Luce Brigitte Eichner 25 Research Drive Westborough, Massachusetts 01581 Telephone: (774) 512-7400 Fax: (508) 986-7153 |
Colin J. Diamond F. Holt Goddard White & Case LLP 1221 Avenue of the Americas New York, New York 10020 Telephone: (212) 819-8200 Fax: (212) 354-8113 |
Approximate date of commencement of proposed sale to the public: As soon as practicable after this Registration Statement becomes effective.
If any of the securities being registered on this Form are to be offered on a delayed or continuous basis pursuant to Rule 415 under the Securities Act of 1933 check the following box. ☐
If this Form is filed to register additional securities for an offering pursuant to Rule 462(b) under the Securities Act, please check the following box and list the Securities Act registration statement number of the earlier effective registration statement for the same offering. ☐
If this Form is a post-effective amendment filed pursuant to Rule 462(c) under the Securities Act, check the following box and list the Securities Act registration statement number of the earlier effective registration statement for the same offering. ☐
If this Form is a post-effective amendment filed pursuant to Rule 462(d) under the Securities Act, check the following box and list the Securities Act registration statement number of the earlier effective registration statement for the same offering. ☐
Indicate by check mark whether the registrant is a large accelerated filer, an accelerated filer, a non-accelerated filer, a smaller reporting company or an emerging growth company. See the definitions of “large accelerated filer,” “accelerated filer,” “smaller reporting company” and “emerging growth company” in Rule 12b-2 of the Exchange Act.
| Large accelerated filer |
☐ |
Accelerated filer |
☐ | |||
| Non-accelerated filer |
☒ |
Smaller reporting company |
☐ | |||
| Emerging growth company | ☐ |
If an emerging growth company, indicate by check mark if the registrant has elected not to use the extended transition period for complying with any new or revised financial accounting standards provided pursuant to Section 7(a)(2)(B) of the Securities Act. ☐
CALCULATION OF REGISTRATION FEE
|
| ||||
| Title of each class of securities to be registered |
Proposed maximum aggregate |
Amount of registration fee | ||
| Common stock, par value $0.01 per share |
$100,000,000 | $12,450 | ||
|
| ||||
|
| ||||
| (1) | Estimated solely for the purpose of calculating the registration fee in accordance with Rule 457(o) under the Securities Act of 1933, as amended. |
| (2) | Includes the offering price of shares of common stock that may be sold if the underwriters fully exercise their option to purchase additional shares of common stock from the selling stockholders. |
The Registrant hereby amends this Registration Statement on such date or dates as may be necessary to delay its effective date until the Registrant shall file a further amendment which specifically states that this Registration Statement shall thereafter become effective in accordance with Section 8(a) of the Securities Act of 1933, as amended, or until this Registration Statement shall become effective on such date as the Commission, acting pursuant to said Section 8(a), may determine.
Table of Contents
The information in this prospectus is not complete and may be changed. We may not sell these securities until the registration statement filed with the Securities and Exchange Commission is effective. This prospectus is not an offer to sell these securities and it is not soliciting an offer to buy these securities in any jurisdiction where the offer or sale is not permitted.
SUBJECT TO COMPLETION. DATED MAY 17, 2018.
Shares

BJ’s Wholesale Club Holdings, Inc.
Common Stock
This is an initial public offering of shares of common stock of BJ’s Wholesale Club Holdings, Inc. We are selling all of the shares to be sold in the offering, except as set forth below.
Prior to this offering, there has been no public market for the common stock. The initial public offering price is expected to be between $ and $ per share. We have applied to list our common stock on the New York Stock Exchange (“NYSE”) under the symbol “BJ.”
The underwriters have an option for a period of 30 days to purchase up to a maximum of additional shares of our common stock from the selling stockholders. We will not receive any of the proceeds from any sale of shares being sold by the selling stockholders.
After the consummation of this offering, we expect to be a “controlled company” within the meaning of the corporate governance standards of the NYSE.
Investing in our common stock involves risk. See “Risk Factors” beginning on page 18 to read about factors you should consider before buying shares of our common stock.
| Price to Public |
Underwriting Discounts(1) | Proceeds to BJ’s Wholesale Club Holdings, Inc. |
||||||||||
| Per Share |
$ | $ | $ | |||||||||
| Total |
$ | $ | $ | |||||||||
| (1) | See “Underwriting” for additional information regarding underwriting compensation. |
Delivery of the shares of common stock will be made on or about , 2018.
Neither the Securities and Exchange Commission (“SEC”) nor any other regulatory body has approved or disapproved of these securities or passed upon the accuracy or adequacy of this prospectus. Any representation to the contrary is a criminal offense.
| BofA Merrill Lynch | Deutsche Bank Securities | Goldman Sachs & Co. LLC | J.P. Morgan |
The date of this prospectus is , 2018.
Table of Contents
| Page | ||||
| ii | ||||
| ii | ||||
| iii | ||||
| iv | ||||
| iv | ||||
| 1 | ||||
| 18 | ||||
| 41 | ||||
| 43 | ||||
| 44 | ||||
| 45 | ||||
| 47 | ||||
| 50 | ||||
| 54 | ||||
| Management’s Discussion and Analysis of Financial Condition and Results of Operations |
59 | |||
| Letter from our Chief Executive Officer and Chief Financial & Administrative Officer |
80 | |||
| 83 | ||||
| 97 | ||||
| 104 | ||||
| 132 | ||||
| 134 | ||||
| 137 | ||||
| 142 | ||||
| 147 | ||||
| Material U.S. Federal Tax Considerations for Non-U.S. Holders of Our Common Stock |
149 | |||
| 153 | ||||
| 159 | ||||
| 160 | ||||
| 160 | ||||
| 160 | ||||
| F-1 | ||||
i
Table of Contents
You should rely only on the information included elsewhere in this prospectus and any free writing prospectus prepared by or on behalf of us that we have referred to you. Neither we, the selling stockholders nor the underwriters have authorized anyone to provide you with additional information or information different from that included elsewhere in this prospectus or in any free writing prospectus prepared by or on behalf of us that we have referred to you. If anyone provides you with additional, different or inconsistent information, you should not rely on it. Offers to sell, and solicitations of offers to buy, shares of our common stock are being made only in jurisdictions where offers and sales are permitted.
No action is being taken in any jurisdiction outside the United States to permit a public offering of common stock or possession or distribution of this prospectus in that jurisdiction. Persons who come into possession of this prospectus in jurisdictions outside the United States are required to inform themselves about and to observe any restriction as to this offering and the distribution of this prospectus applicable to those jurisdictions.
This prospectus includes estimates regarding market and industry data that we prepared based on our management’s knowledge and experience in the markets in which we operate, together with information obtained from various sources, including publicly available information, industry reports and publications, surveys, our customers, distributors, suppliers, trade and business organizations and other contacts in the markets in which we operate.
In this prospectus, we make reference to consistently offering 25% or more savings on a representative basket of manufacturer-branded groceries compared to typical supermarket competitors. The following is how we verify that we provide our members this value:
| • | We periodically identify the four supermarket chains (or banners) most prevalent in our clubs’ primary trade areas (the “Supermarket Competitors”). |
| • | We create a “basket” of 100 popular manufacturer-branded grocery food and non-food items, each of which was among our top-selling national brand items in its category and was also carried, in varying pack sizes, in supermarkets. We believe this basket is representative of manufacturer-branded grocery items because of their popular appeal and recognition—as evidenced by both presence and sales volume—in our clubs and at the Supermarket Competitors. |
| • | We hire an independent third-party company to visit multiple (a minimum of six) sites for each of the Supermarket Competitors, which are located in the trade areas of one or more of our clubs, no less frequently than once every two weeks. The third-party comparison shoppers record the prices of each item in the basket carried by the Supermarket Competitor, in the closest pack size to the size BJ’s carries, and then they calculate the price on a unit-price basis. We compare unit prices to ensure a common denominator for price comparisons. We direct the measurement company to ignore coupons and exclude items that were on promotion by us or by a Supermarket Competitor, as promotional prices do not represent everyday values in our view. |
| • | To calculate the Supermarket Competitors’ average price for the items in the basket, we average the measured prices of the items at each Supermarket Competitor store sampled, create an average measured unit price for each item at each Supermarket Competitor, compare those to our chain average unit price, and arrive at a relative percentage difference for each Supermarket Competitor. We then average these percentage differences for the four Supermarket Competitors. The average difference is consistently more than 25%. |
ii
Table of Contents
We will only include an item in the basket if it is carried by at least two of the four Supermarket Competitors. This means that over time we may replace items in the basket with different comparable items, if we are consistently unable to get prices for comparison on an item, to be sure we continue to offer the same relative savings.
We also use a rolling average of measured prices. At a minimum, we will use an average of two consecutive periodic or monthly measurements of prices at both BJ’s (using our chain average price) and the Supermarket Competitors. We may use up to 52 consecutive weeks, or 12 consecutive months, of price data for comparison. We make our savings claim using price data that are not more than 60 days old, as to the most recent price measurement in the data set.
The Supermarket Competitors do not include non-traditional sellers of groceries, such as drugstores, online sellers, superstores, convenience stores, other membership clubs and mass market retailers.
In presenting this information, we have made certain assumptions that we believe to be reasonable based on such data and other similar sources and on our knowledge of, and our experience to date in, the markets for the products we distribute. Market share data is subject to change and may be limited by the availability of raw data, the voluntary nature of the data gathering process and other limitations inherent in any statistical survey of market shares. In addition, customer preferences are subject to change. Accordingly, you are cautioned not to place undue reliance on such market share data. References herein to the markets in which we conduct our business refer to the geographic metropolitan areas in which our clubs are located.
We report on the basis of a 52- or 53-week fiscal year, which ends on the Saturday closest to the last day of January. Accordingly, references herein to “fiscal year 2012” relate to the 53 weeks ended February 2, 2013, references herein to “fiscal year 2013” relate to the 52 weeks ended February 1, 2014, references herein to “fiscal year 2014” relate to the 52 weeks ended January 31, 2015, references herein to “fiscal year 2015” relate to the 52 weeks ended January 30, 2016, references herein to “fiscal year 2016” relate to the 52 weeks ended January 28, 2017, and references herein to “fiscal year 2017” relate to the 53 weeks ended February 3, 2018.
As used in this prospectus, unless the context otherwise requires, references to:
| • | “ABL Facility” means our $1,000.0 million senior secured asset based revolving credit facility and term loan; |
| • | “the Company,” “BJ’s,” “we,” “us” and “our” mean BJ’s Wholesale Club Holdings, Inc. and, unless the context otherwise requires, its consolidated subsidiaries; |
| • | “GAAP” means U.S. generally accepted accounting principles; |
| • | “First Lien Facility” means our $1,925.0 million senior secured first lien term loan facility entered into on February 3, 2017; |
| • | “Prior ABL Facility” means our $1,000.0 million senior secured asset based revolving credit facility and term loan prior to its amendment on February 3, 2017; |
| • | “Prior First Lien Facility” means our $1,500.0 million senior secured first lien term loan facility that was refinanced by the First Lien Facility on February 3, 2017; |
| • | “Prior Second Lien Facility” means our $600.0 million senior secured second lien term loan facility that was refinanced by the Second Lien Facility on February 3, 2017; |
| • | “Prior Term Loan Facilities” means our Prior First Lien Facility and our Prior Second Lien Facility; |
iii
Table of Contents
| • | “Second Lien Facility” means our $625.0 million senior secured second lien term loan facility entered into on February 3, 2017; |
| • | “selling stockholders” means the entities named herein (other than the Company) that intend to sell shares in this offering; |
| • | “Sponsors” means investment funds affiliated with or advised by CVC Capital Partners (“CVC”) and Leonard Green & Partners, L.P. (“Leonard Green”), which collectively own a controlling interest in us; |
| • | “Stockholders Agreement” means the stockholders agreement dated September 30, 2011, among CVC Beacon LP (f/k/a CVC Beacon LLC), Green Equity Investors V, L.P., Green Equity Investors Side V, L.P., Beacon Coinvest LLC and the Company that was executed in connection with the acquisition of the Company by the Sponsors; and |
| • | “Term Loan Facilities” means our First Lien Facility and our Second Lien Facility, together. |
This prospectus includes trademarks and service marks owned by us, including BJ’s Wholesale Club®, BJ’s®, Wellsley Farms®, Berkley Jensen®, My BJ’s Perks®, BJ’s Easy Renewal®, BJ’s Gas®, BJ’s Perks Elite®, BJ’s Perks Plus®, Inner Circle® and BJ’s Perks Rewards®. This prospectus also contains trademarks, trade names and service marks of other companies, which are the property of their respective owners. Solely for convenience, trademarks, trade names and service marks referred to in this prospectus may appear without the ®, ™ or SM symbols, but such references are not intended to indicate, in any way, that we will not assert, to the fullest extent under applicable law, our rights or the right of the applicable licensor to these trademarks, trade names and service marks. We do not intend our use or display of other parties’ trademarks, trade names or service marks to imply, and such use or display should not be construed to imply, a relationship with, or endorsement or sponsorship of us by, these other parties.
Certain financial measures presented in this prospectus, such as Adjusted EBITDA and free cash flow, are not recognized under GAAP. We define “Adjusted EBITDA” as income from continuing operations before interest expense, net, provision (benefit) for income taxes and depreciation and amortization, adjusted for the impact of certain other items, including compensatory payments related to options, stock-based compensation expense, pre-opening expenses, management fees, noncash rent, strategic consulting expenses, severance, asset retirement obligations and other adjustments. We define “free cash flow” as net cash provided by operating activities net of capital expenditure.
Adjusted EBITDA
We present Adjusted EBITDA, which is not a recognized financial measure under GAAP, because we believe it assists investors and analysts in comparing our operating performance across reporting periods on a consistent basis by excluding items that we do not believe are indicative of our core operating performance. You are encouraged to evaluate these adjustments and the reasons we consider them appropriate for supplemental analysis. In evaluating Adjusted EBITDA, you should be aware that in the future we may incur expenses that are the same as or similar to some of the adjustments in our presentation of Adjusted EBITDA. Our presentation of Adjusted EBITDA should not be construed as an inference that our future results will be unaffected by unusual or non-recurring items. There can be no assurance that we will not modify the presentation of Adjusted EBITDA following this offering, and any such modification may be material. In addition, Adjusted EBITDA may not be comparable to similarly titled measures used by other companies in our industry or across different industries.
iv
Table of Contents
Management believes Adjusted EBITDA is helpful in highlighting trends in our core operating performance compared to other measures, which can differ significantly depending on long-term strategic decisions regarding capital structure, the tax jurisdictions in which companies operate and capital investments. We also use Adjusted EBITDA in connection with establishing discretionary annual incentive compensation; to supplement GAAP measures of performance in the evaluation of the effectiveness of our business strategies; to make budgeting decisions; and to compare our performance against that of other peer companies using similar measures.
Adjusted EBITDA has its limitations as an analytical tool, and you should not consider them in isolation or as a substitute for analysis of our results as reported under GAAP. Some of these limitations include:
| • | Adjusted EBITDA does not reflect every expenditure, future requirements for capital expenditures or contractual commitments; |
| • | Adjusted EBITDA does not reflect changes in our working capital needs; |
| • | Adjusted EBITDA does not reflect the significant interest expense, or the amounts necessary to service interest or principal payments, on our outstanding debt; |
| • | Adjusted EBITDA does not reflect income tax expense, and because the payment of taxes is part of our operations, tax expense is a necessary element of our costs and ability to operate; |
| • | Adjusted EBITDA does not reflect expenditures associated with new club openings; |
| • | although depreciation and amortization are eliminated in the calculation of Adjusted EBITDA, the assets being depreciated and amortized will often have to be replaced in the future, and Adjusted EBITDA does not reflect any costs of such replacements; |
| • | non-cash compensation is and will remain a key element of our overall equity based compensation package, although we exclude it as an expense when evaluating our ongoing operating performance for a particular period; and |
| • | Adjusted EBITDA does not reflect the impact of earnings or charges resulting from matters we consider not to be indicative of our ongoing operations. |
We compensate for these limitations by relying primarily on our GAAP results and using Adjusted EBITDA only as supplemental information. See “Summary Consolidated Financial and Operating Data” for a reconciliation of income from continuing operations to Adjusted EBITDA.
Free Cash Flow
We present free cash flow because we use it to report to our board of directors and we believe it assists investors and analysts in evaluating our liquidity. Free cash flow should not be considered as an alternative to cash flows from operations as a liquidity measure. Free cash flow has limitations due to the fact that it does not represent the residual cash flow available for discretionary expenditures. For example, free cash flow does not incorporate payments made on capital lease obligations or cash payments for business acquisitions. Free cash flow is not a measurement of financial performance under GAAP, may have limitations as an analytical tool and should not be considered in isolation from, or as an alternative to, net income, cash flow provided by operations or any other measure of performance derived in accordance with GAAP. Therefore, we believe it is important to view free cash flow as a complement to our entire consolidated statements of cash flows. See “Summary Consolidated Financial and Operating Data” for a reconciliation of net cash from operating activities to free cash flow.
v
Table of Contents
This summary highlights selected information contained elsewhere in this prospectus. Because this is only a summary, it does not contain all the information that may be important to you. You should read the entire prospectus carefully, especially “Risk Factors” beginning on page 18 of this prospectus, “Management’s Discussion and Analysis of Financial Condition and Results of Operations” beginning on page 59 of this prospectus, and our consolidated financial statements and related notes included elsewhere in this prospectus, before deciding to invest in our common stock.
Our Company
BJ’s Wholesale Club is a leading warehouse club operator on the East Coast of the United States. We deliver significant value to our members, consistently offering 25% or more savings on a representative basket of manufacturer-branded groceries compared to traditional supermarket competitors. We provide a curated assortment focused on perishable products, continuously refreshed general merchandise, gas and other ancillary services to deliver a differentiated shopping experience that is further enhanced by our omnichannel capabilities.
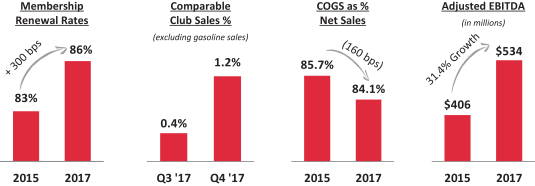
Over the last two years, we have hired Chris Baldwin as President and Chief Executive Officer and have made multiple senior management hires and changes, adding consumer packaged goods, digital and consulting experience to our leadership team. This new leadership team has implemented significant cultural and operational changes to our business, including transforming how we use data to improve member experience, instilling a culture of cost discipline, adopting a more proactive approach to growing our membership base and building an omnichannel offering oriented towards making shopping at BJ’s more convenient. These changes have delivered results rapidly, evidenced by positive and accelerating comparable club sales over the last two quarters and net income growth of over 109% and Adjusted EBITDA growth of 31% in aggregate over the last two fiscal years. We believe that these changes will continue to impact sales, profit margins and free cash flow performance favorably in the future. In fiscal year 2017, we generated total revenues, net income and Adjusted EBITDA of $12.8 billion, $50 million and $534 million, respectively.
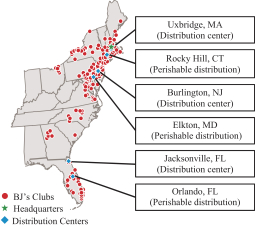
Since pioneering the warehouse club model in New England in 1984, we have grown our footprint to 215 large-format, high volume warehouse clubs spanning 16 states. In our core New England markets, which have high population density and generate a disproportionate part of U.S. GDP, we operate almost three times the number of clubs compared to the next largest warehouse club competitor. In addition to shopping in our clubs, members are able to shop when and how they want through our website, bjs.com; our highly-rated mobile app and our integrated Instacart same-day delivery offering.
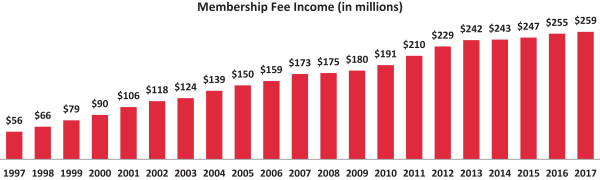
Our goal is to offer our members significant value and a meaningful return, in savings, on their annual membership fee. We have more than five million members paying annual fees to gain access to savings on groceries, consumables, general merchandise, gas and ancillary services. The annual membership fee for our base Inner Circle® Membership is $55 per year, and our BJ’s Perks Rewards® Membership, which offers additional value-enhancing features, costs $110 annually. We believe that members can save over ten times their $55 Inner Circle membership fee versus what they would have paid at traditional supermarket competitors when they spend $2,500 or more per year at BJ’s on manufacturer-branded groceries. In addition to providing significant savings on a representative basket of manufacturer-branded groceries, we accept all manufacturer coupons and rebates and also carry our own exclusive brands that enable members to save on price without compromising on quality. Our two private label brands, Wellsley Farms® and Berkley Jensen®, represent over $2 billion in sales, and are the largest brands we sell. Our customers recognize the relevance of our value proposition across economic environments, as demonstrated by over 20 consecutive years of membership fee income growth. Our membership fee income was $259 million for fiscal year 2017, and represents approximately half of our Adjusted EBITDA.
1
Table of Contents
Our approach to merchandising positions us between other warehouse clubs and grocery retailers. We sell a wide range of products, combining the bulk savings of a warehouse club with a broader assortment and selectively smaller pack sizes in perishable and grocery products than our club competitors. We have more stock keeping units (“SKUs”) than other warehouse retailers (around 7,200 versus around 4,500), which allows us to offer a greater selection while still enabling us to manage our inventory more efficiently than supermarket and mass-market competitors (which can carry 40,000 or upwards of 100,000 SKUs, respectively). We also offer a “treasure-hunt” experience with exciting finds in apparel, electronics, home goods and seasonal merchandise, as well as ancillary services such as tire installation, vision care, travel and insurance at attractive values. Our 134 gas stations provide members with additional savings and convenience, which we believe drive more trips and reinforce our strong value proposition. We believe our continuously refreshed assortment, expanded perishable offerings and differentiated value proposition drive strong member loyalty and our warehouse club industry-leading average shopping frequency of 22 trips to BJ’s annually. Our membership renewal rate for members with two or more years of tenure, a key indicator of member satisfaction and loyalty, was at an all-time high of 86% during fiscal year 2017.
Our target members care about value, quality and convenience and shop at warehouse clubs for their family needs. Our target members are a price sensitive demographic with large household sizes, representing nine million households in our trade areas. While we believe that we appeal to households with a wide range of incomes, we target households with an average annual income of approximately $75,000. We believe this group represents a historically underserved demographic in our core markets. Our membership offerings include our core Inner Circle® Membership and three enhanced levels of membership and affiliation through our BJ’s Perks Rewards® Membership and our My BJ’s Perks® Mastercard® offerings, which offer benefits such as cash back on purchases and discounted gasoline prices. These value-added membership tiers and affiliations further consolidate our members’ spend and improve customer loyalty and renewal rates, which ultimately increase the lifetime value of the member. The membership model allows us to capture more comprehensive data about our members, which we proactively use to optimize price, promotion and assortment to evolve with changing consumer demands.
Recent Strategic Initiatives
Led by Chris Baldwin, who became our CEO in February 2016 and Chairman in 2018, we have implemented significant changes to corporate culture and business operations over the last two fiscal years, modernizing the tools we use to compete in a rapidly evolving retail environment, including:
| • | Next Generation Leadership Team and Reinvigorated Culture: Our leadership team is led by Chris Baldwin, who we hired as President and Chief Operating Officer in 2015 and became our Chief Executive Officer in 2016 and Chairman in 2018, and Bob Eddy, who has been our Executive Vice President and Chief Financial Officer since January 2011 and took on the expanded responsibility of |
2
Table of Contents
| Chief Financial and Administrative Officer in February 2018. Our leadership team comprises management talent from diverse disciplines and backgrounds across all aspects of our business. We have newly hired, promoted or added responsibility for all 12 of our executive officers. The diverse backgrounds of our management team reflect experience in retail, consumer packaged goods (CPG), digital, audit and consulting, at leading companies such as Hess, Procter & Gamble, Nabisco, Bain & Company, PricewaterhouseCoopers, eBay and Dick’s, among others. The diversity of backgrounds supports various aspects of strategic initiatives across our company. For example, our leadership team’s experience in the CPG industry provides well-informed insight that helps position BJ’s as a key partner with suppliers and drive value for our customers while growing volume and margins. Our new leadership team has instilled a more proactive culture and approach to many facets of corporate decision making, which has rapidly delivered results. |
| • | Relentless Focus on Our Consumer: Our membership program provides us access to comprehensive data on consumer behavior and purchasing patterns. To capitalize on these data, we have used rich, data-driven analytics to drive improved decision-making in all aspects of our business, including procurement, merchandising, product positioning, club openings, marketing and promotion campaigns, among others. As a result, we have been able to implement a range of assortment initiatives such as supplier renegotiations, competitive contract options, SKU optimization and brand switching. We are also using our data to better target member acquisition and retention efforts for existing and new clubs. While we have made substantial progress, we believe there are opportunities to further develop our data analytics capabilities. |
| • | Enterprise-Wide Cost Discipline and Improved Profitability: We have created a culture of cost discipline across both member- and non-member facing functions. In 2015, we launched our category profitability improvement (“CPI”) program to address our procurement spending, and during fiscal years 2016 and 2017 we negotiated over $260 million in expected annual procurement savings. We drove these savings by improving dialogue with our national brand and private label suppliers to educate them on the value proposition we offer to our members and by implementing competitive bidding throughout our buying process. In partnership with our suppliers, we are now using our data to maximize marketing campaigns, creating a symbiotic relationship that provides benefits to both parties. We further lowered our cost of goods sold by recalibrating and streamlining our portfolio of private label brands from 13 to two focused brands and by emphasizing our value proposition versus national brand equivalents, which increased our private label penetration from 10% of total merchandise sales in fiscal year 2012 to 19% in fiscal year 2017. We have also focused on staying disciplined in our overhead cost structure and have been able to hold addressable SG&A expenses relatively flat, allowing topline growth and gross profit expansion to translate into Adjusted EBITDA growth. We believe these cost savings will allow us to drive our next wave of growth through thoughtful investments in our business. |
| • | Technology-Driven Improvements to Customer Experience and Convenience: We have invested in omnichannel initiatives to boost convenience for our members. Powered by substantial back-end IT investments, we now offer, alongside in-store shopping, the enhanced convenience of an omnichannel shopping experience. We have launched mobile apps with Add-to-Card Coupons and Express Scan capabilities, have added Shop BJs.com — Pick Up in–Club capability, and recently rolled out same-day delivery of certain grocery items with no mark-up to item pricing which is available at most of our clubs, providing our members convenient ways to shop when and how they feel most comfortable. |
3
Table of Contents
These strategic initiatives have delivered results rapidly, as evidenced by several key operating metrics:
BJ’s Wholesale Club is a leading player in the large and growing U.S. warehouse club channel, a retail channel characterized by highly discounted prices and a curated selection of SKUs and services offered in a warehouse format. According to the Warehouse Club Intelligence Center, our channel generated $167 billion of sales in 2017 and has grown at a compound annual growth rate (CAGR) of 4.5% since 2007. This pace of growth exceeded that of the grocery and GAFO (General Merchandise, Apparel and Accessories, Furniture and Other Sales) retail channels, which experienced CAGRs of 2.7% and 1.1%, respectively, during this period, according to the U.S. Census.
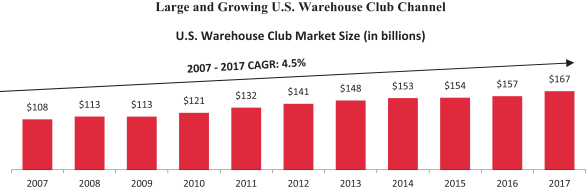
Source: Warehouse Club Intelligence Center-2017 Warehouse Club Guide
The warehouse club model maintains several structural advantages over other retail formats that enable operators to provide significant value and a differentiated experience for the customer while also achieving an attractive return on invested capital. These advantages include:
| • | membership fee subscriptions that provide stable cash flows while driving consolidation of customer spend and encouraging “buy more, save more” behavior; |
| • | comprehensive customer purchasing data, enabling operators to analyze customer spend more effectively and meet consumer demand; |
| • | low operating costs per square foot due to high inventory turnover, low club labor requirements and efficient distribution networks; and |
| • | limited and bulk-sized SKUs, and a “no-frills” warehouse environment, which deliver a clear value proposition to consumers who are increasingly focusing on savings and price transparency. |
4
Table of Contents
According to the Warehouse Club Intelligence Center, the U.S. warehouse club channel is projected to grow at a five year CAGR of 4.0% from 2017 through 2022. Our channel is well-positioned to continue taking market share from a variety of other retail channels, including supermarkets, mass, convenience, department, specialty and variety stores. In recent years, fundamental changes in consumer shopping behavior have contributed to significant disruptions in the retail industry. Among these key changes is a growing consumer focus on value, driven by multiple factors including the growth of ecommerce, an increase in price transparency and demographic trends such as household-forming millennials and retiring baby boomers. Together, these factors favor retailers that offer strong value propositions, including warehouse clubs, where value is a fundamental part of the consumer perception. Additional tailwinds for the channel include recent retail store closures and bankruptcies that, we believe, provide an opportunity to take incremental market share. Warehouse clubs are also well-positioned against e-commerce retailers due to competitive pricing, an emphasis on fresh food, differentiated service offerings including gasoline, and the “treasure hunt” experience of the warehouse club trip. We believe that warehouse club customers view online retail and club visits as complementary for their shopping needs, with club visits providing great value in essential needs and online retail filling in for one-off purchases not available at warehouse clubs.
Our Competitive Strengths
| • | Differentiated Shopping Experience: We believe our business model enables us to provide significant value to our members versus non-warehouse club competitors. We define providing value in multiple ways. First, BJ’s consistently offers prices that are 25% lower on a representative basket of manufacturer-branded groceries compared to traditional supermarket competitors. Second, we offer a continuously refreshed assortment of on-trend general merchandise, competitively-priced gas and a variety of ancillary services that our non-warehouse club competitors generally do not provide. We believe that members can save over ten times their $55 Inner Circle membership fee compared to what they would have paid at traditional supermarket competitors when they spend $2,500 or more per year at BJ’s on manufacturer-branded groceries. Our clubs also carry 950 fresh food SKUs in selectively smaller pack sizes, whereas other warehouse club competitors offer significantly fewer SKUs in predominantly larger pack sizes. Together, we believe our significant value proposition and broader offering drive increased customer loyalty and higher trip frequency, positioning us to compete more effectively for weekly shopping market share. |
| • Well-Positioned Footprint and Flexible New Club Model: We are a leading warehouse club operator on the East Coast of the United States, where our 215 clubs and 134 gas stations are well-positioned in some of the most attractive markets in the United States. In our core New England markets, we operate almost three times the number of clubs when compared to the next largest warehouse club competitor. Nearly all of our clubs generate positive club-level EBITDA. Many of our clubs are located in densely populated, high traffic locations that are difficult to replicate due to expensive and limited real estate. In 2016, the markets in which we operate delivered GDP contribution, population growth and |
| |
| household incomes above the respective U.S. averages. Our club sizes range from 63,000 sq. ft. to 150,000 sq. ft., with newer clubs primarily made up of our 85,000 sq. ft. model. We have also recently implemented a more data-driven model for new club site selection and member acquisition. This model, combined with our wide range of warehouse club sizes, allows for a flexible real estate | ||
5
Table of Contents
| expansion strategy that can be customized for infill or adjacent markets. We operate or contract for six distribution centers that serve our existing club base and have capacity to support up to 100 additional clubs along the East Coast of the United States. | ||
| • | Large and Loyal Membership Base: Our business model creates a virtuous cycle of member spending, savings and loyalty, which drives our large and loyal membership base. We have over five million paid memberships, made up of more than 10 million total members, as of fiscal year 2017. Due to our wider assortment and their more frequent visits, our members provide us with more comprehensive purchasing data compared to other warehouse club operators. This member data allows us to better execute supplier renegotiations, competitive contract options, SKU optimization and brand switching. Our target member represents the largest segment of warehouse club shoppers in BJ’s trade areas with 9 million households and $7 billion of annual club channel grocery spend. The strong loyalty of our membership base is reflected in our all-time high renewal rate of 86% during fiscal year 2017. Additionally, as our membership base is price sensitive, our value proposition resonates even more during economic downturns, as evidenced by our stronger comparable club sales results versus other warehouse clubs during these historical periods. |
| • | Attractive Strong Free Cash Flow across Economic Cycles: Our membership model, low operating cost structure and disciplined capital spending allow us to generate predictable, strong free cash flow. Membership fees provide us with a stable stream of high margin revenue that is independent of merchandise sales, accounting for approximately half of Adjusted EBITDA in 2017, and positions us advantageously versus non-warehouse competitors. This income stream has grown every year over the past two decades. Additionally, our low club labor requirements and efficient distribution network result in low operating costs per square foot. We maintain a disciplined working capital strategy focused on sustaining low receivable levels and inventory turnover that matches or exceeds payment terms. Our clubs typically require a limited amount of maintenance capital expenditures to operate. Our business model enabled cash flow from operating activities to grow by 32%, from $159 million to $210 million, and free cash flow to grow by 55%, from $47 million to $73 million, from fiscal 2015 to fiscal 2017. Our strong and steady free cash flow allows us to invest growth-focused capital in new clubs and initiatives, which we believe will generate positive returns on investment. |
| • | Experienced Management Team with a Proven Track Record: Our management team is led by Chairman, President and Chief Executive Officer Chris Baldwin, who we appointed Chief Executive Officer in February 2016 and Chairman in 2018. Chris has over 30 years of experience in retail and consumer products and, given his significant experience in the consumer products industry, brings a differentiated, “consumer-oriented” approach to retail. Chris also serves as the Chairman of the National Retail Federation, where he gains valuable insight into the broader retail industry. Chris collaborates closely with Bob Eddy, our Executive Vice President and Chief Financial and Administrative Officer. Bob is among the longest serving members of the BJ’s executive team, joining BJ’s in 2007, becoming Executive Vice President and Chief Financial Officer in 2011, and taking on the expanded responsibility of Chief Financial and Administrative Officer in February 2018. We also recently bolstered our team by appointing Lee Delaney as Chief Growth Officer in May 2016. Lee took on the expanded responsibility of Chief Commercial Officer in May 2018. Prior to joining BJ’s, Lee was a Partner in the Consumer Products practice at Bain & Company, where he gained a deep understanding of retailer-supplier dynamics. Other members of the BJ’s management team include recent outside hires and internal promotions. Our current management team has driven BJ’s recent performance momentum and is implementing a culture of operational discipline with processes and procedures focused on long-term, profitable growth. |
6
Table of Contents
Our Growth Strategies
We believe we can drive sustainable sales and profit growth by executing on the following strategies:
| • | Grow Our Member Base: We benefit from access to comprehensive data on our members’ shopping behaviors that, we believe, is instrumental in implementing targeted, data-driven marketing and merchandising initiatives that improve the in-club shopping experience, grow wallet share and increase new member acquisition. We have invested significantly in augmenting our member acquisition and retention strategies, including investments in member segmentation and marketing, with the aim of driving a shift towards greater member engagement and membership renewals. For example, by recently upgrading our prospecting strategy from rigid, analog, semiannual mass campaigns to personalized, digital, “always on” campaigns, we believe we can continue to grow our member base. |
We have been successful in driving members into higher tiers of membership and affiliation, growing by 316% the number of members holding one of our My BJ’s Perks Mastercard offerings from fiscal year 2014 through fiscal year 2017. We are continually investing in our membership program to increase new member acquisition rates and drive renewals through value added membership and affiliation tiers. We believe we have the potential to significantly increase the penetration levels of our value-added membership and affiliation tiers. We are developing models to predict our members’ likelihood to renew so that we can proactively market to at-risk members, highlighting the value of their membership while encouraging breadth of shop and trip frequency with targeted promotions. We recently launched checkout lane prompting of premium membership awards and are piloting checkout lane credit card approvals to expedite the application process.
Our ongoing efforts also include increasing our use of social media, optimizing direct mail, converting promotional offer members into paid memberships, engaging young families and facilitating ease of membership renewals. We grew our BJ’s Easy Renewal® penetration from 18% in fiscal year 2015 to 37% in fiscal year 2017. We believe we can grow our Easy Renewal penetration further. We expect to leverage our membership data and deep analytics to dynamically optimize offers, providing a platform that, we believe, enables us to more effectively engage our members, transition them into value added membership and affiliation tiers and deliver greater share of wallet.
| • | Relentlessly Focus on the Consumer to Drive Sales: We intend to continue our efforts to optimize our product assortment and positioning and plan to expand our current product offerings into new and adjacent categories, including a broader apparel assortment, enhanced perishable offerings, tools and new family-oriented categories. We also have ongoing initiatives to enhance our private label offerings, deliver novel in-club experiences by continuously refreshing our assortment, improve workforce training and management through scheduling algorithms and provide services that enhance the overall member experience. We intend to continue initiatives aimed at growing comparable club sales through advancing member engagement, tailoring promotional offerings, improving the convenience of accessing our offering and allowing our members to complete their shopping in less time. We utilize social media, including via personalized outreach, to enhance our understanding both of member engagement and of the implications for shopping at our clubs and online. We are leveraging our learning to deliver greater value to our members and drive improved engagement. We also plan to expand our gas penetration and have identified opportunities to expand on-site and near-site gas stations at existing clubs and optimize pricing and loyalty programs. We focus our efforts on supporting the ease and consistency of each member’s experience, increasing trips to our clubs and enhancing the appeal of our clubs as a shopping destination. |
| • | Improve Trip Convenience and Differentiate Omnichannel Offering: During the Sponsors’ tenure as our owners, we have invested over $230 million in IT initiatives, including the implementation of SAP, which we believe is a key enabler in our ability to collect and utilize our data and further build our |
7
Table of Contents
| omnichannel capabilities. We are currently expanding several technology initiatives to enhance our omnichannel capabilities over the next two years. These initiatives include: |
| • | mobile apps with “Add-to-Card” (which allows users to add digital coupons to their membership card) and “Express Scan” functionalities (which allows members to use smart phones or hand-held devices to scan bar codes as they shop the club to facilitate quick checkout); |
| • | “Shop BJs.com—Pick Up in-Club” (which allows members to buy products online and pick-up in club within two hours); and |
| • | a same-day delivery offering, which allows members to shop our clubs from the convenience of BJs.com, and have orders delivered in as quickly as one hour for a nominal delivery fee. |
We are also aggressively advancing our digital capabilities to enhance personal outreach to our members. We have already added experienced and accomplished omnichannel and IT leadership talent to our team to facilitate these efforts and will continue to invest in our omnichannel capabilities and data analytics. We believe these initiatives will result in a more seamless, convenient shopping experience for our members and will drive financial results.
| • | Expand Our Strategic Footprint: We believe the six existing Company-operated and contracted distribution centers that serve our clubs are sufficient to support the opening of about 100 additional clubs along the East Coast of the United States, and we plan to open a total of 15-20 new clubs over the next five years. We will focus this expansion on infill and markets adjacent to our existing locations. We also expect to benefit from recent club and department store closures in several of our markets and adjacent markets. In fiscal years 2016 and 2017, we implemented a data-driven approach to club openings with results in our latest pilot clubs that included new membership at club opening that was 240% greater than our average new club opening in fiscal year 2015. |
| • | Continue to Enhance Profitability: Over the last three years, our management team led a number of operational improvements at BJ’s and delivered significant savings. For example, under our CPI program, which we launched in fiscal year 2015 to address procurement spend across 70 product categories, we implemented initiatives such as supplier renegotiations, SKU optimization and brand switching. During fiscal years 2016 and 2017, we negotiated over $260 million in expected annual procurement savings, with over $200 million of those savings impacting our cost of sales during those fiscal years and another $60 million scheduled to impact our cost of sales during fiscal year 2018. We are continuing to review additional product categories through our CPI program, which we believe can deliver significant incremental procurement savings. |
In January 2018, we increased our membership fees by 10%, consistent with our historical practice of raising membership fees every five years. Additionally, we have been focused on controlling our Selling, General and Administrative spend, and we will continue to invest in technologies to drive efficiencies in the club.
We believe we have opportunities to drive further productivity savings in the near- to medium-term through additional procurement savings, greater private label penetration and continued cost discipline. We believe our Adjusted EBITDA and free cash flow will improve further as we capture additional benefits from initiatives both already undertaken and to come.
Summary Risk Factors
We are subject to a number of risks, including risks that may prevent us from achieving our business objectives or that may adversely affect our business, financial condition, results of operations, cash flows and
8
Table of Contents
prospects. You should carefully consider the risks discussed in the section entitled “Risk Factors,” including the following risks, before investing in our common stock:
| • | our business being affected by issues that affect consumer spending; |
| • | our business depending on having a large and loyal membership, and how any harm to our relationship with our members could have a material adverse effect on our business, net sales and results of operations; |
| • | our business plan and operating results depending on our ability to procure the merchandise we sell at the best possible prices; |
| • | competition adversely affecting our profitability; |
| • | our dependence on vendors to supply us with quality merchandise at the right time and at the right price; |
| • | disruptions in our merchandise distribution, including disruption through a third-party perishable consolidator, adversely affecting sales and member satisfaction; |
| • | our failure to identify timely or respond effectively to consumer trends, which could negatively affect our relationship with our members, the demand for our products and services and our market share; |
| • | our being subject to payment-related risks including risks to the security of payment and information; |
| • | changes in laws related to the Supplemental Nutrition Assistance Program (“SNAP”), to the governmental administration of SNAP or to SNAP’s electronic benefit transfer (“EBT”) systems adversely impacting our results of operations; |
| • | our success depending on our ability to attract and retain a qualified management team and other team members while controlling our labor costs; |
| • | union attempts to organize our team members disrupting our business; |
| • | our substantial leverage adversely affecting our ability to raise additional capital to fund our operations, limiting our ability to react to changes in the economy or our industry, or exposing us to interest rate risk; |
| • | there will be immediate and substantial dilution in the pro forma net tangible book value of the common stock purchased in this offering; and |
| • | our status as a “controlled company,” meaning the Sponsors will control us and have, among other things, the ability to approve or disapprove substantially all transactions and other matters requiring approval by shareholders, including the election of directors. |
Our business also faces a number of other challenges and risks discussed throughout this prospectus. You should read the entire prospectus carefully, especially “Risk Factors” beginning on page 18 of this prospectus, “Management’s Discussion and Analysis of Financial Condition and Results of Operations” beginning on page 59 of this prospectus, and our consolidated financial statements and related notes included elsewhere in this prospectus, before deciding to invest in our common stock.
Our Sponsors
Following the consummation of this offering, the Sponsors will continue to control a majority of the voting power of our outstanding common stock. Accordingly, the Sponsors will control us and have, among other things, the ability to approve or disapprove substantially all transactions and other matters requiring approval by shareholders, including the election of directors. You should consider that the interests of the Sponsors may
9
Table of Contents
differ from your interests in material respects and they may vote in a way with which you disagree and that may be adverse to your interests. See “Risk Factors—Because the Sponsors control a significant percentage of our common stock, they may control all major corporate decisions and their interests may conflict with your interests as an owner of our common stock and those of the Company” for more information. In connection with the acquisition of the Company by the Sponsors, the Company and the Sponsors entered into the Stockholders Agreement. At the consummation of this offering, the provisions of the Stockholders Agreement will terminate. However, the Stockholders Agreement contains certain registration rights provisions that survive the consummation of this offering. See “Certain Relationships and Related Party Transactions—Stockholders Agreement” for more information.
2017 Dividend
On February 3, 2017, we made (i) a $735.5 million dividend payment to our stockholders, including funds affiliated with the Sponsors, (ii) a $67.5 million payment to certain holders of our outstanding stock options and (iii) a $5.4 million payment to certain of our employees under retention bonus arrangements. We made these payments in part to return to the Sponsors a portion of their equity investment in us. To fund these payments, we amended the ABL Facility and entered into the First Lien Facility and the Second Lien Facility. We intend to use the proceeds of this offering, together with cash and borrowings under the ABL Facility, to repay approximately $ million of indebtedness plus $ million of accrued and unpaid interest and prepayment premium under the Second Lien Facility. To the extent any proceeds from this offering remain after the repayment in full of our Second Lien Facility, including any accrued and unpaid interest and prepayment premium thereon, we intend to use such remaining proceeds for general corporate purposes. See “Use of Proceeds” for more information.
Our Corporate Information
BJ’s Wholesale Club Holdings, Inc. is the issuer in this offering and changed its name from Beacon Holding Inc. on February 23, 2018. Our principal operating subsidiary is BJ’s Wholesale Club, Inc., which was previously an independent publicly traded corporation until its acquisition on September 30, 2011, by a subsidiary of Beacon Holding Inc., a company incorporated on June 24, 2011 by our Sponsors for the purpose of the acquisition. Upon consummation of this offering, our Sponsors will collectively own approximately % of our shares of common stock. See “Principal and Selling Stockholders.”
Our principal executive office is located at 25 Research Dr., Westborough, MA 01581 and our telephone number at that address is (774) 512-7400. We maintain a website on the Internet at www.bjs.com. We have included our website address in this prospectus as an inactive textual reference only. The information contained on, or that can be accessed through, our website is not a part of, and should not be considered as being incorporated by reference into, this prospectus.
10
Table of Contents
The Offering
| Common stock offered by us |
shares. |
| Common stock offered by the selling stockholders |
Up to shares pursuant to the underwriters’ option to purchase additional shares. |
| Common stock to be outstanding after this offering |
shares. |
| Option to purchase additional shares |
The underwriters have an option to purchase up to an aggregate of additional shares of common stock from the selling stockholders. The underwriters can exercise this option at any time within 30 days from the date of this prospectus. |
| Use of proceeds |
We estimate that the net proceeds to us from this offering, after deducting underwriting discounts and estimated offering expenses, will be approximately $ million, assuming an initial public offering price of $ per share (the midpoint of the price range set forth on the cover page of this prospectus). We intend to use the net proceeds from this offering, together with cash and borrowings under the ABL Facility, to repay approximately $ million of indebtedness plus $ million of accrued and unpaid interest and prepayment premium under the Second Lien Facility. To the extent any proceeds from this offering remain after the repayment in full of our Second Lien Facility, including any accrued and unpaid interest and prepayment premium thereon, we intend to use such remaining proceeds for general corporate purposes. See “Use of Proceeds.” We will not receive any of the proceeds from any sale of shares of common stock by the selling stockholders. |
| Reserved Share Program |
At our request, the underwriters have reserved for sale, at the initial public offering price, up to 5% of the shares offered by this prospectus for sale to some of our directors, officers, employees, distributors, dealers, business associates and related persons. If these persons purchase reserved shares it will reduce the number of shares available for sale to the general public. Any reserved shares that are not so purchased will be offered by the underwriters to the general public on the same terms as the other shares offered by this prospectus. |
| Dividend policy |
We do not expect to pay any dividends on our common stock for the foreseeable future. See “Dividend Policy.” |
| NYSE symbol |
“BJ.” |
| Controlled company |
Following this offering, we will be a “controlled company” within the meaning of the corporate governance rules of the NYSE. After the |
11
Table of Contents
| consummation of this offering, the Sponsors will control us and have, among other things, the ability to approve or disapprove substantially all transactions and other matters requiring approval by shareholders, including the election of directors. |
| Risk factors |
Investing in our common stock involves a high degree of risk. See “Risk Factors” beginning on page 18 of this prospectus for a discussion of factors you should carefully consider before investing in our common stock. |
The number of shares of common stock to be outstanding after this offering excludes:
| • | shares of common stock issuable upon the exercise of options outstanding under our equity incentive plans as of February 3, 2018 at a weighted average exercise price of $ per share; |
| • |
additional shares of common stock reserved for future issuance under our new omnibus incentive plan; and |
| • | shares reserved for issuance under our new employee stock purchase plan. |
Unless otherwise indicated, all information contained in this prospectus:
| • | assumes the reclassification of our contingently redeemable common stock to stockholders’ equity resulting from the automatic termination of non-Sponsor stockholders’ put rights upon the consummation of this offering; |
| • | assumes an initial public offering price of $ per share, which is the midpoint of the price range set forth on the cover page of this prospectus; |
| • | assumes the underwriters’ option to purchase additional shares from the selling stockholders will not be exercised; |
| • | gives effect to a -for- stock split effected on , 2018; and |
| • | gives effect to our amended and restated certificate of incorporation and our amended and restated by-laws. |
12
Table of Contents
Summary Consolidated Financial and Operating Data
We present below our summary consolidated statements of operations and of cash flow data for the fiscal years ended January 30, 2016, January 28, 2017 and February 3, 2018, and our consolidated balance sheet data as of February 3, 2018. We have derived this information from our audited consolidated financial statements included elsewhere in this prospectus.
The historical results presented below are not necessarily indicative of the results to be expected for any future period. You should read the summary consolidated financial and operating data presented below in conjunction with “Management’s Discussion and Analysis of Financial Condition and Results of Operations” and our consolidated financial statements and related notes included elsewhere in this prospectus.
The following tables also set forth certain summary unaudited pro forma consolidated financial information for the fiscal year ended February 3, 2018 giving effect to (i) the reclassification of our contingently redeemable common stock to stockholders’ equity resulting from the automatic termination of the non-Sponsor stockholders’ put rights upon the consummation of this offering, (ii) our issuance and sale of shares of our common stock in this offering at an assumed initial public offering price of $ per share, the midpoint of the price range set forth on the cover page of this prospectus, after deducting underwriting discounts and estimated offering expenses payable by us, (iii) the application of the net proceeds from our initial public offering together with cash and borrowings under the ABL Facility, to repay approximately $ million of indebtedness plus $ million of accrued and unpaid interest and prepayment premium under the Second Lien Facility and (iv) the termination of the annual fee for our management services agreement with our Sponsors upon the consummation of this offering as set forth under the section “Unaudited Pro Forma Consolidated Financial Statements.” The summary pro forma consolidated financial information is presented for informational purposes only and does not purport to represent what our financial condition or results of operations actually would have been had the referenced events occurred on the dates indicated or to project our financial condition or results of operations as of any future date or for any future period. For additional information, see “Unaudited Pro Forma Consolidated Financial Statements.”
| Fiscal Year Ended | ||||||||||||
| January 30, 2016 |
January 28, 2017 |
February 3, 2018 |
||||||||||
| (dollars in thousands) | ||||||||||||
| Statement of Operations Data: |
||||||||||||
| Net sales |
$ | 12,220,215 | $ | 12,095,302 | $ | 12,495,995 | ||||||
| Membership fee income |
247,338 | 255,235 | 258,594 | |||||||||
|
|
|
|
|
|
|
|||||||
| Total revenues |
12,467,553 | 12,350,537 | 12,754,589 | |||||||||
| Cost of sales |
10,476,519 | 10,223,017 | 10,513,492 | |||||||||
| Selling, general and administrative expenses |
1,797,780 | 1,908,752 | 2,017,821 | |||||||||
| Preopening expenses |
6,458 | 2,749 | 3,004 | |||||||||
|
|
|
|
|
|
|
|||||||
| Operating income |
186,796 | 216,019 | 220,272 | |||||||||
| Interest expense, net |
150,093 | 143,351 | 196,724 | |||||||||
|
|
|
|
|
|
|
|||||||
| Income from continuing operations before income taxes |
36,703 | 72,668 | 23,548 | |||||||||
| Provision (benefit) for income taxes |
12,049 | 27,968 | (28,427 | ) | ||||||||
|
|
|
|
|
|
|
|||||||
| Income from continuing operations |
24,654 | 44,700 | 51,975 | |||||||||
| Loss from discontinued operations, net of income taxes |
(550 | ) | (476 | ) | (1,674 | ) | ||||||
|
|
|
|
|
|
|
|||||||
| Net income |
$ | 24,104 | $ | 44,224 | $ | 50,301 | ||||||
|
|
|
|
|
|
|
|||||||
13
Table of Contents
| Fiscal Year Ended | ||||||||||||
| January 30, 2016 |
January 28, 2017 |
February 3, 2018 |
||||||||||
| (dollars in thousands, except per share data) | ||||||||||||
| Per Share Data: |
||||||||||||
| Income from continuing operations per share attributable to common stockholders — basic(1) |
$ | 1.96 | $ | 3.55 | $ | 4.12 | ||||||
| Income from continuing operations per share attributable to common stockholders — diluted(1) |
$ | 1.91 | $ | 3.45 | $ | 3.94 | ||||||
| Weighted average number of common shares outstanding(1): |
||||||||||||
| Basic |
12,553 | 12,595 | 12,627 | |||||||||
| Diluted |
12,892 | 12,962 | 13,181 | |||||||||
| Pro forma income from continuing operations per share attributable to common stockholders — basic(2) |
||||||||||||
| Pro forma income from continuing operations per share attributable to common stockholders — diluted(2) |
||||||||||||
| Pro forma weighted average number of common shares outstanding(2): |
||||||||||||
| Basic |
||||||||||||
| Diluted |
||||||||||||
| Cash dividends per share |
$ | — | $ | — | $ | 58.15 | ||||||
| Fiscal Year Ended | ||||||||||||
| January 30, 2016 |
January 28, 2017 |
February 3, 2018 |
||||||||||
| (in thousands) | ||||||||||||
| Statement of Cash Flow Data: |
||||||||||||
| Net cash provided by operating activities(3) |
$ | 159,361 | $ | 297,428 | $ | 210,085 | ||||||
| Net cash (used in) investing activities |
(112,363 | ) | (114,756 | ) | (137,466 | ) | ||||||
| Net cash (used in) financing activities |
(46,236 | ) | (188,118 | ) | (69,629 | ) | ||||||
|
|
|
|
|
|
|
|||||||
| Net increase (decrease) in cash and cash equivalents |
$ | 762 | $ | (5,446 | ) | $ | 2,990 | |||||
|
|
|
|
|
|
|
|||||||
| As of February 3, 2018 | ||||||||||||
| Actual | Pro Forma(4) (Reclassification Only) |
Pro Forma(5) | ||||||||||
| (in thousands) | ||||||||||||
| Balance Sheet Data: |
||||||||||||
| Cash and cash equivalents |
$ | 34,954 | $ | 34,954 | $ | |||||||
| Merchandise inventories |
1,019,138 | 1,019,138 | ||||||||||
| Property and equipment, net |
758,750 | 758,750 | ||||||||||
| Net working capital(6) |
51,813 | 51,813 | ||||||||||
| Total assets |
3,273,856 | 3,273,856 | ||||||||||
| Total debt(7) |
2,748,112 | 2,748,112 | ||||||||||
| Contingently redeemable common stock |
10,438 | — | ||||||||||
| Total stockholders’ deficit |
(1,029,857 | ) | (1,019,419 | ) | ||||||||
14
Table of Contents
| Fiscal Year Ended | ||||||||||||
| January 30, 2016 |
January 28, 2017 |
February 3, 2018 |
||||||||||
| Other Financial and Operating Data: |
||||||||||||
| Total clubs at end of period |
213 | 214 | 215 | |||||||||
| Comparable club sales(8) |
(4.2)% | (2.6)% | 0.8% | |||||||||
| Comparable club sales excluding gasoline sales |
(0.5)% | (2.3)% | (0.9)% | |||||||||
| Adjusted EBITDA (in thousands)(9) |
$ | 405,992 | $ | 457,326 | $ | 533,507 | ||||||
| Free cash flow (in thousands)(10) |
$ | 46,998 | $ | 182,672 | $ | 72,619 | ||||||
| Membership renewal rate |
84% | 85% | 86% | |||||||||
| Capital expenditures (in thousands) |
$ | 112,363 | $ | 114,756 | $ | 137,466 | ||||||
| (1) | See Note 21 to our consolidated financial statements included elsewhere in this prospectus for additional information regarding the calculation of basic and diluted income per share attributable to common stockholders. |
| (2) | See Note 2 to our unaudited pro forma consolidated financial statements included elsewhere in this prospectus for additional information regarding the calculation of pro forma basic and diluted income from continuing operations per share attributable to common stockholders. |
| (3) | Includes charges for discontinued operations. |
| (4) | The pro forma (reclassification only) balance sheet data as of February 3, 2018 gives effect to the reclassification of our contingently redeemable common stock to stockholders’ equity resulting from the automatic termination of non-Sponsor stockholders’ put rights upon the consummation of this offering. |
| (5) | The pro forma balance sheet data as of February 3, 2018 additionally gives effect to (i) the filing and effectiveness of our amended and restated certificate of incorporation and amended and restated by-laws; (ii) our issuance and sale of shares of our common stock in this offering at an assumed initial public offering price of $ per share, the midpoint of the price range set forth on the cover page of this prospectus after deducting underwriting discounts and estimated offering expenses payable by us; and (iii) the application of the net proceeds from this offering, together with cash and borrowings under the ABL Facility, to repay in full all obligations under the Second Lien Facility, as described in “Use of Proceeds.” Each $1.00 increase (decrease) in the assumed initial public offering price of $ per share, the midpoint of the price range set forth on the cover page of this prospectus, would increase (decrease) the pro forma amount of each of cash and cash equivalents, additional paid-in-capital, total stockholders’ equity and total capitalization by $ million, assuming the number of shares offered by us, as set forth on the cover page of this prospectus, remains the same, and after deducting underwriting discounts and estimated offering expenses payable by us. Similarly, each increase (decrease) of 1.0 million shares in the number of shares sold in this offering, as set forth on the cover page of this prospectus, would increase (decrease) the pro forma amount of each of cash and cash equivalents, additional paid-in-capital, total stockholders’ equity and total capitalization by $ million, assuming the assumed initial public offering price of $ per share, the midpoint of the price range set forth on the cover page of this prospectus, remains the same, and after deducting underwriting discounts and estimated offering expenses payable by us. |
| (6) | Net working capital is defined as total current assets (excluding cash and cash equivalents) less total current liabilities (excluding current portion of long-term debt). |
| (7) | Total debt includes current and non-current portion of long-term debt, net of discount and debt issuance costs and our obligations under capital leases and financing obligations. |
| (8) | Represents the change in net sales among all clubs open in both the given period and the prior period. In determining comparable club sales, we include all clubs that had been open for at least 13 months at the beginning of the relevant period and were in operation during all of both periods being compared, including relocated clubs and expansions. If a club is in the process of closing, it is excluded from the determination of comparable club sales. In addition, when applicable, we adjust for the effect of an additional week in a fiscal year or quarter. See “Management’s Discussion and Analysis of Financial Condition and Results of Operations” for additional information regarding our calculation of comparable club sales. |
15
Table of Contents
| (9) | The following is a reconciliation of our income from continuing operations to Adjusted EBITDA for the periods presented: |
| Fiscal Year Ended | ||||||||||||
| January 30, 2016 |
January 28, 2017 |
February 3, 2018 |
||||||||||
| (in thousands) | ||||||||||||
| Income from continuing operations |
$ | 24,654 | $ | 44,700 | $ | 51,975 | ||||||
| Interest expense, net |
150,093 | 143,351 | 196,724 | |||||||||
| Provision (benefit) for income taxes |
12,049 | 27,968 | (28,427 | ) | ||||||||
| Depreciation and amortization |
177,483 | 178,325 | 164,061 | |||||||||
| Compensatory payments related to options(a) |
1,497 | 6,143 | 77,953 | |||||||||
| Stock-based compensation expense(b) |
2,265 | 11,828 | 9,102 | |||||||||
| Preopening expenses(c) |
6,458 | 2,749 | 3,004 | |||||||||
| Management fees(d) |
8,139 | 8,053 | 8,038 | |||||||||
| Noncash rent(e) |
8,976 | 7,138 | 5,391 | |||||||||
| Strategic consulting(f) |
14,619 | 26,157 | 30,316 | |||||||||
| Severance(g) |
7,488 | 2,320 | 9,065 | |||||||||
| Asset retirement obligations(h) |
(7,044 | ) | — | — | ||||||||
| Other adjustments(i) |
(685 | ) | (1,406 | ) | 6,305 | |||||||
|
|
|
|
|
|
|
|||||||
| Adjusted EBITDA |
$ | 405,992 | $ | 457,326 | $ | 533,507 | ||||||
|
|
|
|
|
|
|
|||||||
| Adjusted EBITDA as a percentage of net sales |
3.3% | 3.8% | 4.3% | |||||||||
|
|
|
|
|
|
|
|||||||
| (a) | Represents payments to holders of our stock options made pursuant to antidilution provisions in connection with dividends paid to our Sponsors. |
| (b) | Represents non-cash stock-based compensation expense. |
| (c) | Represents direct incremental costs of opening or relocating a facility that are charged to operations as incurred. |
| (d) | Represents management fees paid to our Sponsors (or advisory affiliates thereof) in accordance with our management services agreement, which will terminate on the consummation of this offering. See “Certain Relationships and Related Party Transactions—Management Services Agreement.” |
| (e) | Consists of an adjustment to remove the non-cash portion of rent expense, which has been recorded on a straight-line basis in accordance with GAAP. |
| (f) | Represents fees paid to external consultants for two strategic initiatives of limited duration. |
| (g) | Represents termination costs associated with voluntary and involuntary workforce reductions that occurred in January 2016, incremental severance expense to former executives and voluntary workforce reductions that occurred in February 2018. |
| (h) | Represents non-cash gain related to a change in the estimated removal costs of our tanks and other infrastructure at our gasoline stations that has been accounted for as an asset retirement obligation. |
| (i) | Other non-cash or discrete items as determined by management, including amortization of a deferred gain from sale lease back transactions in 2013, non-cash accretion expense on asset retirement obligations, obligations associated with our post-retirement medical plan and incremental expense to former executives. Fiscal year 2017 includes corporate related transaction costs. |
See “Non-GAAP Financial Measures” for more information on our use of Adjusted EBITDA.
16
Table of Contents
| (10) | The following is a reconciliation of our net cash from operating activities to free cash flow for the periods presented: |
| Fiscal Year Ended | ||||||||||||
| January 30, 2016 |
January 28, 2017 |
February 3, 2018 |
||||||||||
| (in thousands) | ||||||||||||
| Net cash from operating activities |
$ | 159,361 | $ | 297,428 | $ | 210,085 | ||||||
| Less: Capital expenditures |
112,363 | 114,756 | 137,466 | |||||||||
|
|
|
|
|
|
|
|||||||
| Free cash flow |
$ | 46,998 | $ | 182,672 | $ | 72,619 | ||||||
|
|
|
|
|
|
|
|||||||
See “Non-GAAP Financial Measures” for more information on our use of free cash flow.
17
Table of Contents
You should carefully consider the risks described below, together with all of the other information included in this prospectus, before making an investment decision. Our business, financial condition and results of operations could be materially and adversely affected by any of these risks or uncertainties. In that case, the trading price of our common stock could decline, and you may lose all or part of your investment.
Risks Relating to Our Business
Our business may be affected by issues that affect consumer spending.
Our results of operations are affected by the level of consumer spending and, therefore, by changes in the economic factors that impact consumer spending. Certain economic conditions or events, such as a contraction in the financial markets; high rates of inflation or deflation; high unemployment levels; decreases in consumer disposable income; unavailability of consumer credit; higher consumer debt levels; higher tax rates and other changes in tax laws; higher interest rates; higher fuel, energy and other commodity costs; weakness in the housing market; higher insurance and health care costs; and product cost increases resulting from an increase in commodity prices, could reduce consumer spending generally, which could cause our customers to spend less or to shift their spending to our competitors. Reduced consumer spending may result in reduced demand for our items and may also require increased selling and promotional expenses. A reduction or shift in consumer spending could negatively impact our business, results of operations and financial condition.
We depend on having a large and loyal membership, and any harm to our relationship with our members could have a material adverse effect on our business, net sales and results of operations.
We depend on having a large and loyal membership. Our membership fee income is a substantial source of profit for us, contributing approximately half of our Adjusted EBITDA during fiscal year 2017. Further, our net sales are directly affected by the number of our members, the number of BJ’s Perks Rewards members and holders of our BJ’s Mastercard, how frequently our members shop at our clubs and the amount they spend on those trips, which means the loyalty and enthusiasm of our members directly impacts our net sales and operating income. Accordingly, anything that would harm our relationship with our members and lead to lower membership renewal rates or lower spending by members in our clubs could materially adversely affect our net sales, membership fee income and results of operations.
Things that could adversely affect our relationship with our members include:
| • | our failure to remain competitive in our pricing relative to our competitors; |
| • | our failure to provide the expected quality of merchandise; |
| • | our failure to offer the mix of products that our members want; |
| • | events that harm our reputation or the reputation of our private brands; |
| • | our failure to provide the convenience that our members may expect over time; |
| • | increases to our membership fees; and |
| • | increased competition from stores or clubs that have a more attractive mix of price and quality. |
In addition, we constantly need to attract new members to replace our members who fail to renew and to grow our membership base. If we fail to attract new members, our membership fee income and net sales could suffer.
18
Table of Contents
Our business plan and operating results depend on our ability to procure the merchandise we sell at the best possible prices.
Our business plan depends on our ability to procure the merchandise we sell at the best possible prices. Because we price our merchandise aggressively, the difference between the price at which we sell a given item and the cost at which we purchase it is often much smaller than it would be for our non-club competitors. Further, it is often not possible for us to reflect increases in our cost of goods by increasing our prices to members. Accordingly, small changes in the prices at which we purchase our goods can have a substantial impact on our operating profits. In fiscal year 2016, we began an initiative to obtain lower cost of goods on the merchandise we sell. If we fail in our efforts to reduce the prices we pay for goods, our growth could suffer. If the prices we pay for goods increase, our operating profit and results of operations could suffer, and if we are forced to increase our prices to our members, our member loyalty could suffer.
Competition may adversely affect our profitability.
The retail business is highly competitive. We compete primarily against other warehouse club operators and grocery and general merchandise retailers, including supermarkets and supercenters, and gasoline stations. Given the value and bulk purchasing orientation of our customer base, we compete to a lesser extent with internet retailers, hard discounters, department and specialty stores and operators selling a narrow range of merchandise. Some of these competitors, including two major warehouse club operators—Sam’s Club (a division of Wal-Mart Stores, Inc.) and Costco Wholesale Corporation—that operate on a multi-national basis and have significantly greater financial and marketing resources than BJ’s. These retailers and wholesalers compete in a variety of ways, including price, services offered to customers, distribution strategy, merchandise selection and availability, location, convenience, store hours and the attractiveness and ease of use of websites and mobile applications. The evolution of retailing through online and mobile channels has also improved the ability of customers to comparison shop with digital devices, which has enhanced competition. We cannot assure you that we will be able to compete successfully with existing or future competitors. Our inability to respond effectively to competitive factors may have an adverse effect on our profitability as a result of lost market share, lower sales or increased operating costs, among other things.
We depend on vendors to supply us with quality merchandise at the right time and at the right price.
We depend heavily on our ability to purchase merchandise in sufficient quantities at competitive prices. We source our merchandise from a wide variety of domestic and international vendors. Finding qualified vendors who meet our standards and accessing merchandise in a timely and efficient manner are significant challenges, especially with respect to vendors located and merchandise sourced outside the United States. We have no assurances of continued supply, pricing or access to new products, and, in general, any vendor could at any time change the terms upon which it sells to us or may discontinue selling to us. In addition, member demand may lead to insufficient in-stock positions of our merchandise.
Disruptions in our merchandise distribution, including disruption through a third-party perishables consolidator, could adversely affect sales and member satisfaction.
We depend on the orderly operation of our merchandise receiving and distribution process, primarily through our Company-operated and contracted distribution centers. Although we believe that our receiving and distribution process is efficient, unforeseen disruptions in operations due to fires, tornadoes, hurricanes, earthquakes or other catastrophic events, labor issues or other shipping problems (which may include, but are not limited to, strikes, slowdowns or work stoppages at the ports of entry for the merchandise that we import) may result in delays in the delivery of merchandise to our clubs, which could adversely affect sales and the satisfaction of our members.
One third-party distributor currently consolidates a substantial majority of our perishables for shipment to our clubs. While we believe that such a consolidation is in our best interest overall, any disruption in the
19
Table of Contents
operations of this distributor could materially impact our sales and profitability. In addition, a prolonged disruption in the operations of this distributor could require us to seek alternative perishables distribution arrangements, which may not be on attractive terms and could lead to delays in distribution of this merchandise, either of which could have a significant and material adverse effect on our business, results of operations and financial condition.
We may not identify timely or respond effectively to consumer trends, which could negatively affect our relationship with our members, the demand for our products and services and our market share.
It is difficult to predict consistently and successfully the products and services our members will demand over time. Our success depends, in part, on our ability to identify and respond to evolving trends in demographics and member preferences. Failure to identify timely or respond effectively to changing consumer tastes, preferences (including those relating to sustainability of product sources) and spending patterns could lead us to offer our members a mix of products or a level of pricing that they do not find attractive. This could negatively affect our relationship with our members, leading them to reduce their visits to our clubs and the amount they spend and potentially their decision to renew their membership. This would adversely affect the demand for our products and services and our market share. If we are not successful at predicting our sales trends and adjusting accordingly, we may also have excess inventory, which could result in additional markdowns and reduce our operating performance. This could have an adverse effect on margins and operating income.
We are subject to payment-related risks, including risks to the security of payment card information.
We accept payments using an increasing variety of methods, including cash and checks, a variety of credit and debit cards and our co-branded credit cards, as well as Apple Pay®, Masterpass, Google Pay and EBT. Our efficient operation, like that of most retailers, requires the transmission of information permitting cashless payments. As we offer new payment options to our members, we may be subject to additional rules, regulations and compliance requirements, along with higher fraud losses. For certain payment methods, we pay interchange and other related card acceptance fees, along with additional transaction processing fees. We rely on third parties to provide secure and reliable payment transaction processing services, including the processing of credit and debit cards, and our co-branded credit card, and it could disrupt our business if these companies become unwilling or unable to provide these services to us. We are also subject to payment card association and network operating rules, including data security rules, certification requirements and rules governing electronic funds transfers, which could change over time. For example, we are subject to Payment Card Industry Data Security Standards (“PCI DSS”), which contain compliance guidelines and standards with regard to our security surrounding the physical and electronic storage, processing and transmission of individual cardholder data. We are also subject to a consent decree entered by the Federal Trade Commission (the “FTC”) in 2005 in connection with a complaint alleging that we had failed to adequately safeguard members’ personal data. Under the consent decree, we are required to maintain a comprehensive information security program that is reasonably designed to protect the security, confidentiality and integrity of personal information collected from or about our members. In addition, if our third party processor systems are breached or compromised, we may be subject to substantial fines, remediation costs, litigation and higher transaction fees and lose our ability to accept credit or debit card payments from our members, and our reputation, business and operating results could also be materially adversely affected.
Our security measures have been breached in the past and may in the future be undermined due to the actions of outside parties, including nation-state sponsored actors, employee error, internal or external malfeasance, or otherwise, and, as a result an unauthorized party may obtain access to our data systems and misappropriate, alter, or destroy business and personal information, including payment card information. Such information may also be placed at risk through our use of outside vendors, which may have data security systems that differ from those that we maintain or are more vulnerable to breach. For example, in March 2018, our travel vendor informed us that the personal data of several hundred of our members had been compromised because of a data breach at Orbitz, which that vendor used as a platform for making online travel bookings. Because the
20
Table of Contents
techniques used to obtain unauthorized access, disable or degrade service, or sabotage systems change frequently and may not immediately produce signs of intrusion, we may be unable to anticipate these techniques, discover or counter them in a timely fashion, or implement adequate preventative measures. Any such breach or unauthorized access could result in significant legal and financial exposure, damage to our reputation and harm to our relationship with our members, any of which could have an adverse effect on our business.
Changes in laws related to the Supplemental Nutrition Assistance Program (“SNAP”), to the governmental administration of SNAP or to SNAP’s electronic benefit transfer (“EBT”) systems could adversely impact our results of operations.
Under SNAP, we are currently authorized to accept EBT payments, or food stamps, at our clubs as tender for eligible items, and payments via EBT accounted for approximately 5% of our net sales for fiscal years 2015-2017. Changes in state and federal laws governing the SNAP program, including rules on where and for what EBT cards may be used, could reduce sales at our clubs. For example, in February 2018, the federal government proposed reductions in food stamp program spending and changes in the program’s administration, including the provision of benefits to recipients in the form of government-purchased food items instead of electronic credits and disbursements that can be used to purchase food items (including at our clubs). Any such spending reductions or changes could therefore decrease sales at our clubs and thereby materially and adversely affect our business, financial condition and results of operations.
Our success depends on our ability to attract and retain a qualified management team and other team members while controlling our labor costs.
We are dependent upon a number of key management and other team members. If we were to lose the services of one or more of our key team members, this could have a material adverse effect on our operations. Our continued success also depends upon our ability to attract and retain highly qualified team members to meet our future growth needs, while controlling related labor costs. Our ability to control labor costs is subject to numerous external factors, including healthcare costs and prevailing wage rates, which may be affected by, among other factors, competitive wage pressure, minimum wage laws and general economic conditions. If we experience tight labor markets, either regionally or in general, we may have to increase our wages, which could increase our selling, general and administrative expenses and adversely affect our operating income. We compete with other retail and non-retail businesses for these employees and invest significant resources in training them. There is no assurance that we will be able to attract or retain highly qualified team members to operate our business.
Union attempts to organize our team members could disrupt our business.
In the past, unions have attempted to organize our team members at certain of our clubs and distribution centers. Our management and team members may be required to devote their time to respond to union activities, which could be distracting to our operations. Future union activities, including organizing efforts, slow-downs or work stoppages could negatively impact our business and results of operations. Changes in labor laws or regulations in this area could also adversely impact our business if such changes promote union activity.
We rely extensively on information technology to process transactions, compile results and manage our businesses. Failure or disruption of our primary and back-up systems could adversely affect our businesses.
Given the very high volume of transactions we process each year, it is important that we maintain uninterrupted operation of our business-critical computer systems. Our systems, including our back-up systems, are subject to damage or interruption from power outages, computer and telecommunications failures, computer viruses, internal or external security breaches, catastrophic events such as fires, earthquakes, tornadoes and hurricanes and errors by our employees. If our systems are damaged or cease to function properly, we may have to make significant investments to fix or replace them, and we may suffer serious interruptions in our operations
21
Table of Contents
in the interim. Any material interruption in these systems could have a material adverse effect on our business and results of operations. In addition, the cost of securing our systems against failure or attack is considerable, and increases in these costs, particularly in the wake of a breach or failure, could be material.
Our comparable club sales and quarterly operating results may fluctuate significantly.
Our comparable club sales may be adversely affected for many reasons, including new club openings by our competitors and the opening of our own new clubs that may cannibalize existing club sales. Comparable club sales may also be affected by cycling against strong sales in the prior year, by new clubs entering into our comparable club base and by price reductions in response to competition.
Our quarterly operating results may be adversely affected by a number of factors including losses in new clubs, price changes in response to competitors’ prices, increases in operating costs, volatility in gasoline, energy and commodity prices, increasing penetration of sales of our private label brands (Wellsley Farms® and Berkley Jensen®), federal budgetary and tax policy, weather conditions, natural disasters, local economic conditions and the timing of new club openings and related start-up costs.
Changes in our product mix or in our revenues from gasoline sales could negatively impact our revenue and results of operations.
Certain of our key performance indicators, including net sales, operating income and comparable club sales, could be negatively impacted by changes to our product mix or in the price of gasoline. For example, we continue to add private label products to our assortment of product offerings at our clubs, sold under our Wellsley Farms and Berkley Jensen private labels. We generally price these private label products lower than the manufacturer branded products of comparable quality that we also offer. Accordingly, a shift in our sales mix in which we sell more units of our private label products and fewer units of our manufacturer branded products would have an adverse impact on our overall net sales. Also, as we continue to add gas stations to our club base, and increase our sales of gasoline, this could adversely affect our profit margins. Since gasoline generates lower profit margins than the remainder of our business, we could expect to see our overall gross profit margin rates decline as sales of gasoline increase. In addition, gasoline prices have been historically volatile and may fluctuate widely due to changes in domestic and international supply and demand. Accordingly, significant changes in gasoline prices may substantially affect our net sales notwithstanding that the profit margin and unit sales for gasoline are largely unchanged, and this effect may increase as gasoline sales make up a larger portion of our revenue.
Research analysts and investors may recognize and react to the foregoing changes to our key performance indicators and believe that they indicate a decline in our performance, and this could occur regardless of whether the underlying cause has an adverse impact on our profitability. If we suffer an adverse change to our key performance indicators, this could adversely affect the trading price of our common stock.
Product recalls could adversely affect our sales and results of operations.
If our merchandise offerings, including food and general merchandise products, do not meet applicable safety standards or our members’ expectations regarding safety, we could experience lost sales and increased costs and be exposed to legal and reputational risk. The sale of these items involves the risk of health-related illness or injury to our members. Such illnesses or injuries could result from tampering by unauthorized third parties, product contamination or spoilage, including the presence of foreign objects, substances, chemicals, other agents, or residues introduced during the growing, manufacturing, storage, handling and transportation phases or faulty design. We are dependent on our vendors, including vendors located outside the United States, to ensure that the products we buy comply with all safety standards. While all of our vendors must comply with applicable product safety laws, it is possible that a vendor will fail to comply with these laws or otherwise fail to ensure the safety of its products. Further, while our vendors generally must agree to indemnify us in the case of loss, it is possible that a vendor will fail to fulfill that obligation.
22
Table of Contents
If a recall does occur, we have procedures in place to notify our clubs and, if appropriate, the members who have purchased the goods in question. We determine the appropriateness on a case-by-case basis, based, in part, on the size of the recall, the severity of the potential impact to the member and our ability to contact the purchasers of the products in question. While we are subject to governmental inspection and regulations and work to comply in all material respects with applicable laws and regulations, it is possible that consumption or use of our products could cause a health-related illness or injury in the future and that we will be subject to claims, lawsuits or government investigations relating to such matters. This could result in costly product recalls and other liabilities that could adversely affect our business and results of operations. Even if a product liability claim is unsuccessful or is not fully pursued, negative publicity could adversely affect our reputation with existing and potential members and our corporate and brand image, including that of our Wellsley Farms and Berkley Jensen private labels, and could have long-term adverse effects on our business.
If we do not successfully maintain a relevant omnichannel experience for our members, our results of operations could be adversely impacted.
Omnichannel retailing is rapidly evolving, and we must keep pace with changing member expectations and new developments by our competitors. Our members are increasingly using mobile phones, tablets and other devices to shop and to interact with us through social media. We continue to make technology investments in our website and mobile application. If we are unable to make, improve or develop relevant member-facing technology in a timely manner, our ability to compete and our results of operations could be adversely affected.
We depend on the financial performance of our operations in the New York metropolitan area.
Our financial and operational performance is dependent on our operations in the New York metropolitan area, which accounted for 25% of net sales in fiscal year 2017. We consider 39 of our clubs to be located in the New York metropolitan area. Any substantial slowing or sustained decline in these operations could materially adversely affect our business and financial results. Declines in financial performance of our operations in the New York metropolitan area could arise from, among other things, slower growth or declines in our comparable club sales; negative trends in operating expenses, including increased labor, healthcare and energy costs; failing to meet targets for club openings; cannibalization of existing locations by new clubs; shifts in sales mix toward lower gross margin products; changes or uncertainties in economic conditions in this market, including higher levels of unemployment, depressed home values and natural disasters; regional economic problems; changes in local regulations; terrorist attacks; and failure to consistently provide a high quality and well-assorted mix of products to retain our existing member base and attract new members.
Our growth strategy to open new clubs involves risks.
Our long-term sales and income growth is dependent to a certain degree on our ability to open new clubs and gasoline stations in both existing markets and new markets. Opening new clubs is expensive and involves substantial risks that may prevent us from receiving an appropriate return on that investment. We may not be successful in opening new clubs and gasoline stations on the schedule we have planned or at all, and the clubs and gasoline stations we open may not be successful. Our expansion is dependent on finding suitable locations, which may be affected by local regulations, political opposition, construction and development costs and competition from other retailers for particular sites. If prospective landlords find it difficult to obtain credit, we may need to own more new clubs rather than lease them. Owned locations require more initial capital and therefore, the need to own new locations could constrain our growth. If we are able to secure new sites and open new locations, these locations may not be profitable for many reasons. For example, we may not be able to hire, train and retain a suitable work force to staff these locations or to integrate new clubs successfully into our existing infrastructure, either of which could prevent us from operating the clubs in a profitable manner. In addition, entry into new markets may bring us into competition with new competitors or with existing competitors with a stronger, more well-established market presence. We may also improperly judge the suitability of a particular site. Any of these factors could cause a site to lose money or otherwise fail to provide a
23
Table of Contents
proper return on investment. If we fail to open new clubs as quickly as we have planned, our growth will suffer. If we open sites that we do not or cannot operate profitably, then our financial condition and results from operations could suffer.
Because we compete to a substantial degree on price, changes affecting the market prices of the goods we sell could adversely affect our net sales and operating profit.
It is an important part of our business plan that we offer value to our members, including offering prices that are substantially below certain of our competitors. Accordingly, we carefully monitor the market prices of the goods we sell in order to maintain our pricing advantage. If our competitors substantially lower their prices, we would be forced to lower our prices, which could adversely impact our margins and results of operations. In addition, the market price of the goods we sell can be influenced by general economic conditions. For example, if we experience a general deflation in the prices of the goods we sell, this would reduce our net sales and potentially adversely affect our operating income.
Any harm to the reputation of our private label brands could have a material adverse effect on our results of operations.
We sell many products under our private label brands, Wellsley Farms and Berkley Jensen. Maintaining consistent product quality, competitive pricing and availability of these products is essential to developing and maintaining member loyalty to these brands. These products generally carry higher margins than manufacturer branded products of comparable quality carried in our clubs and represent a growing portion of our overall sales. If our private label brands experience a loss of member acceptance or confidence, our net sales and operating results could be adversely affected.
We may not be able to protect our intellectual property adequately, which, in turn, could harm the value of our brand and adversely affect our business.
We rely on our proprietary intellectual property, including trademarks, to market, promote and sell our products in our clubs. Our ability to implement our business plan successfully depends in part on our ability to build further brand recognition using our trademarks, service marks, proprietary products and other intellectual property, including our name and logos and the unique character and atmosphere of our clubs. We monitor and protect against activities that might infringe, dilute or otherwise violate our trademarks and other intellectual property and rely on the trademark and other laws of the United States.
We may be unable to prevent third parties from using our intellectual property without our authorization. To the extent we cannot protect our intellectual property, unauthorized use and misuse of our intellectual property could harm our competitive position and have a material adverse effect on our financial condition, cash flows or results of operations. Additionally, adequate remedies may not be available in the event of an unauthorized use or disclosure of our trade secrets or other intellectual property.
Additionally, we cannot be certain that we do not or will not in the future infringe on the intellectual property rights of third parties. From time to time, we have been subject to claims from third parties that we have infringed upon their intellectual property rights and we face the risk of such claims in the future. Even if we are successful in these proceedings, any intellectual property infringement claims against us could be costly, time-consuming, harmful to our reputation, divert the time and attention of our management and other personnel, or result in injunctive or other equitable relief that may require us to make changes to our business, any of which could have a material adverse effect on our financial condition, cash flows or results of operations. With respect to any third party intellectual property that we use or wish to use in our business (whether or not asserted against us in litigation), we may not be able to enter into licensing or other arrangements with the owner of such intellectual property at a reasonable cost or on reasonable terms.
24
Table of Contents
Our business is moderately seasonal and weak performance during one of our historically strong seasonal periods could have a material adverse effect on our operating results for the entire fiscal year.
Our business is moderately seasonal, with a meaningful portion of our sales dedicated to seasonal and holiday merchandise, resulting in the realization of higher portions of net sales and operating income in the second and fourth fiscal quarters. Due to the importance of our peak sales periods, which include the spring and year-end holiday seasons, the second and fourth fiscal quarters have historically contributed, and are expected to continue to contribute, significantly to our operating results for the entire fiscal year. In anticipation of seasonal increases in sales activity during these periods, we incur significant additional expense prior to and during our peak seasonal periods, which we may finance with additional short-term borrowings. These expenses may include the acquisition of additional inventory, seasonal staffing needs and other similar items. As a result, any factors negatively affecting us during these periods, including adverse weather and unfavorable economic conditions, could have a material adverse effect on our results of operations for the entire fiscal year.
Implementation of technology initiatives could disrupt our operations in the near team and fail to provide the anticipated benefits.
As our business grows, we continue to make significant technology investments both in our operations and in our administrative functions. The costs, potential problems and interruptions associated with the implementation of technology initiatives could disrupt or reduce the efficiency of our operations in the near term. They may also require us to divert resources from our core business to ensure that implementation is successful. In addition, new or upgraded technology might not provide the anticipated benefits; it might take longer than expected to realize the anticipated benefits; and the technology might fail or cost more than anticipated.
Insurance claims could adversely impact our results of operations.
We use a combination of insurance and self-insurance plans to provide for potential liability for workers’ compensation, general liability, property, fiduciary liability and employee and retiree health care. Liabilities associated with the risk retained by the Company are estimated based on historical claims experience and other actuarial assumptions believed to be reasonable under the circumstances. Our results of operations could be adversely impacted if actual future occurrences and claims differ from our assumptions and historical trends.
Natural disasters or other catastrophes could negatively affect our business, financial condition and results of operations.
Natural disasters, such as hurricanes, typhoons or earthquakes, particularly in locations where our centralized operating systems and administrative personnel are located, could negatively affect our operations and financial performance. For example, our operations are concentrated primarily on the east coast of the United States, and any adverse weather event or natural disaster, such as a hurricane or heavy snow storm, could have a material adverse effect on a substantial portion of our operations. Such events could result in physical damage to one or more of our properties, the temporary closure of one or more clubs, one or more of our Company-operated or contracted distribution centers or our home office facility, the temporary lack of an adequate work force in a market, the temporary or long-term disruption in the supply of products, the temporary disruption in the transport of goods to or from overseas, delays in the delivery of goods to our clubs or distribution centers and the temporary reduction in the availability of products in our clubs. Public health issues, whether occurring in the U.S. or abroad, or terrorist attacks could also disrupt our operations, disrupt the operations of suppliers or members or have an adverse impact on consumer spending and confidence levels. These events could also reduce demand for our products or make it difficult or impossible to procure products. We may be required to suspend operations in some or all of our locations, which could have a material adverse effect on our business, financial condition, cash flows and results of operations.
25
Table of Contents
Inventory shrinkage could have a material adverse effect on our business, financial condition and results of operations.
We are subject to the risk of inventory loss and theft. Our inventory shrinkage rates have not been material, or fluctuated significantly in recent years, although it is possible that rates of inventory loss and theft in the future will exceed our estimates and that our measures will be ineffective in reducing our inventory shrinkage. Although some level of inventory shrinkage is an unavoidable cost of doing business, if we were to experience higher rates of inventory shrinkage or incur increased security costs to combat inventory theft, for example as a result of increased use of self-checkout technologies, it could have a material adverse effect on our business, results of operations and financial condition.
We are subject to risks associated with leasing substantial amounts of space.
We lease the substantial majority of our retail properties, each of our three company-operated distribution centers and our corporate office. The profitability of our business is dependent on operating our current club base with favorable margins, opening and operating new clubs at a reasonable profit, renewing leases for clubs in desirable locations and, if necessary, identifying and closing underperforming clubs. We enter into leases for a significant number of our club locations for varying terms. Typically, a large portion of a club’s operating expense is the cost associated with leasing the location.
We are typically responsible for taxes, utilities, insurance, repairs and maintenance for our leased retail properties. Our rent expense for fiscal years 2015, 2016 and 2017 totaled $287.5 million, $298.1 million and $301.9 million, respectively. Our future minimum rental commitments for all operating leases in existence as of February 3, 2018 is $302.6 million for fiscal year 2018 and total $3,122.8 million in aggregate for fiscal years 2019 through 2040. We expect that many of the new clubs we open will also be leased to us under operating leases, which will further increase our operating lease expenditures and require significant capital expenditures. We depend on cash flows from operations to pay our lease expenses and to fulfill our other cash needs. If our business does not generate sufficient cash flow from operating activities, and sufficient funds are not otherwise available to us from borrowings under our ABL Facility or other sources, we may not be able to service our lease expenses or fund our other liquidity and capital needs, which would materially affect our business.
The operating leases for our retail properties, distribution centers and corporate office expire at various dates through 2040. A number of the leases have renewal options for various periods of time at our discretion. One of our retail property leases and none of our distribution center leases expire prior to 2027. When leases for our clubs with ongoing operations expire, we may be unable to negotiate renewals, either on commercially acceptable terms, or at all. Further, if we attempt to relocate a club for which the lease has expired, we may be unable to find a new location for that club on commercially acceptable terms or at all, and the relocation of a club might not be successful for other reasons. Any of these factors could cause us to close clubs in desirable locations, which could have an adverse impact on our results of operations.
Over time, current club locations may not continue to be desirable because of changes in demographics within the surrounding area or a decline in shopping traffic, including traffic generated by other nearby clubs. We may not be able to terminate a particular lease if or when we would like to do so. If we decide to close clubs, we are generally required to continue to pay rent and operating expenses for the balance of the lease term, which could be expensive. Even if we are able to assign or sublease vacated locations where our lease cannot be terminated, we may remain liable on the lease obligations if the assignee or sublessee does not perform.
Non-compliance with privacy and information security laws, especially as it relates to maintaining the security of member-related personal information, may damage our business and reputation with members, or result in our incurring substantial additional costs and becoming subject to litigation.
The use of individually identifiable data by our business is regulated at the federal and state levels. Privacy and information security laws and regulations change, and compliance with them may result in cost increases due
26
Table of Contents
to necessary systems changes and the development of new administrative processes. If we fail to comply with these laws and regulations or experience a data security breach, our reputation could be damaged, possibly resulting in lost future business, and we could be subjected to additional legal or financial risk as a result of non-compliance.
For example, as do most retailers and wholesale club operators, we and certain of our service providers receive certain personal information about our members. In addition, our online operations at www.bjs.com depend upon the secure transmission of confidential information over public networks. A compromise of our security systems or those of some of our business partners that results in our members’ personal information being obtained by unauthorized persons could adversely affect our reputation with our members and others, as well as our operations, results of operations, financial condition and liquidity, and could result in litigation against us or the imposition of penalties. In addition, a security breach could require that we expend significant additional resources related to the security of information systems and could result in a disruption of our operations.
Federal, state, regional and local laws and regulations relating to the cleanup, investigation, use, storage, discharge and disposal of hazardous materials, hazardous and non-hazardous wastes and other environmental matters could adversely impact our business, financial condition and results of operations.
We are subject to a wide variety of federal, state, regional and local laws and regulations relating to the use, storage, discharge and disposal of hazardous materials, hazardous and non-hazardous wastes and other environmental matters. Failure to comply with these laws could result in harm to our members, employees or others, significant costs to satisfy environmental compliance, remediation or compensatory requirements, private party claims, or the imposition of severe penalties or restrictions on operations by governmental agencies or courts that could adversely affect our business, financial condition, cash flows and results of operations. In addition, risks of substantial costs and liabilities, including for the investigation and remediation of past or present contamination at our current or former properties (whether or not caused by us), are inherent in our operations, particularly with respect to our gasoline stations. There can be no assurance that substantial costs and liabilities for the investigation and remediation of contamination will not be incurred.
Our e-commerce business faces distinct risks, and our failure to successfully manage it could have a negative impact on our profitability.
As our e-commerce business grows, we increasingly encounter the risks and difficulties that internet-based businesses face. The successful operation of our e-commerce business, and our ability to provide a positive shopping experience that will generate orders and drive subsequent visits depend on efficient and uninterrupted operation of our order-taking and fulfillment operations. Risks associated with our e-commerce business include:
| • | uncertainties associated with our website, including changes in required technology interfaces, website downtime and other technical failures, costs and technical issues as we upgrade our website software, inadequate system capacity, computer viruses, human error, security breaches and legal claims related to our website operations and e-commerce fulfillment; |
| • | disruptions in telecommunications service or power outages; |
| • | reliance on third parties for computer hardware and software and delivery of merchandise to our customers; |
| • | rapid changes in technology; |
| • | credit or debit card fraud and other payment processing related issues; |
| • | changes in applicable federal and state regulations; |
| • | liability for online content; |
27
Table of Contents
| • | cybersecurity and consumer privacy concerns and regulation; and |
| • | natural disasters. |
Problems in any of these areas could result in a reduction in sales; increased costs; sanctions or penalties; and damage to our reputation and brands. Personal information from our members may also be placed at risk through our use of outside vendors, which may have data security systems that differ from those that we maintain or are more vulnerable to breach. For example, in March 2018, our travel vendor informed us that the personal data of several hundred of our members had been compromised because of a data breach at Orbitz, which that vendor used as a platform for making online travel bookings. Further, if we invest substantial amounts in developing our e-commerce capabilities, these factors or others could prevent those investments from being effective.
In addition, we must keep up to date with competitive technology trends, including the use of new or improved technology, creative user interfaces and other e-commerce marketing tools (such as paid search and mobile applications, among others), which may increase our costs and which may not increase sales or attract customers. If we are unable to allow real-time and accurate visibility into product availability when customers are ready to purchase, fulfill our customers’ orders quickly and efficiently using the fulfillment and payment methods they demand, provide a convenient and consistent experience for our customers regardless of the ultimate sales channel or manage our online sales effectively, our ability to compete and our results of operations could be adversely affected.
Furthermore, if our e-commerce business successfully grows, it may do so in part by attracting existing customers, rather than new customers, who choose to purchase products from us online rather than from our physical locations, thereby detracting from the financial performance of our clubs.
We are subject to a number of risks because we import some of our merchandise.
We imported approximately 4% of our merchandise directly from foreign countries such as China, Vietnam, Bangladesh and India during fiscal year 2017. In addition, many of our domestic vendors purchase a portion of their products from foreign sources.
Foreign sourcing subjects us to a number of risks generally associated with doing business abroad including lead times, labor issues, shipping and freight constraints, product and raw material issues, political and economic conditions, government policies, tariffs and restrictions, epidemics and natural disasters.
If any of these or other factors were to cause supply disruptions or delays, our inventory levels may be reduced or the cost of our products may increase unless and until alternative supply arrangements could be made. Merchandise purchased from alternative sources may be of lesser quality or more expensive than the merchandise we currently purchase abroad. Any shortages of merchandise (especially seasonal and holiday merchandise), even if temporary, could result in missed opportunities, reducing our sales and profitability. It could also result in our customers seeking and obtaining the products in question from our competitors.
In addition, reductions in the value of the U.S. dollar or increases in the value of foreign currencies could ultimately increase the prices that we pay for our products. We have not hedged our currency risk in the past and do not currently anticipate doing so in the future. All of our products manufactured overseas and imported into the United States are subject to duties collected by U.S. Customs and Border Protection. Increases in these duties would increase the prices we pay for these products, and we may not be able fully to recapture these costs in our pricing to customers. Further, we may be subjected to additional tariffs or penalties if we or our suppliers are found to be in violation of U.S. laws and regulations applicable to the importation of our products (including, but not limited to, prohibitions against entering merchandise by means of materially negligently made false statements or omissions). To the extent that any foreign manufacturers from whom we purchase products directly or indirectly employ business practices that vary from those commonly accepted in the United States, we could be hurt by any resulting negative publicity or, in some cases, potential claims of liability.
28
Table of Contents
Because of our international sourcing, we could be adversely affected by violations of the U.S. Foreign Corrupt Practices Act and similar worldwide anti-bribery and anti-kickback laws.
We source approximately 4% of our merchandise abroad. The U.S. Foreign Corrupt Practices Act and other similar laws and regulations generally prohibit companies and their intermediaries from making improper payments to non-U.S. officials for the purpose of obtaining or retaining business. While our policies mandate compliance with these anti-bribery laws, we cannot assure you that we will be successful in preventing our employees or other agents from taking actions in violation of these laws or regulations. Such violations, or allegations of such violations, could disrupt our business and result in a material adverse effect on our financial condition, cash flows and results of operations.
Certain legal proceedings could adversely impact our results of operations.
We are involved in a number of legal proceedings involving employment issues, personal injury, product liability, consumer matters, intellectual property claims and other litigation. Certain of these lawsuits, if decided adversely to us or settled by us, may result in material liability. See the notes to our audited financial statements included elsewhere in this prospectus for additional information. Further, we are unable to predict whether unknown claims may be brought against us that could become material.
Factors associated with climate change could adversely affect our business.
We use natural gas, diesel fuel, gasoline and electricity in our distribution and sale operations. Increased government regulations to limit carbon dioxide and other greenhouse gas emissions may result in increased compliance costs and legislation or regulation affecting energy inputs could materially affect our profitability. Climate change could affect our ability to procure needed commodities at costs and in quantities we currently experience. Climate change may be associated with extreme weather conditions, such as more intense hurricanes, thunderstorms, tornadoes and snow or ice storms, as well as rising sea levels. We also sell a substantial amount of gasoline, the demand for which could be impacted by concerns about climate change and which could face increased regulation.
Changes in accounting standards and subjective assumptions, estimates and judgments by management related to complex accounting matters could significantly affect our financial condition and results of operations.
Accounting principles and related pronouncements, implementation guidelines and interpretations we apply to a wide range of matters that are relevant to our business, including, but not limited to, revenue recognition, vendor rebates and allowances; inventory; impairment of goodwill, indefinite-lived and long-lived assets; self-insurance reserves income taxes; and stock-based compensation are highly complex and involve subjective assumptions, estimates and judgments by our management. Changes in these rules or their interpretation or changes in underlying assumptions, estimates or judgments by our management could significantly change our reported or expected financial performance.
Provisions for losses related to self-insured risks are generally based upon independent actuarially determined estimates. The assumptions underlying the ultimate costs of existing claim losses can be highly unpredictable, which can affect the liability recorded for such claims. For example, variability in health care cost inflation rates inherent in these claims can affect the amounts recognized. Similarly, changes in legal trends and interpretations, as well as changes in the nature and method of how claims are settled can impact ultimate costs. Although our estimates of liabilities incurred do not anticipate significant changes in historical trends for these variables, any changes could have a considerable effect upon future claim costs and currently recorded liabilities and could materially impact our consolidated financial statements.
29
Table of Contents
Changes in lease accounting standards may materially and adversely affect us.
The Financial Accounting Standards Board, or FASB, recently adopted new accounting rules, to be effective for our fiscal year beginning after December 2018, that will require companies to capitalize most leases on their balance sheets by recognizing a lessee’s rights and obligations. When the rules are effective, we will be required to account for the leases for our clubs, headquarters and distribution centers as assets and liabilities on our balance sheet, while previously we accounted for such leases on an “off balance sheet” basis. As a result, a significant amount of lease related assets and liabilities will be recorded on our balance sheet, and we may be required to make other changes to the recording and classification of our lease related expenses. Though these changes will not have any direct impact on our overall financial condition, these changes will cause the total amount of assets and liabilities we report to increase substantially. This could cause investors or others to believe that we are highly leveraged and could change the calculations of financial metrics and covenants under our debt facilities, and under third-party financial models regarding our financial condition.
Goodwill and identifiable intangible assets represent a significant portion of our total assets, and any impairment of these assets could adversely affect our results of operations.
Our goodwill and indefinite-lived intangible assets, which consist of goodwill and our trade name, represented a significant portion of our total assets as of February 3, 2018. Accounting rules require the evaluation of our goodwill and indefinite-lived intangible assets for impairment at least annually, or more frequently when events or changes in circumstances indicate that the carrying value of such assets may not be recoverable. Such indicators are based on market conditions and the operational performance of our business.
To test goodwill for impairment, we may initially use a qualitative approach to determine whether conditions exist to indicate that it is more likely than not that the fair value of a reporting unit is less than its carrying value. If our management concludes, based on its assessment of relevant events, facts and circumstances, that it is more likely than not that a reporting unit’s carrying value is greater than its fair value, then a quantitative analysis will be performed to determine if there is any impairment. We may initially also elect to perform a quantitative analysis, which is a two-step assessment. In step one we estimate the reporting unit’s fair value by estimating the future cash flows of the reporting units to which the goodwill relates, and then we discount the future cash flows at a market-participant-derived weighted average cost of capital. The estimates of fair value of the reporting unit is based on the best information available as of the date of the assessment. If the carrying value of the reporting unit exceeds its estimated fair value in the first step, a second step is performed; in step two, we compare the implied fair value of goodwill to the carrying amount of goodwill. The implied fair value of goodwill is determined by a hypothetical purchase price allocation using the reporting unit’s fair value as the purchase price. If the implied fair value of the goodwill is less than the reporting unit’s carrying amount, then goodwill is impaired and is written down to the implied fair value amount.
To test our other indefinite-lived asset, our trade name, for impairment we determine the fair value of our trade name using the relief-from-royalty method, which estimates the present value of royalty income that could be hypothetically earned by licensing the brand name to a third party over the remaining useful life. If, in conducting an impairment evaluation, we determine that the carrying value of an asset exceeded its fair value, we would be required to record a non-cash impairment charge for the difference between the carrying value and the fair value of the asset.
If a significant amount of our goodwill and identifiable intangible assets were deemed to be impaired, our business, financial condition and results of operations could be materially adversely affected.
Recent U.S. tax legislation may adversely affect our future cash flows.
The Tax Cuts and Jobs Act (“TCJA”), which was enacted into law on December 22, 2017, significantly changed the U.S. federal income taxation of U.S. corporations, including by reducing the U.S. corporate income
30
Table of Contents
tax rate, limiting interest deductions, permitting immediate expensing of certain capital expenditures, revising the rules governing net operating losses and repealing the deduction of certain performance-based compensation paid to an expanded group of executive officers. Many of these changes are effective immediately, without any transition periods or grandfathering for existing transactions. The legislation is unclear in many respects and could be subject to potential amendments and technical corrections, as well as interpretations and implementing regulations by the Treasury and Internal Revenue Service (“IRS”), any of which could lessen or increase certain adverse impacts of the legislation. In addition, it is unclear how these U.S. federal income tax changes will affect state and local taxation, since taxing authorities often use federal taxable income as a starting point for computing state and local tax liabilities.
Our analysis and interpretation of the TCJA is preliminary and ongoing. While the new rules limiting interest deductibility to 30% of our “adjusted taxable income” are not currently expected to materially increase our tax burden on a permanent basis, such an increase could occur if our income were to materially decrease or our interest burden were to materially increase. Further, the TCJA may result in material adverse effects that we have not yet identified. While some of the changes made by the tax legislation may adversely affect the Company, we believe that other changes, such as the reduction in the U.S. corporate income tax rate, will be beneficial. We continue to work with our tax advisors and auditors to determine the full impact that the TCJA will have on us.
We could be subject to additional income tax liabilities.
We compute our income tax provision based on enacted federal and state tax rates. As tax rates vary among jurisdictions, a change in earnings attributable to the various jurisdictions in which we operate could result in an unfavorable change in our overall tax provision. Additionally, changes in the enacted tax rates, adverse outcomes in tax audits, including transfer pricing disputes, or any change in the pronouncements relating to accounting for income taxes could have a material adverse effect on our financial condition and results of operations.
We are a holding company with no operations of our own, and we depend on our subsidiaries for cash.
We are a holding company and do not have any material assets or operations other than ownership of equity interests of our subsidiaries. Our operations are conducted almost entirely through our subsidiaries, and our ability to generate cash to meet our obligations or to pay dividends, if any, is highly dependent on the earnings of, and receipt of funds from, our subsidiaries through dividends or intercompany loans. The ability of our subsidiaries to generate sufficient cash flow from operations to allow us and them to make scheduled payments on our debt obligations will depend on their future financial performance, which will be affected by a range of economic, competitive and business factors, many of which are outside of our control. We cannot assure you that the cash flow and earnings of our operating subsidiaries will be adequate for our subsidiaries to service their debt obligations. If our subsidiaries do not generate sufficient cash flow from operations to satisfy corporate obligations, we may have to undertake alternative financing plans (such as refinancing), restructure debt, sell assets, reduce or delay capital investments, or seek to raise additional capital. We cannot assure you that any such alternative refinancing would be possible, that any assets could be sold, or, if sold, of the timing of the sales and the amount of proceeds realized from those sales, that additional financing could be obtained on acceptable terms, if at all, or that additional financing would be permitted under the terms of our various debt instruments then in effect. Our inability to generate sufficient cash flow to satisfy our obligations, or to refinance our obligations on commercially reasonable terms, could have a material adverse effect on our business, financial condition and results of operations.
Furthermore, we and our subsidiaries may incur substantial additional indebtedness in the future that may severely restrict or prohibit our subsidiaries from making distributions, paying dividends, if any, or making loans to us.
31
Table of Contents
Risks Relating to Our Indebtedness
We face risks related to our substantial indebtedness.
As of , 2018, after giving effect to the application of proceeds from this offering as set forth under “Use of Proceeds”, including the repayment of indebtedness under the Term Loan Facilities, we would have had total outstanding debt of $ million. Our substantial leverage could adversely affect our ability to raise additional capital to fund our operations, limit our ability to react to changes in the economy or our industry, expose us to interest rate risk associated with our variable rate debt and prevent us from meeting our obligations under our ABL Facility and Term Loan Facilities. Our substantial indebtedness could have important consequences to us, including:
| • | making it more difficult for us to satisfy our obligations with respect to our debt, and any failure to comply with the obligations under our debt instruments, including restrictive covenants, could result in an event of default under the agreements governing our indebtedness increasing our vulnerability to general economic and industry conditions; |
| • | requiring a substantial portion of our cash flow from operations to be dedicated to the payment of principal and interest on our debt, thereby reducing our ability to use our cash flow to fund our operations, capital expenditures, selling and marketing efforts, product development, future business opportunities and other purposes; |
| • | limiting our ability to deduct interest in the taxable period in which it is incurred in light of the TCJA; |
| • | exposing us to the risk of increased interest rates as substantially all of our borrowings are at variable rates; |
| • | restricting us from making strategic acquisitions; |
| • | limiting our ability to obtain additional financing for working capital, capital expenditures, product development, debt service requirements, acquisitions and general corporate or other purposes; and |
| • | limiting our ability to plan for, or adjust to, changing market conditions and placing us at a competitive disadvantage compared to our competitors who may be less highly leveraged. |
The occurrence of any one of these events could have an adverse effect on our business, financial condition, results of operations and ability to satisfy our obligations under our indebtedness.
We and our subsidiaries may be able to incur substantial additional indebtedness in the future, subject to the restrictions contained in the credit agreements governing our ABL Facility and Term Loan Facilities.
The ABL Facility and Term Loan Facilities impose significant operating and financial restrictions on us and our subsidiaries that may prevent us from pursuing certain business opportunities and restrict our ability to operate our business.
The credit agreements governing our ABL Facility and Term Loan Facilities contain covenants that restrict our and our subsidiaries’ ability to take various actions, such as:
| • | incur or guarantee additional indebtedness or issue certain disqualified or preferred stock; |
| • | pay dividends or make other distributions on, or redeem or purchase, any equity interests or make other restricted payments; |
| • | make certain acquisitions or investments; |
| • | create or incur liens; |
| • | transfer or sell assets; |
| • | incur restrictions on the payments of dividends or other distributions from our restricted subsidiaries; |
32
Table of Contents
| • | alter the business that we conduct; |
| • | enter into transactions with affiliates; and |
| • | consummate a merger or consolidation or sell, assign, transfer, lease or otherwise dispose of all or substantially all of our assets. |
The restrictions in the credit agreements governing our ABL Facility and Term Loan Facilities also limit our ability to plan for or react to market conditions, meet capital needs or otherwise restrict our activities or business plans and adversely affect our ability to finance our operations, enter into acquisitions or to engage in other business activities that could be in our interest.
In addition, our ability to borrow under the ABL Facility is limited by the amount of our borrowing base. Any negative impact on the elements of our borrowing base, such as accounts receivable and inventory could reduce our borrowing capacity under the ABL Facility.
We may be unable to generate sufficient cash flow to satisfy our significant debt service obligations, which could have a material adverse effect on our business, financial condition and results of operations.
Our ability to make principal and interest payments on and to refinance our indebtedness will depend on our ability to generate cash in the future and is subject to general economic, financial, competitive, legislative, regulatory, tax and other factors that are beyond our control. If our business does not generate sufficient cash flow from operations, in the amounts projected or at all, or if future borrowings are not available to us in amounts sufficient to fund our other liquidity needs, our business financial condition and results of operations could be materially adversely affected. If we cannot generate sufficient cash flow from operations to make scheduled principal and interest payments in the future, we may need to refinance all or a portion of our indebtedness on or before maturity, sell assets, delay capital expenditures or seek additional equity. The terms of our existing or future debt agreements, including the Term Loan Facilities and the ABL Facility, may also restrict us from affecting any of these alternatives. Further, changes in the credit and capital markets, including market disruptions and interest rate fluctuations, may increase the cost of financing, make it more difficult to obtain favorable terms, or restrict our access to these sources of future liquidity. Our ABL Facility is scheduled to mature on February 3, 2022, our First Lien Facility is scheduled to mature on February 3, 2024 and our Second Lien Facility is scheduled to mature on February 3, 2025. See “Description of Certain Indebtedness.” If we are unable to refinance any of our indebtedness on commercially reasonable terms or at all or to effect any other action relating to our indebtedness on satisfactory terms or at all, it could have a material adverse effect on our business, financial condition and results of operations.
Risks Relating to our Common Stock and this Offering
There is no existing market for our common stock and we do not know if one will develop to provide you with adequate liquidity. If our stock price fluctuates after this offering, you could lose a significant part of your investment.
Prior to this offering, there has not been a public market for our common stock. We cannot predict the extent to which investor interest in us will lead to the development of a trading market on the , or otherwise or how active and liquid that market may come to be. If an active trading market does not develop, you may have difficulty selling any of the common stock that you buy.
Negotiations between us and the underwriters will determine the initial public offering price for our common stock, which may not be indicative of prices that will prevail in the open market following this offering. Consequently, you may not be able to sell our common stock at prices equal to or greater than the price you paid in this offering. The market price of our common stock may be influenced by many factors including:
| • | quarterly variations in our operating results compared to market expectations; |
33
Table of Contents
| • | changes in the preferences of our customers; |
| • | low comparable club sales growth compared to market expectations; |
| • | delays in the planned openings of new clubs; |
| • | the failure of securities analysts to cover the Company after this offering or changes in financial estimates by the analysts who cover us, our competitors or the grocery or retail industries in general and the wholesale club segment in particular; |
| • | economic, legal and regulatory factors unrelated to our performance; |
| • | changes in consumer spending or the housing market; |
| • | increased competition or stock price performance of our competitors; |
| • | announcements by us or our competitors of new locations, capacity changes, strategic investments or acquisitions; |
| • | actual or anticipated variations in our or our competitors’ operating results, and our competitors’ growth rates; |
| • | future sales of our common stock or the perception that such sales may occur; |
| • | changes in senior management or key personnel; |
| • | investor perceptions of us, our competitors and our industry; |
| • | general or regional economic conditions; |
| • | changes in laws or regulations, or new interpretations or applications of laws and regulations that are applicable to our business; lawsuits, enforcement actions and other claims by third parties or governmental authorities; |
| • | action by institutional stockholders or other large stockholders; |
| • | failure to meet any guidance given by us or any change in any guidance given by us, or changes by us in our guidance practices; |
| • | speculation in the press or investment community; |
| • | events beyond our control, such as war, terrorist attacks, transportation and fuel prices, natural disasters, severe weather and widespread illness; and |
| • | the other factors listed in this “Risk Factors” section. |
As a result of these factors, investors in our common stock may not be able to resell their shares at or above the initial offering price. In addition, our stock price may be volatile. The stock market in general has experienced extreme price and volume fluctuations that have often been unrelated or disproportionate to the operating performance of companies like us. Accordingly, these broad market fluctuations, as well as general economic, political and market conditions, such as recessions or interest rate changes, may significantly reduce the market price of the common stock, regardless of our operating performance. In the past, following periods of market volatility, stockholders have instituted securities class action litigation. If we were to become involved in securities litigation, it could result in substantial costs and divert resources and our management’s attention from other business concerns, regardless of the outcome of such litigation.
Because the Sponsors control a significant percentage of our common stock, they may control all major corporate decisions and their interests may conflict with your interests as an owner of our common stock and those of the Company.
We are controlled by the Sponsors, which currently indirectly own % of our common stock and will own approximately % after the consummation of this offering ( % if the underwriters fully exercise their option to purchase additional shares from the selling stockholders). Accordingly, the Sponsors currently control the
34
Table of Contents
election of the majority of our directors and could exercise a controlling interest over our business, affairs and policies, including the appointment of our management and the entering into of business combinations or dispositions and other corporate transactions. The directors they elect have the authority to incur additional debt, issue or repurchase stock, declare dividends and make other decisions that could be detrimental to stockholders.
The Sponsors may have interests that are different from yours and may vote in a way with which you disagree and that may be adverse to your interests. Further, CVC and Leonard Green may have differing views from each other, neither of which may align with your interests. In addition, the Sponsors’ concentration of ownership could have the effect of delaying or preventing a change in control or otherwise discouraging a potential acquirer from attempting to obtain control of us, which could cause the market price of our common stock to decline or prevent our stockholders from realizing a premium over the market price for their common stock.
Additionally, the Sponsors are in the business of making investments in companies and may from time to time acquire and hold interests in businesses that compete directly or indirectly with us or supply us with goods and services. The Sponsors may also pursue acquisition opportunities that may be complementary to our business and, as a result, those acquisition opportunities may not be available to us. Stockholders should consider that the interests of the Sponsors may differ from their interests in material respects.
You will incur immediate and substantial dilution in the pro forma net tangible book value of the common stock you purchase in this offering.
Prior investors have paid substantially less per share for our common stock than the price in this offering. The initial public offering price of our common stock is substantially higher than the pro forma net tangible book value per share of our outstanding common stock upon consummation of the offering. Accordingly, based on an initial public offering price of $ per share (the midpoint of the price range set forth on the cover page of this prospectus), if you purchase our common stock in this offering, you will pay more for your shares than the amounts paid by our existing stockholders for their shares and you will suffer immediate dilution of $ per share in pro forma net tangible book value of our common stock. See “Dilution.”
Sales of a substantial number of shares of our common stock in the public market by our existing stockholders could cause our stock price to fall.
Sales of a substantial number of shares of our common stock in the public market or the perception that these sales might occur, could depress the market price of our common stock and could impair our ability to raise capital through the sale of additional equity securities. Substantially all of our existing stockholders are subject to lock-up agreements with the underwriters of this offering that restrict the stockholders’ ability to transfer shares of our common stock for 180 days from the date of this prospectus, subject to certain exceptions. The lock-up agreements limit the number of shares of common stock that may be sold immediately following the public offering. After this offering, we will have outstanding shares of common stock based on the number of shares outstanding as of , 2018. Subject to limitations, shares will become eligible for sale upon expiration of the lock-up period, as calculated and described in more detail in the section entitled “Shares Eligible for Future Sale.” In addition, shares issued or issuable upon exercise of options vested as of the expiration of the lock-up period will be eligible for sale at that time. Further, the representative of the underwriters may, in its sole discretion, release all or some portion of the shares subject to the lock-up agreements at any time and for any reason. See “Shares Eligible for Future Sale” for more information. Sales of a substantial number of such shares upon expiration of the lock-up agreements, the perception that such sales may occur, or early release of these agreements, could have a material adverse effect on the trading price of our common stock.
Moreover, after this offering, holders of % of our outstanding common stock will have rights, subject to certain conditions such as the 180-day lock-up arrangement described above, to require us to file registration
35
Table of Contents
statements for the public sale of their shares or to include their shares in registration statements that we may file for ourselves or other stockholders. Registration of these shares under the Securities Act of 1933, as amended, or the Securities Act, would result in the shares becoming freely tradable without restriction under the Securities Act, except for shares held by our affiliates as defined in Rule 144 under the Securities Act. Any sales of securities by these stockholders could have a material adverse effect on the trading price of our common stock.
Our ability to raise capital in the future may be limited.
Our business and operations may consume resources faster than we anticipate. In the future, we may need to raise additional funds through the issuance of new equity securities, debt or a combination of both. Additional financing may not be available on favorable terms, or at all. If adequate funds are not available on acceptable terms, we may be unable to fund our capital requirements. If we issue new debt securities, the debt holders would have rights senior to common stockholders to make claims on our assets, and the terms of any debt could restrict our operations, including our ability to pay dividends on our common stock. If we issue additional equity securities, existing stockholders will experience dilution, and the new equity securities could have rights senior to those of our common stock. Because our decision to issue securities in any future offering will depend on market conditions and other factors beyond our control, we cannot predict or estimate the amount, timing or nature of our future offerings. Thus, our stockholders bear the risk of our future securities offerings reducing the market price of our common stock and diluting their interest.
If securities or industry analysts do not publish or cease publishing research or reports about us, or if they issue unfavorable commentary about us or our industry or downgrade our common stock, the price of our common stock could decline.
The trading market for our common stock will depend in part on the research and reports that third-party securities analysts publish about us and our industry. One or more analysts could downgrade our common stock or issue other negative commentary about us or our industry. In addition, we may be unable or slow to attract research coverage. Alternatively, if one or more of these analysts cease coverage of us, we could lose visibility in the market. As a result of one or more of these factors, the trading price of our common stock could decline.
Some provisions of our charter documents and Delaware law may have anti-takeover effects that could discourage an acquisition of us by others, even if an acquisition would be beneficial to our stockholders, and may prevent attempts by our stockholders to replace or remove our current management.
Provisions in our amended and restated certificate of incorporation and our amended and restated bylaws, as well as provisions of the Delaware General Corporation Law, or DGCL, could make it more difficult for a third party to acquire us or increase the cost of acquiring us, even if doing so would benefit our stockholders, including transactions in which stockholders might otherwise receive a premium for their shares. These provisions include:
| • | establishing a classified board of directors such that not all members of the board are elected at one time; |
| • | allowing the total number of directors to be determined exclusively (subject to the rights of holders of any series of preferred stock to elect additional directors) by resolution of our board of directors and granting to our board the sole power (subject to the rights of holders of any series of preferred stock or rights granted pursuant to the stockholders’ agreement) to fill any vacancy on the board; |
| • | limiting the ability of stockholders to remove directors without cause; |
| • | authorizing the issuance of “blank check” preferred stock by our board of directors, without further stockholder approval, to thwart a takeover attempt; |
| • | prohibiting stockholder action by written consent (and, thus, requiring that all stockholder actions be taken at a meeting of our stockholders), if the Sponsors cease to own, or have the right to direct the vote of, at least % of the voting power of our common stock; |
36
Table of Contents
| • | eliminating the ability of stockholders to call a special meeting of stockholders, except for the Sponsors, so long as the Sponsors own, or have the right to direct the vote of, at least % of the voting power of our common stock; |
| • | establishing advance notice requirements for nominations for election to the board of directors or for proposing matters that can be acted upon at annual stockholder meetings; and |
| • | requiring the approval of the holders of at least two-thirds of the voting power of all outstanding stock entitled to vote thereon, voting together as a single class, to amend or repeal our certificate of incorporation or bylaws if the Sponsors cease to own, or have the right to direct the vote of, at least % of the voting power of our common stock. |
In addition, while we have opted out of Section 203 of the DGCL, our amended and restated certificate of incorporation contains similar provisions providing that we may not engage in certain “business combinations” with any “interested stockholder” for a three-year period following the time that the stockholder became an interested stockholder, unless:
| • | prior to such time, our board of directors approved either the business combination or the transaction that resulted in the stockholder becoming an interested stockholder; |
| • | upon consummation of the transaction that resulted in the stockholder becoming an interested stockholder, the interested stockholder owned at least 85% of our voting stock outstanding at the time the transaction commenced, excluding certain shares; or |
| • | at or subsequent to that time, the business combination is approved by our board of directors and by the affirmative vote of holders of at least two-thirds of our outstanding voting stock that is not owned by the interested stockholder. |
Generally, a “business combination” includes a merger, asset or stock sale or other transaction provided for or through our Company resulting in a financial benefit to the interested stockholder. Subject to certain exceptions, an “interested stockholder” is a person who owns 15% or more of our outstanding voting stock and the affiliates and associates of such person. For purposes of this provision, “voting stock” means any class or series of stock entitled to vote generally in the election of directors. Our amended and restated certificate of incorporation will provide that the Sponsors, their respective affiliates and any of their respective direct or indirect designated transferees (other than in certain market transfers and gifts) and any group of which such persons are a party do not constitute “interested stockholders” for purposes of this provision.
Under certain circumstances, this provision will make it more difficult for a person who qualifies as an “interested stockholder” to effect certain business combinations with our Company for a three-year period. This provision may encourage companies interested in acquiring us to negotiate in advance with our board of directors in order to avoid the stockholder approval requirement if our board of directors approves either the business combination or the transaction that results in the stockholder becoming an interested stockholder. These provisions also may have the effect of preventing changes in our board of directors and may make it more difficult to accomplish transactions that our stockholders may otherwise deem to be in their best interests. See “Description of Capital Stock”.
These anti-takeover defenses could discourage, delay or prevent a transaction involving a change in control of our Company. These provisions could also discourage proxy contests and make it more difficult for you and other stockholders to elect directors of your choosing and cause us to take corporate actions other than those you desire.
We will be exposed to risks relating to evaluations of controls required by Section 404 of the Sarbanes-Oxley Act.
We are in the process of evaluating our internal controls systems to allow management to report on, and our independent registered public accounting firm to audit, our internal controls over financial reporting. We will be
37
Table of Contents
performing the system and process evaluation and testing (and any necessary remediation) required to comply with the management certification and, if required, the auditor attestation requirements of Section 404 of the Sarbanes-Oxley Act. We will be required to comply with the management certification requirements of Section 404 in our annual report on Form 10-K for our first annual report that is filed with the SEC (subject to any change in applicable SEC rules). We will be required to comply with Section 404 in full (including an auditor attestation on management’s internal controls report) in our annual report on Form 10-K for the year following our first annual report required to be filed with the SEC (subject to any change in applicable SEC rules). Furthermore, upon completion of this process, we may identify control deficiencies of varying degrees of severity under applicable SEC and PCAOB rules and regulations that remain unremediated. As a public company, we will be required to report, among other things, control deficiencies that constitute a “material weakness” or changes in internal controls that, or that are reasonably likely to, materially affect internal controls over financial reporting. A “material weakness” is a deficiency, or a combination of deficiencies, in internal control over financial reporting, such that there is a reasonable possibility that a material misstatement of our annual or interim financial statements will not be prevented or detected on a timely basis. A “significant deficiency” is a deficiency, or a combination of deficiencies, in internal control over financial reporting that is less severe than a material weakness, yet important enough to merit attention by those responsible for oversight of our financial reporting.
To comply with the requirements of being a public company, we have undertaken various actions, and may need to take additional actions, such as implementing and enhancing our internal controls and procedures and hiring additional accounting or internal audit staff. Testing and maintaining internal controls can divert our management’s attention from other matters that are important to the operation of our business. Additionally, when evaluating our internal control over financial reporting, we may identify material weaknesses that we may not be able to remediate in time to meet the applicable deadline imposed upon us for compliance with the requirements of Section 404. If we identify any material weaknesses in our internal control over financial reporting or are unable to comply with the requirements of Section 404 in a timely manner or assert that our internal control over financial reporting is effective, if we are required to make restatements of our financial statements, or if our independent registered public accounting firm is unable to express an opinion as to the effectiveness of our internal control over financial reporting, investors may lose confidence in the accuracy, completeness or reliability of our financial reports and the trading price of our common stock may be adversely affected, and we could become subject to sanctions or investigations by the NYSE, the SEC or other regulatory authorities, which could require additional financial and management resources. In addition, if we fail to remedy any material weakness, our financial statements could be inaccurate and we could face restricted access to the capital markets.
The requirements of being a public company, including compliance with the reporting requirements of the Exchange Act and the requirements of the Sarbanes-Oxley Act and the NYSE, may strain our resources, increase our costs and divert management’s attention, and we may be unable to comply with these requirements in a timely or cost-effective manner.
As a public company, we will be subject to the reporting requirements of the Securities Exchange Act of 1934, as amended, or the Exchange Act, and the corporate governance standards of the Sarbanes-Oxley Act and the NYSE. These requirements will place a strain on our management, systems and resources and we will incur significant legal, accounting, insurance and other expenses that we have not incurred as a private company. The Exchange Act will require us to file annual, quarterly and current reports with respect to our business and financial condition within specified time periods and to prepare a proxy statement with respect to our annual meeting of stockholders. The Sarbanes-Oxley Act will require that we maintain effective disclosure controls and procedures and internal controls over financial reporting. The NYSE will require that we comply with various corporate governance requirements. To maintain and improve the effectiveness of our disclosure controls and procedures and internal controls over financial reporting and comply with the Exchange Act and the NYSE’s requirements, significant resources and management oversight will be required. This may divert management’s
38
Table of Contents
attention from other business concerns and lead to significant costs associated with compliance, which could have a material adverse effect on us and the price of our common stock.
The expenses incurred by public companies generally for reporting and corporate governance purposes have been increasing. We expect these rules and regulations to increase our legal and financial compliance costs and to make some activities more time-consuming and costly, although we are currently unable to estimate these costs with any degree of certainty. These laws and regulations could also make it more difficult or costly for us to obtain certain types of insurance, including director and officer liability insurance, and we may be forced to accept reduced policy limits and coverage or incur substantially higher costs to obtain the same or similar coverage. These laws and regulations could also make it more difficult for us to attract and retain qualified persons to serve on our board of directors, our board committees or as our executive officers. Advocacy efforts by stockholders and third parties may also prompt even more changes in governance and reporting requirements. We cannot predict or estimate the amount of additional costs we may incur or the timing of these costs. Furthermore, if we are unable to satisfy our obligations as a public company, we could be subject to delisting of our common stock, fines, sanctions and other regulatory action and potentially civil litigation.
We do not currently expect to pay any cash dividends.
The continued operation and expansion of our business will require substantial funding. Accordingly, we do not currently expect to pay any cash dividends on shares of our common stock. Any determination to pay dividends in the future will be at the discretion of our board of directors and will depend upon results of operations, financial condition, contractual restrictions, restrictions imposed by applicable law and other factors that our board of directors deems relevant. We are a holding company, and substantially all of our operations are carried out by our operating subsidiaries. Any inability on the part of our subsidiaries to make payments to us could have a material adverse effect on our business, financial condition and results of operations. Under our ABL Facility and Term Loan Facilities, our operating subsidiaries are significantly restricted in their ability to pay dividends or otherwise transfer assets to us, and we expect these limitations to continue in the future. Our ability to pay dividends may also be limited by the terms of any future credit agreement or any future debt or preferred equity securities of ours or of our subsidiaries. Accordingly, if you purchase shares in this offering, realization of a gain on your investment will depend on the appreciation of the price of our common stock, which may never occur. Investors seeking cash dividends in the foreseeable future should not purchase our common stock.
We are a “controlled company” within the meaning of the NYSE rules and, as a result, will qualify for, and may rely on, exemptions from certain corporate governance requirements.
Following the consummation of this offering, the Sponsors will continue to control a majority of the voting power of our outstanding common stock. As a result, we expect to be a “controlled company” within the meaning of the NYSE’s corporate governance standards. A company of which more than 50% of the voting power is held by an individual, a group or another company is a “controlled company” within the meaning of the NYSE rules and may elect not to comply with certain corporate governance requirements of the NYSE, including:
| • | the requirement that a majority of our board of directors consist of independent directors; |
| • | the requirement that we have a nominating/corporate governance committee that is composed entirely of independent directors with a written charter addressing the committee’s purpose and responsibilities; |
| • | the requirement that we have a compensation committee that is composed entirely of independent directors with a written charter addressing the committee’s purpose and responsibilities; and |
| • | the requirement for an annual performance evaluation of the nominating and corporate governance and compensation committees. |
Following this offering, we intend to rely on all of the exemptions listed above. If we do utilize the exemptions, we will not have a majority of independent directors and our nominating and corporate governance
39
Table of Contents
and compensation committees will not consist entirely of independent directors. As a result, our board of directors and those committees may have more directors who do not meet the NYSE’s independence standards than they would if those standards were to apply. The independence standards are intended to ensure that directors who meet those standards are free of any conflicting interest that could influence their actions as directors. Accordingly, you will not have the same protections afforded to stockholders of companies that are subject to all of the corporate governance requirements of the NYSE.
Our amended and restated certificate of incorporation designates the Court of Chancery of the State of Delaware as the exclusive forum for certain litigation that may be initiated by our stockholders, which could limit our stockholders’ ability to obtain a favorable judicial forum for disputes with us.
Our amended and restated certificate of incorporation will provide that the Court of Chancery of the State of Delaware will be the sole and exclusive forum for (i) any derivative action or proceeding brought on our behalf, (ii) any action asserting a claim of breach of a fiduciary duty owed to us or our stockholders by any of our directors, officers, employees or agents, (iii) any action asserting a claim against us arising under any provisions of the DGCL or our amended and restated certificate of incorporation or our amended and restated bylaws, or (iv) any action asserting a claim against us that is governed by the internal affairs doctrine. By becoming a stockholder in our Company, you will be deemed to have notice of and have consented to the provisions of our amended and restated certificate of incorporation related to choice of forum. The choice of forum provision in our amended and restated certificate of incorporation may limit our stockholders’ ability to obtain a favorable judicial forum for disputes with us.
40
Table of Contents
CAUTIONARY NOTE REGARDING FORWARD-LOOKING STATEMENTS
This prospectus contains forward-looking statements. You can generally identify forward-looking statements by our use of forward-looking terminology such as “anticipate,” “believe,” “continue,” “could,” “estimate,” “expect,” “intend,” “may,” “might,” “plan,” “potential,” “predict,” “seek,” “vision,” or “should,” or the negative thereof or other variations thereon or comparable terminology. The statements we make regarding the following matters are forward-looking by their nature:
| • | our business being affected by issues that affect consumer spending; |
| • | our business depending on having a large and loyal membership, and how any harm to our relationship with our members could have a material adverse effect on our business, net sales and results of operations; |
| • | our business plan and operating results depending on our ability to procure the merchandise we sell at the best possible prices; |
| • | competition adversely affecting our profitability; |
| • | our dependence on vendors to supply us with quality merchandise at the right time and at the right price; |
| • | our failure to timely identify or effectively respond to consumer trends, which could negatively affect our relationship with our members, the demand for our products and services and our market share; |
| • | our success depending on our ability to attract and retain a qualified management team and other team members while controlling our labor costs; |
| • | our comparable club sales and quarterly operating results fluctuating significantly; |
| • | changes in our product mix or in our revenues from gasoline sales negatively impacting our revenue and results of operations; |
| • | our failure to successfully maintain a relevant omnichannel experience for our members, thereby adversely impacting our results of operations; |
| • | our growth strategy to open new clubs involving risks; |
| • | implementation of technology initiatives disrupting our operations in the near team and failing to provide the anticipated benefits; and |
| • | our e-commerce business facing distinct risks, and how our failure to successfully manage it could have a negative impact on our profitability. |
The preceding list is not intended to be an exhaustive list of all of our forward-looking statements. We have based these forward-looking statements on our current expectations, assumptions, estimates and projections. While we believe these expectations, assumptions, estimates and projections are reasonable, such forward-looking statements are only predictions and involve known and unknown risks and uncertainties, many of which are beyond our control. These and other important factors, including those discussed in this prospectus under the headings “Prospectus Summary,” “Risk Factors,” “Management’s Discussion and Analysis of Financial Condition and Results of Operations” and “Business,” may cause our actual results, performance or achievements to differ materially from any future results, performance or achievements expressed or implied by these forward-looking statements. Given these risks and uncertainties, you are cautioned not to place undue reliance on such forward-looking statements. The forward-looking statements included elsewhere in this prospectus are not guarantees of future performance and our actual results of operations, financial condition and liquidity, and the development of the industry in which we operate, may differ materially from the forward-looking statements included elsewhere in this prospectus. In addition, even if our results of operations, financial condition and liquidity, and events in the industry in which we operate, are consistent with the forward-looking statements included elsewhere in this prospectus, they may not be predictive of results or developments in future periods.
41
Table of Contents
Any forward-looking statement that we make in this prospectus speaks only as of the date of such statement. Except as required by law, we do not undertake any obligation to update or revise, or to publicly announce any update or revision to, any of the forward-looking statements, whether as a result of new information, future events or otherwise, after the date of this prospectus.
42
Table of Contents
We estimate that the net proceeds to us from our sale of shares in this offering will be approximately $ million, based on the assumed initial public offering price of $ per share, which is the midpoint of the price range set forth on the cover page of this prospectus, and after deducting underwriting discounts and estimated offering expenses payable by us. We intend to use the net proceeds from this offering, together with cash and borrowings under the ABL Facility, to repay approximately $ million of indebtedness plus $ million of accrued and unpaid interest and prepayment premium under the Second Lien Facility. To the extent any proceeds from this offering remain after the repayment in full of our Second Lien Facility, including any accrued and unpaid interest and prepayment premium thereon, we intend to use such remaining proceeds for general corporate purposes. We will not receive any of the proceeds from any sale of shares of common stock by the selling stockholders.
The interest rate on borrowings under the Second Lien Facility as of , 2018 was % and the maturity date is February 3, 2025. The borrowings under the Second Lien Facility were incurred on February 3, 2017, together with borrowings under the First Lien Facility, to finance (i) a $735.5 million dividend payment to our stockholders, including funds affiliated with the Sponsors and (ii) $72.9 million in payments pursuant to our outstanding stock options and retention bonus arrangements.
Each $1.00 increase (decrease) in the assumed initial public offering price of $ per share, the midpoint of the price range set forth on the cover page of this prospectus, would increase (decrease) the net proceeds to us from this offering by approximately $ , assuming the number of shares offered by us, as set forth on the cover page of this prospectus, remains the same, and after deducting underwriting discounts and estimated offering expenses payable by us. Each increase (decrease) of 1 million shares in the number of shares sold in this offering, as set forth on the cover page of this prospectus, would increase (decrease) the net proceeds to us from this offering by approximately $ , assuming an initial public offering price of $ per share, the midpoint of the price range set forth on the cover page of this prospectus, remains the same, and after deducting underwriting discounts and estimated offering expenses payable by us. The information discussed above is illustrative only and will adjust based on the actual initial public offering price and other terms of this offering determined at pricing.
43
Table of Contents
We do not currently expect to pay any cash dividends on our common stock for the foreseeable future. Instead, we intend to retain future earnings, if any, for the future operation and expansion of our business and the repayment of debt. Any determination to pay dividends in the future will be at the discretion of our board of directors and will depend upon our results of operations, cash requirements, financial condition, contractual restrictions, restrictions imposed by applicable laws and other factors that our board of directors may deem relevant. Our business is conducted through our subsidiaries. Dividends, distributions and other payments from, and cash generated by, our subsidiaries will be our principal sources of cash to repay indebtedness, fund operations and pay dividends. Accordingly, our ability to pay dividends to our stockholders is dependent on the earnings and distributions of funds from our subsidiaries. In addition, the covenants in the agreements governing our existing indebtedness, including the ABL Facility and the Term Loan Facilities, significantly restrict the ability of our subsidiaries to pay dividends or otherwise transfer assets to us. See “Description of Certain Indebtedness,” “Risk Factors—Risks Relating to our Business—We are a holding company with no operations of our own, and we depend on our subsidiaries for cash” and “Risk Factors—Risks Relating to our Common Stock and this Offering—We do not currently expect to pay any cash dividends.”
44
Table of Contents
The following table sets forth our cash and cash equivalents and our consolidated capitalization as of February 3, 2018:
| • | on an actual basis; |
| • | on a pro forma (reclassification only) basis, giving effect to the reclassification of our contingently redeemable common stock to stockholders’ equity resulting from the automatic termination of the non-Sponsor stockholders’ put rights upon the consummation of this offering; and |
| • | on a pro forma basis, to give effect to: (i) the filing and effectiveness of our amended and restated certificate of incorporation and amended and restated by-laws; (ii) our issuance and sale of shares of our common stock in this offering at an assumed initial public offering price of $ per share, the midpoint of the price range set forth on the cover page of this prospectus, after deducting underwriting discounts and estimated offering expenses payable by us; and (iii) the application of the net proceeds from this offering, together with cash and borrowings under the ABL Facility, to repay in full all obligations under the Second Lien Facility, as described in “Use of Proceeds.” |
The information discussed below is illustrative only, and our cash and cash equivalents and capitalization following the consummation of this offering will adjust based on the actual initial public offering price and other terms of this offering determined at pricing. You should read the data set forth below in conjunction with “Management’s Discussion and Analysis of Financial Condition and Results of Operations,” “Description of Capital Stock” and the consolidated financial statements and related notes included elsewhere in this prospectus.
| As of February 3, 2018 | ||||||||||||
| Actual | Pro Forma (Reclassification Only) |
Pro Forma(1)(2)(3) |
||||||||||
| (dollars in thousands, except per share data) | ||||||||||||
| Cash and cash equivalents |
$ | 34,954 | $ | 34,954 | $ | |||||||
|
|
|
|
|
|
|
|||||||
| Long-term debt, including current maturities: |
||||||||||||
| ABL Facility |
217,000 | 217,000 | ||||||||||
| First Lien Facility |
1,883,930 | 1,883,930 | ||||||||||
| Second Lien Facility |
611,480 | 611,480 | ||||||||||
| Capital lease and financing obligations |
35,702 | 35,702 | ||||||||||
|
|
|
|
|
|
|
|||||||
| Total debt, net of discount and debt issuance cost |
2,748,112 | 2,748,112 | ||||||||||
| Contingently redeemable common stock $0.01 par value; 208,474 shares issued and outstanding actual; no shares issued and outstanding pro forma (reclassification only) and pro forma |
10,438 | — | ||||||||||
| Stockholders’ deficit: |
||||||||||||
| Preferred stock; $0.01 par value; no shares authorized, issued and outstanding, actual and pro forma (reclassification only); shares authorized and no shares issued or outstanding pro forma |
||||||||||||
| Common stock; $0.01 par value; 20,000,000 shares authorized, 12,521,688 shares issued and 12,439,052 shares outstanding actual; 20,000,000 shares authorized, 12,730,162 shares issued and 12,647,526 shares outstanding pro forma (reclassification only); shares authorized, shares issued and outstanding, pro forma(4) |
124 | 126 | ||||||||||
| Additional paid-in capital |
2,883 | 13,319 | ||||||||||
| Accumulated deficit |
(1,035,265 | ) | (1,035,265 | ) | ||||||||
| Accumulated other comprehensive income |
2,401 | 2,401 | ||||||||||
|
|
|
|
|
|
|
|||||||
| Total stockholders’ deficit |
(1,029,857 | ) | (1,019,419 | ) | ||||||||
|
|
|
|
|
|
|
|||||||
| Total capitalization |
$ | 1,728,693 | $ | 1,728,693 | $ | |||||||
|
|
|
|
|
|
|
|||||||
45
Table of Contents
| (1) | Each $1.00 increase (decrease) in the assumed initial public offering price of $ per share, the midpoint of the price range set forth on the cover page of this prospectus, would increase (decrease) the pro forma amount of each of cash and cash equivalents, additional paid-in-capital, total stockholders’ equity and total capitalization by $ million, assuming the number of shares offered by us, as set forth on the cover page of this prospectus, remains the same, and after deducting underwriting discounts and estimated offering expenses payable by us. Similarly, each increase (decrease) of 1.0 million shares in the number of shares sold in this offering, as set forth on the cover page of this prospectus, would increase (decrease) the pro forma amount of each of cash and cash equivalents, additional paid-in-capital, total stockholders’ equity and total capitalization by $ million, assuming the assumed initial public offering price of $ per share, the midpoint of the price range set forth on the cover page of this prospectus, remains the same, and after deducting underwriting discounts and estimated offering expenses payable by us. |
| (2) | Our estimate of the net proceeds that we will receive from this offering reflects the deduction of an estimated $ million of expenses relating to the offering; however, as of February 3, 2018, we had already paid approximately $ million of such expenses. |
| (3) | We intend to use the net proceeds from this offering to repay approximately $ million of indebtedness plus any accrued and unpaid interest and prepayment premium on the outstanding principal amount of the Second Lien Facility. The table above reflects the use of (i) approximately $ million of additional borrowings under the ABL Facility to repay in full the remaining principal amount of the Second Lien Facility and (ii) approximately $ million of cash to pay the 1% prepayment premium applicable to voluntary prepayments of principal on the Second Lien Facility. See “Description of Certain Indebtedness—Term Loan Facilities—Optional and Mandatory Prepayments.” See “Use of Proceeds.” |
| (4) | Legally outstanding shares include both common stock and contingently redeemable common stock. Shares repurchased from our non-Sponsor stockholders are legally issued shares, but are not issued or outstanding for accounting purposes. See Note 10 to our consolidated financial statements and related notes included elsewhere in this prospectus. |
The number of shares of common stock to be outstanding after this offering excludes:
| • | shares of common stock issuable upon the exercise of options outstanding under our equity incentive plans as of February 3, 2018 at a weighted average exercise price of $ per share; |
| • |
additional shares of common stock reserved for future issuance under our new omnibus incentive plan; and |
| • | shares reserved for issuance under our new employee stock purchase plan. |
46
Table of Contents
If you purchase any of the shares offered by this prospectus, you will experience dilution to the extent of the difference between the offering price per share that you pay in this offering and our pro forma net tangible book value (deficit) per share of our common stock immediately after this offering.
Our net tangible book value (deficit) as of February 3, 2018 was $(2,178.9) million, or $(175.16) per share of common stock. Net tangible book value (deficit) is total tangible assets less total liabilities and contingently redeemable common stock, which is not included within stockholders’ equity. Tangible assets represent total assets excluding goodwill and other intangible assets. Net tangible book value (deficit) per share is determined by dividing our net tangible book value (deficit) by 12,439,052 shares of common stock outstanding, as of February 3, 2018.
Our pro forma (reclassification only) net tangible book value (deficit) as of February 3, 2018 was $(2,168.4) million, or $(171.45) per share of common stock. Pro forma (reclassification only) net tangible book value (deficit) is the amount of our total tangible assets less our total liabilities, after giving effect to the reclassification of our contingently redeemable common stock to stockholders’ equity resulting from the automatic termination of the non-Sponsor stockholders’ put rights upon the consummation of this offering. Pro forma (reclassification only) net tangible book value (deficit) per share represents our pro forma (reclassification only) net tangible book value (deficit) divided by the aggregate number of shares of common stock outstanding, after giving effect to the adjustment described above.
After giving further effect to (i) our sale of shares of common stock in this offering at an assumed initial public offering price of $ per share, the midpoint of the price range set forth on the cover page of this prospectus and (ii) the application of the net proceeds from this offering, together with cash and borrowings under the ABL Facility, to repay in full all obligations under the Second Lien Facility, as described in “Use of Proceeds,” our pro forma net tangible book value as of February 3, 2018 would have been $ million, or $ per share. This represents an immediate increase in pro forma net tangible book value of $ per share to our existing stockholders and an immediate dilution of $ per share to new investors purchasing shares of common stock in this offering. Dilution in pro forma net tangible book value (deficit) represents the difference between the price per share paid by investors in this offering and our net tangible book value per share of immediately after the offering.
The following table illustrates this dilution on a per share basis:
| Assumed initial public offering price per share |
$ | |||||||
| Historical net tangible book value (deficit) per share as of February 3, 2018 |
$ | (175.16 | ) | |||||
| Increase per share attributable to the pro forma (reclassification only) adjustments described above |
3.71 | |||||||
|
|
|
|||||||
| Pro forma (reclassification only) net tangible book value (deficit) per share as of February 3, 2018 |
(171.45 | ) | ||||||
| Increase in pro forma (reclassification only) net tangible book value per share attributable to new investors purchasing common stock in this offering and the use of proceeds from this offering |
$ | |||||||
|
|
|
|||||||
| Pro forma net tangible book value per share after this offering |
||||||||
|
|
|
|||||||
| Dilution per share to new investors purchasing common stock in this offering |
$ | |||||||
|
|
|
Each $1.00 increase (decrease) in the assumed initial offering price of $ per share, the midpoint of the price range set forth on the cover page of this prospectus, would increase (decrease) our pro forma net tangible book value by $ , or $ per share, and the dilution per common share to new investors
47
Table of Contents
in this offering by $ per share, assuming the number of shares offered by us, as set forth on the cover page of this prospectus, remains the same, and after deducting underwriting discounts and estimated offering expenses payable by us. An increase of 1.0 million shares in the number of shares of common stock offered by us, as set forth on the cover page of this prospectus, would increase the pro forma net tangible book value per share by $ and decrease the dilution per share to new investors by $ , assuming no change in the assumed initial public offering price and after deducting estimated underwriting discounts and estimated offering expenses payable by us. A decrease of 1.0 million shares in the number of shares of common stock offered by us, as set forth on the cover page of this prospectus, would decrease the pro forma net tangible book value per share by $ and increase the dilution per share to new investors by $ , assuming no change in the assumed initial public offering price and after deducting underwriting discounts and estimated offering expenses payable by us.
The following table summarizes, as of February 3, 2018, on a pro forma basis, the number of shares of common stock purchased or to be purchased from us, the total consideration paid or to be paid to us and the average price per share paid by existing stockholders or to be paid by new investors purchasing shares of common stock in this offering at an assumed initial public offering price of $ per share, which is the midpoint of the price range set forth on the cover page of this prospectus, before deducting the underwriting discounts and estimated offering expenses payable by us.
| Shares Purchased | Total Consideration | Average Price Per Share |
||||||||||||||||||
| Number | Percent | Amount | Percent | |||||||||||||||||
| Existing stockholders |
% | $ | % | $ | ||||||||||||||||
| New investors |
||||||||||||||||||||
|
|
|
|
|
|
|
|
|
|||||||||||||
| Total |
100% | $ | 100% | |||||||||||||||||
|
|
|
|
|
|
|
|
|
|||||||||||||
Each $1.00 increase (decrease) in the assumed initial public offering price of $ per share, the midpoint of the price range set forth on the cover page of this prospectus, would increase (decrease) total consideration paid by new investors by $ million and total consideration paid by all stockholders and average price per share paid by all stockholders by $ million and $ per share, respectively, assuming the number of shares offered by us, as set forth on the cover page of this prospectus, remains the same, and after deducting underwriting discounts and estimated offering expenses payable by us. An increase (decrease) of 1.0 million shares in the number of shares offered by us, as set forth on the cover page of this prospectus, would increase (decrease) total consideration paid by new investors by $ million and total consideration paid by all stockholders and average price per share paid by all stockholders by $ million and $ per share, respectively, assuming the assumed initial public offering price remains the same, and after deducting underwriting discounts and estimated offering expenses payable by us.
The table above assumes the underwriters do not exercise their option to purchase additional shares from the selling stockholders in this offering. If the underwriters fully exercise their option to purchase additional shares of our common stock in this offering, there would be no change to the pro forma net tangible book value per share or the dilution to new investors in this offering. If the underwriters fully exercise their option, the number of shares held by new investors will increase to shares of our common stock, or approximately % of the total number of shares of our common stock outstanding after this offering, and the number of shares held by existing stockholders would decrease to shares of our common stock, or approximately % of the total number of shares of our common stock outstanding after this offering.
The number of shares of common stock to be outstanding after this offering excludes:
| • | shares of common stock issuable upon the exercise of options outstanding under our equity incentive plans as of February 3, 2018 at a weighted average exercise price of $ per share; |
48
Table of Contents
| • |
additional shares of common stock reserved for future issuance under our new omnibus incentive plan; and |
| • | shares reserved for issuance under our new employee stock purchase plan. |
To the extent any options are granted and exercised in the future, there may be additional economic dilution to new investors.
In addition, we may choose to raise additional capital due to market conditions or strategic considerations, even if we believe we have sufficient funds for our current or future operating plans. To the extent that we raise additional capital through the sale of equity or convertible debt securities, the issuance of these securities could result in further dilution to our stockholders.
49
Table of Contents
SELECTED CONSOLIDATED FINANCIAL DATA
We have derived the following selected consolidated statements of operations and cash flow data for the fiscal years ended January 30, 2016, January 28, 2017 and February 3, 2018 and the consolidated balance sheet data for the fiscal years ended January 28, 2017 and February 3, 2018 from our audited consolidated financial statements included elsewhere in this prospectus. We have derived the following selected consolidated statements of operations and cash flow data for the fiscal years ended February 1, 2014 and January 31, 2015 and the consolidated balance sheet data as of February 1, 2014, January 31, 2015 and January 30, 2016 from our unaudited consolidated financial statements not included in this prospectus.
The historical results presented below are not necessarily indicative of the results to be expected for any future period. You should read the selected consolidated financial data presented below in conjunction with “Management’s Discussion and Analysis of Financial Condition and Results of Operations” and our consolidated financial statements and related notes included elsewhere in this prospectus.
| Fiscal Year Ended | ||||||||||||||||||||
| February 1, 2014 |
January 31, 2015 |
January 30, 2016 |
January 28, 2017 |
February 3, 2018 |
||||||||||||||||
| (dollars in thousands, except per share data) | ||||||||||||||||||||
| Statement of Operations Data: |
||||||||||||||||||||
| Net sales |
$ | 12,342,450 | $ | 12,488,247 | $ | 12,220,215 | $ | 12,095,302 | $ | 12,495,995 | ||||||||||
| Membership fee income |
242,367 | 243,023 | 247,338 | 255,235 | 258,594 | |||||||||||||||
|
|
|
|
|
|
|
|
|
|
|
|||||||||||
| Total revenues |
12,584,817 | 12,731,270 | 12,467,553 | 12,350,537 | 12,754,589 | |||||||||||||||
| Cost of sales |
10,621,719 | 10,758,461 | 10,476,519 | 10,223,017 | 10,513,492 | |||||||||||||||
| Selling, general and administrative expenses |
1,807,507 | 1,776,432 | 1,797,780 | 1,908,752 | 2,017,821 | |||||||||||||||
| Preopening expenses |
7,443 | 12,310 | 6,458 | 2,749 | 3,004 | |||||||||||||||
|
|
|
|
|
|
|
|
|
|
|
|||||||||||
| Operating income |
148,148 | 184,067 | 186,796 | 216,019 | 220,272 | |||||||||||||||
| Interest expense, net |
168,364 | 154,481 | 150,093 | 143,351 | 196,724 | |||||||||||||||
|
|
|
|
|
|
|
|
|
|
|
|||||||||||
| Income (loss) from continuing operations before income taxes |
(20,216 | ) | 29,586 | 36,703 | 72,668 | 23,548 | ||||||||||||||
| Provision (benefit) for income taxes |
(9,786 | ) | 10,277 | 12,049 | 27,968 | (28,427 | ) | |||||||||||||
|
|
|
|
|
|
|
|
|
|
|
|||||||||||
| Income (loss) from continuing operations |
(10,430 | ) | 19,309 | 24,654 | 44,700 | 51,975 | ||||||||||||||
| Loss from discontinued operations, net of income taxes |
(4,457 | ) | (296 | ) | (550 | ) | (476 | ) | (1,674 | ) | ||||||||||
|
|
|
|
|
|
|
|
|
|
|
|||||||||||
| Net income (loss) |
$ | (14,887 | ) | $ | 19,013 | $ | 24,104 | $ | 44,224 | $ | 50,301 | |||||||||
|
|
|
|
|
|
|
|
|
|
|
|||||||||||
| Per Share Data(1): |
||||||||||||||||||||
| Income (loss) from continuing operations per share attributable to common stockholders—basic |
$ | (0.83) | $ | 1.54 | $ | 1.96 | $ | 3.55 | $ | 4.12 | ||||||||||
| Income (loss) from continuing operations per share attributable to common stockholders—diluted |
$ | (0.83) | $ | 1.50 | $ | 1.91 | $ | 3.45 | $ | 3.94 | ||||||||||
| Weighted average number of shares outstanding: |
||||||||||||||||||||
| Basic |
12,495 | 12,496 | 12,553 | 12,595 | 12,627 | |||||||||||||||
| Diluted |
12,495 | 12,894 | 12,892 | 12,962 | 13,181 | |||||||||||||||
| Cash dividends per share |
$ | 33.06 | — | — | — | $ | 58.15 | |||||||||||||
50
Table of Contents
| Fiscal Year Ended | ||||||||||||||||||||
| February 1, 2014 |
January 31, 2015 |
January 30, 2016 |
January 28, 2017 |
February 3, 2018 |
||||||||||||||||
| (in thousands) | ||||||||||||||||||||
| Statement of Cash Flow Data: |
||||||||||||||||||||
| Net cash provided by operating activities(2) |
$ | 204,512 | $ | 285,821 | $ | 159,361 | $ | 297,428 | $ | 210,085 | ||||||||||
| Net cash (used in) investing activities |
(144,820 | ) | (158,073 | ) | (112,363 | ) | (114,756 | ) | (137,466 | ) | ||||||||||
| Net cash (used in) financing activities |
(69,778 | ) | (130,467 | ) | (46,236 | ) | (188,118 | ) | (69,629 | ) | ||||||||||
|
|
|
|
|
|
|
|
|
|
|
|||||||||||
| Net increase (decrease) in cash and cash equivalents |
$ | (10,086 | ) | $ | (2,719 | ) | $ | 762 | $ | (5,446 | ) | $ | 2,990 | |||||||
|
|
|
|
|
|
|
|
|
|
|
|||||||||||
| As of | ||||||||||||||||||||
| February 1, 2014 |
January 31, 2015 |
January 30, 2016 |
January 28, 2017 |
February 3, 2018 |
||||||||||||||||
| (in thousands) | ||||||||||||||||||||
| Balance Sheet Data: |
||||||||||||||||||||
| Cash and cash equivalents |
$ | 39,367 | $ | 36,648 | $ | 37,410 | $ | 31,964 | $ | 34,954 | ||||||||||
| Merchandise inventories |
1,015,788 | 1,038,194 | 1,061,854 | 1,031,844 | 1,019,138 | |||||||||||||||
| Property and equipment, net |
854,865 | 850,422 | 794,446 | 763,643 | 758,750 | |||||||||||||||
| Net working capital(3) |
156,664 | 97,495 | 131,129 | 52,090 | 51,813 | |||||||||||||||
| Total assets |
3,528,387 | 3,482,980 | 3,408,933 | 3,232,219 | 3,273,856 | |||||||||||||||
| Total debt(4) |
(2,411,423 | ) | (2,289,568 | ) | (2,229,835 | ) | (2,056,406 | ) | (2,748,112 | ) | ||||||||||
| Contingently redeemable common stock |
7,198 | 6,944 | 7,951 | 8,145 | 10,438 | |||||||||||||||
| Total stockholders’ deficit |
(450,344 | ) | (427,475 | ) | (401,073 | ) | (347,211 | ) | (1,029,857 | ) | ||||||||||
| Fiscal Year Ended | ||||||||||||||||||||
| February 1, 2014 |
January 31, 2015 |
January 30, 2016 |
January 28, 2017 |
February 3, 2018 |
||||||||||||||||
| Other Financial and Operating Data: |
||||||||||||||||||||
| Total clubs at end of period |
201 | 207 | 213 | 214 | 215 | |||||||||||||||
| Comparable club sales(5) |
(1.1)% | (0.5)% | (4.2)% | (2.6)% | 0.8% | |||||||||||||||
| Comparable club sales excluding gasoline sales |
(1.0)% | (0.3)% | (0.5)% | (2.3)% | (0.9)% | |||||||||||||||
| Adjusted EBITDA (in thousands)(6) |
$ | 411,729 | $ | 413,904 | $ | 405,992 | $ | 457,326 | $ | 533,507 | ||||||||||
| Free cash flow (in thousands)(7) |
62,485 | 130,624 | 46,998 | 182,672 | 72,619 | |||||||||||||||
| Membership renewal rate |
83% | 83% | 84% | 85% | 86% | |||||||||||||||
| Capital expenditures |
$ | 142,027 | $ | 155,197 | $ | 112,363 | $ | 114,756 | $ | 137,466 | ||||||||||
| (1) | See Note 21 to our consolidated financial statements included elsewhere in this prospectus for additional information regarding the calculation of basic and diluted income per share attributable to common stockholders. |
| (2) | Includes charges for discontinued operations. |
| (3) | Net working capital is defined as total current assets (excluding cash and cash equivalents) less total current liabilities (excluding current portion of long-term debt). |
| (4) | Total debt includes current and non-current portion of long-term debt, net of discount and debt issuance costs and our obligations under capital leases and financing obligations. |
| (5) | Represents the change in net sales among all clubs open in both the given period and the prior period. In determining comparable club sales, we include all clubs that had been open for at least 13 months at the beginning of the relevant period and were in operation during all of both periods being compared, including relocated clubs and expansions. If a club is in the process of closing, it is excluded from the determination of comparable club sales. In addition, when applicable, we adjust for the effect of an additional week in a fiscal year or quarter. See “Management’s Discussion and Analysis of Financial Condition and Results of Operations” for additional information regarding our calculation of comparable club sales. |
51
Table of Contents
| (6) | The following is a reconciliation of our income from continuing operations to Adjusted EBITDA for the periods presented: |
| Fiscal Year Ended | ||||||||||||||||||||
| February 1, 2014 |
January 31, 2015 |
January 30, 2016 |
January 28, 2017 |
February 3, 2018 |
||||||||||||||||
| (dollars in thousands) | ||||||||||||||||||||
| Income (loss) from continuing operations |
$ | (10,430 | ) | $ | 19,309 | $ | 24,654 | $ | 44,700 | $ | 51,975 | |||||||||
| Interest expense, net |
168,364 | 154,481 | 150,093 | 143,351 | 196,724 | |||||||||||||||
| Provision (benefit) for income taxes |
(9,786 | ) | 10,277 | 12,049 | 27,968 | (28,427 | ) | |||||||||||||
| Depreciation and amortization |
197,375 | 186,701 | 177,483 | 178,325 | 164,061 | |||||||||||||||
| Compensatory payments related to options(a) |
34,366 | 1,690 | 1,497 | 6,143 | 77,953 | |||||||||||||||
| Stock-based compensation expense(b) |
300 | 2,344 | 2,265 | 11,828 | 9,102 | |||||||||||||||
| Preopening expenses(c) |
7,443 | 12,310 | 6,458 | 2,749 | 3,004 | |||||||||||||||
| Management fees(d) |
8,222 | 8,021 | 8,139 | 8,053 | 8,038 | |||||||||||||||
| Noncash rent(e) |
12,176 | 11,417 | 8,976 | 7,138 | 5,391 | |||||||||||||||
| Strategic consulting(f) |
— | — | 14,619 | 26,157 | 30,316 | |||||||||||||||
| Severance(g) |
1,592 | 4,392 | 7,488 | 2,320 | 9,065 | |||||||||||||||
| Asset retirement obligations(h) |
— | — | (7,044 | ) | — | — | ||||||||||||||
| Other adjustments(i) |
2,107 | 2,962 | (685 | ) | (1,406 | ) | 6,305 | |||||||||||||
|
|
|
|
|
|
|
|
|
|
|
|||||||||||
| Adjusted EBITDA |
$ | 411,729 | $ | 413,904 | $ | 405,992 | $ | 457,326 | $ | 533,507 | ||||||||||
|
|
|
|
|
|
|
|
|
|
|
|||||||||||
| Adjusted EBITDA as a percentage of net sales |
3.3% | 3.3% | 3.3% | 3.8% | 4.3% | |||||||||||||||
|
|
|
|
|
|
|
|
|
|
|
|||||||||||
| (a) | Represents payments to holders of our stock options made pursuant to antidilution provisions in connection with dividends paid to our Sponsors. |
| (b) | Represents non-cash stock-based compensation expense. |
| (c) | Represents direct incremental costs of opening or relocating a facility that are charged to operations as incurred. |
| (d) | Represents management fees paid to our Sponsors (or advisory affiliates thereof) in accordance with our management services agreement, which will terminate on the consummation of this offering. See “Certain Relationships and Related Party Transactions—Management Services Agreement.” |
| (e) | Consists of an adjustment to remove the non-cash portion of rent expense, which has been recorded on a straight-line basis in accordance with GAAP. |
| (f) | Represents fees paid to external consultants for two strategic initiatives of limited duration. |
| (g) | Represents termination costs associated with voluntary and involuntary workforce reductions that occurred in January 2016, incremental severance expense to former executives and voluntary workforce reductions that occurred in February 2018. |
| (h) | Represents non-cash gain related to a change in the estimated removal costs of our tanks and other infrastructure at our gasoline stations that has been accounted for as an asset retirement obligation. |
| (i) | Other non-cash or discrete items as determined by management, including amortization of a deferred gain from sale lease back transactions in 2013, non-cash accretion expense on asset retirement obligations, obligations associated with our post-retirement medical plan and incremental expense to former executives. Fiscal year 2017 includes corporate related transaction costs. |
See “Non-GAAP Financial Measures” for more information on our use of Adjusted EBITDA.
52
Table of Contents
| (7) | The following is a reconciliation of our net cash from operating activities to free cash flow for the periods presented: |
| Fiscal Year Ended | ||||||||||||||||||||
| February 1, 2014 |
January 31, 2015 |
January 30, 2016 |
January 28, 2017 |
February 3, 2018 |
||||||||||||||||
| (in thousands) | ||||||||||||||||||||
| Net cash from operating activities |
$204,512 | $285,821 | $ | 159,361 | $ | 297,428 | $ | 210,085 | ||||||||||||
| Less: Capital expenditures |
142,027 | 155,197 | 112,363 | 114,756 | 137,466 | |||||||||||||||
|
|
|
|
|
|
|
|
|
|
|
|||||||||||
| Free cash flow |
$ 62,485 | $130,624 | $ | 46,998 | $ | 182,672 | $ | 72,619 | ||||||||||||
|
|
|
|
|
|
|
|
|
|
|
|||||||||||
See “Non-GAAP Financial Measures” for more information on our use of free cash flow.
53
Table of Contents
UNAUDITED PRO FORMA CONSOLIDATED FINANCIAL STATEMENTS
We prepared the following unaudited pro forma consolidated financial statements to give effect to (i) the reclassification of our contingently redeemable common stock to stockholders’ equity resulting from the automatic termination of the non-Sponsor stockholders’ put rights upon the consummation of this offering, (ii) our issuance and sale of shares of our common stock in this offering at an assumed initial public offering price of $ per share, the midpoint of the price range set forth on the cover page of this prospectus, after deducting underwriting discounts and estimated offering expenses payable by us, (iii) the application of the net proceeds from our initial public offering together with cash and borrowings under the ABL Facility, to repay approximately $ million of indebtedness plus $ million of accrued and unpaid interest and prepayment premium under the Second Lien Facility and (iv) the termination of the annual fee for our management services agreement with our Sponsors.
The unaudited pro forma consolidated balance sheet as of February 3, 2018 gives effect to the transactions above as if they had been completed on February 3, 2018. The unaudited pro forma consolidated statements of operations for the year ended February 3, 2018 give effect to the transactions above as if they occurred on January 29, 2017 (the first day of fiscal year 2017). We derived these unaudited pro forma consolidated financial statements from, and you should read them in conjunction with, our audited consolidated financial statements and the related notes to those statements included elsewhere in this prospectus.
The unaudited pro forma consolidated financial statements are presented for illustrative purposes and are based on available information and assumptions we believe are reasonable. The unaudited pro forma consolidated financial statements were prepared in accordance with the rules and regulations of the Securities and Exchange Commission (“SEC”) and should not be considered indicative of the consolidated financial position or results of operations that would have occurred if the transactions above had been completed on the dates indicated, nor are they necessarily indicative of our future consolidated financial position or results of operations. Our historical consolidated financial statements have been adjusted in the unaudited pro forma consolidated financial statements to give effect to pro forma events that are (1) directly attributable to transactions above, (2) factually supportable and (3) with respect to the statements of operations, expected to have a continuing impact on the consolidated results.
54
Table of Contents
BJ’S WHOLESALE CLUB HOLDINGS, INC.
UNAUDITED PRO FORMA CONSOLIDATED BALANCE SHEET
(Amounts in thousands, except per share amounts)
| Historical February 3, 2018 |
Pro Forma Adjustments |
Note | Pro Forma February 3, 2018 |
|||||||||||||
| ASSETS |
||||||||||||||||
| Current assets: |
||||||||||||||||
| Cash and cash equivalents |
$ | 34,954 | A | $ | ||||||||||||
| Accounts receivable, net |
190,756 | |||||||||||||||
| Merchandise inventories |
1,019,138 | |||||||||||||||
| Prepaid expenses |
81,972 | |||||||||||||||
| Prepaid federal and state income taxes |
9,784 | |||||||||||||||
|
|
|
|
|
|
|
|||||||||||
| Total current assets |
1,336,604 | |||||||||||||||
| Property and equipment: |
||||||||||||||||
| Land and buildings |
404,400 | |||||||||||||||
| Leasehold costs and improvements |
184,165 | |||||||||||||||
| Furniture, fixtures and equipment |
924,616 | |||||||||||||||
| Construction in progress |
20,775 | |||||||||||||||
|
|
|
|
|
|
|
|||||||||||
| Less: accumulated depreciation and amortization |
(775,206 | ) | ||||||||||||||
|
|
|
|
|
|
|
|||||||||||
| Total property and equipment, net |
758,750 | |||||||||||||||
| Goodwill |
924,134 | |||||||||||||||
| Intangibles, net |
224,876 | |||||||||||||||
| Other assets |
29,492 | B | ||||||||||||||
|
|
|
|
|
|
|
|||||||||||
| Total assets |
$ | 3,273,856 | $ | |||||||||||||
|
|
|
|
|
|
|
|||||||||||
| LIABILITIES |
||||||||||||||||
| Current liabilities: |
||||||||||||||||
| Current portion of long-term debt |
$ | 219,750 | D | $ | ||||||||||||
| Accounts payable |
751,948 | |||||||||||||||
| Accrued expenses and other current liabilities |
495,767 | C | ||||||||||||||
| Closed store obligations due within one year |
2,122 | |||||||||||||||
|
|
|
|
|
|
|
|||||||||||
| Total current liabilities |
1,469,587 | |||||||||||||||
| Long-term debt |
2,492,660 | D | ||||||||||||||
| Noncurrent closed store obligations |
6,561 | |||||||||||||||
| Deferred income taxes |
57,074 | |||||||||||||||
| Other noncurrent liabilities |
267,393 | |||||||||||||||
| Commitments and contingencies (See Note 8) |
||||||||||||||||
| Contingently redeemable common stock, par value $0.01; 208 shares issued and outstanding, actual; no shares issued and outstanding, pro forma |
10,438 | E | ||||||||||||||
| STOCKHOLDERS’ DEFICIT |
||||||||||||||||
| Common stock, par value $0.01; 20,000 shares authorized; 12,439 shares issued and outstanding, actual; shares issued and outstanding, pro forma |
124 | E | ||||||||||||||
| Additional paid-in capital |
2,883 | E | ||||||||||||||
| Accumulated deficit |
(1,035,265 | ) | F | |||||||||||||
| Accumulated other comprehensive income |
2,401 | |||||||||||||||
|
|
|
|
|
|
|
|||||||||||
| Total stockholders’ deficit |
(1,029,857 | ) | ||||||||||||||
|
|
|
|
|
|
|
|||||||||||
| Total liabilities, contingently redeemable common stock and stockholders’ deficit |
$ | 3,273,856 | $ | |||||||||||||
|
|
|
|
|
|
|
|||||||||||
55
Table of Contents
BJ’S WHOLESALE CLUB HOLDINGS, INC.
UNAUDITED PRO FORMA CONSOLIDATED STATEMENT OF OPERATIONS
(Amounts in thousands, except per share amounts)
| Historical Fiscal Year Ended February 3, 2018 |
Pro Forma Adjustments |
Note | Pro Forma Fiscal Year Ended February 3, 2018 |
|||||||||||||
| Net sales |
$ | 12,495,995 | $ | |||||||||||||
| Membership fee income |
258,594 | |||||||||||||||
|
|
|
|
|
|
|
|||||||||||
| Total revenues |
12,754,589 | |||||||||||||||
| Cost of sales |
10,513,492 | |||||||||||||||
| Selling, general and administrative expenses |
2,017,821 | G | ||||||||||||||
| Preopening expenses |
3,004 | |||||||||||||||
|
|
|
|
|
|
|
|||||||||||
| Operating income |
220,272 | |||||||||||||||
| Interest expense, net |
196,724 | H | ||||||||||||||
|
|
|
|
|
|
|
|||||||||||
| Income from continuing operations before income taxes |
23,548 | |||||||||||||||
| Provision for income taxes |
(28,427 | ) | I | |||||||||||||
|
|
|
|
|
|
|
|||||||||||
| Net income from continuing operations |
$ | 51,975 | $ | |||||||||||||
|
|
|
|
|
|
|
|||||||||||
| Income from continuing operations per share attributable to common stockholders |
$ | 4.12 | J | |||||||||||||
| Basic |
||||||||||||||||
| Diluted |
$ | 3.94 | J | $ | ||||||||||||
|
|
|
|
|
|
|
|||||||||||
| Weighted-average number of common shares outstanding: |
||||||||||||||||
| Basic |
12,627 | J | ||||||||||||||
| Diluted |
13,181 | J | ||||||||||||||
56
Table of Contents
BJ’S WHOLESALE CLUB HOLDINGS, INC.
NOTES TO UNAUDITED PRO FORMA CONSOLIDATED FINANCIAL STATEMENTS
(Amounts in thousands, except per share amounts)
1. Description of Transactions
We intend to issue and sell shares of our common stock in this offering at an assumed initial public offering price of $ per share, the midpoint of the price range set forth on the cover of this prospectus. Our net proceeds from this offering will be net of underwriting discounts and estimated offering expenses payable by us. Upon consummation of this offering, we intend to use the net proceeds from our initial public offering together with cash and borrowings under the ABL Facility to repay approximately $ million of indebtedness plus $ million of accrued and unpaid interest and prepayment premium under the Second Lien Facility. In addition, upon consummation of this offering, our contingently redeemable common stock will be reclassified to stockholders’ equity resulting from the automatic termination of the non-Sponsor stockholders’ put rights and we no longer will have to pay a fee for our management services agreement with our Sponsors.
2. Pro Forma Adjustments
The following pro forma adjustments are included in the Company’s unaudited pro forma consolidated financial statements related to the transactions described above:
Unaudited Pro Forma Consolidated Balance Sheet Adjustments
| (A) | Cash and cash equivalents—An adjustment was recorded to increase cash and cash equivalents by $ to reflect net proceeds from this offering of $ , plus an additional $ reflecting offering expenses that we had already paid in cash as of February 3, 2018. |
An adjustment was recorded to decrease cash and cash equivalents by $ to reflect the repayment of principal, prepayment fees and interest outstanding under our Second Lien Facility upon the consummation of our initial public offering.
| (B) | Other assets—An adjustment was recorded to decrease other assets by $ to reflect the reclassification of deferred offering costs incurred in connection with this offering to stockholders’ equity upon the consummation of this offering. |
| (C) | Accrued expenses and other current liabilities—An adjustment was recorded to decrease accrued expenses and other current liabilities by $ to reflect the payment of accrued interest under our Second Lien Facility upon the consummation of our initial public offering. |
An adjustment was recorded to decrease accrued expenses and other current liabilities by $ to reflect the payment of accrued initial public offering costs upon the consummation of this offering.
| (D) | Current portion of long-term debt and long-term debt—Adjustments were recorded to decrease the current portion of long-term debt and long-term debt by $ and $ , respectively, to reflect the repayment of principal under our Second Lien Facility in connection with the consummation of our initial public offering. |
Adjustments were recorded to increase current portion of our long-term debt by $ to reflect borrowings under our ABL Facility to repay our Second Lien Facility.
57
Table of Contents
BJ’S WHOLESALE CLUB HOLDINGS, INC.
NOTES TO UNAUDITED PRO FORMA CONSOLIDATED FINANCIAL STATEMENTS
(Amounts in thousands, except per share amounts)
| (E) | Contingently redeemable common stock, common stock and additional paid-in capital—Adjustments were recorded to decrease contingently redeemable common stock by $ and increase common stock and additional paid-in capital by $ and $ , respectively, to reflect the conversion of our contingently redeemable common stock to stockholders’ equity resulting from the automatic termination of the non-Sponsor stockholders’ put rights upon consummation of this offering. |
An adjustment was recorded to increase common stock and additional paid-in capital by $ and $ , respectively, for shares issued in this offering.
| (F) | Accumulated deficit—An adjustment was recorded to increase accumulated deficit by $ to reflect the loss on the extinguishment of debt as a result of the repayment of outstanding indebtedness under our Second Lien Facility as described above. |
Unaudited Pro Forma Consolidated Statement of Operations Adjustments
Year Ended February 3, 2018
| (G) | Selling, general and administrative expenses—An adjustment was recorded to eliminate selling, general and administrative expenses of $ related to the fee from our management services agreement with our Sponsors, which will terminate upon the consummation of this offering. |
| (H) | Interest expense—An adjustment of $ was recorded to record interest expense for the fiscal year ended February 3, 2018 related to the borrowings under our ABL Facility, which were used to repay our Second Lien Facility. The ABL Facility bears interest, either on LIBOR plus a range of 150 to 200 basis points based on excess availability, or an alternative base rate calculation based on the higher of prime or the federal funds rate plus 50 basis points, plus a range of 50 to 100 basis points based on excess availability. The Company may elect 1 week or 1, 2, 3, or 6 month LIBOR terms. For the purpose of preparing these unaudited pro forma consolidated financial statements, an interest rate of % was assumed, which reflects the rate in effect as of the date of this offering. A 1/8th percent increase in the LIBOR rate would result in an increase to the above noted interest expense of approximately $ . |
An adjustment of $ was recorded to reduce interest expense for the fiscal year ended February 3, 2018 to reflect the repayment of approximately $ million of indebtedness plus $ million of accrued and unpaid interest and prepayment premium under the Second Lien Facility as if such repayment had occurred on January 29, 2017.
The unaudited pro forma consolidated statements of operations does not include an adjustment of approximately $ to reflect the loss on the extinguishment of debt as a result of the repayment of outstanding indebtedness under our Second Lien Facility, which is one-time in nature and not expected to have a continuing impact on our results of operations.
| (I) | Provision for income taxes—An adjustment of $ was recorded to increase the provision for income taxes for the fiscal year ended February 3, 2018 to reflect the impact of the pro forma adjustments noted above using a blended federal and state statutory tax rate of % . |
| (J) | Weighted average shares outstanding, basic and diluted—The weighted average shares outstanding used to compute basic and diluted net income per share for the fiscal year ended February 3, 2018 have been adjusted to give effect to the issuance of shares issued in this offering whose proceeds will be used to repay outstanding principal under our Second Lien facility, as if such issuances had occurred on January 29, 2017. |
58
Table of Contents
MANAGEMENT’S DISCUSSION AND ANALYSIS OF FINANCIAL CONDITION AND RESULTS OF OPERATIONS
You should read the following discussion and analysis of our financial condition and results of operations together with the “Selected Consolidated Financial Data” and our consolidated financial statements and the related notes and other financial information included elsewhere in this prospectus. Some of the information included in this discussion and analysis or set forth elsewhere in this prospectus, including information with respect to our plans and strategy for our business, includes forward-looking statements that involve risks and uncertainties. You should review the “Cautionary Note Regarding Forward-Looking Statements” and “Risk Factors” sections of this prospectus for a discussion of important factors that could cause actual results to differ materially from the results described in or implied by the forward-looking statements contained in the following discussion and analysis.
We report on the basis of a 52- or 53-week fiscal year, which ends on the Saturday closest to the last day of January. Accordingly, references herein to “fiscal year 2012” relate to the 53 weeks ended February 2, 2013, references herein to “fiscal year 2013” relate to the 52 weeks ended February 1, 2014, references herein to “fiscal year 2014” relate to the 52 weeks ended January 31, 2015, references herein to “fiscal year 2015” relate to the 52 weeks ended January 30, 2016, references herein to “fiscal year 2016” relate to the 52 weeks ended January 28, 2017 and references herein to “fiscal year 2017” relate to the 53 weeks ending February 3, 2018.
Overview
BJ’s Wholesale Club is a leading warehouse club operator on the East Coast of the United States. We deliver significant value to our members, consistently offering 25% or more savings on a representative basket of manufacturer-branded groceries compared to traditional Supermarket Competitors. We provide a curated assortment focused on perishable products, continuously refreshed general merchandise, gas and other ancillary services to deliver a differentiated shopping experience, that is further enhanced by our omnichannel capabilities.
Over the last two years, we have hired Chris Baldwin as President and Chief Executive Officer and have made multiple senior management hires and changes, adding consumer packaged goods, digital and consulting experience to our leadership team. This new leadership team has implemented significant cultural and operational changes to our business, including transforming how we use data to improve member experience, instilling a culture of cost discipline, adopting a more proactive approach to growing our membership base and building an omnichannel offering oriented towards making shopping at BJ’s more convenient. These changes have delivered results rapidly, evidenced by positive and accelerating comparable club sales over the last two quarters and net income growth of over 109% and Adjusted EBITDA growth of 31% in aggregate over the last two fiscal years. We believe that these changes will continue to impact sales, profit margins and free cash flow performance favorably in the future. In fiscal year 2017, we generated total revenues, net income and Adjusted EBITDA of $12.8 billion, $50 million and $534 million, respectively.
Since pioneering the warehouse club model in New England in 1984, we have grown our footprint to 215 large-format, high volume warehouse clubs spanning 16 states. In our core New England markets, which have high population density and generate a disproportionate part of U.S. GDP, we operate almost three times the number of clubs compared to the next largest warehouse club competitor. In addition to shopping in our clubs, members are able to shop when and how they want through our website, bjs.com; our highly-rated mobile app and our integrated Instacart same-day delivery offering.
Our goal is to offer our members significant value and a meaningful return, in savings, on their annual membership fee. We have more than five million members paying annual fees to gain access to savings on groceries, consumables, general merchandise, gas and ancillary services. The annual membership fee for our base Inner Circle® Membership is $55 per year, and our BJ’s Perks Rewards® Membership, which offers additional value-enhancing features, costs $110 annually. We believe that members can save over ten times their $55 Inner
59
Table of Contents
Circle membership fee versus what they would have paid at traditional supermarket competitors when they spend $2,500 or more per year at BJ’s on manufacturer-branded groceries. In addition to providing significant savings on a representative basket of manufacturer-branded groceries, we accept all manufacturer coupons and rebates and also carry our own exclusive brands that enable members to save on price without compromising on quality. Our two private label brands, Wellsley Farms® and Berkley Jensen®, represent over $2 billion in sales, and are the largest brands we sell. Our customers recognize the relevance of our value proposition across economic environments, as demonstrated by over 20 consecutive years of membership fee income growth. Our membership fee income was $259 million for fiscal year 2017, and represents approximately half of our Adjusted EBITDA.
For additional detail regarding these initiatives, see “Business—Our Company.”
Our business is moderately seasonal in nature. Historically, our business has realized a slightly higher portion of net sales, operating income and cash flows from operations in the second and fourth fiscal quarters, attributable primarily to the impact of the summer and year-end holiday season, respectively.
We believe we are well-positioned to fill a niche between other warehouse clubs and grocery retailers, where we can more effectively compete for the weekly shopping trip. We are pursuing a number of strategies designed to continue our growth, including investing in our membership program to grow our member base, improving the member experience to drive sales and margins, investing in technology to improve member convenience and differentiate our online offering, expanding our strategic footprint and continuing to execute on our strong track record of productivity improvements.
Factors Affecting Our Business
Overall economic trends. The overall economic environment and related changes in consumer behavior have a significant impact on our business. In general, positive conditions in the broader economy promote customer spending in our clubs, while economic weakness which generally results in a reduction of customer spending may have a different or more extreme effect on spending at our clubs. Macroeconomic factors that can affect customer spending patterns, and thereby our results of operations, include employment rates, business conditions, changes in the housing market, the availability of credit, interest rates, tax rates and fuel and energy costs. In addition, during periods of low unemployment, we may experience higher labor costs.
Size and loyalty of membership base. The membership model is a critical element of our business. Members drive our results of operations through their membership fee income and their purchases. The majority of members renew within six months following their renewal date. Therefore, our renewal rate is a trailing calculation that captures renewals during the period seven to eighteen months prior to the reporting date. We have grown our membership fee income each year over the past two decades. Our membership fee income totaled $259 million in fiscal year 2017. Our membership renewal rate, a key indicator of membership engagement, satisfaction and loyalty, reached an all-time high of 86% during fiscal year 2017.
Consumer preferences and demand. Our ability to maintain our appeal to existing customers and attract new customers depends on our ability to originate, develop and offer a compelling product assortment responsive to customer preferences. If we misjudge the market for our products, we may be faced with excess inventories for some products and may be required to become more promotional in our selling activities, which would impact our net sales and gross profit.
Infrastructure investment. Our historical operating results reflect the impact of our ongoing investments to support our growth. We have made significant investments in our business that we believe have laid the foundation for continued profitable growth. We believe that strengthening our management team and enhancing our information systems, including our distribution center management and POS systems, will enable us to replicate our profitable club format and provide a differentiated shopping experience. We expect these infrastructure investments to support our successful operating model across our club operations.
60
Table of Contents
Product mix. Changes in our product mix affect our performance. For example, we continue to add private label products to our assortment of product offerings at our clubs, which we generally price lower than the manufacturer branded products of comparable quality that we also offer. Accordingly, a shift in our sales mix in which we sell more units of our private label products and fewer units of our manufacturer branded products would generally have a positive impact on our profit margins but an adverse impact on our overall net sales. Changes in our revenues from gasoline sales may also negatively affect our performance. Since gasoline generates lower profit margins than the remainder of our business, we could expect to see our overall gross profit margin rates decline as sales of gasoline increase.
Effective sourcing and distribution of products. Our net sales and gross profit are affected by our ability to purchase our products in sufficient quantities at competitive prices. While we believe our vendors have adequate capacity to meet our current and anticipated demand, our level of net sales could be adversely affected in the event of constraints in our supply chain, including our inability to procure and stock sufficient quantities of some merchandise in a manner that is able to match market demand from our customers, leading to lost sales.
Gas prices. The market price of gasoline impacts our net sales and comparable club sales, and large fluctuations in the price of gasoline can produce a short term impact on our margins. Retail gasoline prices are driven by daily crude oil and wholesale commodity market changes and are volatile, as they are influenced by factors that include changes in demand and supply of oil and refined products, global geopolitical events, regional market conditions and supply interruptions caused by severe weather conditions. Typically, the change in crude oil prices impacts the purchase price of wholesale petroleum fuel products, which in turn impacts retail gasoline prices at the pump. During times when prices are particularly volatile, differences in pricing and procurement strategies between the Company and its competitors may lead to temporary margin contraction or expansion depending on whether prices are rising or falling, and this impact could affect our overall results for a fiscal quarter.
In addition, the relative level of gasoline prices from period to period can lead to differences in our net sales between those periods. Further, because we generally attempt to maintain a fairly stable gross profit per gallon, this variance in net sales, which may be substantial, may or may not have a significant impact on our operating income.
Fluctuation in quarterly results. Our quarterly results have historically varied depending upon a variety of factors, including our product offerings, promotional events, club openings, weather related events and shifts in the timing of holidays, among other things. As a result of these factors, our working capital requirements and demands on our product distribution and delivery network may fluctuate during the year.
Inflation and deflation trends. Our financial results can be expected to be directly impacted by substantial increases in product costs due to commodity cost increases or general inflation, which could lead to a reduction in our sales as well as greater margin pressure as costs may not be able to be passed on to consumers. To date, changes in commodity prices and general inflation have not materially impacted our business. In response to increasing commodity prices or general inflation, we seek to minimize the impact of such events by sourcing our merchandise from different vendors, changing our product mix or increasing our pricing when necessary.
Refinancings. We expect to use the proceeds of this offering to repay indebtedness under our Second Lien Facility, which will reduce our cost of capital and debt service obligations. For more information, please see “Use of Proceeds.”
53rd week. Our fiscal year 2017 consisted of 53 weeks and our fiscal years 2016 and 2015 each consisted of 52 weeks. Fiscal years in which there are 53 weeks will see increased net sales and expenses from the additional week.
61
Table of Contents
How We Assess the Performance of Our Business
In assessing our performance, we consider a variety of performance and financial measures. The key GAAP measures include net sales, membership fee income, cost of sales and selling, general and administrative expenses. In addition, we also review other important metrics such as Adjusted EBITDA, comparable club sales and comparable club sales excluding gasoline sales.
Net sales
Net sales are derived from direct retail sales to customers in our clubs and online, net of merchandise returns and discounts. Growth in net sales is impacted by opening new clubs and increases in comparable club sales.
Comparable club sales
Comparable club sales, also known as same store sales, is an important measure throughout the retail industry. In determining comparable club sales, we include all clubs that were open for at least 13 months at the beginning of the period and were in operation during all of both periods being compared, including relocated clubs and expansions. There may be variations in the way in which some of our competitors and other retailers calculate comparable or “same club” sales. As a result, data in this prospectus regarding our comparable club sales may not be comparable to similar data made available by other retailers.
Comparable club sales allow us to evaluate how our club base is performing by measuring the change in period-over-period net sales in clubs that have been open for the applicable period. Various factors affect comparable club sales, including consumer preferences and trends, product sourcing, offerings and pricing, customer experience and purchase amounts, weather and holiday shopping period timing and length.
We intend to improve comparable club sales by continuing initiatives aimed at increasing club visits and basket size. Among these initiatives are those aimed at tailoring promotional offerings, improving the convenience of accessing our offering, and allowing our members to complete their shopping more quickly.
Opening new clubs is an important part of our growth strategy. As we continue to pursue our growth strategy, we anticipate that an increasing percentage of our net sales will come from clubs not included in our comparable club sales calculation. Accordingly, comparable club sales are only one measure we use to assess the success of our growth strategy.
Comparable club sales excluding gasoline sales
Comparable club sales excluding gasoline sales is calculated by excluding sales from our gasoline operations from comparable club sales for the applicable period.
Membership fee income
Membership fee income reflects the amount collected from our customers to be a member of our clubs. Membership fee income is recognized in revenue on a straight-line basis over the life of the membership, which is typically twelve months.
Cost of sales
Cost of sales consists primarily of the direct cost of merchandise and gasoline sold at our clubs, including the following:
| • | costs associated with operating our distribution centers, including payroll, payroll benefits, occupancy costs and depreciation; |
62
Table of Contents
| • | freight expenses associated with moving merchandise from vendors to our distribution centers and from our distribution centers to our clubs; and |
| • | vendor allowances, rebates and cash discounts. |
Selling, general and administrative expenses
Selling, general and administrative expenses (“SG&A”) consist of various expenses related to supporting and facilitating the sale of merchandise in our clubs, including the following:
| • | payroll and payroll benefits for club and corporate employees; |
| • | rent, depreciation and other occupancy costs for retail and corporate locations; |
| • | advertising expenses; |
| • | tender costs, including credit and debit card fees; |
| • | amortization of intangible assets; and |
| • | consulting, legal, insurance and other professional services expenses. |
SG&A includes both fixed and variable components and, therefore, is not directly correlated with net sales. In addition, the components of our SG&A expenses may not be comparable to those of other retailers. We expect that our SG&A expenses will increase in future periods due to our continuing club growth and in part due to additional legal, accounting, insurance and other expenses that we expect to incur as a result of being a public company, including compliance with the Sarbanes-Oxley Act. In addition, any increase in future stock option or other stock-based grants or modifications will increase our stock-based compensation expense included in SG&A.
Adjusted EBITDA
Adjusted EBITDA is defined as income from continuing operations before interest expense, net, provision (benefit) for income taxes and depreciation and amortization, adjusted for the impact of certain other items, including compensatory payments related to options, stock-based compensation expense, pre-opening expenses, management fees, noncash rent, strategic consulting expenses, severance, asset retirement obligations and other adjustments. For a reconciliation of Adjusted EBITDA to income from continuing operations, the most directly comparable GAAP measure, see “—Non-GAAP Financial Measures.”
Non-GAAP Financial Measures
Adjusted EBITDA
We present Adjusted EBITDA, which is not a recognized financial measure under GAAP, because we believe it assists investors and analysts in comparing our operating performance across reporting periods on a consistent basis by excluding items that we do not believe are indicative of our core operating performance, such as compensatory payments related to options, stock-based compensation expense, preopening expenses, management fees, noncash rent, strategic consulting, severance, asset retirement obligations and other adjustments. You are encouraged to evaluate these adjustments and the reasons we consider them appropriate for supplemental analysis. In evaluating Adjusted EBITDA, you should be aware that in the future we may incur expenses that are the same as or similar to some of the adjustments in our presentation of Adjusted EBITDA. Our presentation of Adjusted EBITDA should not be construed as an inference that our future results will be unaffected by unusual or non-recurring items. There can be no assurance that we will not modify the presentation of Adjusted EBITDA following this offering, and any such modification may be material. In addition, Adjusted EBITDA may not be comparable to similarly titled measures used by other companies in our industry or across different industries.
63
Table of Contents
Management believes Adjusted EBITDA is helpful in highlighting trends in our core operating performance, while other measures can differ significantly depending on long-term strategic decisions regarding capital structure, the tax jurisdictions in which companies operate and capital investments. We also use Adjusted EBITDA in connection with establishing discretionary annual incentive compensation; to supplement GAAP measures of performance in the evaluation of the effectiveness of our business strategies; to make budgeting decisions; and to compare our performance against that of other peer companies using similar measures. See “Non-GAAP Financial Measures.”
The following is a reconciliation of our income from continuing operations to Adjusted EBITDA for the periods presented:
| Fiscal Year Ended | ||||||||||||
| January 30, 2016 |
January 28, 2017 |
February 3, 2018 |
||||||||||
| (in thousands) | ||||||||||||
| Income from continuing operations |
$ | 24,654 | $ | 44,700 | $ | 51,975 | ||||||
| Interest expense, net |
150,093 | 143,351 | 196,724 | |||||||||
| Provision (benefit) for income taxes |
12,049 | 27,968 | (28,427 | ) | ||||||||
| Depreciation and amortization |
177,483 | 178,325 | 164,061 | |||||||||
| Compensatory payments related to options(1) |
1,497 | 6,143 | 77,953 | |||||||||
| Stock-based compensation expense(2) |
2,265 | 11,828 | 9,102 | |||||||||
| Preopening expenses(3) |
6,458 | 2,749 | 3,004 | |||||||||
| Management fees(4) |
8,139 | 8,053 | 8,038 | |||||||||
| Noncash rent(5) |
8,976 | 7,138 | 5,391 | |||||||||
| Strategic consulting(6) |
14,619 | 26,157 | 30,316 | |||||||||
| Severance(7) |
7,488 | 2,320 | 9,065 | |||||||||
| Asset retirement obligations(8) |
(7,044 | ) | — | — | ||||||||
| Other adjustments(9) |
(685 | ) | (1,406 | ) | 6,305 | |||||||
|
|
|
|
|
|
|
|||||||
| Adjusted EBITDA |
$ | 405,992 | $ | 457,326 | $ | 533,507 | ||||||
|
|
|
|
|
|
|
|||||||
| Adjusted EBITDA as a percentage of net sales |
3.3% | 3.8% | 4.3% | |||||||||
|
|
|
|
|
|
|
|||||||
| (1) | Represents payments to holders of our stock options made pursuant to antidilution provisions in connection with dividends paid to our Sponsors. |
| (2) | Represents non-cash stock-based compensation expense. |
| (3) | Represents direct incremental costs of opening or relocating a facility that are charged to operations as incurred. |
| (4) | Represents management fees paid to our Sponsors (or advisory affiliates thereof) in accordance with our management services agreement, which will terminate on the consummation of this offering. See “Certain Relationships and Related Party Transactions—Management Services Agreement.” |
| (5) | Consists of an adjustment to remove the non-cash portion of rent expense, which has been recorded on a straight-line basis in accordance with GAAP. |
| (6) | Represents fees paid to external consultants for two strategic initiatives of limited duration. |
| (7) | Represents termination costs associated with voluntary and involuntary workforce reductions that occurred in January 2016, incremental severance expense to former executives and voluntary workforce reductions that occurred in February 2018. |
| (8) | Represents non-cash gain related to a change in the estimated removal costs of our tanks and other infrastructure at our gasoline stations that has been accounted for as an asset retirement obligation. |
| (9) | Other non-cash or discrete items as determined by management, including amortization of a deferred gain from sale lease back transactions in 2013, non-cash accretion expense on asset retirement obligations, obligations associated with our post-retirement medical plan and incremental expense to former executives. Fiscal year 2017 includes corporate related transactional costs. |
See “Non-GAAP Financial Measures” for more information on our use of Adjusted EBITDA.
64
Table of Contents
Free cash flow
We present free cash flow, which is not a recognized financial measure under GAAP, because we use it to report to our board of directors and we believe it assists investors and analysts in evaluating our liquidity. Free cash flow should not be considered as an alternative to cash flows from operations as a liquidity measure. We define “free cash flow” as net cash provided by operating activities net of capital expenditure.
The following is a reconciliation of our net cash from operating activities to free cash flow for the periods presented:
| Fiscal Year Ended | ||||||||||||
| January 30, 2016 |
January 28, 2017 |
February 3, 2018 |
||||||||||
| (in thousands) | ||||||||||||
| Net cash from operating activities |
$ | 159,361 | $ | 297,428 | $ | 210,085 | ||||||
| Less: Capital expenditures |
112,363 | 114,756 | 137,466 | |||||||||
|
|
|
|
|
|
|
|||||||
| Free cash flow |
$ | 46,998 | $ | 182,672 | $ | 72,619 | ||||||
|
|
|
|
|
|
|
|||||||
Results of Operations
The following tables summarize key components of our results of operations for the periods indicated:
| Fiscal Year Ended | ||||||||||||
| January 30, 2016 |
January 28, 2017 |
February 3, 2018 |
||||||||||
| Statement of Operations Data (in thousands): |
||||||||||||
| Net sales |
$ | 12,220,215 | $ | 12,095,302 | $ | 12,495,995 | ||||||
| Membership fee income |
247,338 | 255,235 | 258,594 | |||||||||
|
|
|
|
|
|
|
|||||||
| Total revenues |
12,467,553 | 12,350,537 | 12,754,589 | |||||||||
| Cost of sales |
10,476,519 | 10,223,017 | 10,513,492 | |||||||||
| Selling, general and administrative expenses |
1,797,780 | 1,908,752 | 2,017,821 | |||||||||
| Preopening expenses |
6,458 | 2,749 | 3,004 | |||||||||
|
|
|
|
|
|
|
|||||||
| Operating income |
186,796 | 216,019 | 220,272 | |||||||||
| Interest expense, net |
150,093 | 143,351 | 196,724 | |||||||||
|
|
|
|
|
|
|
|||||||
| Income from continuing operations before income taxes |
36,703 | 72,668 | 23,548 | |||||||||
| Provision (benefit) for income taxes |
12,049 | 27,968 | (28,427) | |||||||||
|
|
|
|
|
|
|
|||||||
| Income from continuing operations |
24,654 | 44,700 | 51,975 | |||||||||
| Loss from discontinued operations, net of income taxes |
(550) | (476) | (1,674) | |||||||||
|
|
|
|
|
|
|
|||||||
| Net income |
$ | 24,104 | $ | 44,224 | $ | 50,301 | ||||||
|
|
|
|
|
|
|
|||||||
| Operational Data: |
||||||||||||
| Total clubs at end of period |
213 | 214 | 215 | |||||||||
| Comparable club sales |
(4.2)% | (2.6)% | 0.8% | |||||||||
| Comparable club sales excluding gasoline sales |
(0.5)% | (2.3)% | (0.9)% | |||||||||
| Adjusted EBITDA (in thousands) |
$ | 405,992 | $ | 457,326 | $ | 533,507 | ||||||
| Free cash flow (in thousands) |
46,998 | 182,672 | 72,619 | |||||||||
65
Table of Contents
Fiscal Year Ended February 3, 2018 Compared to Fiscal Year Ended January 28, 2017
Net Sales
Net sales for fiscal year 2017 were $12.5 billion, a 3.3% increase from net sales reported in fiscal year 2016 of $12.1 billion. The increase was due to a 0.8% increase in comparable club sales, incremental sales from two new clubs opened since the beginning of last year and the impact of the 53rd week in fiscal year 2017. Adjusting for the additional week, net sales increased by approximately 1.3% to $12.3 billion from fiscal year 2016 to fiscal year 2017.
Comparable club sales
| Fiscal Year Ended | ||||||||
| January 28, 2017 |
February 3, 2018 |
|||||||
| Comparable club sales |
(2.6 | )% | 0.8 | % | ||||
| Less: contribution from gasoline sales |
(0.3 | )% | 1.7 | % | ||||
|
|
|
|
|
|||||
| Comparable club sales excluding gasoline sales |
(2.3 | )% | (0.9 | )% | ||||
|
|
|
|
|
|||||
Comparable club sales increased 3.4%, to 0.8% in fiscal year 2017 from (2.6)% in fiscal year 2016. The increase in comparable club sales includes a favorable contribution from gasoline sales of 1.7% primarily due to price inflation. The average retail price per gallon increased by approximately 11.5% versus fiscal year 2016. Gallons sold increased by 4.7% over fiscal year 2016.
Merchandise comparable club sales decreased 0.9% in fiscal year 2017 due to a 1.6% decrease in sales of edible grocery and a 0.9% decrease in sales of perishables, partially offset by a 0.8% increase in sales of non-edible groceries and a 2.0% increase in sales of general merchandise. The decline in edible grocery sales was driven by decreased sales of beverages, candy and breakfast foods partially offset by increases in specialty foods and water. The decrease in perishable sales was driven by lower sales of frozen meat and fresh produce, partially offset by increased sales in prepackaged meat and full-service deli. Non-edible grocery sales increased due to better sales of household chemicals, partially offset by lower sales in pet care. Finally, the sales increase in general merchandise was driven by strong sales of apparel and home office supplies, slightly offset by lower sales in electronics.
Membership fee income
Membership fee income was $258.6 million in fiscal year 2017 versus $255.2 million in fiscal year 2016, a 1.3% increase. The growth was driven by a 5.8% increase in membership fee income on a cash basis, an increase in our renewal rate and incremental member acquisition efforts. The increase also reflects one month of our membership fee increase that became effective January 2, 2018.
Cost of sales
Costs of sales was $10.5 billion, or 84.1% of net sales, in fiscal year 2017, compared to $10.2 billion, or 84.5% of net sales, in fiscal year 2016. The decrease of 0.4% was attributable to improved merchandise margins on sales excluding gasoline of approximately 0.6% that was partially offset by an unfavorable margin contribution from higher gasoline sales of approximately 0.2%. The merchandise margin rate increased due to successful assortment optimization and better sales penetration of private label items. Private label penetration increased to 19% in fiscal year 2017 from 18% in fiscal year 2016.
Selling, general and administrative expenses
SG&A expenses were $2.0 billion, or 16.2% of net sales in fiscal year 2017, compared to $1.9 billion, or 15.8% of net sales, in fiscal year 2016. The 0.4% increase was driven primarily by $78.0 million in compensatory
66
Table of Contents
payments to stock option holders pursuant to antidilution provisions in connection with dividends paid to our Sponsors and $9.1 million of severance expense associated with a voluntary reduction in force in February 2018. Excluding these items, SG&A expense as a percent of net sales decreased by approximately 0.3% due primarily to lower credit card related expenses of 0.1% and lower payroll benefits expense of 0.2% due mostly to lower medical and bonus expense.
Total payroll and payroll benefits expense, excluding the compensatory dividend payments and severance expense described above, increased by $23.7 million in fiscal year 2017, compared to fiscal year 2016. Total payroll and payroll benefits represented approximately 43% of total SG&A expense in fiscal year 2017 compared to 45% in fiscal 2016.
Preopening expenses
Preopening expenses were $3.0 million in fiscal year 2017, compared to $2.7 million in fiscal year 2016. Preopening expenses for fiscal year 2017 include charges for one new club, two new gasoline stations and one club relocation that occurred in the first quarter of fiscal year 2018. Preopening expenses for fiscal 2016 includes expenses for one new club and three gasoline stations.
Preopening expenses vary due to the number of club openings and the timing of those openings within the fiscal year. The average capital outlay for a new or relocated club is approximately $4 million which represents the cost of construction and equipment to bring the leased premises to operative. We expect these expenditures to be financed primarily with cash from operations.
Interest expense
Interest expense was $196.7 million in fiscal year 2017, compared to $143.4 million in fiscal year 2016. Interest expense for fiscal year 2017 includes interest of $163.2 million related to debt service on outstanding borrowings, $8.5 million of amortization expense on deferred financing costs and original issue discounts on our outstanding borrowings, $21.1 million of charges related to debt refinancing loss on extinguishment of debt and $3.9 million of other interest charges.
Interest expense for fiscal year 2016 includes interest of $122.2 million related to debt service on outstanding borrowings, $17.1 million of amortization expense on deferred financing costs and original issue discounts on our outstanding borrowings and $4.1 million of other interest charges.
Provision for income taxes
Our effective tax rate during the twelve months ended February 3, 2018 was impacted by the Tax Cuts and Jobs Act (“TCJA”), which was enacted into law on December 22, 2017. The TCJA, among other things, contains significant changes to corporate taxation, including reduction of the corporate tax rate from a top marginal rate of 35% to a flat rate of 21%, effective as of January 1, 2018; limitation of the tax deduction for interest expense; limitation of the deduction for net operating losses to 80% of annual taxable income and elimination of net operating loss carrybacks (though any such tax losses may be carried forward indefinitely); and modifying or repealing many business deductions and credits.
Income tax effects resulting from changes in tax laws are provisional and accounted for by the Company in accordance with the authoritative guidance, which requires that these tax effects be recognized in the period in which the law is enacted and the effects are recorded as a component of provision for income taxes from continuing operations. As a result, the effective tax rate from continuing operations was a benefit of (120.7%) in fiscal year 2017 compared to a rate of 38.5% in fiscal year 2016, primarily driven by a one-time adjustment of $32.1 million for the revaluation of the Company’s net deferred tax liabilities, and other non-recurring items in fiscal year 2017 including a solar tax credit net tax benefit of $3.1 million, and a stock option windfall tax benefit of $1.3 million. Further, our effective tax rate in future periods will be favorably impacted by the lower federal statutory corporate income tax rate of 21%.
67
Table of Contents
Loss from discontinued operations
Loss from discontinued operations (net of income tax benefit) was $1.7 million in fiscal year 2017, compared to $0.5 million in fiscal year 2016. The loss for both periods consists of post-tax accretion expense on lease obligations related to two closed locations. The loss in fiscal year 2017, includes a charge of $2.1 million to the reserve due to a change in our estimated sublease income for the locations.
Fiscal Year Ended January 28, 2017 Compared to Fiscal Year Ended January 30, 2016
Net Sales
Net sales for fiscal year 2016 were $12.1 billion, a 1.0% decrease compared to net sales for fiscal year 2015 of $12.2 billion. The decrease was driven by a decrease in comparable club sales of 2.6%, partially offset by incremental sales from seven new clubs opened since the beginning of fiscal year 2015.
Comparable club sales
| Fiscal Year Ended | ||||||||
| January 30, 2016 |
January 28, 2017 |
|||||||
| Comparable club sales |
(4.2 | )% | (2.6 | )% | ||||
| Less: contribution from gasoline sales |
(3.7 | )% | (0.3 | )% | ||||
|
|
|
|
|
|||||
| Comparable club sales excluding gasoline sales |
(0.5 | )% | (2.3 | )% | ||||
|
|
|
|
|
|||||
The 2.6% decrease in comparable club sales in fiscal year 2016 includes an unfavorable contribution from gasoline sales of 0.3% due to price deflation, offset by an increase in gallons sold by 6.1% over fiscal year 2015. Comparable club sales excluding gasoline sales decreased 2.3% in fiscal year 2016, comprised of decreases in sales of approximately 4% in perishables, 1% in non-edible grocery, 1% in edible grocery and flat sales in general merchandise. Sales results were directly impacted by increased deflation, particularly in the meat and dairy categories. We also experienced indirect pressure from deflation, as it enabled grocery competitors to advertise aggressive pricing in these categories in order to drive traffic. We also took steps during the year that negatively impacted sales in favor of greater profitability, primarily by reducing sales of certain low-margin merchandise items, such as bulk cigarettes, at our clubs and by closing cafes operated in many clubs and replacing them with Dunkin Donuts franchises pursuant to a license agreement. Efforts such as growing our private label penetration had a positive impact on margins and a discrete impact on sales dollars.
Comparable club sales attributable to gasoline remained flat in fiscal year 2016, compared to a decrease of 3.7% in fiscal year 2015, which was primarily to due to lower gasoline prices over the course of the year.
Membership fee income
Membership fee income was $255.2 million in fiscal year 2016 compared to $247.3 million in fiscal year 2015, a 3.2% increase. The growth was driven primarily by an increase in total members due to new club openings and an increase in member renewals.
Cost of sales
Cost of sales was $10.2 billion, or 84.5% of net sales in fiscal year 2016, compared to $10.5 billion, or 85.7% of net sales in fiscal year 2015. The decrease of 1.2% was attributable to improved merchandise margins on sales excluding gasoline of approximately 1.3% that was partially offset by an unfavorable contribution from gasoline margins of approximately 0.1%. The merchandise margin rate increased due to successful assortment optimization and better sales penetration of private label items.
68
Table of Contents
Selling, general and administrative expenses
SG&A expenses were $1.9 billion, or 15.8% of net sales in fiscal year 2016, compared to $1.8 billion, or 14.7% of net sales in fiscal year 2015. The 1.1% increase was driven by higher bonus expense of 0.3% due to the Company exceeding fiscal 2016 bonus targets, higher rent and occupancy costs of 0.2% mainly attributable to new club and gas station openings, increased advertising costs of 0.2%, increased strategic consulting costs of 0.1%, non-recurring credit card related expense of 0.1%, higher stock compensation expense of 0.1% due to a modification of existing awards and the impact of a non-cash gain recorded last year related to a change in estimated asset retirement obligations of 0.1%.
Total payroll and payroll benefits expense increased by $44.5 million in fiscal year 2016, compared to fiscal year 2015 due primarily to increased bonus and stock compensation expense. Total payroll and payroll benefits represented approximately 45% of total SG&A expense in both periods.
Preopening expenses
Preopening expenses were $2.7 million in fiscal year 2016 compared to $6.5 million in fiscal year 2015. Preopening expenses for fiscal year 2016 include expenses for one new club and 3 new gas stations. Preopening expenses for fiscal year 2015 include expenses for six new club openings and seven new gas stations.
Preopening expenses vary due to the number of club openings and the timing of those openings within the fiscal year. The average capital outlay for a new or relocated club is approximately $4 million which represents the cost of construction and equipment to bring the leased premises to operative. We expect these expenditures primarily to be financed with cash from operations.
Interest expense
Interest expense was $143.4 million in fiscal year 2016 compared to $150.1 million in fiscal year 2015. Interest expense for fiscal year 2016 included interest of $122.2 million related to debt service on outstanding borrowings, $17.1 million of amortization expense on the deferred financing costs and original issue discounts on our outstanding borrowings and $4.1 million of other interest charges.
Interest expense for fiscal year 2015 included interest of $127.3 million related to debt service on outstanding borrowings, $16.8 million of amortization expense on the deferred financing costs and original issue discounts on our outstanding borrowings and $6.0 million of other interest charges.
Provision for income taxes
Our effective tax rate from continuing operations was 38.5% in fiscal year 2016 compared to 32.8% in fiscal year 2015. The increase in our effective income tax rate was due primarily to the increase in our pre-tax income and a decrease in discrete tax benefits associated with the reversal of liabilities for uncertain tax positions resulting from the expiration of statutes of limitations.
Loss from discontinued operations
Loss from discontinued operations (net of income tax benefit) was $0.5 million in fiscal year 2016 compared to $0.6 million in fiscal year 2015. The loss for both periods consists of post-tax accretion expense on lease obligations related to two closed locations.
Seasonality
Our business is moderately seasonal in nature. Historically, our business has realized a slightly higher portion of net sales, operating income and cash flows from operations in the second and fourth fiscal quarters,
69
Table of Contents
attributable primarily to the impact of the summer and year-end holiday season, respectively. Our quarterly results have been and will continue to be affected by the timing of new club openings and their associated pre-opening costs. As a result of these factors, our financial results for any single quarter or for periods of less than a year are not necessarily indicative of the results that may be achieved for a full fiscal year.
Quarterly Results of Operations
The following table sets forth certain financial and operating information for each quarter during fiscal years 2016 and 2017. The quarterly information includes all adjustments (consisting of normal recurring adjustments) that, in the opinion of management, are necessary for a fair presentation of the information presented. This information should be read in conjunction with the consolidated financial statements and related notes thereto included elsewhere in this prospectus. Operating results for interim periods are not necessarily indicative of the results that may be expected for a full fiscal year.
| Fiscal Year 2016 | Fiscal Year 2017 | |||||||||||||||||||||||||||||||
| (in thousands) | (in thousands) | |||||||||||||||||||||||||||||||
| First Quarter |
Second Quarter |
Third Quarter |
Fourth Quarter |
First Quarter |
Second Quarter |
Third Quarter |
Fourth Quarter |
|||||||||||||||||||||||||
| Net sales |
$ | 2,929,287 | $ | 3,077,141 | $ | 2,922,385 | $ | 3,166,489 | $ | 2,883,298 | $ | 3,103,335 | $ | 3,019,389 | $ | 3,489,973 | ||||||||||||||||
| Membership fees |
63,765 | 64,335 | 63,810 | 63,325 | 63,530 | 64,192 | 64,856 | 66,016 | ||||||||||||||||||||||||
|
|
|
|
|
|
|
|
|
|
|
|
|
|
|
|
|
|||||||||||||||||
| Total revenues |
2,993,052 | 3,141,476 | 2,986,195 | 3,229,814 | 2,946,828 | 3,167,527 | 3,084,245 | 3,555,989 | ||||||||||||||||||||||||
| Cost of sales |
2,488,855 | 2,596,291 | 2,456,204 | 2,681,667 | 2,441,306 | 2,620,805 | 2,523,297 | 2,928,084 | ||||||||||||||||||||||||
| Selling, general and administrative expenses |
475,622 | 472,729 | 475,483 | 484,918 | 532,499 | 470,715 | 480,285 | 534,322 | ||||||||||||||||||||||||
| Preopening expenses |
333 | 607 | 1,455 | 354 | 807 | 1,226 | 123 | 848 | ||||||||||||||||||||||||
|
|
|
|
|
|
|
|
|
|
|
|
|
|
|
|
|
|||||||||||||||||
| Operating income (loss) |
28,242 | 71,849 | 53,053 | 62,875 | (27,784) | 74,781 | 80,540 | 92,735 | ||||||||||||||||||||||||
| Interest expense, net |
36,632 | 35,880 | 35,484 | 35,355 | 64,070 | 43,820 | 42,321 | 46,513 | ||||||||||||||||||||||||
|
|
|
|
|
|
|
|
|
|
|
|
|
|
|
|
|
|||||||||||||||||
| Income (loss) from continuing operations before income taxes |
(8,390) | 35,969 | 17,569 | 27,520 | (91,854) | 30,961 | 38,219 | 46,222 | ||||||||||||||||||||||||
| Provision (benefit) for income taxes |
(3,293) | 14,118 | 6,317 | 10,826 | (33,067) | 11,146 | 15,346 | (21,852) | ||||||||||||||||||||||||
|
|
|
|
|
|
|
|
|
|
|
|
|
|
|
|
|
|||||||||||||||||
| Income (loss) from continuing operations |
(5,097) | 21,851 | 11,252 | 16,694 | (58,787) | 19,815 | 22,873 | 68,074 | ||||||||||||||||||||||||
| Loss from discontinued operations, net of income taxes |
(123) | (122) | (117) | (114) | (107) | (103) | (98) | (1,366) | ||||||||||||||||||||||||
|
|
|
|
|
|
|
|
|
|
|
|
|
|
|
|
|
|||||||||||||||||
| Net income (loss) |
$ | (5,220) | $ | 21,729 | $ | 11,135 | $ | 16,580 | $ | (58,894) | $ | 19,712 | $ | 22,775 | $ | 66,708 | ||||||||||||||||
|
|
|
|
|
|
|
|
|
|
|
|
|
|
|
|
|
|||||||||||||||||
| Operational data: |
||||||||||||||||||||||||||||||||
| Total clubs at end of period |
213 | 213 | 213 | 214 | 214 | 215 | 215 | 215 | ||||||||||||||||||||||||
| Comparable club sales |
(1.3)% | (3.2)% | (4.0)% | (1.9)% | (2.0)% | 0.1% | 2.8% | 2.2% | ||||||||||||||||||||||||
| Comparable club sales excluding gasoline sales |
0.5% | (1.7)% | (3.9)% | (3.6)% | (4.5)% | (0.9)% | 0.4% | 1.2% | ||||||||||||||||||||||||
| Adjusted EBITDA (in thousands) |
$ | 86,815 | $ | 129,109 | $ | 113,752 | $ | 127,650 | $ | 98,684 | $ | 135,741 | $ | 141,084 | $ | 157,998 | ||||||||||||||||
| Free cash flow (in thousands) |
21,230 | 57,691 | 23,697 | 80,054 | (89,581) | 97,298 | 6,520 | 58,382 | ||||||||||||||||||||||||
70
Table of Contents
The following is a reconciliation of our income from continuing operations to Adjusted EBITDA for the periods presented:
| Fiscal Year 2016 | Fiscal Year 2017 | |||||||||||||||||||||||||||||||
| (in thousands) | (in thousands) | |||||||||||||||||||||||||||||||
| First Quarter |
Second Quarter |
Third Quarter |
Fourth Quarter |
First Quarter |
Second Quarter |
Third Quarter |
Fourth Quarter |
|||||||||||||||||||||||||
| Income (loss) from continuing operations |
$ | (5,097 | ) | $ | 21,851 | $ | 11,252 | $ | 16,694 | $ | (58,787 | ) | $ | 19,815 | $ | 22,873 | $ | 68,074 | ||||||||||||||
| Interest expense, net |
36,632 | 35,880 | 35,484 | 35,355 | 64,070 | 43,820 | 42,321 | 46,513 | ||||||||||||||||||||||||
| Provision (benefit) for income taxes |
(3,293 | ) | 14,118 | 6,317 | 10,826 | (33,067 | ) | 11,146 | 15,346 | (21,852 | ) | |||||||||||||||||||||
| Depreciation and amortization |
45,223 | 45,681 | 45,329 | 42,092 | 41,071 | 41,216 | 41,117 | 40,657 | ||||||||||||||||||||||||
| Compensatory payments related to options (a) |
746 | 1,489 | 1,886 | 2,022 | 71,574 | 2,126 | 4,253 | — | ||||||||||||||||||||||||
| Stock-based compensation expense (b) |
1,300 | 2,632 | 2,930 | 4,966 | 3,661 | 2,078 | 1,909 | 1,454 | ||||||||||||||||||||||||
| Preopening expenses (c) |
333 | 607 | 1,455 | 354 | 807 | 1,226 | 123 | 848 | ||||||||||||||||||||||||
| Management fees (d) |
2,001 | 2,000 | 2,015 | 2,037 | 2,051 | 2,017 | 2,005 | 1,965 | ||||||||||||||||||||||||
| Noncash rent (e) |
1,873 | 1,849 | 1,782 | 1,634 | 1,497 | 1,500 | 1,384 | 1,010 | ||||||||||||||||||||||||
| Strategic consulting (f) |
7,194 | 3,696 | 5,800 | 9,467 | 6,121 | 10,833 | 7,448 | 5,914 | ||||||||||||||||||||||||
| Severance (g) |
— | — | — | 2,320 | — | — | — | 9,065 | ||||||||||||||||||||||||
| Other adjustments (h) |
(97 | ) | (694 | ) | (498 | ) | (117 | ) | (314 | ) | (36 | ) | 2,305 | 4,350 | ||||||||||||||||||
|
|
|
|
|
|
|
|
|
|
|
|
|
|
|
|
|
|||||||||||||||||
| Adjusted EBITDA |
$ | 86,815 | $ | 129,109 | $ | 113,752 | $ | 127,650 | $ | 98,684 | $ | 135,741 | $ | 141,084 | $ | 157,998 | ||||||||||||||||
|
|
|
|
|
|
|
|
|
|
|
|
|
|
|
|
|
|||||||||||||||||
| (a) | Represents payments to holders of our stock options made pursuant to antidilution provisions in connection with dividends paid to our Sponsors. |
| (b) | Represents non-cash stock-based compensation expense. |
| (c) | Represents direct incremental costs of opening or relocating a facility that are charged to operations as incurred. |
| (d) | Represents management fees paid to our Sponsors (or advisory affiliates thereof) in accordance with our management services agreement, which will terminate on the consummation of this offering. See “Certain Relationships and Related Party Transactions—Management Services Agreement.” |
| (e) | Consists of an adjustment to remove the non-cash portion of rent expense, which has been recorded on a straight-line basis in accordance with GAAP. |
| (f) | Represents fees paid to external consultants for two strategic initiatives of limited duration. |
| (g) | Represents termination costs associated with voluntary and involuntary workforce reductions that occurred in January 2016 and incremental severance expense to former executives and voluntary workforce reductions that occurred in February 2018. |
| (h) | Other non-cash or discrete items as determined by management, including amortization of a deferred gain from sale lease back transactions in 2013, non-cash accretion expense on asset retirement obligations, obligations associated with our post-retirement medical plan and incremental expense to former executives. Fiscal year 2017 includes corporate related transaction costs. |
See “Non-GAAP Financial Measures” for more information on our use of Adjusted EBITDA.
The following is a reconciliation of our net cash from operating activities to free cash flow for the periods presented:
| Fiscal Year 2016 | Fiscal Year 2017 | |||||||||||||||||||||||||||||||
| (in thousands) | (in thousands) | |||||||||||||||||||||||||||||||
| First Quarter |
Second Quarter |
Third Quarter |
Fourth Quarter |
First Quarter |
Second Quarter |
Third Quarter |
Fourth Quarter |
|||||||||||||||||||||||||
| Net cash from operating activities |
$ | 43,668 | $ | 84,209 | $ | 66,413 | $ | 103,138 | $ | (65,148 | ) | $ | 119,118 | $ | 46,389 | $ | 109,726 | |||||||||||||||
| Less: Capital expenditures |
22,438 | 26,518 | 42,716 | 23,084 | 24,433 | 21,820 | 39,869 | 51,344 | ||||||||||||||||||||||||
| Free cash flow |
$ | 21,230 | $ | 57,691 | $ | 23,697 | $ | 80,054 | $ | (89,581 | ) | $ | 97,298 | $ | 6,520 | $ | 58,382 | |||||||||||||||
|
|
|
|
|
|
|
|
|
|
|
|
|
|
|
|
|
|||||||||||||||||
71
Table of Contents
Liquidity and Capital Resources
Our primary sources of liquidity are cash flows generated from club operations and borrowings from our ABL Credit Facility. Cash and cash equivalents totaled $35.0 million as of February 3, 2018. We believe that our current resources, together with anticipated cash flows from operations and borrowing capacity under our ABL Credit Facility will be sufficient to finance our operations, meet our current debt obligations, and fund anticipated capital expenditures.
Summary of Cash Flows
A summary of our cash flows from operating, investing and financing activities is presented in the following table:
| Fiscal Year Ended | ||||||||||||
| January 30, 2016 |
January 28, 2017 |
February 3, 2018 |
||||||||||
| (in thousands) | ||||||||||||
| Net cash provided by operating activities |
$ | 159,361 | $ | 297,428 | $ | 210,085 | ||||||
| Net cash (used in) investing activities |
(112,363 | ) | (114,756 | ) | (137,466 | ) | ||||||
| Net cash (used in) financing activities |
(46,236 | ) | (188,118 | ) | (69,629 | ) | ||||||
|
|
|
|
|
|
|
|||||||
| Net increase (decrease) in cash and cash equivalents |
$ | 762 | $ | (5,446 | ) | $ | 2,990 | |||||
|
|
|
|
|
|
|
|||||||
Net Cash from Operating Activities
Net cash provided by operating activities was $210.1 million in fiscal year 2017, compared to $297.4 million in fiscal year 2016. The decrease in operating cash flow was primarily due to non-recurring costs of $88.2 million related to the dividend transaction in February 2017, including the compensatory payments related to stock options and debt issuance costs that could not be deferred. Excluding those items, operating cash flow increased by $0.9 million in fiscal year 2017.
Average inventory per club decreased 1.7% from fiscal year 2016 due to strong fourth quarter sales results and improved inventory turns in fiscal year 2017.
Net cash provided by operating activities was $297.4 million in fiscal year 2016 versus $159.4 million in fiscal year 2015. The increase in operating cash flow was due to increased operating income from improved margin rates and increased membership fee income and a favorable change in working capital due to improved inventory levels and quicker collections of accounts receivable.
Average inventory per club decreased 3.3% from 2015. We focused on maintaining optimal inventory levels throughout 2016 by better managing presentation levels and reordering quantities as well as taking markdowns where it made sense to move unproductive merchandise.
Net Cash from Investing Activities
Cash used for capital expenditures was $137.5 million in fiscal year 2017, compared to $114.8 million in fiscal year 2016. The increase is due to more investment in club renovations and IT projects.
Net cash used in investing activities was $114.8 million in fiscal year 2016 versus $112.4 million in fiscal year 2015. The increase is due mainly to more investment in club renovations compared to the prior year.
72
Table of Contents
Net Cash from Financing Activities
Cash used in financing activities in fiscal year 2017 was $69.6 million and includes net borrowings of $162.0 million on the ABL Credit Facility and net borrowings of $533.1 million on the First and Second Lien Term Loans, partially offset by dividend payments of $735.5 million and debt issuance costs of $24.6 million.
Cash used in financing activities in fiscal year 2016 was $188.1 million and includes $44.7 million of principal payments on the First Lien Term Loan, $20.5 million of principal payments on the Second Lien Term Loan and net payments of $121.0 million on the Prior ABL Credit Facility.
Cash used in financing activities in fiscal year 2015 was $46.2 million and includes $15.0 million of principal payments on the Prior First Lien Term Loan and $1.8 million of net payments on the Prior Second Lien Term Loan and net payments of $30.0 million on the Prior ABL Credit Facility.
Financing Obligations
On February 3, 2017, we entered into a senior secured asset based revolving credit and term facility (the “ABL Facility”). On February 3, 2017, we entered into a senior secured first lien term loan facility (the “First Lien Facility”) and a senior secured second lien term loan facility (the “Second Lien Facility” and, together with the First Lien Facility, the “Term Loan Facilities”). We entered into the ABL Facility and Term Loan Facilities in part to amend our Prior ABL Facility and refinance our Prior Term Loan Facilities. We describe our ABL Facility and Term Loan Facilities in greater detail under “Description of Certain Indebtedness.”
Special Dividend and Facilities Refinancing
On February 3, 2017, we distributed a $735.5 million dividend to our stockholders, including funds affiliated with the Sponsors. In conjunction with the dividend, we paid $67.5 million to stock option holders as required under the related option agreements. The payments to option holders were recorded as compensation expense in SG&A in 2017. We also paid $5.4 million to employees under retention bonus arrangements, of which $4.6 million was accrued in 2016 and the remaining $0.8 million was recognized as compensation expense in 2017. We financed these transactions by refinancing our Prior ABL Facility and Prior Term Loan Facilities with the ABL Facility and Term Loan Facilities and borrowing additional amounts under the new facilities.
In order to fund these payments, we executed the following transactions immediately prior to the payment of the dividend:
| • | Refinanced and upsized the First Lien Term Loan to $1,925.0 million, subject to an original issue discount of $4.8 million. The First Lien Term Loan now matures on February 3, 2024. |
| • | Refinanced and upsized the Second Lien Term Loan to $625.0, subject to an original issue discount of $6.3 million. The Second Lien Term Loan now matures on February 3, 2025. |
| • | Amended the ABL Facility and borrowed $340.0 million. The maturity date on the ABL Facility was extended to February 3, 2022. |
73
Table of Contents
Contractual Obligations
We enter into long-term obligations and commitments in the normal course of business, primarily debt obligations and non-cancelable operating leases. As of February 3, 2018, our contractual cash obligations over the next several periods were as follows (in thousands):
| Total | 2018 | 2019 to 2020 |
2021 to 2022 |
2023 and thereafter |
||||||||||||||||
| Long term debt |
$ | 2,752,563 | $ | 219,750 | $ | 38,500 | $ | 88,500 | $ | 2,405,813 | ||||||||||
| Operating leases |
3,425,408 | 302,622 | 596,029 | 548,619 | 1,978,138 | |||||||||||||||
| Capital and financing leases |
63,168 | 4,791 | 9,317 | 9,727 | 39,333 | |||||||||||||||
| Closed store lease obligations |
12,686 | 2,122 | 4,266 | 4,298 | 2,000 | |||||||||||||||
| Purchase obligations(1) |
635,937 | 608,375 | 21,266 | 6,296 | — | |||||||||||||||
| Other long term liabilities(2) |
91,738 | 733 | 19,606 | 19,525 | 51,874 | |||||||||||||||
|
|
|
|
|
|
|
|
|
|
|
|||||||||||
| Total |
$ | 6,981,500 | $ | 1,138,393 | $ | 688,984 | $ | 676,965 | $ | 4,477,158 | ||||||||||
|
|
|
|
|
|
|
|
|
|
|
|||||||||||
| (1) | Includes the Company’s significant contractual unconditional purchase obligations. For cancelable agreements, any penalty due upon cancellation is included. These commitments do not exceed the Company’s projected requirements and are in the normal course of business. Examples include firm commitments for merchandise purchase orders, gasoline and IT. |
| (2) | Other long-term liabilities include long-term obligations recorded on the Company’s combined balance sheet as of February 3, 2018 that are not presented separately within the table above. They include the fair value of contingent payment liabilities associated with post-retirement medical benefits, worker’s compensation, general insurance, and gas station disposals. |
Off-Balance Sheet Arrangements
We have not entered into off-balance sheet arrangements. We do enter into operating lease commitments, letters of credit and purchase obligations in the normal course of our operations.
Critical Accounting Policies and Use of Estimates
The preparation of our financial statements in conformity with accounting principles generally accepted in the United States requires management to make estimates and assumptions that affect the reported amounts of assets and liabilities and the disclosure of contingent liabilities at the date of the financial statements and the reported amounts of revenues and expenses during the reporting period. We review our estimates on an ongoing basis and make judgments about the carrying value of assets and liabilities based on a number of factors. These factors include historical experience and assumptions made by management that are believed to be reasonable under the circumstances. Although management believes the judgment applied in preparing estimates is reasonable based on circumstances and information known at the time, actual results could vary materially from estimates based on assumptions used in the preparation of our consolidated financial statements. This section summarizes critical accounting policies and the related judgments involved in their application.
The most significant accounting estimates involve a high degree of judgment or complexity. Management believes the estimates and judgments most critical to the preparation of our consolidated financial statements and to the understanding of our reported financial results include those made in connection with revenue recognition, estimating vendor rebates and allowances; estimating the value of inventory; impairment assessments for goodwill and other indefinite-lived intangible assets, and long-lived assets; self-insurance reserves and estimating equity-based compensation expense. Our significant accounting policies related to these accounts in the preparation of our consolidated financial statements are described below. See Note 2 to our audited consolidated financial statements presented elsewhere in this prospectus for additional information regarding our critical accounting policies.
74
Table of Contents
Revenue Recognition
We recognize revenue from the sale of merchandise, net of estimated returns, at the time of purchase by the customer in the club. In the limited instances when the customer is not able to take delivery at the point of sale, revenue from the sale of merchandise is not recognized until title and risk of loss pass to the customer. For sales of merchandise on our website, revenue is also recognized when title and risk of loss pass to the customer, which is normally at the time the merchandise is received by the customer.
Sales incentives redeemable only at BJ’s, such as coupons and instant rebates, are recorded as a reduction of net sales. Membership fee revenue is recognized on a straight-line basis over the life of the membership, which is typically twelve months. Consideration from manufacturers’ incentives (such as rebates or coupons) is recorded gross in net sales when the incentive is generic and can be tendered by a consumer at any reseller and the Company receives direct reimbursement from the manufacturer, or clearinghouse authorized by the manufacturer, based on the face value of the incentive. If these conditions are not met, such consideration is recorded as a decrease in cost of sales.
The Company’s BJ’s Perks Rewards® members earn 2% cash back, up to a maximum of $500 per year, on all qualified purchases made at BJ’s. The Company’s My BJ’s Perks Mastercard holders earn 3% or 5% cash back on all qualified purchases made at BJ’s and 1% to 2% cash back on purchases made with the card outside of BJ’s. Cash back is in the form of electronic awards issued in $20 increments that may be used in-club at the register and expire six months from the date of issuance. Cash back may be requested in the form of a check before awards expire. The Company accounts for the Awards as a reduction in net sales, with the related liability being classified within other current liabilities.
BJ’s gift cards are available for purchase at all of our clubs. We do not charge administrative fees on unused gift cards, and gift cards do not have an expiration date. Revenue from gift card sales is recognized upon redemption of the gift card. We record revenue from gift card breakage when the likelihood of the gift card being redeemed is remote and we do not have a legal obligation to escheat the value of unredeemed gift cards to the relevant jurisdictions.
In the ordinary course of business, sales taxes are collected on items purchased by the members that are taxable in the jurisdictions when the purchases take place. These taxes are then remitted to the appropriate taxing authority. These taxes collected are excluded from revenues in the financial statements.
Vendor Rebates and Allowances
We receive various types of cash consideration from vendors, principally in the form of rebates and allowances that typically do not exceed a one-year time period. We recognize such vendor rebates and allowances as a reduction of cost of sales based on a systematic and rational allocation of the cash consideration offered to the underlying transaction that results in progress by BJ’s toward earning the rebates and allowances, provided the amounts to be earned are probable and reasonably estimable. Otherwise, rebates and allowances are recognized only when predetermined milestones are met. We review the status of all rebates and allowances at least once per quarter and update our estimates, if necessary, at that time. We believe that our review process has allowed us to avoid material adjustments in estimates of vendor rebates and allowances.
Inventory
Merchandise inventories are stated at the lower of cost, determined under the average cost method, or net realizable value. We recognize the write-down of slow-moving or obsolete inventory in cost of sales when such write-downs are probable and estimable. Records are maintained at the stock keeping unit (“SKU”) level. We utilize various reports that allow our merchandising staff to make timely markdown decisions to ensure rapid inventory turnover, which is essential in our business. The carrying value of any SKU whose selling price is marked down to below cost is immediately reduced to that selling price.
75
Table of Contents
We take physical inventories of merchandise on a cycle basis at every location at least once every 18 months, relying on our weekly cycle counting programs in the intervening periods. A physical inventory is taken at the end of the year at selected locations that don’t meet our targeted accuracy rates or are experiencing unusual shrink activity. We write down inventory for estimated shrinkage for the period between physical inventories. This estimate is based on historical results of previous physical inventories, shrinkage trends or other judgments management believes to be reasonable under the circumstances. We have not had material adjustments between our estimated shrinkage percentages and actual results.
Impairment of Goodwill, Indefinite-Lived and Long-Lived Assets
Goodwill
We evaluate goodwill annually to determine whether it is impaired. Goodwill is also tested more frequently if an event occurs or circumstances change that would indicate that the fair value of a reporting unit is less than its carrying amount. We have identified one reporting unit and selected the fourth fiscal quarter to perform our annual goodwill impairment testing. Goodwill impairment guidance provides entities an option to perform a qualitative assessment (commonly known as “step zero”) to determine whether further impairment testing is necessary before performing the two-step test. The qualitative assessment requires significant judgments by management about economic conditions including the entity’s operating environment, its industry and other market considerations, entity-specific events related to financial performance or loss of key personnel and other events that could impact the reporting unit. If management concludes, based on assessment of relevant events, facts and circumstances, that it is more likely than not that a reporting unit’s fair value is greater than its carrying value, no further impairment testing is required.
If management’s assessment of qualitative factors indicates that it is more likely than not that the fair value of a reporting unit is less than its carrying value, then a two-step quantitative assessment is performed. We also have the option to bypass the qualitative assessment described above and proceed directly to the two-step quantitative assessment. In the first step, we compare the fair value of the reporting unit to its carrying value. If the fair value of the reporting unit exceeds the carrying value of the net assets assigned to that unit, goodwill is considered not impaired and we are not required to perform further testing. If the carrying value of the net assets assigned to the reporting unit exceeds the fair value of the reporting unit, then we must perform the second step of the impairment test in order to determine the implied fair value of the reporting unit’s goodwill. If the carrying value of a reporting unit’s goodwill exceeds its implied fair value, then we would record an impairment loss equal to the difference.
To assess for impairment, we performed a step-zero test for the years ended January 28, 2017 and February 3, 2018. Our tests for impairment of goodwill resulted in a determination that the fair value of the reporting unit exceeded the carrying value of our net assets and no impairment was recorded in the years ended January 28, 2017 and February 3, 2018. The Company does not believe our reporting unit is considered at risk of failing the impairment test as the fair value of the reporting unit significantly exceeded the carrying value of the reporting unit. We do not anticipate any material impairment charges in the near term.
Indefinite-Lived Intangible Assets
We consider the BJ’s trade name to be an indefinite-lived intangible asset, as we currently anticipate that this trade name will contribute cash flows to us indefinitely. We evaluate whether the trade name continues to have an indefinite life on an annual basis. Our trade name is reviewed for impairment annually in the fourth fiscal quarter and may be reviewed more frequently if indicators of impairment are present. If the recorded carrying value of the intangible asset exceeds its estimated fair value, we record a charge to write the intangible asset down to its estimated fair value. Calculating the fair value requires significant judgment. We determine the fair value of our trade name using the relief from royalty method, a variation of the income approach. The use of different assumptions, estimates or judgments, such as the estimated future cash flows, the discount rate used to discount such cash flows or the estimated royalty rate, could significantly increase or decrease the estimated fair value of the intangible.
76
Table of Contents
We assessed the recoverability of the BJ’s trade name and determined that its estimated fair value exceeded its carrying value and that no impairment was recorded in the years ended January 28, 2017 and February 3, 2018.
Long-Lived Assets
We review the realizability of our long-lived assets at the lowest level for which identifiable cash flows are present, our club level, periodically and whenever events or changes in circumstances indicate that their carrying amounts may not be recoverable. We monitor our club portfolio to identify clubs that are underperforming. When we identify an underperforming club, we perform a review to reassess the future cash flows of the club. Current and expected operating results and cash flows and other factors are considered in connection with our reviews. Significant judgments are made in projecting future cash flows and are based on a number of factors, including the maturity level of the club, historical experience of clubs with similar characteristics, recent sales, margin and other trends and general economic assumptions. Our estimates of future cash flows are based on our experience, knowledge and judgments. These estimates can be affected by factors that are difficult to predict including future revenue, operating results and economic conditions. While we believe our estimates are reasonable, different assumptions regarding future cash flows could affect our analysis and result in future impairment. Impairment losses are measured and recorded as the difference between the carrying amount and the fair value of the assets. No impairment charges were recorded in the years ended January 28, 2017 and February 3, 2018.
Self-Insurance Reserves
We are primarily self-insured for workers’ compensation, general liability claims and medical claims. Reported reserves for these claims are derived from estimated ultimate costs based upon individual claim file reserves and estimates for incurred but not reported claims. Estimates are based on historical claims experience and other actuarial assumptions believed to be reasonable under the circumstances.
Income Taxes
We pay income taxes to federal, state and municipal taxing authorities. We are subject to audit by these jurisdictions and maintain reserves for those uncertain tax positions which we believe may be subject to challenge. Our reserves are based on our estimate of the likely outcome of these audits, and are revised periodically based on changes in tax law and court cases involving taxpayers with similar circumstances.
We recognize the financial statement impact for uncertain income tax positions based on a two-step process. We recognize the financial statement impact of a tax position when it is more likely than not that the position will be sustained upon examination. If the tax position meets the more-likely-than-not recognition threshold, the tax effect is recognized at the largest amount of the benefit that is greater than fifty percent likely of being realized upon ultimate settlement. Although we believe that we have adequately reserved for our uncertain tax positions, we can provide no assurance that the final tax outcome of these matters will not be materially different. In future periods, changes in facts, circumstances and new information may require us to change the recognition and measurement estimates with regard to individual tax positions. Changes in recognition and measurement estimates are recorded in income tax expense and liability in the period in which such changes occur.
Share-Based Compensation
We recognize compensation cost for employee stock options awards based on the estimated fair value of the awards on the grant date. Compensation cost is recognized over the period during which the employee is required to provide service in exchange for the awards, which is typically the vesting period. For awards that contain only a service vesting feature, we use straight-line attribution to recognize the cost of the awards. For awards with a performance condition feature, we recognize compensation cost ratably over the awards’ expected vesting periods when achievement of the performance condition is deemed probable.
77
Table of Contents
We estimate the fair value of our stock option awards using the Black-Scholes option pricing model, which uses as inputs the fair value of our common stock and subjective assumptions we make, including the expected stock price volatility, the expected term of the award, the risk-free interest rate and expected dividends. The riskfree interest rate was based on United States Treasury yields in effect at the time of the grant for notes with terms comparable to the awards. Expected volatility was determined based on the historical and implied volatilities of comparable companies. We use the simplified method to calculate the expected term for options granted to employees. The expected dividend yield is assumed to be zero as we do not have current plans to pay any dividends on common stock.
Determination of Fair Value of Common Stock
As there has been no public market for our common stock to date, the estimated fair value of our common stock has been determined by our board of directors as of the date of each option grant, with input from management, considering our most recently available third-party valuations of common stock and our board of directors’ assessment of additional objective and subjective factors that it believed were relevant and which may have changed from the date of the most recent valuation through the date of the grant. These third-party valuations were performed in accordance with the guidance outlined in the American Institute of Certified Public Accountants’ Accounting and Valuation Guide, Valuation of Privately-Held-Company Equity Securities Issued as Compensation.
In estimating the fair value of our common stock, we estimate the aggregate fair value of the Company and then allocate this aggregate value to our capital structure. In determining the fair value, we used a combination of the income approach and the market approach. Under the income approach, fair value is estimated based on the discounted present value of the cash flows that the business can be expected to generate in the future. The most significant estimates and assumptions inherent in this approach are based on the estimated present value of future net cash flows the business is expected to generate over a forecasted period and an estimate of the present value of cash flows beyond that period, which is referred to as the terminal value. The estimated present value is calculated using a discount rate, which is based on rates of return available from alternative investments of similar type and quality as of the date of value, which accounts for the time value of money and the appropriate degree of risks inherent in the business. Under the market approach, fair value is estimated using the guideline public company method. The guideline public company method uses a peer group of publicly traded companies and considers multiples of financial metrics to derive a range of indicated values. Determination of the peer group is based on factors including, but not limited to, the similarity of their industry, growth rate and stage of development, business model and financial risk. To derive our fair value we sum a 50% weighting of the fair value derived by the income approach and a 50% weighting of the market approach.
The assumptions underlying these valuations represent management’s best estimates, which involve inherent uncertainties and the application of management judgment. As a result, if factors or expected outcomes change and we use significantly different assumptions or estimates, our stock-based compensation expense could be materially different.
Following the completion of this offering, the fair value of our common stock will be determined based on the quoted market price of our common stock.
78
Table of Contents
Grants of Stock-Based Awards
The following table presents the grant dates, number of underlying shares of common stock, the per share purchase prices and exercise prices, the fair values of the underlying common stock as of the grant dates for awards granted between January 29, 2017 and February 3, 2018 along with the fair value per award on the date of grant:
| Grant Date |
Type of Award |
Number of Shares Underlying Awards |
Per Share Exercise or Strike Price |
Fair Value of Common Stock per Share on Grant Date |
Per Share Estimated Fair Value of Awards |
|||||||||||||||
| 2/28/2017 | Option | 16,500 | $ 49.00 | $ | 49.00 | $ | 18.29 | |||||||||||||
| 6/5/2017 | Option | 33,000 | 49.00 | 49.00 | 17.23 | |||||||||||||||
| 6/5/2017 | Option | 500 | 49.00 | 49.00 | 18.12 | |||||||||||||||
Recent Accounting Pronouncements
See Note 2 to our audited financial statements included elsewhere in this prospectus for information regarding recently issued accounting pronouncements.
Quantitative and Qualitative Disclosures about Market Risks
We are exposed to changes in market interest rates and these changes in rates will impact our net interest expense and our cash flow from operations. Substantially all our borrowings carry variable interest rates. An increase in interest rates could have a material impact on our cash flow. As of February 3, 2018, a 100 basis point increase in assumed interest rates for our variable interest credit facilities, before impact of any hedges, would have an annual impact of approximately $24.9 million on interest expense. We had a forward cap arrangement covering $1.0 billion notional of the outstanding principal balance that capped our interest rate exposure through September 29, 2017. We do not have any interest rate swaps or other hedging arrangements to mitigate interest rate.
79
Table of Contents
LETTER FROM OUR CHIEF EXECUTIVE OFFICER AND CHIEF FINANCIAL & ADMINISTRATIVE OFFICER
Dear Potential Shareholders,
On behalf of more than 25,000 team members, we’re thrilled to bring BJ’s Wholesale Club back to the public markets. Our company started in 1984 with one club in Medford, Massachusetts, a largely blue-collar community outside Boston. Today, our company is built on a strong foundation of paid membership, a commitment to delivering value and a strategy that has equipped BJ’s to thrive in the current retail landscape. Yet our company still reflects its humble roots—scrappy and hardworking, proud and productive.
BJ’s Wholesale Club Today
We’ve come a long way since that first club. As of today, BJ’s:
| • | operates 215 clubs and 134 gasoline stations from Maine to Miami, with outstanding locations in 16 states, including the Boston, New York, Philadelphia, Washington and Miami metropolitan areas; |
| • | serves over five million paying members, with more than one million members visiting us over fifty times last year; |
| • | has created a Wellsley Farms® and Berkley Jensen® private label franchise with about $2 billion in sales across a broad range of great products, including our Berkley Jensen toilet tissue, which was recently ranked as #1 by Good Housekeeping; |
| • | is making it more convenient for our members to shop by launching a new app, redesigning bjs.com, offering same-day delivery through our new partnership with Instacart, and offering “Shop BJs.com—Pick Up in-Club” across our chain; |
| • | sold over half a billion eggs, nearly three million bottles of Tide laundry detergent, over 80 million Duracell batteries, 640 million gallons of fuel and enough toilet tissue to reach to the moon and back more than 22 times in fiscal year 2017; and |
| • | has supported our communities through the BJ’s Charitable Foundation, donating millions of dollars and millions of meals to help families thrive by helping to alleviate hunger and improving access to quality education. |
All of our hard work resulted in more than $12.5 billion in net sales and $534 million in Adjusted EBITDA last year. Our success is due to our loyal members and our committed team.
Our Foundation
Members are the foundation of our company, and our team considers it a privilege to serve them every day. We target families in households with an average annual income of approximately $75,000 per year and typically consisting of working parents and children. These households work hard to save money for their families, and we’re proud to play a crucial role in their lives by delivering tremendous value in their everyday shopping.
If members are the foundation, value is the core of our company. Our members expect a return on their membership fee investment, and we give it to them on every trip. BJ’s members consistently save 25% or more on a representative basket of manufacturer branded groceries compared to traditional supermarket competitors. We believe that members who spend $2,500 or more per year at BJ’s on manufacturer-branded groceries can save over ten times their $55 Inner Circle membership fee versus what they would have paid at traditional supermarket competitors. And we’re finding more ways to provide value to our members every day.
80
Table of Contents
Our vibrant fresh food business—produce, meat and deli—is crucial to delivering value. We aim to motivate our members to visit our clubs on a weekly basis. We do this by carrying a broader assortment of fresh foods in smaller pack sizes than our club store competitors. This enables us to meet our members’ weekly shopping needs.
At BJ’s, we extend “freshness” into our general merchandise categories, whether it’s the latest electronics, the newest trend in apparel or exciting seasonal offerings for the holidays. This emphasis on freshness throughout our clubs gives members a reason to shop at BJ’s every week. At the same time, our broad assortment means members don’t have to make a trip to another retailer to meet their weekly needs.
Our Strategy
Our strategy is simple and focused. We work to attract more members, get them shopping and make every trip as convenient as possible.
The most important metric in our business is our membership renewal rate. By deciding whether or not to renew, our members effectively vote each year on whether we delivered on our commitment to provide value for their membership fee. Our renewal rate is 86%, up from 84% two years ago. Nearly half of our Adjusted EBITDA comes from membership fee income (MFI), and the majority of our MFI comes from renewals. The more categories a member shops in our clubs, the more trips they make to BJ’s. The more trips a member makes, the more likely they are to renew.
We continue to engage with our members and to deliver the benefits and value that drive renewal. Our strong membership renewal rate has been the basis of our growth for more than 20 years.
Despite challenges across the retail industry, BJ’s has seen improvements in traffic and basket size. We continue to test and learn new ways to improve performance, and we’re enthusiastic about the opportunities in front of us. Our members expect the unexpected finds—the “treasure hunt,” as they call it—that go along with shopping at BJ’s. We believe we’re well positioned to capitalize on fresh and exciting assortment additions as the retail landscape continues to evolve rapidly.
In recent years, new technologies and evolving consumer behavior have redefined convenience in the U.S. retail industry. At BJ’s, our approach to investing in our business is focused on making it easier for members to access the outstanding value we offer. Members love our recent additions, including more self-checkout lanes; an app that allows members to digitally click coupons rather than clip paper ones; and same-day delivery through Instacart with no mark-up to in-club pricing. We’re also testing a program that lets members scan items on their phone and bypass the traditional checkout line. We’ll continue to add value in the form of convenience as we continue the transformation of BJ’s Wholesale Club.
Our Transformation
Since 2011, Leonard Green and CVC have been great stewards of our company. During their tenure as our sponsors, we have invested over $875 million in our business. We have opened 25 new clubs and spent over $230 million improving our systems and technology. Thanks to their support, BJ’s is a growing company with a full suite of SAP capabilities and a leadership team with the experience to take advantage of it.
We have made substantial progress as we implemented our new strategy. Since 2015, Adjusted EBITDA has grown by 31% and free cash flow has increased by 55%. Our topline performance has improved sequentially in each quarter of the past year, and we expect to build on this progress in the future.
Our Team
Over the past two years, we’ve also made enormous strides in transforming our culture. As a team, we are moving faster and innovating more frequently. We are instilling discipline and accountability across the organization.
81
Table of Contents
Most of our executive team grew up in families like the ones we have the privilege to serve. We understand what saving money means to these families. Being a small piece of those families’ lives means something to all of us. Our executive team is a mix of long-tenured BJ’s team members and relative newcomers. We all share a fundamental belief: the foundation and core of this company are great, and our future is bright.
We are proud of our progress over the past few years, but we all see the potential in our company and know that we have much more to do. We’d love for you to come along on that journey, and we’re excited to have you as a potential shareholder.
82
Table of Contents
Our Company
BJ’s Wholesale Club is a leading warehouse club operator on the East Coast of the United States. We deliver significant value to our members, consistently offering 25% or more savings on a representative basket of manufacturer-branded groceries compared to traditional supermarket competitors. We provide a curated assortment focused on perishable products, continuously refreshed general merchandise, gas and other ancillary services to deliver a differentiated shopping experience that is further enhanced by our omnichannel capabilities.
Over the last two years, we have hired Chris Baldwin as President and Chief Executive Officer and have made multiple senior management hires and changes, adding consumer packaged goods, digital and consulting experience to our leadership team. This new leadership team has implemented significant cultural and operational changes to our business, including transforming how we use data to improve member experience, instilling a culture of cost discipline, adopting a more proactive approach to growing our membership base and building an omnichannel offering oriented towards making shopping at BJ’s more convenient. These changes have delivered results rapidly, evidenced by positive and accelerating comparable club sales over the last two quarters and net income growth of over 109% and Adjusted EBITDA growth of 31% in aggregate over the last two fiscal years. We believe that these changes will continue to impact sales, profit margins and free cash flow performance favorably in the future. In fiscal year 2017, we generated total revenues, net income and Adjusted EBITDA of $12.8 billion, $50 million and $534 million, respectively.
Since pioneering the warehouse club model in New England in 1984, we have grown our footprint to 215 large-format, high volume warehouse clubs spanning 16 states. In our core New England markets, which have high population density and generate a disproportionate part of U.S. GDP, we operate almost three times the number of clubs compared to the next largest warehouse club competitor. In addition to shopping in our clubs, members are able to shop when and how they want through our website, bjs.com; our highly-rated mobile app and our integrated Instacart same-day delivery offering.
Our goal is to offer our members significant value and a meaningful return, in savings, on their annual membership fee. We have more than five million members paying annual fees to gain access to savings on groceries, consumables, general merchandise, gas and ancillary services. The annual membership fee for our base Inner Circle® Membership is $55 per year, and our BJ’s Perks Rewards® Membership, which offers additional value-enhancing features, costs $110 annually. We believe that members can save over ten times their $55 Inner Circle membership fee versus what they would have paid at traditional supermarket competitors when they spend $2,500 or more per year at BJ’s on manufacturer-branded groceries. In addition to providing significant savings on a representative basket of manufacturer-branded groceries, we accept all manufacturer coupons and rebates and also carry our own exclusive brands that enable members to save on price without compromising on quality. Our two private label brands, Wellsley Farms® and Berkley Jensen®, represent over $2 billion in sales, and are the largest brands we sell. Our customers recognize the relevance of our value proposition across economic environments, as demonstrated by over 20 consecutive years of membership fee income growth. Our membership fee income was $259 million for fiscal year 2017, and represents approximately half of our Adjusted EBITDA.
83
Table of Contents
Our approach to merchandising positions us between other warehouse clubs and grocery retailers. We sell a wide range of products, combining the bulk savings of a warehouse club with a broader assortment and selectively smaller pack sizes in perishable and grocery products than our club competitors. We have more stock keeping units (“SKUs”) than other warehouse retailers (around 7,200 versus around 4,500), which allows us to offer a greater selection while still enabling us to manage our inventory more efficiently than supermarket and mass-market competitors (which can carry 40,000 or upwards of 100,000 SKUs, respectively). We also offer a “treasure-hunt” experience with exciting finds in apparel, electronics, home goods and seasonal merchandise, as well as ancillary services such as tire installation, vision care, travel and insurance at attractive values. Our 134 gas stations provide members with additional savings and convenience, which we believe drive more trips and reinforce our strong value proposition. We believe our continuously refreshed assortment, expanded perishable offerings and differentiated value proposition drive strong member loyalty and our warehouse club industry-leading average shopping frequency of 22 trips to BJ’s annually. Our membership renewal rate for members with two or more years of tenure, a key indicator of member satisfaction and loyalty, was at an all-time high of 86% during fiscal year 2017.
Our target members care about value, quality and convenience and shop at warehouse clubs for their family needs. Our target members are a price sensitive demographic with large household sizes, representing nine million households in our trade areas. While we believe that we appeal to households with a wide range of incomes, we target households with an average annual income of approximately $75,000. We believe this group represents a historically underserved demographic in our core markets. Our membership offerings include our core Inner Circle® Membership and three enhanced levels of membership and affiliation through our BJ’s Perks Rewards® Membership and our My BJ’s Perks® Mastercard® offerings, which offer benefits such as cash back on purchases and discounted gasoline prices. These value-added membership tiers and affiliations further consolidate our members’ spend and improve customer loyalty and renewal rates, which ultimately increase the lifetime value of the member. The membership model allows us to capture more comprehensive data about our members, which we proactively use to optimize price, promotion and assortment to evolve with changing consumer demands.
Recent Strategic Initiatives
Led by Chris Baldwin, who became our CEO in February 2016 and Chairman in 2018, we have implemented significant changes to corporate culture and business operations over the last two fiscal years, modernizing the tools we use to compete in a rapidly evolving retail environment, including:
| • | Next Generation Leadership Team and Reinvigorated Culture: Our leadership team is led by Chris Baldwin, who we hired as President and Chief Operating Officer in 2015 and became our Chief Executive Officer in 2016 and Chairman in 2018, and Bob Eddy, who has been our Executive Vice President and Chief Financial Officer since January 2011 and took on the expanded responsibility of Chief Financial and Administrative Officer in February 2018. Our leadership team comprises management talent from diverse disciplines and backgrounds across all aspects of our business. We |
84
Table of Contents
| have newly hired, promoted or added responsibility for all 12 of our executive officers. The diverse backgrounds of our management team reflect experience in retail, consumer packaged goods (CPG), digital, audit and consulting, at leading companies such as Hess, Procter & Gamble, Nabisco, Bain & Company PricewaterhouseCoopers, eBay and Dick’s, among others. The diversity of backgrounds supports various aspects of strategic initiatives across our company. For example, our leadership team’s experience in the CPG industry provides well-informed insight that helps position BJ’s as a key partner with suppliers and drive value for our customers while growing volume and margins. Our new leadership team has instilled a more proactive culture and approach to many facets of corporate decision making, which has rapidly delivered results. |
| • | Relentless Focus on Our Consumer: Our membership program provides us access to comprehensive data on consumer behavior and purchasing patterns. To capitalize on these data, we have used rich, data-driven analytics, to drive improved decision-making in all aspects of our business, including procurement, merchandising, product positioning, club openings, marketing and promotion campaigns, among others. As a result, we have been able to implement a range of assortment initiatives such as supplier renegotiations, competitive contract options, SKU optimization and brand switching. We are also using our data to better target member acquisition and retention efforts for existing and new clubs. While we have made substantial progress, we believe there are opportunities to further develop our data analytics capabilities. |
| • | Enterprise-Wide Cost Discipline and Improved Profitability: We have created a culture of cost discipline across both member- and non-member facing functions. In 2015, we launched our category profitability improvement (“CPI”) program to address our procurement spending, and during fiscal years 2016 and 2017 we negotiated over $260 million in expected annual procurement savings. We drove these savings by improving dialogue with our national brand and private label suppliers to educate them on the value proposition we offer to our members and by implementing competitive bidding throughout our buying process. In partnership with our suppliers, we are now using our data to maximize marketing campaigns, creating a symbiotic relationship that provides benefits to both parties. We further lowered our cost of goods sold by recalibrating and streamlining our portfolio of private label brands from 13 to two focused brands and by emphasizing our value proposition versus national brand equivalents, which increased our private label penetration from 10% of total merchandise sales in fiscal year 2012 to 19% in fiscal year 2017. We have also focused on staying disciplined in our overhead cost structure and have been able to hold addressable SG&A expenses relatively flat, allowing topline growth and gross profit expansion to translate into Adjusted EBITDA growth. We believe these cost savings will allow us to drive our next wave of growth through thoughtful investments in our business. |
| • | Technology-Driven Improvements to Customer Experience and Convenience: We have invested in omnichannel initiatives to boost convenience for our members. Powered by substantial back-end IT investments, we now offer, alongside in-store shopping, the enhanced convenience of an omnichannel shopping experience. We have launched mobile apps with Add-to-Card Coupons and Express Scan capabilities, have added Shop BJs.com — Pick Up in-Club capability, and recently rolled out same-day delivery of certain grocery items with no mark-up to item pricing which is available at most of our clubs, providing our members convenient ways to shop when and how they feel most comfortable. |
85
Table of Contents
These strategic initiatives have delivered results rapidly, as evidenced by several key operating metrics:
BJ’s Wholesale Club is a leading player in the large and growing U.S. warehouse club channel, a retail channel characterized by highly discounted prices and a curated selection of SKUs and services offered in a warehouse format. According to the Warehouse Club Intelligence Center, our channel generated $167 billion of sales in 2017 and has grown at a compound annual growth rate (CAGR) of 4.5% since 2007. This pace of growth exceeded that of the grocery and GAFO (General Merchandise, Apparel and Accessories, Furniture and Other Sales) retail channels, which experienced CAGRs of 2.7% and 1.1%, respectively, during this period, according to the U.S. Census.
Source: Warehouse Club Intelligence Center-2017 Warehouse Club Guide
The warehouse club model maintains several structural advantages over other retail formats that enable operators to provide significant value and a differentiated experience for the customer while also achieving an attractive return on invested capital. These advantages include:
| • | membership fee subscriptions that provide stable cash flows while driving consolidation of customer spend and encouraging “buy more, save more” behavior; |
| • | comprehensive customer purchasing data, enabling operators to analyze customer spend more effectively and meet consumer demand; |
| • | low operating costs per square foot due to high inventory turnover, low club labor requirements and efficient distribution networks; and |
| • | limited and bulk-sized SKUs, and a “no-frills” warehouse environment, which deliver a clear value proposition to consumers who are increasingly focusing on savings and price transparency. |
86
Table of Contents
According to the Warehouse Club Intelligence Center, the U.S. warehouse club channel is projected to grow at a five year CAGR of 4.0% from 2017 through 2022. Our channel is well-positioned to continue taking market share from a variety of other retail channels, including supermarkets, mass, convenience, department, specialty and variety stores. In recent years, fundamental changes in consumer shopping behavior have contributed to significant disruptions in the retail industry. Among these key changes is a growing consumer focus on value, driven by multiple factors including the growth of ecommerce, an increase in price transparency and demographic trends such as household-forming millennials and retiring baby boomers. Together, these factors favor retailers that offer strong value propositions, including warehouse clubs, where value is a fundamental part of the consumer perception. Additional tailwinds for the channel include recent retail store closures and bankruptcies that, we believe, provide an opportunity to take incremental market share. Warehouse clubs are also well-positioned against e-commerce retailers due to competitive pricing, an emphasis on fresh food, differentiated service offerings including gasoline, and the “treasure hunt” experience of the warehouse club trip. We believe that warehouse club customers view online retail and club visits as complementary for their shopping needs, with club visits providing great value in essential needs and online retail filling in for one-off purchases not available at warehouse clubs.
Our Competitive Strengths
| • | Differentiated Shopping Experience: We believe our business model enables us to provide significant value to our members versus non-warehouse club competitors. We define providing value in multiple ways. First, BJ’s consistently offers prices that are 25% lower on a representative basket of manufacturer-branded groceries compared to traditional supermarket competitors. Second, we offer a continuously refreshed assortment of on-trend general merchandise, competitively-priced gas and a variety of ancillary services that our non-warehouse club competitors generally do not provide. We believe that members can save over ten times their $55 Inner Circle membership fee compared to what they would have paid at traditional supermarket competitors when they spend $2,500 or more per year at BJ’s on manufacturer-branded groceries. Our clubs also carry 950 fresh food SKUs in selectively smaller pack sizes, whereas other warehouse club competitors offer significantly fewer SKUs in predominantly larger pack sizes. Together, we believe our significant value proposition and broader offering drive increased customer loyalty and higher trip frequency, positioning us to compete more effectively for weekly shopping market share. |
| • Well-Positioned Footprint and Flexible New Club Model: We are a leading warehouse club operator on the East Coast of the United States, where our 215 clubs and 134 gas stations are well-positioned in some of the most attractive markets in the United States. In our core New England markets, we operate almost three times the number of clubs when compared to the next largest warehouse club competitor. Nearly all of our clubs generate positive club-level EBITDA. Many of our clubs are located in densely populated, high traffic locations that are difficult to replicate due to expensive and limited real estate. In 2016, the markets in which we operate delivered GDP contribution, population growth and |
| |
| and household incomes above the respective U.S. averages. Our club sizes range from 63,000 sq. ft. to 150,000 sq. ft., with newer clubs primarily made up of our 85,000 sq. ft. model. We have also recently implemented a more data-driven model for new club site selection and member acquisition. This model, combined with our wide range of warehouse club sizes, allows for a flexible real estate expansion strategy that can be customized for infill or adjacent markets. We operate or contract for six distribution centers that serve our existing club base and have capacity to support up to 100 additional clubs along the East Coast of the United States. | ||
87
Table of Contents
| • | Large and Loyal Membership Base: Our business model creates a virtuous cycle of member spending, savings and loyalty, which drives our large and loyal membership base. We have over five million paid memberships, made up of more than 10 million total members, as of fiscal year 2017. Due to our wider assortment and their more frequent visits, our members provide us with more comprehensive purchasing data compared to other warehouse club operators. This member data allows us to better execute supplier renegotiations, competitive contract options, SKU optimization and brand switching. Our target member represents the largest segment of warehouse club shoppers in BJ’s trade areas with 9 million households and $7 billion of annual club channel grocery spend. The strong loyalty of our membership base is reflected in our all-time high renewal rate of 86% during fiscal year 2017. Additionally, as our membership base is price sensitive, our value proposition resonates even more during economic downturns, as evidenced by our stronger comparable club sales results versus other warehouse clubs during these historical periods. |
| • | Attractive Strong Free Cash Flow across Economic Cycles: Our membership model, low operating cost structure and disciplined capital spending allow us to generate predictable, strong free cash flow. Membership fees provide us with a stable stream of high margin revenue that is independent of merchandise sales, accounting for approximately half of Adjusted EBITDA in 2017, and positions us advantageously versus non-warehouse competitors. This income stream has grown every year over the past two decades. Additionally, our low club labor requirements and efficient distribution network result in low operating costs per square foot. We maintain a disciplined working capital strategy focused on sustaining low receivable levels and inventory turnover that matches or exceeds payment terms. Our clubs typically require a limited amount of maintenance capital expenditures to operate. Our business model enabled cash flow from operating activities to grow by 32%, from $159 million to |
| $210 million, and free cash flow to grow by 55%, from $47 million to $73 million, from fiscal 2015 to fiscal 2017. Our strong and steady free cash flow allows us to invest growth-focused capital in new clubs and initiatives, which we believe will generate positive returns on investment. |
| • | Experienced Management Team with a Proven Track Record: Our management team is led by Chairman, President and Chief Executive Officer Chris Baldwin, who we appointed Chief Executive Officer in February 2016 and Chairman in 2018. Chris has over 30 years of experience in retail and consumer products and, given his significant experience in the consumer products industry, brings a differentiated, “consumer-oriented” approach to retail. Chris also serves as the Chairman of the National Retail Federation, where he gains valuable insight into the broader retail industry. Chris collaborates closely with Bob Eddy, our Executive Vice President and Chief Financial and Administrative Officer. Bob is among the longest serving members of the BJ’s executive team, joining BJ’s in 2007, becoming Executive Vice President and Chief Financial Officer in 2011, and taking on the expanded responsibility of Chief Financial and Administrative Officer in February 2018. We also recently bolstered our team by appointing Lee Delaney as Chief Growth Officer in May 2016. Lee took on the expanded responsibility of Chief Commercial Officer in May 2018. Prior to joining BJ’s, Lee was a Partner in the Consumer Products practice at Bain & Company, where he gained a deep understanding of retailer-supplier dynamics. Other members of the BJ’s management team include recent outside hires and internal promotions. Our current management team has driven BJ’s recent performance momentum and is implementing a culture of operational discipline with processes and procedures focused on long-term, profitable growth. |
Our Growth Strategies
We believe we can drive sustainable sales and profit growth by executing on the following strategies:
| • | Grow Our Member Base: We benefit from access to comprehensive data on our members’ shopping behaviors that, we believe, is instrumental in implementing targeted, data-driven marketing and merchandising initiatives that improve the in-club shopping experience, grow wallet share and increase new member acquisition. We have invested significantly in augmenting our member acquisition and retention strategies, including investments in member segmentation and marketing, with the aim of |
88
Table of Contents
| driving a shift towards greater member engagement and membership renewals. For example, by recently upgrading our prospecting strategy from rigid, analog, semiannual mass campaigns to personalized, digital, “always on” campaigns, we believe we can continue to grow our member base. |
We have been successful in driving members into higher tiers of membership and affiliation, growing by 316% the number of members holding one of our My BJ’s Perks Mastercard offerings from fiscal year 2014 through fiscal year 2017. We are continually investing in our membership program to increase new member acquisition rates and drive renewals through value added membership and affiliation tiers. We believe we have the potential to significantly increase the penetration levels of our value-added membership and affiliation tiers. We are developing models to predict our members’ likelihood to renew so that we can proactively market to at-risk members, highlighting the value of their membership while encouraging breadth of shop and trip frequency with targeted promotions. We recently launched checkout lane prompting of premium membership awards and are piloting checkout lane credit card approvals to expedite the application process.
Our ongoing efforts also include increasing our use of social media, optimizing direct mail, converting promotional offer members into paid memberships, engaging young families and facilitating ease of membership renewals. We grew our BJ’s Easy Renewal® penetration from 18% in fiscal year 2015 to 37% in fiscal year 2017. We believe we can grow our Easy Renewal penetration further. We expect to leverage our membership data and deep analytics to dynamically optimize offers, providing a platform that, we believe, enables us to more effectively engage our members, transition them into value added membership and affiliation tiers and deliver greater share of wallet.
| • | Relentlessly Focus on the Consumer to Drive Sales: We intend to continue our efforts to optimize our product assortment and positioning and plan to expand our current product offerings into new and adjacent categories, including a broader apparel assortment, enhanced perishable offerings, tools and new family-oriented categories. We also have ongoing initiatives to enhance our private label offerings, deliver novel in-club experiences by continuously refreshing our assortment, improve workforce training and management through scheduling algorithms and provide services that enhance the overall member experience. We intend to continue initiatives aimed at growing comparable club sales through advancing member engagement, tailoring promotional offerings, improving the convenience of accessing our offering and allowing our members to complete their shopping in less time. We utilize social media, including via personalized outreach, to enhance our understanding both of member engagement and of the implications for shopping at our clubs and online. We are leveraging our learning to deliver greater value to our members and drive improved engagement. We also plan to expand our gas penetration and have identified opportunities to expand on-site and near-site gas stations at existing clubs and optimize pricing and loyalty programs. We focus our efforts on supporting the ease and consistency of each member’s experience, increasing trips to our clubs and enhancing the appeal of our clubs as a shopping destination. |
| • | Improve Trip Convenience and Differentiate Omnichannel Offering: During the Sponsors’ tenure as our owners, we have invested over $230 million in IT initiatives, including the implementation of SAP, which we believe is a key enabler in our ability to collect and utilize our data and further build our omnichannel capabilities. We are currently expanding several technology initiatives to enhance our omnichannel capabilities over the next two years. These initiatives include: |
| • | mobile apps with “Add-to-Card” (which allows users to add digital coupons to their membership card) and “Express Scan” functionalities (which allows members to use smart phones or hand-held devices to scan bar codes as they shop the club to facilitate quick checkout); |
| • | “Shop BJs.com—Pick Up in-Club” (which allows members to buy products online and pick-up in club within two hours); and |
| • | a same-day delivery offering, which allows members to shop our clubs from the convenience of BJs.com, and have orders delivered in as quickly as one hour for a nominal delivery fee. |
89
Table of Contents
We are also aggressively advancing our digital capabilities to enhance personal outreach to our members. We have already added experienced and accomplished omnichannel and IT leadership talent to our team to facilitate these efforts and will continue to invest in our omnichannel capabilities and data analytics. We believe these initiatives will result in a more seamless, convenient shopping experience for our members and will drive financial results.
| • | Expand Our Strategic Footprint: We believe the six existing Company-operated and contracted distribution centers that serve our clubs are sufficient to support the opening of about 100 additional clubs along the East Coast of the United States, and we plan to open a total of 15-20 new clubs over the next five years. We will focus this expansion on infill and markets adjacent to our existing locations. We also expect to benefit from recent club and department store closures in several of our markets and adjacent markets. In fiscal years 2016 and 2017, we implemented a data-driven approach to club openings with results in our latest pilot clubs that included new membership at club opening that was 240% greater than our average new club opening in fiscal year 2015. |
| • | Continue to Enhance Profitability: Over the last three years, our management team led a number of operational improvements at BJ’s and delivered significant savings. For example, under our CPI program, which we launched in fiscal year 2015 to address procurement spend across 70 product categories, we implemented initiatives such as supplier renegotiations, SKU optimization and brand switching. During fiscal years 2016 and 2017, we negotiated over $260 million in expected annual procurement savings, with over $200 million of those savings impacting our cost of sales during those fiscal years and another $60 million scheduled to impact our cost of sales during fiscal year 2018. We are continuing to review additional product categories through our CPI program, which we believe can deliver significant incremental procurement savings. |
In January 2018, we increased our membership fees by 10%, consistent with our historical practice of raising membership fees every five years. Additionally, we have been focused on controlling our Selling, General and Administrative spend, and we will continue to invest in technologies to drive efficiencies in the club.
We believe we have opportunities to drive further productivity savings in the near- to medium-term through additional procurement savings, greater private label penetration and continued cost discipline. We believe our Adjusted EBITDA and free cash flow will improve further as we capture additional benefits from initiatives both already undertaken and to come.
Industry and Competition
Warehouse clubs offer a relatively narrow assortment of food and general merchandise items within a wide range of product categories. In order to achieve high sales volumes and rapid inventory turnover, merchandise selections are generally limited to items that are brand name leaders in their categories alongside an assortment of private label brands. Since warehouse clubs sell a diversified selection of product categories, they attract customers from a wide range of other wholesale and retail distribution channels, such as supermarkets, supercenters, internet retailers, gasoline stations, hard discounters, department and specialty stores and operators selling a narrow range of merchandise. These higher cost distribution channels have traditionally been unable to match the low prices offered by warehouse clubs over long periods.
Warehouse clubs eliminate many of the merchandise handling costs associated with traditional multiple-step distribution channels by purchasing full truckloads of merchandise directly from manufacturers and by storing merchandise on the sales floor rather than in central warehouses. By operating no-frills, self-service warehouse facilities, warehouse clubs have fixturing and operating costs substantially below those of traditional retailers. Because of their higher sales volumes and rapid inventory turnover, warehouse clubs generate cash from the sale of a large portion of their inventory before they are required to pay merchandise vendors. As a result, a greater percentage of the inventory is financed through vendor payment terms than by working capital. Two broad
90
Table of Contents
groups of customers, individual households and small businesses, have been attracted to the savings made possible by the high sales volumes and operating efficiencies achieved by warehouse clubs. Customers at warehouse clubs are generally limited to members who pay an annual fee.
Our Clubs
As of February 3, 2018, we operated 215 clubs ranging in size from 63,000 square feet to 150,000 square feet. We aim to locate our larger clubs in high density, high traffic locations that are difficult to replicate. We design our smaller format clubs to serve markets whose population is not sufficient to support a larger club or that are in locations, such as urban areas, where there is inadequate real estate space for a larger club. Including space for parking, the amount of land required for a BJ’s club generally ranges from 8 acres to approximately 14 acres. The use of garage parking can in some cases reduce the amount of land necessary for a club. Our clubs are located in both free-standing locations and shopping centers.
We buy most of our merchandise directly from manufacturers and route it to cross-docking consolidation points (distribution centers) or directly to our clubs. Our company-operated and contracted distribution centers receive large shipments from manufacturers and quickly ship these goods to individual clubs. This process creates freight volume and handling efficiencies, eliminating many costs associated with traditional multiple-step distribution channels.
A summary of our club locations by market is set forth in the table below.
| Market | Store Count | |||
| New York |
44 | |||
| Florida |
31 | |||
| Massachusetts |
25 | |||
| New Jersey |
23 | |||
| Pennsylvania |
17 | |||
| Connecticut |
13 | |||
| Maryland |
12 | |||
| Virginia |
12 | |||
| North Carolina |
10 | |||
| New Hampshire |
6 | |||
| Ohio |
6 | |||
| Georgia |
5 | |||
| Delaware |
4 | |||
| Maine |
3 | |||
| Rhode Island |
3 | |||
| South Carolina |
1 | |||
Merchandising
We service our existing members and attract new members by providing a broad range of high quality, brand name and private label merchandise at prices that are consistently lower than the prices of traditional retailers, including discount retailers, supermarkets, supercenters and specialty retail operations. We limit the items offered in each product line to fast selling styles, sizes and colors, carrying approximately 7,200 active stock keeping units (SKUs). By contrast, supermarkets normally carry an average of 40,000 SKUs, and supercenters may stock 100,000 SKUs or more. We work closely with manufacturers to develop packaging and sizes that are best suited for selling through the warehouse club format in order to minimize handling costs and ensure value to our members.
91
Table of Contents
We group our merchandise offerings into perishables, edible grocery, general merchandise and non-edible grocery categories.
| • | Perishables: consist of our meat, produce, dairy, bakery, deli and frozen products, and constituted approximately 33% of our merchandise sales for fiscal year 2017. |
| • | Edible grocery: consists of packaged foods (including breakfast foods, salty snacks and candy) and beverages (including juices, water, beer, wine and liquor) and constituted approximately 27% of our merchandise sales for fiscal year 2017. |
| • | Non-edible grocery: consists of detergents, disinfectants, paper products, beauty care, adult and baby care and pet foods, and constituted approximately 24% of our merchandise sales for fiscal year 2017. |
| • | General merchandise: consists of small appliance, lighting, television, electronics, imaging and apparel and constituted approximately 15% of our merchandise sales for fiscal year 2017. |
BJ’s consumer-focused private label products, sold under Wellsley Farms® and Berkley Jensen® brands, comprised approximately 19% of total merchandise sales in fiscal year 2017, an increase from 10% in fiscal year 2012. These products are primarily premium quality and generally are priced below the branded competing product. We focus both on a group of core private label products that compete with national brands that have among the highest market share and yield high margins and on differentiated products that drive member loyalty.
We also offer a number of specialty services that are designed to enable members to complete more of their shopping at our clubs and to encourage more frequent trips to the clubs. Most of these services are provided by outside operators under license from us. Specialty services include full-service optical centers; full-service cellular phone service centers; home improvement services; travel services; garden and storage sheds; patios and sunrooms; a propane tank filling service; an automobile buying service; a car rental service; tire installation services; muffler and brake services; payment processing services; and electronics and jewelry protection plans.
As of February 3, 2018, we had 133 gasoline stations in operation at or near our clubs. The gas stations are generally self-service, with some locations also accepting cash. Both regular and premium gasoline are available. We generally maintain our gas prices below the average prices in each market as a means of illustrating a favorable price image to existing and prospective members.
Omni-Channel Offering
Our e-commerce business, www.bjs.com, provides hundreds of our general merchandise products as well as thousands of additional products generally not found in our clubs. We provide delivery of these products to our members’ home or office. Items sold on our website include electronics, computers, office supplies and equipment, products for the home, health and beauty aids, sporting goods, outdoor living, baby products, toys and jewelry. In addition, we offer, through third party providers, services such as tire installation, vision care, travel and insurance and more. In addition to e-commerce capabilities, our highly-rated mobile apps offers Add-to-Card Coupons functionality, which alleviates the hassle of paper coupons by allowing members to digitally save our own and national brand coupons and offers directly onto the app, and Express Scan capability, which enables our members to self-checkout by scanning purchases on their smartphone. We have also recently rolled out an integrated same-day delivery offering with club pricing and a fixed delivery fee.
Membership
Paid membership is an essential element of the warehouse club concept. In addition to providing a source of revenue which permits us to offer low prices, membership reinforces customer loyalty. We have a large base of five million paid memberships, made up of more than 10 million total members, as of fiscal year 2017. Our target customers care about value, quality and convenience and shop at warehouse clubs for their family needs. Our target customers are a price sensitive demographic with large household sizes, representing the largest segment of warehouse club shoppers in BJ’s trade areas, with 9 million households and $7 billion of annual club channel
92
Table of Contents
grocery spend. While we believe we also appeal to a wider range of household incomes, we target households with an average annual income of approximately $75,000. We believe this group represents an historically underserved demographic in our core markets.
We offer two base types of memberships: Inner Circle® memberships and business memberships. We generally charge $55 per year for a primary Inner Circle membership that includes one additional card for a household member. Primary members may purchase up to three supplemental memberships for $30 each. A primary business membership costs $55 per year and includes one free supplemental membership. Business members may purchase up to eight additional supplemental business memberships at $30 each. U.S. military personnel—active and veteran—who enroll at a BJ’s® club location can do so for a reduced membership fee. We had over five million paid members at February 3, 2018. The prices above reflect a 10% increase in the list prices of our primary membership tiers, which went into effect on January 1, 2018.
BJ’s Perks Rewards®, our higher tier of membership, offers members the opportunity to earn 2% cash back on most in-Club and www.bjs.com purchases. The annual fee for a BJ’s Perks Rewards Membership is $110 per year. We also offer our co-branded My BJ’s Perks® Mastercard® program. This program provides members with the opportunity to earn up to five percent cash back on purchases made at our clubs or online at bjs.com and a 10-cent per gallon discount on gasoline when paying with a My BJ’s Perks Mastercard at our BJ’s Gas locations. We offer among the most competitive gasoline prices in our markets, evidenced by GasBuddy naming BJ’s Gas among the top 10 on its 100 U.S. Best Value Brands for 2016 list. Since fiscal year 2014, we have grown co-branded Mastercard holders by 316%. In fiscal year 2017, BJ’s Perks Rewards members and co-branded Mastercard members accounted for 21% of members and 38% of spend.
Advertising and Public Relations
We promote customer awareness of our clubs primarily through social media, direct mail, public relations efforts, radio advertising, community involvement, new club marketing programs and various publications sent to our members periodically throughout the year. We also employ dedicated marketing personnel who solicit potential business members and who contact other selected organizations to increase the number of members. We also run free promotional membership and initially discounted membership promotions to attract new members, with the objective of converting them to paid members. These programs result in low marketing expenses compared to typical retailers.
Club Operations
Our ability to achieve profitable operations depends upon high sales volumes and the efficient operation of our warehouse clubs. We buy most of our merchandise from manufacturers for shipment either to a BJ’s cross-dock facility or directly to our clubs. This eliminates many of the costs associated with traditional multiple-step distribution channels, including distributors’ commissions and the costs of storing merchandise in central distribution facilities.
We route the majority of our purchases through cross-dock facilities which break down truckload quantity shipments from manufacturers and reallocates these goods for shipment to individual clubs, generally within 24 hours. Our efficient distribution systems result in reduced freight expenses and lower handling costs compared to other retailers. We contract with a third party that operates three perishables distribution centers for us.
We work closely with manufacturers to minimize the amount of handling required once merchandise is received at a club. Merchandise for sale is generally displayed on pallets containing large quantities of each item, thereby reducing labor required for handling, stocking and restocking. Back-up merchandise is generally stored in steel racks above the sales floor.
93
Table of Contents
Information Systems
We strive to use information systems and technology to improve the control and the efficiency of our business model. We completed an implementation of SAP enterprise resource planning software in fiscal year 2015 and are focused on leveraging the efficiency benefits of SAP as well as implementing new checkout technologies to improve member convenience.
Sales data is generally analyzed daily for replenishment decision making. Detailed purchasing data permits the buying staff and club managers to track changes in members’ buying behavior. Detailed shrinkage information by SKU by club allows management to quickly identify inventory shrinkage problems and formulate effective action plans.
Employees
As of February 3, 2018, we had approximately 26,520 full-time and part-time employees, whom we refer to as “team members”. None of our team members is represented by a union. We consider our relations with our team members to be good.
Segments
Our club retail operations, which represent substantially all of our consolidated total revenues, are our only reportable segment. All of our identifiable assets are located in the United States. We do not have significant sales outside the United States, nor does any customer represent more than 10% of total revenues for any period presented.
Real Estate
We lease the substantial majority of our retail properties, each of our three Company-operated distribution centers and our corporate office. Our main office is located in Westborough, Massachusetts and is leased under a lease agreement expiring in 2026.
We operate three cross-dock distribution centers for non-perishable items and also have three perishable item distribution centers operated by a third party. Our cross-dock distribution centers are leased under lease agreements expiring between 2031 and 2033, and range between 480,000 and 630,000 square feet in size. The third-party perishable distribution centers range between 210,000 and 264,000 square feet in size.
As of February 3, 2018, we operated 215 clubs and 133 gas stations in 16 states. The majority of our clubs are leased from third parties under lease agreements expiring at various dates from 2018 to 2040.
The following table summarizes the real property that we currently own and lease.
| Type | Number | |||
| Clubs owned |
12 | |||
| Clubs leased |
203 | |||
| Building leases |
184 | |||
| Ground leases |
19 | |||
| Gas stations owned |
2 | |||
| Gas stations leased |
131 | |||
| Distribution centers leased |
3 | |||
| Corporate office leased |
1 | |||
Intellectual Property
We believe that, to varying degrees, our trademarks, trade names, copyrights, proprietary processes, trade secrets, patents, trade dress, domain names and similar intellectual property add significant value to our business and are important to our success. We have invested significantly in the development and protection of our well-
94
Table of Contents
recognized brands, including our private label brands, Wellsley Farms® and Berkley Jensen®. We believe that products sold under our private label brands are high quality, offered to our members at prices that are generally lower than those for comparable national brand products and help lower costs, differentiate our merchandise offerings from other retailers and generally earn higher margins. We expect to continue to increase the sales penetration of our private label items.
We rely on trademark and copyright laws, trade-secret protection, and confidentiality, license and other agreements with our suppliers, employees and others to protect our intellectual property rights. The availability and duration of trademark registrations vary by country; however, trademarks are generally valid and may be renewed indefinitely as long as they are in use and their registrations are properly maintained.
Government Regulation
We are subject to labor and employment laws, laws governing truth-in-advertising, privacy laws, environmental laws, safety regulations and other laws, including consumer protection regulations that regulate retailers and govern the promotion and sale of merchandise and the operation of clubs, warehouses and Company-operated and contracted distribution center facilities.
Our clubs are also subject to various local, state and federal laws, regulations and administrative practices affecting our business. We must comply with provisions regulating health and sanitation standards, food labeling, equal employment, minimum wages, environmental protection, licensing for the sale of food and, in many clubs, licensing for beer and wine or other alcoholic beverages. Our operations, including the manufacturing, processing, formulating, packaging, labeling and advertising of products are subject to regulation by various federal agencies, including the Food and Drug Administration (the “FDA”), the FTC, the U.S. Department of Agriculture (the “USDA”), the Consumer Product Safety Commission (the “CPSC”) and the Environmental Protection Agency. We rely on contractual provisions to ensure compliance by our vendors.
Food
The FDA has comprehensive authority to regulate the safety of food and food ingredients (other than meat, poultry, catfish and certain egg products), as well as dietary supplements under the Federal Food, Drug, and Cosmetic Act (the “FDCA”). Similarly, the USDA’s Food Safety Inspection Service is the public health agency responsible for ensuring that the nation’s commercial supply of meat, poultry, catfish and certain egg products is safe, wholesome and correctly labeled and packaged under the Federal Meat Inspection Act and the Poultry Products Inspection Act.
Congress amended the FDCA in 2011 through passage of the Food Safety Modernization Act (the “FSMA”), which greatly expanded the FDA’s regulatory obligations over all actors in the supply chain. Industry actors continue to determine the best pathways to implement FSMA’s regulatory mandates and the FDA’s promulgating regulations throughout supply chains, as most requirements are now in effect. Such regulations mandate that risk-based preventive controls be observed by the majority of food producers. This authority applies to all domestic food facilities and, by way of imported food supplier verification requirements, to all foreign facilities that supply food products.
The FDA also exercises broad jurisdiction over the labeling and promotion of food. Labeling is a broad concept that, under certain circumstances, extends even to product-related claims and representations made on a company’s website or similar printed or graphic medium. All foods, including dietary supplements, must bear labeling that provides consumers with essential information with respect to standards of identity, net quantity, nutrition facts labeling, ingredient statement and allergen disclosures. The FDA also regulates the use of structure/function claims, health claims and nutrient content claims.
Dietary Supplements
The FDA has comprehensive authority to regulate the safety of dietary supplements, dietary ingredients, labeling and current good manufacturing practices. Congress amended the FDCA in 1994 through passage of the
95
Table of Contents
Dietary Supplement Health and Education Act (the “DSHEA”), which greatly expanded FDA’s regulatory authority over dietary supplements. Through DSHEA, dietary supplements became their own regulated commodity while also allowing structure/function claims on products. However, no statement on a dietary supplement may expressly or implicitly represent that it will diagnose, cure, mitigate, treat or prevent a disease.
Food and Dietary Supplement Advertising
The FTC exercises jurisdiction over the advertising of foods and dietary supplements. The FTC has the power to institute monetary sanctions and the imposition of consent decrees and penalties that can severely limit a company’s business practices. In recent years, the FTC has instituted numerous enforcement actions against dietary supplement companies for failure to have adequate substantiation for claims made in advertising or for the use of false or misleading advertising claims.
Compliance
As is common in our industry, we rely on our suppliers and contract manufacturers, including those of our private label products, to ensure that the products they manufacture and sell to us comply with all applicable regulatory and legislative requirements. We do not directly manufacture any goods. In general, we seek certifications of compliance, representations and warranties, indemnification or insurance from our suppliers and contract manufacturers. However, even with adequate insurance and indemnification, any claims of non-compliance could significantly damage our reputation and consumer confidence in products we sell. In addition, the failure of such products to comply with applicable regulatory and legislative requirements could prevent us from marketing the products or require us to recall or remove such products from our clubs. In order to comply with applicable statutes and regulations, our suppliers and contract manufacturers have from time to time reformulated, eliminated or relabeled certain of their products, and we have revised certain provisions of our sales and marketing program.
We monitor changes in these laws and believe that we are in material compliance with applicable laws.
Legal Proceedings
We are subject to various litigations, claims and other proceedings that arise from time to time in the ordinary course of business. We believe these actions are routine and incidental to the business. While the outcome of these actions cannot be predicted with certainty, we do not believe that any will have a material adverse impact on our business.
96
Table of Contents
Executive Officers and Directors
The following table sets forth information about our executive officers and directors, including their ages as of April 10, 2018. With respect to our directors, each biography contains information regarding the person’s service as a director, business experience, director positions held currently or at any time during the past five years, information regarding involvement in certain legal or administrative proceedings and the experience, qualifications, attributes or skills that caused our board of directors to determine that the person should serve as a director of our Company.
| Name |
Age |
Position | ||
| Executive Officers |
||||
| Christopher J. Baldwin |
55 | Chairman, President & Chief Executive Officer | ||
| Lee Delaney |
46 | Executive Vice President, Chief Commercial Officer | ||
| Jeff Desroches |
41 | Executive Vice President, Club Operations | ||
| Robert W. Eddy |
45 | Executive Vice President, Chief Financial and Administrative Officer | ||
| Scott Kessler |
51 |
Executive Vice President, Chief Information Officer | ||
| Brian Poulliot |
43 | Executive Vice President, Chief Membership Officer | ||
| Laura L. Felice |
36 |
Senior Vice President, Finance | ||
| Caroline Glynn |
50 |
Senior Vice President, Internal Audit and Asset Protection | ||
| Graham Luce |
48 | Senior Vice President, General Counsel | ||
| Rafeh Masood |
39 |
Senior Vice President and Chief Digital Officer | ||
| Kirk Saville |
55 | Senior Vice President, Corporate Communications | ||
| William C. Werner |
40 | Senior Vice President, Strategic Planning and Analysis | ||
| Directors |
||||
| Cameron Breitner |
43 | Director | ||
| Nishad Chande |
43 | Director | ||
| J. Kristofer Galashan |
40 | Director | ||
| Lars Haegg |
52 | Director | ||
| Ken Parent |
59 | Director | ||
| Jonathan A. Seiffer |
46 | Director | ||
| Christopher J. Stadler |
53 | Director | ||
| Robert Steele |
62 | Director | ||
| Tommy Yin |
28 | Director |
Christopher J. Baldwin is Chairman, President & Chief Executive Officer. Mr. Baldwin joined BJ’s in September 2015 as President and Chief Operating Officer and Director and was promoted to Chief Executive Officer in February 2016 and Chairman in 2018. Prior to joining BJ’s, he was Chief Executive Officer of Hess Retail Corporation, a spin-off of Hess Corporation (“Hess Retail”) from 2010. Under Mr. Baldwin’s leadership, Hess Retail operated more than 1,300 convenience stores and served over a million customers daily. Before joining Hess Retail, he held executive roles at Kraft Foods from 2007 to 2010, and The Hershey Company from 2004 to 2007. Earlier in his career, Mr. Baldwin also held various roles at Nabisco and Procter and Gamble. Mr. Baldwin is the Chairman of the National Retail Federation, the world’s largest retail trade association. He also serves as a non-executive director at Petco Stores, one of the largest pet retailers in the United States. Mr. Baldwin is also active in the community, serving as an executive board member at Harlem Lacrosse and Leadership, a school-based nonprofit that provides educational intervention, leadership training and lacrosse for at-risk youth. Mr. Baldwin graduated from Siena College in Loudonville, New York with a B.S. in Economics. Mr. Baldwin has unique familiarity with our business and significant experience in the retail industry which qualifies him to serve on our board of directors.
Lee Delaney is Executive Vice President, Chief Commercial Officer of BJ’s Wholesale Club, Inc. Mr. Delaney is responsible for the Company’s merchandising, marketing and supply chain organization, and BJ’s services businesses, including travel, optical and home improvement. Mr. Delaney joined BJ’s in 2016 as Executive Vice President, Chief Growth Officer. Prior to joining BJ’s, he was a partner in the Boston office of
97
Table of Contents
Bain & Company (“Bain”) from 1996 to 2016. While at Bain, Mr. Delaney advised clients on corporate strategy, created new market entry plans, supported client acquisitions and advised on large cost reduction programs. He has extensive experience with direct consumer and retail marketing. Before joining Bain, he led consulting engagements for Electronic Data Systems and Deloitte Consulting. Mr. Delaney attended business school at Carnegie Mellon University, earning an MBA with top honors. He is also a graduate of the University of Massachusetts where he received a B.S. with a double major in computer science and mathematics. Mr. Delaney is also a member of the board of directors of PDC Brands Inc.
Jeff Desroches is Executive Vice President, Club Operations of BJ’s Wholesale Club, Inc. Mr. Desroches was named to this position in 2018 and leads all operations, Club Team Members, Regional Field Staff, and policies and procedures at the Company’s 215 clubs and 134 fuel stations. Mr. Desroches joined BJ’s in 2001 as Regional Asset Protection Manager for the Metro NY market and became the Vice President of Asset Protection in 2007. In 2010 Mr. Desroches was named Senior Vice President of Supply Chain. As the Senior Vice President of Supply Chain, he was responsible for all aspects of supply chain operations including domestic and international transportation, reverse logistics, inventory planning and allocation, vendor compliance master data and more. Prior to BJ’s, Mr. Desroches held various operational and warehousing roles at Service Merchandise Company, Inc. from 1993 to 2000 and Kmart Corporation from 2000 to 2001. He holds a B.S. in Criminal Justice and Law Enforcement Administration from American Intercontinental University.
Robert W. Eddy is Executive Vice President, Chief Financial and Administrative Officer of the Company. He is responsible for the Company’s finance, risk management, real estate and human resources teams. He also leads the teams charged with pricing and procurement, asset protection, as well as the legal team. Mr. Eddy was named Chief Financial and Administrative Officer in 2018. He joined BJ’s in 2007 as Senior Vice President, Finance and was named Executive Vice President and Chief Financial Officer in 2011. Prior to joining BJ’s, Mr. Eddy served multinational manufacturing, technology, retail and consumer products companies as a member of the audit and business advisory practice of PwC in Boston and San Francisco. From 2012 to 2017, Mr. Eddy chaired the Financial Executives Council of the National Retail Federation. He is also a member of the Board of Trustees of The Boston Children’s Hospital. Mr. Eddy is a graduate of Babson College in Wellesley, Massachusetts, and Phillips Academy in Andover, Massachusetts.
Scott Kessler is Executive Vice President, Chief Information Officer of BJ’s Wholesale Club, Inc. He joined BJ’s in this position in 2017 and is responsible for IT, ensuring that the Company has the technology, systems and people in place to support the Company’s transformation. Prior to joining the Company, he was Executive Vice President, Chief Information Officer, at Belk, a $4 billion department store chain with nearly 300 stores from 2014 to 2016. Prior to that, Mr. Kessler was Senior Vice President, Products Technology, at GSI Commerce from 2004 to 2013. Mr. Kessler holds an MBA and a B.S. degree from Fairleigh Dickenson University.
Brian Poulliot is Executive Vice President, Chief Membership Officer of BJ’s Wholesale Club, Inc. Mr. Poulliot was named to this position in 2016 and is responsible for overseeing all aspects of the Company’s membership programs, including acquisition, retention, engagement and analytics capabilities. From 2012 to 2016, Mr. Poulliot was Senior Vice President, Strategic Planning & Analysis, overseeing corporate financial planning and analysis, strategic pricing, category profitability and site selection research for the Company. He joined BJ’s in 2010 as Vice President of Financial Accounting and Reporting. In 2006, Mr. Poulliot joined ThermoFisher Scientific through the merger of Fisher Scientific and Thermo Electron. In 2004, he joined Fisher Scientific International where he led the company’s technical accounting operations. Mr. Poulliot earned his CPA license in 1999. He graduated from Merrimack College in North Andover, Massachusetts in 1996 with a B.S. in Business Administration with a concentration in accounting.
Laura L. Felice is Senior Vice President, Finance of BJ’s Wholesale Club, Inc. She joined BJ’s in this position in 2016 and is responsible for the integrity of our financial records. Prior to joining BJ’s, Ms. Felice held positions at Clarks Americas, Inc. from 2008 to 2016 and PwC from 2003 to 2008. She holds a Master of Accounting and a B.S. in Finance and Accounting from Boston College. She is also CPA.
98
Table of Contents
Caroline Glynn is Senior Vice President, Internal Audit and Asset Protection of BJ’s Wholesale Club, Inc. She has been with BJ’s for more than 28 years and is responsible for assessing risks, controls and process improvement opportunities. Ms. Glynn has held various positions at BJ’s in club operations, inventory control and internal audit. She holds a B.S. in Finance and MBA from Southern New Hampshire University. She is also a CPA, a Certified Internal Auditor and a Certified Information Systems Auditor (CISA).
Graham Luce is Senior Vice President, General Counsel of BJ’s Wholesale Club, Inc. Mr. Luce joined BJ’s in this position in 2015 and provides senior management with strategic advice on Company initiatives, complex business transactions and litigation, as well as counsel on all corporate governance related matters. He also serves as secretary to the board of directors. Prior to joining the Company, Mr. Luce worked at Bain from 2000 to 2015 and Goodwin Procter LLP from 1995 to 2000. He holds a J.D. from Boston University School of Law and holds a B.A. in Political Science and a B.S. in Electrical Engineering from Tufts University.
Rafeh Masood is Senior Vice President and Chief Digital Officer of BJ’s Wholesale Club, Inc. He joined BJ’s in this position in May 2017 and is responsible for driving the Company’s vision and strategy for its e-commerce and omnichannel efforts. Mr. Masood held various leadership positions at Dick’s Sporting Goods from 2013 to 2017 and Sears Holdings from 2010 to 2013. He holds an MBA and a B.S. in Information Systems from DePaul University.
Kirk Saville is Senior Vice President, Corporate Communications of BJ’s Wholesale Club, Inc. He joined BJ’s in this position in 2016 and is responsible for corporate communications, public relations, internal communications, social media and community relations. Prior to joining the Company, Mr. Saville held senior communications positions at Staples, Inc. from 2012 to 2017 and The Hershey Company from 2003 to 2012. He holds a Master of Journalism and a B.A. in Soviet Studies from the University of California, Berkeley.
William C. Werner is Senior Vice President, Strategic Planning and Analysis of BJ’s Wholesale Club, Inc. and is responsible for building the Company’s strategic priorities to drive growth. He joined BJ’s in 2012 as Vice President, Accounting and Financial Reporting, was promoted to Senior Vice President, Finance in 2013 and assumed his current position in 2016. Prior to joining the Company, Mr. Werner was a Director in the Deals practice at PwC from 2007 to 2012. He holds a B.A. in Mathematics and Accounting from the College of the Holy Cross and is a CPA.
Cameron Breitner has been a director of the Company since 2011. Mr. Breitner is a Partner at CVC. He is the head of CVC’s San Francisco office and leads CVC’s U.S. Business Services, Consumer and Retail investing activities. Prior to joining CVC in 2007, Mr. Breitner worked at Centre Partners where he was Managing Director and had worked since 1998. Prior to Centre Partners, Mr. Breitner worked in M&A at Bowles Hollowell Conner & Co. He received a B.A. in Psychology from Duke University. His experience in the retail industry qualifies him to serve on our board of directors.
Nishad Chande has been a director of the Company since 2018. Mr. Chande is a Senior Managing Director at CVC, which he joined in 2016 as a member of the Consumer/Retail team. Prior to joining CVC, Mr. Chande worked at Centre Partners from 2005 to 2016, Bain & Company from 2003 to 2005, Raymond James Capital from 1999 to 2001 and Schroders from 1997 to 1999. He holds an MBA from the Wharton School at the University of Pennsylvania and a B.A. in Economics and Mathematics from Dartmouth College. His experience in the retail industry qualifies him to serve on our board of directors.
J. Kristofer Galashan has been a director of the Company since 2011. Mr. Galashan is a Partner at Leonard Green, which he joined as an associate in 2002. Prior to joining Leonard Green, he worked in the Investment Banking Division of Credit Suisse First Boston (formerly DLJ) in their Los Angeles office. Mr. Galashan presently serves on the board of directors of The Container Store. Mr. Galashan earned a B.A. in Business Administration, with honors, from the Richard Ivey School of Business at the University of Western Ontario. His experience in the retail industry qualifies him to serve on our board of directors.
99
Table of Contents
Lars Haegg has been a director of the Company since 2012. Mr. Haegg is a Partner at CVC since 2012, where he is a member of the CVC Operations team, and based in New York. Prior to joining CVC, Mr. Haegg spent over 14 years with Investcorp where he was Head of Post-Acquisition activities in North America. Before Investcorp, he worked at McKinsey & Company where he served retail, media and technology clients. Mr. Haegg holds an MBA from Harvard Business School and a B.A. in Business Administration from The University of Texas, Austin. His experience in the retail industry qualifies him to serve on our board of directors.
Ken Parent has been a director of the Company since 2011. Mr. Parent is president of Pilot Flying J, the largest travel center operator in North America. In this role, he oversees all company functions, including human resources, technology, finance, real estate and construction. Mr. Parent also leads strategic initiatives on behalf of Pilot. Named Chief Operating Officer of Pilot in 2014, Mr. Parent also managed store and restaurant operations, marketing, sales, transportation and supply and distribution. Prior to that, Mr. Parent served as the company’s Senior Vice President of Operations, Marketing and Human Resources from 2001 to 2014. Mr. Parent holds an MBA and a B.S. in marketing from San Diego State University. Mr. Parent has experience in the retail industry which qualifies him to serve on our board of directors.
Jonathan A. Seiffer has been a director of the Company since 2011. Mr. Seiffer is a Senior Partner at Leonard Green, which he joined in 1994. Mr. Seiffer is a board observer for Signet Jewelers. He previously served on the board of Whole Foods from 2008 to 2017. Mr. Seiffer earned a Bachelor of Applied Sciences in Systems Engineering and a B.S. in Economics from the University of Pennsylvania. His experience in the retail industry qualifies him to serve on our board of directors.
Christopher J. Stadler has been a director of the Company since 2011. Mr. Stadler is a Managing Partner at CVC, which he joined in 2007. He oversees private equity activities in North America and the CVC Capital Markets Team. Mr. Stadler is on the board of the CVC Capital Partners advisory business and is the Co-Chairman of the Europe/North America Private Equity Board. Prior to joining CVC, Mr. Stadler worked for Investcorp as Head of Private Equity, North America after joining as Managing Director in 1996. He holds an MBA in Finance from Columbia University and a B.A. in Economics from Drew University. His experience in the retail industry qualifies him to serve on our board of directors.
Robert Steele has been a director of the Company since March 2016. Mr. Steele is on an advisory board for CVC. From 2007 to 2011, Mr. Steele served as Vice Chairman of Global Health and Well-being at Procter & Gamble (“P&G”), retiring in 2011. Mr. Steele spent 35 years with P&G, where he served as group president of global household care, group president of North America, VP North America home care and in a range of brand management and sales positions. Mr. Steele formerly served on the board of Kellogg Co. from 2007 to 2012; the board of Beam Co. from 2012 to 2014; the board of Keurig Green Mountain, Inc. from 2013 to 2016; and as trustee of The St. Joseph Home for Handicapped Children from 1995 to 2012. He is currently on the board of directors of Berry Global and the board of directors of LSI Industries, Inc., which he joined in 2016. Mr. Steele holds an MBA from Cleveland State University and a B.A. in Economics from the College of Wooster. Mr. Steele has experience serving on the boards of a number of large corporations across various industries, which qualifies him to serve on our board of directors.
Tommy Yin has been a director of the Company since 2017. Mr. Yin is an Associate at Leonard Green which he joined in 2015. Prior to joining Leonard Green, Mr. Yin worked in Boston at Sankaty Advisors, the credit affiliate of Bain Capital. He is actively involved with Leonard Green’s investment in Prospect Medical. Mr. Yin graduated summa cum laude from the Wharton School at the University of Pennsylvania with a B.S. in Economics and concentrations in Finance and Management. His experience in the consumer and retail industries qualify him to serve on our board of directors.
Composition of the Board of Directors after this Offering
Our business and affairs are managed under the direction of the board of directors. Our board of directors currently consists of 10 directors.
100
Table of Contents
In accordance with the terms of our amended and restated certificate of incorporation and amended and restated bylaws that will become effective upon the closing of this offering, our board of directors will be divided into three classes, class I, class II and class III, with members of each class serving staggered three-year terms. Upon the closing of this offering, the members of the classes will be divided as follows:
| • | the Class I directors will be and , and their terms will expire at the annual meeting of stockholders to be held in 2019; |
| • | the Class II directors will be and , and their terms will expire at the annual meeting of stockholders to be held in 2020; and |
| • | the Class III directors will be and , and their terms will expire at the annual meeting of stockholders to be held in 2021. |
Director Independence and Controlled Company Exception
Our board of directors has affirmatively determined that and are independent directors under the rules of the NYSE.
After consummation of this offering, the Sponsors will continue to control a majority of the voting power of our outstanding common stock. As a result, we will be a “controlled company” within the meaning of the NYSE corporate governance standards. Under these rules, a “controlled company” may elect not to comply with certain corporate governance standards, including the requirements:
| • | that a majority of our board of directors consist of independent directors; |
| • | that our board of directors have a nominating and corporate governance committee that is composed entirely of independent directors with a written charter addressing the committee’s purpose and responsibilities; |
| • | that our board of directors have a compensation committee that is composed entirely of independent directors with a written charter addressing the committee’s purpose and responsibilities; and |
| • | for an annual performance evaluation of the nominating and corporate governance committee and compensation committee. |
For at least a period following this offering, we intend to utilize all of these exemptions. As a result, we will not have a majority of independent directors, our nominating and corporate governance committee and compensation committee will not consist entirely of independent directors and such committees will not be subject to annual performance evaluations. Accordingly, you will not have the same protections afforded to stockholders of companies that are subject to all of the corporate governance requirements. See “Risk Factors—Risks Relating to Our Common Stock and this Offering—We are a “controlled company” within the meaning of the rules of the NYSE and, as a result, will qualify for, and may rely on, exemptions from certain corporate governance requirements.” In the event that we cease to be a “controlled company” and our ordinary shares continue to be listed on the NYSE, we will be required to comply with these provisions within the applicable transaction periods.
Leadership Structure of the Board of Directors
Our board of directors will combine the roles of Chairman of the Board and Chief Executive Officer. These positions will be held by Christopher J. Baldwin, as our Chairman, President & Chief Executive Officer at the consummation of this offering. The board of directors has determined that combining these positions will serve the best interests of the Company and its shareholders. The board of directors believes that the Company’s Chief Executive Officer is best situated to serve as Chairman because he is the director most familiar with the Company’s business and industry, and most capable of effectively identifying strategic priorities and leading the
101
Table of Contents
consideration and execution of strategy. The board of directors believes that the combined position of Chairman and Chief Executive Officer promotes the development of policy and plans, and facilitates information flow between management and the board of directors, which is essential to effective governance.
Committees of the Board of Directors
Upon consummation of this offering, our board of directors will have the following committees: the audit committee, the compensation committee and the nominating and corporate governance committee. From time to time, our board of directors may also establish any other committees that it deems necessary or desirable.
Audit Committee. Upon consummation of this offering, we expect to have an audit committee consisting of Nishad Chande, as chair, and Ken Parent and Robert Steele. Rule 10A-3 of the Exchange Act requires us to have one independent audit committee member upon the listing of our common stock, a majority of independent directors on our audit committee within 90 days of the effective date of this registration statement and an audit committee composed entirely of independent directors within one year of the effective date of this registration statement. qualifies as our “audit committee financial expert” within the meaning of regulations adopted by the SEC. The audit committee appoints and reviews the qualifications and independence of our independent registered public accounting firm, prepares compensation committee reports to be included in proxy statements filed under SEC rules and reviews the scope of audit and non-audit assignments and related fees, the results of the annual audit, accounting principles used in financial reporting, internal auditing procedures, the adequacy of our internal control procedures, the quality and integrity of our financial statements and investigations into matters related to audit functions. The audit committee is also responsible for overseeing risk management on behalf of our board of directors. See “—Risk Oversight.”
Compensation Committee. Upon consummation of this offering, we expect to have a compensation committee consisting of Jonathan A. Seiffer and Cameron Breitner, as co-chairs, and Christopher J. Baldwin and Robert Steele. The principal responsibilities of the compensation committee are to review and approve matters involving executive and director compensation, recommend changes in employee benefit programs, authorize equity and other incentive arrangements, prepare compensation committee reports to be included in proxy statements filed under SEC rules and authorize our Company to enter into employment and other employee related agreements.
Nominating and Corporate Governance Committee. Upon the consummation of this offering, we expect to have a nominating and corporate governance committee consisting of J. Kristofer Galashan, as chair, and Lars Haegg and Tommy Yin. The nominating and corporate governance committee assists our board of directors in identifying individuals qualified to become board members, makes recommendations for nominees for committees, oversees the evaluation of the board of directors and management and develops, recommends to the board of directors and reviews our corporate governance principles.
Risk Oversight
Our board of directors has extensive involvement in the oversight of risk management related to us and our business and accomplishes this oversight primarily through the audit committee. To that end, our audit committee will meet quarterly with our Chief Financial and Administrative Officer and our independent auditors where it will receive regular updates regarding our management’s assessment of risk exposures including liquidity, credit and operational risks and the process in place to monitor such risks and review results of operations, financial reporting and assessments of internal controls over financial reporting.
Code of Ethics
Prior to the consummation of this offering, we intend to adopt a code of ethics applicable to all of our directors, officers (including our principal executive officer, principal financial officer and principal accounting
102
Table of Contents
officer) and employees. Our code of ethics will be available on our website at www.bjs.com under Investor Relations. Our code of ethics will be a “code of ethics” as defined in Item 406(b) of Regulation S-K. In the event that we amend or waive certain provisions of our code of ethics applicable to our principal executive officer, principal financial officer or principal accounting officer that requires disclosure under applicable SEC rules, we intend to disclose the same on our website.
Compensation Committee Interlocks and Insider Participation
None of our executive officers serves, or in the past year has served, as a member of the board of directors or compensation committee (or other committee performing equivalent functions) of any entity that has one or more executive officers serving on our board of directors or compensation committee. No interlocking relationship exists between any member of our compensation committee (or other committee performing equivalent functions) and any executive, member of the board of directors or member of the compensation committee (or other committee performing equivalent functions) and of any other company. We are party to certain transactions with our Sponsors and affiliates thereof as described in “Certain Relationships and Related Party Transactions.”
103
Table of Contents
Compensation Discussion and Analysis
This section discusses the principles underlying the material components of our executive compensation program for our executive officers who are named in the “Summary Compensation Table” and the factors relevant to an analysis of these policies and decisions. These “named executive officers” for fiscal year 2017 are:
| • | Christopher J. Baldwin, who serves as Chairman, President & Chief Executive Officer (“CEO”) and is our principal executive officer; |
| • | Robert W. Eddy, who serves as Executive Vice President and Chief Financial and Administrative Officer and is our principal financial officer; |
| • | Cornel Catuna, who served as Executive Vice President, Club Operations until April 9, 2018; |
| • | Lee Delaney, who serves as Executive Vice President, Chief Growth Officer; |
| • | Brian Poulliot, who serves as Executive Vice President, Chief Membership Officer; and |
| • | Peter Amalfi, who served as Executive Vice President, Chief Information Officer until October 28, 2017. |
Specifically, this section provides an overview of our executive compensation philosophy, the overall objectives of our executive compensation program, and each compensation component that we provide. In addition, we explain how and why the executive compensation committee of our board of directors arrived at specific compensation policies and decisions involving our named executive officers during fiscal year 2017.
Each of the key elements of our executive compensation program is discussed in more detail below. Our compensation programs are designed to be flexible and complementary and to collectively serve the principles and objectives of our executive compensation and benefits program.
Executive Compensation Philosophy and Objectives
Our executive team is critical to our success and to building value for our stockholders. The principles and objectives of our compensation and benefits programs for our executive officers are to:
| • | Attract, engage and retain to work for us the best executives, with experience and managerial talent enabling us to be an employer of choice in highly-competitive and dynamic industries; |
| • | Align compensation with our corporate strategies, business and financial objectives and the long-term interests of our stockholders; |
| • | Motivate and reward executives whose knowledge, skills and performance ensure our continued success; and |
| • | Ensure that our total compensation is fair, reasonable and competitive. |
Roles of Our Compensation Committee and Chief Executive Officer in Compensation Decisions
Historically, the initial compensation arrangements with our executive officers, including the named executive officers, have been determined in arm’s-length negotiations with each individual executive. Typically, our CEO has been responsible for negotiating these arrangements, except with respect to his own compensation, with the oversight and final approval of the compensation committee. The compensation arrangements have been influenced by a variety of factors, including, but not limited to:
| • | our financial condition and available resources; |
| • | our view of the strategic importance of the position to be filled; |
104
Table of Contents
| • | our evaluation of the competitive market based on the experience of the members of the compensation committee with other companies and market information we may receive from executive search firms retained by us; |
| • | the length of service of an individual; and |
| • | the compensation levels of our other executive officers, |
each as of the time of the applicable compensation decision.
Following the completion of these arrangements, our CEO and the compensation committee have been responsible for overseeing our executive compensation program, as well as determining and approving the ongoing compensation arrangements for our CEO and other executive officers, including the other named executive officers.
The current compensation levels of our executive officers, including the named executive officers, primarily reflect the varying roles and responsibilities of each individual, as well as the length of time each executive officer has been employed by the Company.
Engagement of Compensation Consultant
The compensation committee is authorized to retain the services of one or more executive compensation advisors, in its discretion, to assist with the establishment and review of our compensation programs and related policies. Since 2011, the compensation committee had not engaged the services of an executive compensation advisor in reviewing and establishing its compensation programs and policies. The compensation committee has not previously considered formal compensation market data or formally benchmarked total executive compensation or individual compensation elements against a peer group. In connection with the preparation of this offering, the compensation committee has engaged Exequity LLP (“Exequity”), an independent national compensation consulting firm, to provide executive compensation advisory services, help evaluate our compensation philosophy and objectives and provide guidance in administering our compensation program. Exequity does not provide any services to us other than the services provided to the compensation committee. The compensation committee believes that Exequity does not have any conflicts of interest in advising the compensation committee under applicable SEC or NYSE rules.
Compensation Philosophy
We design the principal components of our executive compensation program to fulfill one or more of the principles and objectives described above. Compensation of our named executive officers consists of the following elements:
| • | base salary; |
| • | annual Company performance-based cash compensation; |
| • | discretionary individual performance-based cash compensation; |
| • | equity incentive compensation; |
| • | certain severance benefits; |
| • | a retirement savings (401(k)) plan; and |
| • | health and welfare benefits and certain limited perquisites and other personal benefits. |
Each of these elements fulfills one or more of the principles and objectives noted above. We view each component of our executive compensation program as related but distinct, and we also regularly reassess the total
105
Table of Contents
compensation of our executive officers to ensure that our overall compensation objectives are met. Historically, not all components have been provided to all executive officers. In addition, we have determined the appropriate level for each compensation component based in part, but not exclusively, on our understanding of the competitive market based on the experience of members of the compensation committee and consistent with our recruiting and retention goals, our view of internal equity and consistency, the length of service of our executive officers, our overall performance, and other considerations the compensation committee considers relevant.
We offer cash compensation, in the form of base salaries, annual Company performance-based bonuses and discretionary individual performance-based cash compensation, that we believe appropriately rewards our executive officers for their contributions to our business. When making awards the compensation committee considers the Company’s financial and operational performance. The key component of our executive compensation program, however, is equity awards for shares of our common stock. As a privately-held company, we have emphasized the use of equity to incent our executive officers to focus on the growth of our overall enterprise value and, correspondingly, the creation of value for our stockholders.
Except as described below, we have not adopted any formal or informal policy or guidelines for allocating compensation between currently-paid and long-term compensation, between cash and non-cash compensation, or among different forms of non-cash compensation.
Each of the primary elements of our executive compensation program is discussed in more detail below. While we have identified particular compensation objectives that each element of executive compensation serves, our compensation programs are designed to be flexible and complementary and to collectively serve all of the executive compensation objectives described above. Accordingly, whether or not specifically mentioned below, we believe that, as a part of our overall executive compensation policy, each individual element, to a greater or lesser extent, serves each of our objectives.
Executive Compensation Program Components
The following describes the primary components of our executive compensation program for each of our named executive officers, the rationale for that component, and how compensation amounts are determined.
Base Salary
Annual base salaries compensate our executive officers for fulfilling the requirements of their respective positions and provide them with a level of cash income predictability and stability with respect to a portion of their total compensation. Generally, our named executive officers’ initial base salaries were established through arms-length negotiation at the time the individual was hired, taking into account his or her qualifications, experience and prior salary level. Thereafter, the base salaries of our executive officers, including the named executive officers, are reviewed periodically by the compensation committee and our CEO, and adjustments are made as deemed appropriate.
On March 27, 2017, the compensation committee approved increases in the base salaries of Messrs. Eddy, Catuna, Delaney, Poulliot and Amalfi of 4.7%, 3.2%, 5.0%, 4.0% and 5.2%, respectively.
As of the end of fiscal year 2017, our named executive officers were entitled to the following base salaries over a 52-week fiscal year:
| Named Executive Officer(1) |
Base Salary | |||
| Christopher J. Baldwin |
$ | 1,000,000 | ||
| Robert W. Eddy |
$ | 560,000 | ||
| Cornel Catuna(2) |
$ | 480,000 | ||
| Lee Delaney |
$ | 630,000 | ||
| Brian Poulliot |
$ | 390,000 | ||
106
Table of Contents
| (1) | Mr. Amalfi retired from the Company on October 28, 2017 in accordance with the terms of his retirement benefits agreement. |
| (2) | Mr. Catuna announced his retirement and resigned as Executive Vice President, Club Operations on April 9, 2018, and his employment with the Company will terminate on July 2, 2018. From April 9, 2018 to July 2, 2018, Mr. Catuna is serving in a transitional role as determined by Mr. Baldwin. |
The actual base salaries paid to the named executive officers during the 53-week fiscal year 2017 are set forth in the “Summary Compensation Table” below.
Effective April 29, 2018, Messrs. Baldwin, Eddy, Delaney and Poulliot received increases in their base salaries to $1,300,000; $725,000; $750,000 and $450,000, respectively, based on a benchmarking analysis provided by Exequity.
Annual Company Performance-Based Cash Bonuses and One-Time Cash Bonuses
We use cash bonuses to motivate our executive officers to achieve our short-term financial and strategic objectives while making progress towards our longer-term growth and other goals. Pursuant to our Annual Incentive Plan, each of our named executive officers is eligible for a cash bonus based solely on the Company’s achievement of specified EBITDA targets. The target level of the EBITDA objectives is correlated with the Company’s annual growth objectives. Under the Annual Incentive Plan, each named executive officer is eligible for a target bonus amount, which reflects a percentage of their annual base salary paid in fiscal year 2017. For fiscal year 2017, the participants (including the named executive officers) were eligible to receive the full amount of their target bonus amount if the annual EBITDA target was met. If the EBITDA target was exceeded, the total bonus pool was increased by 1/3rd of the amount the EBITDA achieved exceeded the target bonus amount, subject to certain adjustments. The maximum bonus participants could receive was 200% of the target bonus amount. If the EBITDA target was not achieved for fiscal year 2017, no bonuses would have been paid out under the Annual Incentive Plan.
The compensation committee did not make individualized determinations of the bonus amount to be paid under the Annual Incentive Plan, but instead determined a uniform percentage of the target bonus amount to be paid to each participant in the Annual Incentive Plan based on our performance in 2017. More specifically, for fiscal year 2017, the EBITDA target was $500 million on the basis of a 52-week fiscal year. In March 2018, the compensation committee determined that our Annual Incentive Plan EBITDA for the 2017 performance period was $506 million, exceeding our EBITDA target and resulting in a payment to each participant under the Annual Incentive Plan in an amount equal to 110.8% of the participant’s target bonus.
The following table lists fiscal year 2017 target bonuses for our named executive officers.
| Named Executive Officer |
Annual Incentive Plan Target Bonus (as a % of base salary)(2) |
|||
| Christopher J. Baldwin |
100 | % | ||
| Robert W. Eddy |
60 | % | ||
| Cornel Catuna |
60 | % | ||
| Lee Delaney |
60 | % | ||
| Brian Poulliot |
60 | % | ||
| Peter Amalfi(1) |
60 | % | ||
| (1) | Mr. Amalfi retired from the Company on October 28, 2017 and was eligible for a prorated Company performance-based cash bonus based on his service period. |
| (2) | Fiscal year 2017 was 53 weeks long. Each executive’s target bonus was a percentage of their base salary earned in fiscal year 2017. |
107
Table of Contents
In addition, the compensation committee awarded Messrs. Eddy, Delaney and Poulliot discretionary bonuses for their extraordinary service to the Company in fiscal year 2017 . The amounts of such discretionary bonuses are set forth below:
| Named Executive Officer |
Discretionary Bonus ($) | |||
| Robert W. Eddy |
339,866 | |||
| Lee Delaney |
382,154 | |||
| Brian Poulliot |
236,942 | |||
Long-Term Equity Incentives
To reward and retain our executive officers in a manner that best aligns their interests with the interests of our stockholders, we use stock options as a key equity incentive vehicle. Because our executive officers are able to benefit from stock options only if the market price of our common stock increases relative to the option’s exercise price, we believe stock options provide meaningful incentives to our executive officers to achieve increases in the value of our stock over time and are an effective tool for meeting our compensation goal of increasing long-term stockholder value by tying the value of the stock options to our future performance.
Going forward, we may use stock options, restricted stock units, and other types of equity-based awards, as we deem appropriate, to offer our employees, including our named executive officers, long-term equity incentives that align their interests with the long-term interests of our stockholders.
Equity Award Decisions. Historically, when determining the amount and terms of stock option awards we considered, among other things, length of service, individual performance history, job scope, function, title, the value and size of outstanding equity awards and comparable awards granted to other individuals at similar levels. The compensation committee has also drawn upon the experience of its members and market information we may receive from executive search firms retained by us to assess the competitiveness of the market in determining equity awards. No equity awards were granted to our named executive officers in fiscal year 2017.
Outstanding Equity Awards. Each of our named executive officers has outstanding option awards. Mr. Baldwin was granted an option on September 8, 2015 that vested pursuant to the following schedule: 10% of the option vested on December 31, 2015, 30% of the option vested on December 31, 2016, 30% of the option vested on December 31, 2017, and the remaining portion of the option is eligible to vest on December 31, 2018, subject to Mr. Baldwin’s continued employment by us. In addition, the option fully vests and becomes exercisable immediately prior to a change in control, subject to Mr. Baldwin’s continued employment by us through the consummation of such change in control. Upon a termination by the Company without Cause, by the executive for Good Reason, or due to his death or disability, in each case, during the three month period immediately prior to any December 31st on which an installment is eligible to vest, a prorated percentage of the shares will vest.
Mr. Baldwin was also granted an option on March 24, 2016, 30% of which vests over time and 70% of which vests based on the company’s performance. The time-vesting portion of the option vests as follows: 1/7th of the time-vesting portion vested on July 1, 2016, and the remaining 6/7ths of the time-vesting portion vests in equal ratable installments on the last calendar day of each month from July 2016 to December 2018, subject to Mr. Baldwin’s continued employment by us. In addition, the time-vesting portion fully vests and becomes exercisable immediately prior to a change in control, subject to Mr. Baldwin’s continued employment by us through the consummation of such change in control. The performance-vesting portion of the option vests in three equal ratable installments upon the determination of EBITDA for fiscal years 2016, 2017 and 2018, respectively based on achievement of specified EBITDA targets. The installments tied to fiscal years 2016 and 2017 EBITDA have vested. Furthermore, upon a change in control that results in either our principal and selling stockholders (i) receiving proceeds equal to at least 2.5 times their investment or (ii) an internal rate of return of at least 30%, 100% of the performance vesting portion of the option will accelerate and become fully vested immediately prior to the change in control. If a change in control occurs in which our principal and selling stockholders do not achieve either of the above thresholds, to the extent that the change in control occurs on or
108
Table of Contents
prior to our board of director’s determination of EBITDA for fiscal year 2018, the performance-vesting portion of the option shall become fully vested immediately prior to such change in control. If a change in control is consummated within the 90-day period following Mr. Baldwin’s termination for Good Reason or without Cause (each as defined in the option agreement and other than due to death or disability), the option will vest as if Mr. Baldwin had remained employed through the consummation of such change in control. If no change in control occurs in the 90 days following such a termination for Good Reason or without Cause (other than due to death or disability), the next monthly installment of the time-vesting portion of the option shall vest and the performance vesting portion of the option shall become fully vested to the extent the fiscal year 2018 EBITDA target is achieved.
Messrs. Eddy and Catuna received option grants on September 30, 2011 that are now fully vested. Similarly, Mr. Poulliot received option grants on February 10, 2012 and September 26, 2012 that are now fully vested.
Messrs. Eddy, Catuna, Delaney and Poulliot received option grants on September 20, 2016 and Mr. Poulliot received an additional grant on December 5, 2016, each of which vests pursuant to the following schedule: 60% of the option is time-vesting and 40% is performance-vesting. 30% of the option vested on September 30, 2017 (December 5, 2017 for Mr. Poulliot’s December 2016 grant) and 30% of the option is eligible to become vested on September 30, 2018 (December 5, 2018 for Mr. Poulliot’s December 2016 grant), subject to the executive’s continued employment by us through such date, based on time-vesting. 20% of the option vested in March 2018, upon the determination that the EBITDA target for fiscal year 2017 was achieved. The remaining 20% of the option is eligible to become vested upon the achievement of a specified EBITDA target for fiscal year 2018, subject to the executive’s continued employment by us through such date. Upon a change in control, the time-vesting portion of the option and any installment of the performance-vesting portion of the option that has not yet become eligible to vest, shall accelerate and become fully vested. If upon a change in control our principal and selling stockholders receive proceeds greater than or equal to 2.5 times their investment or a 30% return on their investment, 100% of the option shall accelerate and become fully vested, subject to the executive’s continued employment by us through such change in control date. Upon a termination of employment by the Company without Cause or the executive for Good Reason, or due to the executive’s death or disability, in each case, during the three-month period immediately prior to any September 30th (December 5th for Mr. Poulliot’s December 2016 grant) on which a time-vesting installment is eligible to vest, a pro-rated percentage of the option will vest. Due to Mr. Catuna’s resignation, no portion of the option that is unexercisable as of his termination of service will thereafter become exercisable.
Mr. Delaney received two additional option grants in May 2016. The first such grant was subject to vesting only upon a change in control, if such change in control had occurred prior to May 9, 2018, subject to the executive’s continued employment by us. Because such a change in control did not occur, such option did not vest.
The second May 2016 grant to Mr. Delaney vests pursuant to the following schedule: 60% of the option is time-vesting and the remaining 40% of the option is performance-vesting. One-third of the time-vesting portion of the option vests on May 9th of each year from 2017 through 2019, subject to the executive’s continued employment by us. One-third of the performance-vesting portion of the option vests on or within 120 days following the last day of each of the fiscal years 2016 through 2018 if the EBITDA for such fiscal year equals or exceeds the EBITDA target for such year subject to the executive’s continued employment by us through the last day of the fiscal year ending immediately prior to the vesting date. The portion tied to fiscal year 2016 EBITDA has vested. In March 2018 the compensation committee determined that the EBITDA target for fiscal year 2017 was achieved, and one-third of the performance vesting portion of the option vested upon such determination. Upon a change in control, the time-vesting portion of this option grant and any installment of the performance-vesting portion of this option grant that has not yet become eligible to vest shall accelerate and become fully vested, subject to the executive’s continued employment by us through such change in control date. If upon a change in control our principal and selling stockholders receive proceeds greater than or equal to 2.5 times their investment or a 30% return on their investment, 100% of this option grant shall accelerate and become fully vested, subject to the executive’s continued employment by us through such change in control date. Upon a
109
Table of Contents
termination of employment by the Company without Cause or the executive for Good Reason, or due to the executive’s death or disability, in each case, during the three-month period immediately prior to any May 9th on which a time-vesting installment is eligible to vest, a pro-rated percentage of the option will vest.
Recapitalization. In fiscal year 2017, in connection with an amendment to our then-existing revolving credit facility and a refinancing of our then-existing term loan facilities, we paid a dividend payment to our stockholders. Optionholders, including our named executive officers, did not receive dividend payments with respect to their stock options. However, the exercise price of their options was adjusted and/or they received retention bonus payments in order to equitably reflect the dividend recapitalization and to incent and retain the management employees, including our named executive officers, critical to our success. The retention bonuses were payable as follows. First, each named executive officer received a dividend equivalent retention bonus subject to the completion of the refinancing transaction and his or her continued employment with us through January 27, 2017 (“2017 Retention Bonus”). Second, an additional retention bonus that was originally granted to our named executive officers in 2013, subject to continued employment and our attainment of EBITDA targets, was amended so that the EBITDA targets were deemed to have been met and made payable as of January 30, 2017 (the “2013 Retention Bonus”). Finally, each of our named executive officers received a performance-based retention bonus payable upon the earlier to occur of (a) the Board’s determination that the Company had achieved an EBITDA target of $500 million for the 12-month period preceding such date or (b) the consummation of a change in control (the “EBITDA Retention Bonus”). Our board of directors determined that this EBITDA target was achieved in October 2017, and the EBITDA Retention Bonus became payable. The following table states the retention bonuses that were payable to each of our named executive officers in fiscal year 2017:
| Named Executive Officer |
2017 Retention Bonus($) |
2013 Retention Bonus($) |
EBITDA Retention Bonus($) |
|||||||||
| Christopher J. Baldwin |
6,942,962 | — | 2,306,532 | |||||||||
| Robert W. Eddy |
5,762,700 | 621,550 | 790,811 | |||||||||
| Cornel Catuna |
5,466,146 | 621,550 | 593,108 | |||||||||
| Lee Delaney |
3,311,520 | — | 1,383,920 | |||||||||
| Brian Poulliot |
2,531,536 | 93,658 | 525,408 | |||||||||
| Peter Amalfi |
5,169,592 | 621,550 | 395,405 | |||||||||
As a privately-held company, there has been no market for shares of our common stock. Accordingly, in fiscal year 2017, we had no program, plan, or practice pertaining to the timing of stock option grants to our executive officers coinciding with the release of material non-public information about the Company.
2018 IPO Equity Awards: In connection with the completion of this offering, we intend to adopt a new equity compensation plan, the 2018 Incentive Award Plan (referred to as the 2018 Plan) as described below, which will cover our employees, including our named executive officers. The Company has agreed to grant Mr. Baldwin restricted shares of our common stock under the 2018 Plan on or shortly following the completion of this offering.
Please see “Narrative Disclosure to Summary Compensation Table and Grants of Plan-Based Awards Table—Current Employment Arrangements” for further information on the equity award to be granted to Mr. Baldwin in connection with this offering.
401(k) Plan
We have established a 401(k) retirement savings plan for our employees, including the named executive officers, who satisfy certain eligibility requirements. Under the 401(k) plan, eligible employees may elect to reduce their current compensation by up to the prescribed annual limit, and contribute these amounts to the 401(k) plan. This plan provides for Company matching contributions of 50% of the first 6% of an employee’s covered compensation.
110
Table of Contents
Nonqualified Deferred Compensation Plan
We also have established an executive retirement plan (the “Executive Retirement Plan”), a nonqualified deferred compensation plan, for certain key employees. Under this plan, we fund annual retirement contributions of the designated participant’s base salary into contribution accounts, in which participants become vested after four fiscal years of service. The compensation committee has discretion to choose the percentage of contributions made, however, such amount must be at least equal to 3% of the participant’s base salary. The participants under this plan also receive a tax gross-up for the Company’s contributions. Please see “Nonqualified Deferred Compensation Table” for further information on this plan.
Employee Benefits and Perquisites
Additional benefits received by our employees, including the named executive officers, include medical and dental benefits, flexible spending accounts, short-term and long-term disability insurance and accidental death and dismemberment insurance. These benefits are provided to our named executive officers on the same general terms as they are provided to all of our full-time U.S. employees. We also provide basic life insurance coverage to our employees, as well as executive life insurance to certain key executives, including our named executive officers. Certain of our named executive officers also receive a car allowance, and we reimburse certain financial counseling and estate planning expenses for certain executives, including our named executive officers.
We design our employee benefits programs to be affordable and competitive in relation to the market, as well as compliant with applicable laws and practices. We adjust our employee benefits programs as needed based upon regular monitoring of applicable laws and practices in the competitive market.
We do not view perquisites or other personal benefits as a significant component of our executive compensation program. In the future, we may provide perquisites or other personal benefits in limited circumstances, such as where we believe it is appropriate to assist an individual executive officer in the performance of his or her duties, to make our executive officers more efficient and effective, and for recruitment, motivation or retention purposes. All future practices with respect to perquisites or other personal benefits for our named executive officers will be approved and subject to periodic review by the compensation committee. We do not expect these perquisites to be a significant component of our compensation program.
Severance and Change in Control Benefits
We have entered into employment agreements with our named executive officers, each of which has its own terms. The material elements of these employment agreements are summarized below under “Narrative Disclosure to Summary Compensation Table and Grants of Plan-Based Awards Table—Current Employment Agreements” and “—Potential Payments Upon Termination or Change in Control.”
Tax and Accounting Considerations
Section 162(m) of the Internal Revenue Code
Generally, Section 162(m) of the Internal Revenue Code of 1986, as amended, or the Code, disallows a tax deduction to any publicly held corporation for any individual remuneration in excess of $1 million paid in any taxable year to certain “covered employees.” Prior to 2018, “covered employees” included the chief executive officer and each of its other named executive officers, other than its chief financial officer. Commencing in 2018, “covered employees” was expanded to include the chief financial officer as well. Prior to 2018, an exception to this deduction limit applied if, among other things, the compensation qualified as “performance-based compensation” within the meaning of the Code.
We expect that the compensation committee will consider the potential future effects of Section 162(m) on the deductibility of executive compensation paid to our named executive officers, as applicable, and intends to
111
Table of Contents
qualify compensation paid to the covered named executive officers for an exemption from the deductibility limitations of Section 162(m) under the transition period applicable to the Company as a new publicly-traded company. As such, in approving the amount and form of compensation for our named executive officers in the future, the compensation committee will consider all elements of the cost to us of providing such compensation, including the potential impact of Section 162(m). In appropriate circumstances, however, the compensation committee may implement programs that recognize a full range of criteria important to our success and to ensure that our executive officers are compensated in a manner consistent with our best interests and those of our stockholders, even where the compensation paid under such programs may not be deductible under Section 162(m) of the Code.
Section 280G of the Internal Revenue Code
Section 280G of the Internal Revenue Code disallows a tax deduction with respect to excess parachute payments to certain executives of companies which undergo a change in control. In addition, Section 4999 of the Internal Revenue Code imposes a 20% penalty on the individual receiving the excess payment. Parachute payments are compensation that is linked to or triggered by a change in control and may include, but are not limited to, bonus payments, severance payments, certain fringe benefits, and payments and acceleration of vesting from long-term incentive plans including stock options and other equity-based compensation. Excess parachute payments are parachute payments that exceed a threshold determined under Section 280G based on the executive’s prior compensation. In approving the compensation arrangements for our named executive officers in the future, the compensation committee will consider all elements of the cost to the Company of providing such compensation, including the potential impact of Section 280G. However, the compensation committee may, in its judgment, authorize compensation arrangements that could give rise to loss of deductibility under Section 280G and the imposition of excise taxes under Section 4999 when it believes that such arrangements are appropriate to attract and retain executive talent.
Section 409A of the Internal Revenue Code
Section 409A of the Internal Revenue Code requires that “nonqualified deferred compensation” be deferred and paid under plans or arrangements that satisfy the requirements of the statute with respect to the timing of deferral elections, timing of payments and certain other matters. Failure to satisfy these requirements can expose employees and other service providers to accelerated income tax liabilities, penalty taxes and interest on their vested compensation under such plans. Accordingly, as a general matter, it is our intention to design and administer our compensation and benefits plans and arrangements for all of our employees and other service providers, including our named executive officers, so that they are either exempt from, or satisfy the requirements of, Section 409A.
Accounting for Stock-Based Compensation
We follow Financial Accounting Standards Board Accounting Standards Codification Topic 718 (formerly known as FASB No. 123(R)), or ASC Topic 718, for our stock-based compensation awards. ASC Topic 718 requires companies to calculate the grant date “fair value” of their stock-based awards using a variety of assumptions. ASC Topic 718 also requires companies to recognize the compensation cost of their stock-based awards in their income statements over the period that an employee is required to render service in exchange for the award. Grants of stock options, restricted stock, restricted stock units and other equity-based awards under our equity incentive award plans will be accounted for under ASC Topic 718. The compensation committee will regularly consider the accounting implications of significant compensation decisions, especially in connection with decisions that relate to our equity incentive award plans and programs. As accounting standards change, we may revise certain programs to appropriately align accounting expenses of our equity awards with our overall executive compensation philosophy and objectives.
112
Table of Contents
Compensation Tables
Summary Compensation Table
The following table sets forth information concerning the compensation of our named executive officers for the fiscal year 2017.
| Name and Principal Position |
Year | Salary ($)(3) |
Bonus ($)(4) |
Non-Equity Incentive Plan Compensation ($)(5) |
All Other Compensation ($)(6) |
Total($) | ||||||||||||||||||
| Christopher J. Baldwin Chairman, President & Chief Executive Officer |
2017 | 1,019,231 | — | 1,129,308 | 9,266,311 | 11,414,850 | ||||||||||||||||||
| Robert W. Eddy Executive Vice President and Chief Financial and Administrative Officer |
2017 | 566,443 | 339,866 | 376,571 | 7,255,519 | 8,538,399 | ||||||||||||||||||
| Cornel Catuna(1) Executive Vice President, Club Operations |
2017 | 486,635 | — | 323,515 | 6,754,549 | 7,564,699 | ||||||||||||||||||
| Lee Delaney Executive Vice President, Chief Commercial Officer |
2017 | 636,923 | 382,154 | 423,427 | 4,697,957 | 6,140,461 | ||||||||||||||||||
| Brian Poulliot Executive Vice President, Chief Membership Officer |
2017 | 394,904 | 236,942 | 262,532 | 3,212,737 | 4,107,115 | ||||||||||||||||||
| Peter Amalfi(2) Executive Vice President, Chief Information Officer |
2017 | 301,155 | — | 200,207 | 6,353,007 | 6,854,369 | ||||||||||||||||||
| (1) | Mr. Catuna’s employment with the Company will terminate on July 2, 2018. From April 9, 2018 to July 2, 2018, Mr. Catuna is serving in a transitional role as determined by Mr. Baldwin. |
| (2) | Mr. Amalfi retired from the Company on October 28, 2017. His salary amount represents his salary through October 28, 2017, and his non-equity incentive plan compensation was prorated for his service period. |
| (3) | This amount reflects the actual salary paid to each of our named executive officers over the 53-week 2017 fiscal year. |
| (4) | This amount reflects one-time discretionary cash bonuses paid for extraordinary service in 2017. Please see “Annual Company Performance-Based Cash Bonuses and One-Time Cash Bonuses” for further information on these bonuses. |
| (5) | Amounts reflect payments pursuant to our Annual Incentive Plan. |
| (6) | All Other Compensation for 2017 includes: |
| Name |
Equity Restructuring Payment($)(a) |
Executive Retirement Plan Company Contributions ($)(b) |
Tax Gross Ups ($)(c) |
Car Allowance ($) |
Employer 401(k) Matching Contributions ($)(d) |
Negotiated Retirement Benefits ($)(e) |
Other ($)(f) |
Total($) | ||||||||||||||||||||||||
| Christopher J. Baldwin |
9,249,494 | — | — | — | 8,004 | — | 8,813 | 9,266,311 | ||||||||||||||||||||||||
| Robert W. Eddy |
7,175,061 | 29,198 | 21,634 | 15,669 | 8,100 | — | 5,857 | 7,255,519 | ||||||||||||||||||||||||
| Cornel Catuna |
6,680,804 | 25,084 | 18,586 | 15,669 | 8,100 | — | 6,306 | 6,754,549 | ||||||||||||||||||||||||
| Lee Delaney |
4,695,440 | — | — | — | 363 | — | 2,154 | 4,697,957 | ||||||||||||||||||||||||
| Brian Poulliot |
3,150,602 | 20,356 | 13,954 | 15,669 | 8,100 | — | 4,056 | 3,212,737 | ||||||||||||||||||||||||
| Peter Amalfi |
6,186,547 | 15,581 | 11,545 | 11,530 | 8,100 | 112,153 | 7,551 | 6,353,007 | ||||||||||||||||||||||||
113
Table of Contents
| (a) | In connection with a dividend recapitalization in fiscal year 2017, certain of our optionholders, including our named executive officers, received dividend equivalent bonus payments in the form of the January 2017 Retention Bonus, the 2013 Retention Bonus and the EBITDA Retention Bonus. Please see “Long-Term Equity Incentives” for further information on such bonus payments. |
| (b) | We contribute to the Executive Retirement Plan for certain of our named executive officers. This amount reflects the company contributions to the Executive Retirement Plan. Under this plan, we fund annual retirement contributions of a certain percentage of the designated participant’s base salary into contribution accounts, in which participants become vested after four fiscal years of service. |
| (c) | Amounts reflect tax gross-ups provided under our Executive Retirement Plan. |
| (d) | Our 401(k) plan provides for Company matching contributions of 50% of the first 6% of an employee’s covered compensation. Company matching contributions vest ratably over an employee’s first four years of employment. |
| (e) | Amounts reflect negotiated salary continuation in connection with Mr. Amalfi’s retirement. |
| (f) | Amount reflects (i) a $612 cell phone stipend for Messrs. Baldwin, Eddy, Catuna, Delaney and Poulliot, and a $450 cell phone stipend for Mr. Amalfi (ii) executive life insurance contributions of $5,561 for Mr. Baldwin, $3,245 for Mr. Eddy, $3,695 for Mr. Catuna, $1,543 for Mr. Delaney, $1,445 for Mr. Poulliot, and $7,101 for Mr. Amalfi, and (iii) financial planning services in an amount equal to $2,640 for Mr. Baldwin and $2,000 for Messrs. Eddy, Catuna and Poulliot. |
Grants of Plan-Based Awards in Fiscal Year 2017
The following table sets forth information regarding grants of plan-based awards made to our named executive officers during the fiscal year 2017:
| Estimated future payouts under non-equity incentive plan awards |
||||||||
| Name |
Target ($) |
Maximum ($) |
||||||
| Christopher J. Baldwin |
1,019,231 | 2,038,462 | ||||||
| Robert W. Eddy |
373,852 | 747,704 | ||||||
| Cornel Catuna(1) |
291,981 | 583,962 | ||||||
| Lee Delaney |
420,369 | 840,738 | ||||||
| Brian Poulliot |
236,942 | 473,884 | ||||||
| Peter Amalfi(2) |
246,116 | 492,232 | ||||||
| (1) | Mr. Catuna’s employment with the Company will terminate on July 2, 2018. From April 9, 2018 to July 2, 2018, Mr. Catuna is serving in a transitional role as determined by Mr. Baldwin. He will receive a prorated award under our Annual Incentive Plan based on his period of service during fiscal year 2018. |
| (2) | Mr. Amalfi retired from the Company on October 28, 2017. He is no longer eligible for an award under our Annual Incentive Plan; however, he received a prorated award for fiscal year 2017 pursuant to his negotiated retirement benefit. |
Narrative Disclosure to Summary Compensation Table and Grants of Plan-Based Awards Table
Current Employment Arrangements
We have entered into employment agreements with certain of our named executive officers. The principal elements of these employment agreements are summarized below.
Christopher J. Baldwin
On September 1, 2015, BJ’s Wholesale Club, Inc. entered into an employment agreement with Mr. Baldwin, which was later amended on February 1, 2016 (the “CEO Employment Agreement”), pursuant to which
114
Table of Contents
Mr. Baldwin is employed as the Company’s Chairman, President and Chief Executive Officer. Pursuant to the CEO Employment Agreement, Mr. Baldwin is entitled to a base salary of $1,000,000 per year, subject to periodic increase from time to time as determined by the board of directors of the Company in its sole discretion, and an annual performance-based cash bonus with a target bonus opportunity equal to 100% of his annual base salary, payable based on goals established by the board of directors in its sole discretion. In connection with his transition to the role of Chief Executive Officer, Mr. Baldwin relocated to the Boston metropolitan area, and the Company agreed to pay him a relocation stipend equal to $125,000, net after applicable taxes, and reimbursed Mr. Baldwin up to $25,000 for reasonable expenses associated with Mr. Baldwin’s relocation. Pursuant to the CEO Employment Agreement, Mr. Baldwin is also subject to 12-month post-termination non-competition and non-solicitation covenants, as well as a perpetual confidentiality covenant.
Pursuant to the terms of the CEO Employment Agreement, the Company has certain obligations that become due in the event of termination. If Mr. Baldwin’s employment is terminated by the Company without Cause (as described below) or by Mr. Baldwin for Good Reason (as described below), then in addition to any accrued amounts, subject to Mr. Baldwin entering into a binding and irrevocable release of claims, Mr. Baldwin is eligible to receive (i) an amount equal to the sum of (a) his base salary for a period of 12 months after termination and (b) his target annual cash bonus, payable in substantially equal installments in such manner and at such times as the Executive’s base salary was being paid immediately prior to such termination (or if such termination occurs upon or following the occurrence of a change in control, such amount will be paid in a single lump sum); (ii) an amount equal to the difference between Mr. Baldwin’s actual Consolidated Omnibus Budget Reconciliation Act of 1985, as amended (“COBRA”) premium costs and the amount Mr. Baldwin would have paid had he continued coverage as an employee under the Company’s applicable health plans for up to twelve months, (iii) if such termination occurs on or after July 1st of a fiscal year, a pro rata portion of the annual cash bonus to which Mr. Baldwin would have been entitled had he remained employed by the Company until the end of the fiscal year, and (iv) any other payments or benefits arising from Mr. Baldwin’s participation in other Company plans to the extent such plans provide for post-termination employment benefits.
Upon a termination due to death or disability, in addition to the accrued amounts, Mr. Baldwin is eligible to receive, subject to the execution of a release of claims, (i) the annual cash bonus he would have been entitled to receive had he remained employed until the end of the fiscal year (prorated for the period of active employment during the fiscal year), and (ii) any other payments or benefits arising from Mr. Baldwin’s participation in other Company plans to the extent such plans provide for post-termination employment benefits.
“Cause” refers to the Company’s termination of Mr. Baldwin’s employment because he has: (i) refused or willfully failed to devote his full normal working time, skills, knowledge, and abilities to the business of the Company and in promotion of its interests or he has failed to fulfill directives of the boards of the Company, (ii) engaged in activities involving dishonesty, willful misconduct, willful violation of any law, rule, regulation or material policy of the Company or breach of fiduciary duty, (iii) committed larceny, embezzlement, conversion or any other act involving the misappropriation of the Company’s funds or property, (iv) been convicted of any crime which reasonably could affect in an adverse manner the reputation of the Company or his ability to perform his duties hereunder, (v) been grossly negligent in the performance of his duties, or (vi) materially breached the employment agreement.
“Good Reason” means the occurrence, without Mr. Baldwin’s prior written consent, of any of: (i) any material adverse change by the Company in Mr. Baldwin’s title, duties, responsibilities (including reporting responsibilities) or authority; (ii) Mr. Baldwin being required to relocate to a principal place of employment more than 50 miles from Mr. Baldwin’s principal place of employment with the Company on the effective date of the CEO Employment Agreement (other than any relocation to the Boston metropolitan area); (iii) the failure by the Company to reelect Mr. Baldwin as a member of the board of directors or the removal of Mr. Baldwin therefrom; (iv) the failure of the Company to obtain a satisfactory agreement from any successor to all or substantially all of the assets or business of the Company to assume and agree to perform the CEO Employment Agreement; or (v) a material breach by the Company or one of its subsidiaries of the CEO Employment Agreement or any other
115
Table of Contents
agreement between Mr. Baldwin and either of the Company or one of its subsidiaries entered into in connection with the CEO Employment Agreement; provided, that, within 30 days after the occurrence of a Good Reason event, Mr. Baldwin must provide the Company notice of his intent to resign for Good Reason and the basis therefore and allow the Company 30 days to cure the circumstances (if curable), and his employment will terminate within 60 days following the expiration of the cure period.
Christopher J. Baldwin 2018 IPO Equity Award
In connection with this offering, the Company has entered into a letter agreement with Mr. Baldwin, dated as of March 27, 2018, pursuant to which the Company has agreed to grant to Mr. Baldwin an award of restricted shares of our common stock (the “Restricted Shares”), subject to the completion of this offering. The Restricted Shares will be granted on or shortly following the completion of this offering and will be subject to the terms and conditions of the 2018 Plan (as described below) and a restricted stock agreement to be entered into between the Company and Mr. Baldwin. The Restricted Shares will generally be eligible to vest in equal installments on the last day of each calendar month ending during the period commencing on the date of grant and ending on September 30, 2020, subject to Mr. Baldwin’s continued employment with the Company or any of its subsidiaries through the applicable vesting date.
The vesting of the Restricted Shares will accelerate and all Restricted Shares will become vested if Mr. Baldwin’s employment is terminated without Cause or for Good Reason (each as defined in the CEO Employment Agreement) and a specified corporate transaction is consummated within 90 days following such termination of employment. Mr. Baldwin will generally be able to elect to satisfy withholding tax obligations due upon vesting of the Restricted Shares by having the Company withhold a net number of shares subject to the Restricted Share award with a fair market value equal to the maximum statutory withholding tax obligations. The letter agreement provides that the Restricted Shares will not be granted to Mr. Baldwin if this offering is not completed. In addition, we expect that, pursuant to the restricted stock agreement, Mr. Baldwin will also agree to comply with one-year post-termination non-competition and non-solicitation covenants, as well as perpetual confidentiality and non-disparagement covenants.
Robert Eddy, Cornel Catuna, Lee Delaney, and Brian Poulliot
BJ’s Wholesale Club, Inc. has entered into employment agreements with each of Mr. Eddy, dated as of January 30, 2011; Mr. Catuna, dated as of January 30, 2011; Mr. Delaney, dated as of May 9, 2016; and Mr. Poulliot, dated as of October 16, 2011. Pursuant to such agreements, Mr. Eddy serves as Executive Vice President and Chief Financial and Administrative Officer, Mr. Catuna served as Executive Vice President, Club Operations until his resignation on April 8, 2018, Mr. Delaney serves as Executive Vice President and Chief Commercial Officer and Mr. Poulliot serves as Executive Vice President, Chief Membership Officer. The initial term of Mr. Eddy and Mr. Catuna’s respective employment agreements was for a period of five years, ending on January 30, 2016, after which each executive was to remain employed by the Company subject to the termination provisions of their respective agreements. The annual base salaries for Mr. Eddy, Mr. Catuna, Mr. Delaney and Mr. Poulliot are $560,000, $480,000, $630,000 and $390,000 respectively. Each of the executives is also subject to 24-month post-termination non-competition and non-solicitation covenants as well as a perpetual confidentiality covenant.
Pursuant to each employment agreement, the Company has certain obligations that become due in the event of termination. If any of the executives are terminated by the Company without Cause (as described below), then in addition to any accrued amounts, subject to the executive entering into a binding and irrevocable release of claims, each executive is eligible to receive (i) a continuation of his base salary for a period of 24 months after termination, (ii) an amount equal to the difference between the executive’s actual COBRA premium costs and the amount the executive would have paid had he continued coverage as an employee under the Company’s applicable health plans for up to 24 months, (iii) a pro rata portion of any amounts the executive would have been entitled to receive under the Company’s annual incentive compensation plan had he remained employed by the
116
Table of Contents
Company until the end of the fiscal year during which termination occurred and (iv) any other payments or benefits arising from the executive’s participation in other Company plans to the extent such plans provide for post-termination employment benefits.
Upon a termination due to death or disability, in addition to the accrued amounts, subject to the execution of a release of claims, each of the executives is eligible to receive (i) the annual cash bonus the executive would have been entitled to receive had he remained employed until the end of the fiscal year (prorated for the period of active employment during the fiscal year), and (ii) any other payments or benefits arising from the executive’s participation in other Company plans to the extent such plans provide for post-termination employment benefits.
As used in each such employment agreement, “Cause” has substantially the same meaning as used in the CEO Employment Agreement.
After the end of fiscal year 2017, Mr. Catuna entered into a General Release and Separation Agreement with the Company pursuant to which he will retire from the Company as of July 2, 2018. From April 9, 2018 to July 2, 2018, Mr. Catuna is serving as an employee of the Company in a transitional role as determined by Mr. Baldwin. After July 2, 2018, Mr. Catuna will receive certain severance payments and benefits, as further described in “Potential Payments Upon Termination or Change in Control,” in consideration for the execution and non-revocation of the separation agreement (including the release therein), in addition to any (w) earned by unpaid salary, automobile allowance and vested but unused vacation, (x) any amounts the executive is entitled to that are yet unpaid under the Annual Incentive Plan, (y) his vested account balance under our 401(k) plan, and (z) any unreimbursed expenses incurred in accordance with Company policy.
Peter Amalfi
On January 30, 2011, BJ’s Wholesale Club, Inc. entered into an employment agreement with Mr. Amalfi pursuant to which Mr. Amalfi was employed as the Executive Vice President, Chief Information Officer (“CIO Employment Agreement”). The initial term of Mr. Amalfi’s employment under the CIO Employment Agreement was for a period of five years, ending on January 30, 2016, after which Mr. Amalfi was to remain employed by the Company subject to the termination provisions of the CIO Employment Agreement. Pursuant to the CIO Employment Agreement, Mr. Amalfi was entitled to a base salary of $350,000 per year, subject to periodic adjustment from time to time as determined by the board of directors of the Company in its sole discretion. Mr. Amalfi is also subject to 24-month post-termination non-competition and non-solicitation covenants as well as a perpetual confidentiality covenant.
On October 12, 2017, the Company and Mr. Amalfi entered into a general release and retirement benefits agreement, effective on October 28, 2017. Under such agreement, Mr. Amalfi is entitled to receive the following payments and benefits in connection with his retirement: (i) continued payment of his base salary for 104 weeks, (ii) the amount equal to the difference between Mr. Amalfi’s actual COBRA premium costs and the amount Mr. Amalfi would have paid had he continued coverage as an employee under the Company’s applicable health plans for up to 104 weeks, (iii) outplacement assistance for 12 months if such assistance was elected within 30 days of October 28, 2017, and (iv) a prorated award under the Annual Incentive Plan. He also received a prorated annual retirement contribution under the Executive Retirement Plan. The negotiated retirement payments and benefits were subject to Mr. Amalfi’s execution of a release of claims against the Company and his compliance with the applicable restrictive covenants.
117
Table of Contents
Outstanding Equity Awards at Fiscal Year-End
The following table summarizes the number of shares of common stock underlying outstanding equity incentive plan awards for each named executive officer as of February 3, 2018:
| Option Awards | ||||||||||||||||||||||||
| Name |
Grant Date | Number of Securities Underlying Unexercised Options(#) Exercisable |
Number of Securities Underlying Unexercised Options(#) Unexercisable |
Equity Incentive Plan Awards: Number of Securities Underlying Unearned Options(#) |
Option Exercise Price ($) |
Option Expiration Date |
||||||||||||||||||
| Christopher J. Baldwin |
9/8/2015 | (1) | 52,500 | 22,500 | — | $ | 40.00 | 9/8/2025 | ||||||||||||||||
| 3/24/2016 | (2) | 43,904 | 9,429 | 46,667 | $ | 40.00 | 3/24/2026 | |||||||||||||||||
| Robert W. Eddy |
9/30/2011 | (3) | 78,330 | — | — | $ | 12.50 | 9/30/2021 | ||||||||||||||||
| 9/20/2016 | (4) | 12,000 | 12,000 | 16,000 | $ | 40.00 | 9/20/2026 | |||||||||||||||||
| Cornel Catuna |
9/30/2011 | (3) | 78,330 | — | — | $ | 12.50 | 9/30/2021 | ||||||||||||||||
| 9/20/2016 | (4) | 9,000 | 9,000 | 12,000 | $ | 40.00 | 9/20/2026 | |||||||||||||||||
| Lee Delaney |
5/9/2016 | (5) | 25,000 | 30,000 | 20,000 | $ | 40.00 | 5/9/2026 | ||||||||||||||||
| 5/9/2016 | (6) | — | — | 20,000 | $ | 16.57 | 5/9/2026 | |||||||||||||||||
| 9/20/2016 | (4) | 6,000 | 6,000 | 8,000 | $ | 40.00 | 9/20/2026 | |||||||||||||||||
| Brian Poulliot |
2/10/2012 | (3) | 840 | — | — | $ | 12.50 | 2/10/2022 | ||||||||||||||||
| 9/26/2012 | (3) | 29,000 | — | — | $ | 29.79 | 9/26/2022 | |||||||||||||||||
| 9/20/2016 | (4) | 3,525 | 3,525 | 4,700 | $ | 40.00 | 9/20/2026 | |||||||||||||||||
| 12/5/2016 | (4) | 9,000 | 9,000 | 12,000 | $ | 49.00 | 12/5/2026 | |||||||||||||||||
| (1) | 10% of the option vested on December 31, 2015, 30% of the option vested on December 31, 2016, 30% of the option vested on December 31, 2017 and the remaining portion of the option is eligible to vest on December 31, 2018, subject to Mr. Baldwin’s continued employment by us. In addition, the option fully vests and becomes exercisable immediately prior to a change in control, subject to Mr. Baldwin’s continued employment by us through the consummation of such change in control. Upon a termination by the Company without Cause, by the executive for Good Reason, or due to his death or disability, in each case, during the three month period immediately prior to any December 31st on which an installment is eligible to vest, a prorated percentage of the shares will vest. |
| (2) | 30% of the option is time-vesting and the remaining 70% of the option is performance-vesting. The time-vesting portion of the option vests as follows: 1/7th of the time-vesting option vested on July 1, 2016 and the remaining 6/7ths of the time-vesting option vests in equal ratable installments on the last calendar day of each month from July 2016 to December 2018, subject to Mr. Baldwin’s continued employment by us. In addition, the time-vesting option fully vests and becomes exercisable immediately prior to a change in control, subject to Mr. Baldwin’s continued employment by us through the consummation of such change in control. |
The performance-vesting portion of the option vests in three equal ratable installments upon the determination of EBITDA for fiscal year 2016, 2017 and 2018, respectively based on achievement of specified EBITDA targets. The fiscal year 2016 installment vested and following the end of the 2017 fiscal year, the fiscal year 2017 installment vested. Please see “Long-Term Equity Incentives” for further information on acceleration provisions for these option grants.
| (3) | 60% of the option vested in five equal installments on each of the first five anniversaries of September 30, 2011, subject to the executive’s continued employment by us. The remaining 40% of the option was scheduled to vest on or within 120 days following January 31 of each fiscal year 2012 through 2016, if the EBITDA as of such January 31 equaled or exceeded a specified EBITDA target. Such option is now fully vested. |
| (4) | 60% of the option is time-vesting and the remaining 40% of the option is performance-vesting. 30% of the option vested on September 30, 2017 (December 5, 2017 for Mr. Poulliot’s December 2016 grant), and 30% of the option is eligible to become vested on September 30, 2018 (December 5, 2018 for Mr. Poulliot’s December 2016 grant), subject to the executives continued employment by us through such date. 20% of the option vested following the end of the 2017 fiscal year because of the Company’s achievement of its EBITDA target for fiscal year 2017. The remaining 20% of the option is eligible to become vested upon the |
118
Table of Contents
| achievement of a specified EBITDA target for fiscal year 2018, subject to the executive’s continued employment by us through such date. Upon a termination of employment by the Company without Cause or the executive for Good Reason, or due to the executive’s death or disability, in each case, during the three-month period immediately prior to any September 30th (December 5th for Mr. Poulliot’s December 2016 grant) on which a time-vesting installment is eligible to vest, a pro-rated percentage of the option will vest. Please see “Long-Term Equity Incentives” for further information on acceleration provisions for these option grants. Due to Mr. Catuna’s retirement, no portion of the option that is unexercisable as of his termination of service will thereafter become exercisable. |
| (5) | 60% of the option is time-vesting and the remaining 40% of the option is performance-vesting. One-third of the time-vesting portion of the option vests on May 9th of each year from 2017 through 2019, subject to the executive’s continued employment by us. Two-thirds of the time-vesting portion of the option has now vested. One-third of the performance-vesting portion of the option vests on or within 120 days following the last day of each of the fiscal years 2016 through 2018 if the EBITDA for such fiscal year equals or exceeds the EBITDA target for such year. The fiscal year 2016 installment vested and following the end of the 2017 fiscal year, the fiscal year 2017 installment vested. Upon a termination of employment by the Company without Cause or the executive for Good Reason, or due to the executive’s death or disability, in each case, during the three-month period immediately prior to any May 9th on which a time-vesting installment is eligible to vest, a pro-rated percentage of the option will vest. Please see “Long-Term Equity Incentives” for further information on acceleration provisions for these option grants. |
| (6) | The option would have become vested immediately prior to a change in control, if the change in control had occurred prior to May 9, 2018 and the executive remained employed by us through such date. |
Fiscal Year 2017 Option Exercises and Stock Vested
The following table summarizes stock option exercises by and vesting of stock applicable to our named executive officers during the fiscal year 2017:
| Option Awards | ||||||||
| Name |
Number of Shares Acquired on Exercise (#) |
Value Realized on Exercise($)(1) |
||||||
| Peter Amalfi |
39,248 | $ | 4,683,975 | |||||
| (1) | Represents the difference between the fair market value of the shares acquired on exercise, as determined by the most current valuation of our common stock prior to such exercise, and the exercise price of the option |
Nonqualified Deferred Compensation
The following table provides information regarding our Executive Retirement Plan for fiscal year 2017:
| Name |
Executive contributions in last fiscal year($) |
Company contributions in last fiscal year($)(1) |
Aggregate earnings in last fiscal year ($) |
Aggregate withdrawals/ distributions ($) |
Aggregate balance at last fiscal year end($) |
|||||||||||||||
| Christopher J. Baldwin |
— | 52,538 | (2) | (1,804 | ) | — | 66,788 | |||||||||||||
| Robert W. Eddy |
— | 29,198 | 45,592 | — | 324,032 | |||||||||||||||
| Cornel Catuna |
— | 25,084 | 20,488 | — | 228,593 | |||||||||||||||
| Lee Delaney |
— | 32,831 | (2) | (747 | ) | — | 22,021 | |||||||||||||
| Brian Poulliot |
— | 20,356 | 11,913 | — | 109,891 | |||||||||||||||
| Peter Amalfi |
— | 15,581 | 51,435 | — | 386,044 | |||||||||||||||
| (1) | Company contributions in the last fiscal year are also reflected in the Summary Compensation Table. |
119
Table of Contents
| (2) | Mr. Baldwin and Mr. Delaney have not yet accrued four years of credited service. However, we have elected to make Annual Retirement Contributions on behalf of Mr. Baldwin and Mr. Delaney. If Mr. Baldwin’s or Mr. Delaney’s employment is terminated prior to achieving four years of credited service, such officer will forfeit all Company contributions previously made on his behalf under the plan. Because these amounts have not yet vested and are subject to forfeiture if Mr. Baldwin’s or Mr. Delaney’s employment, as applicable, is terminated prior to achieving four years of credited service, the amounts have not been included as compensation in our current Summary Compensation Table. We expect that in the year Mr. Baldwin or Mr. Delaney, as applicable, achieves four years of credited service, all Company contributions to date under the Executive Retirement Plan and all related tax gross-ups will be included in the Summary Compensation Table for such year. For further information, please see “Non-Qualified Executive Retirement Plan.” |
Non-Qualified Executive Retirement Plan
We maintain a non-qualified executive retirement plan in which a select group of our management and highly compensated employees are eligible to participate. Participants are selected by the compensation committee and are entitled to company contributions within 60 days of fiscal year end under the plan (the “Annual Retirement Contribution”) if they are actively employed by the Company on the last day of a plan year or if they are terminated prior to the end of the plan year due to (i) retirement on or after the attainment of age 55 or (ii) disability. Each year the Company makes an Annual Retirement Contribution to each participant under this plan with at least four years of credited service in an amount equal to at least 3% of the participant’s after tax base salary earned for such year. Annual Retirement Contributions to participants with at least four years of service are considered taxable income to the participants, and we make an additional tax gross-up contribution to each of these participants each year. For participants with less than four years of service by the end of the applicable plan year, the participant will accrue the right to an Annual Retirement Contribution each year, and, subject to continued employment, in the plan year in which the participant is first credited with four years of service, the Company will make an aggregate retirement contribution on behalf of the participant equal to the amount of the Annual Retirement Contribution for the applicable plan year and the previous three plan years (along with a tax gross-up contribution). Notwithstanding the foregoing, we have elected to make Annual Retirement Contributions on behalf of Messrs. Baldwin and Delaney, though they have not yet achieved four years of credited service. If Mr. Baldwin’s or Mr. Delaney’s employment is terminated prior to achieving four years of credited service, such officer will forfeit any Company contributions made under the plan. No tax gross up payments have been made to Messrs. Baldwin or Delaney to date. Upon a change of control, each participant with less than four years of credited service will become fully vested in any benefit accrued under the plan, and each participant will receive an Annual Retirement Contribution for the year in which the change of control occurs.
Participants generally may elect to invest their balance under the Executive Retirement Plan in a variety of different tax-deferred investment vehicles. However, the Company selects the investments with respect to Annual Retirement Contributions made on behalf of Mr. Baldwin and Mr. Delaney since they have not yet achieved four years of credited service.
Potential Payments Upon Termination or Change in Control
As discussed above, we have entered into employment agreements and option agreements with our named executive officers, which provide for certain payments upon a qualifying termination of employment or a change in control.
Summary of Potential Payments Upon a Termination or Change in Control
The following table summarizes the payments that would be made to our named executive officers upon the occurrence of a qualifying termination of employment or change in control, assuming that each named executive
120
Table of Contents
officer’s termination of employment with the Company or a change in control occurred on February 3, 2018. Amounts shown do not include (i) accrued but unpaid salary through the date of termination, and (ii) other benefits earned or accrued by the named executive officer during his or her employment that are available to all salaried employees, such as accrued vacation.
| Name |
Benefit |
Termination without Cause ($) |
Termination due to death or Disability ($) |
Change in Control ($) |
Qualifying Termination without Cause in connection with a Change in Control ($) |
|||||||||||||
| Christopher J. Baldwin |
Severance Benefit(1) | 2,000,000 | — | — | 2,000,000 | |||||||||||||
| Continuation of Health Benefits(2) | 17,725 | — | — | 17,725 | ||||||||||||||
| Value of Accelerated Stock Options(3) | — | — | 2,357,857 | 2,357,857 | ||||||||||||||
| Annual Bonus(4) | 1,129,308 | 1,129,308 | — | — | ||||||||||||||
| Other(7) | — | — | — | 170,805 | ||||||||||||||
| Robert W. Eddy |
Severance Benefit(5) | 1,120,000 | — | — | 1,120,000 | |||||||||||||
| Continuation of Health Benefits(6) | 34,126 | — | — | 34,126 | ||||||||||||||
| Value of Accelerated Stock Options(3) | — | — | 840,000 | 840,000 | ||||||||||||||
| Annual Bonus(4) | 376,571 | 376,571 | — | — | ||||||||||||||
| Other(7) | — | — | — | 52,436 | ||||||||||||||
| Cornel Catuna |
Severance Benefit(5) | 960,000 | — | — | 960,000 | |||||||||||||
| Continuation of Health Benefits(6) | 35,452 | — | — | 35,452 | ||||||||||||||
| Value of Accelerated Stock Options(3) | — | — | 630,000 | 630,000 | ||||||||||||||
| Annual Bonus(4) | 323,515 | 323,515 | — | — | ||||||||||||||
| Other(7) | — | — | — | 44,945 | ||||||||||||||
| Lee Delaney |
Severance Benefit(5) | 1,260,000 | 1,260,000 | |||||||||||||||
| Continuation of Health Benefits(6) | 33,102 | — | — | 33,102 | ||||||||||||||
| Value of Accelerated Stock Options(3) | — | — | 2,988,600 | 1,068,600 | ||||||||||||||
| Annual Bonus(4) | 423,427 | 423,427 | — | — | ||||||||||||||
| Other(7) | — | — | — | 86,432 | ||||||||||||||
| Brian Poulliot |
Severance Benefit(5) | 780,000 | 780,000 | |||||||||||||||
| Continuation of Health Benefits(6) | 35,470 | — | — | 35,470 | ||||||||||||||
| Value of Accelerated Stock Options(3) | — | — | 687,750 | 687,750 | ||||||||||||||
| Annual Bonus(4) | 262,532 | 262,532 | — | — | ||||||||||||||
| Other(7) | — | — | — | 36,518 | ||||||||||||||
| (1) | Such amount includes twelve months’ base salary and the executive’s target annual cash bonus, payable in substantially equal installments for twelve months after termination and in a single lump sum in respect of a qualifying termination occurring on or following a change in control. This amount is also payable upon a termination by Mr. Baldwin for Good Reason. |
| (2) | Such amount includes the difference between the executive’s actual COBRA premium costs and the amount the executive would have paid had he continued coverage as an employee under the Company’s applicable |
121
Table of Contents
| health plans for twelve months. This amount is also payable upon a termination by Mr. Baldwin for Good Reason. |
| (3) | Mr. Baldwin’s 2015 option grant becomes fully vested immediately prior to a change in control, subject to Mr. Baldwin’s continued employment by us through the consummation of such change in control. In addition, the time-vesting portion of Mr. Baldwin’s 2016 option grant fully vests and becomes exercisable immediately prior to a change in control, subject to Mr. Baldwin’s continued employment by us through the consummation of such change in control. The performance vesting portion of Mr. Baldwin’s 2016 option grant fully accelerates and vests immediately prior to a change in control that results in either our principal stockholders (i) receiving proceeds equal to at least 2.5 times their investment or (ii) an internal rate of return of at least 30%, subject to Mr. Baldwin’s continued employment by us through the consummation of such change in control. |
The time-vesting portion of Messrs. Eddy, Catuna, Delaney and Poulliot’s 2016 option grants and any installment of the performance-vesting portion of the option that has not yet become eligible to vest, shall accelerate and become fully vested upon a change in control subject to the executive’s continued employment by us through the consummation of such change in control. If upon a change in control our principal stockholders receive proceeds greater than or equal to 2.5 times their investment or a 30% return on their investment, 100% of these option grants shall accelerate and become fully vested, subject to the executive’s continued employment by us through the consummation of such change in control.
Mr. Delaney’s May 2016 option grant is subject to vesting only upon a change in control, if such change in control occurred prior to May 9, 2018, subject to his continued employment by us. Because such change in control did not occur, such option did not vest. The value of the acceleration of this grant would have been $1,068,000 if a change in control had occurred at the end of fiscal year 2017. Upon a change in control, the time-vesting portion of the second May option grant to Mr. Delaney and any installment of the performance-vesting portion of this option grant that has not yet become eligible to vest shall accelerate and become fully vested, subject to the executive’s continued employment by us through such change in control date. The May 2016 option grant to Mr. Delaney fully accelerates and vests if upon a change in control our principal stockholders receive proceeds greater than or equal to 2.5 times their investment or a 30% return on their investment. Upon a change in control where such thresholds are not met, the time-vesting portion of this option grant and any installment of the performance-vesting portion of this option grant that has not yet become eligible to vest shall accelerate and become fully vested.
Please see “Long-Term Equity Incentives” for further information on the accelerated vesting provisions of our option grants.
| (4) | This amount reflects a pro rata portion of the annual cash bonus to which the executive would have been entitled had he remained employed by the Company until the end of the fiscal year. This amount is also payable upon a termination by Mr. Baldwin for Good Reason. |
| (5) | Such amount includes 24 months’ base salary, payable in substantially equal installments for 24 months after termination. |
| (6) | Such amount includes the difference between the executive’s actual COBRA premium costs and the amount the executive would have paid had he continued coverage as an employee under the Company’s applicable health plans for twenty-four months. |
| (7) | This amount reflects the value of accelerated vesting under the executive retirement plan for each of the named executive officers except for Mr. Baldwin. For Mr. Baldwin the amount reflects the value of accelerated vesting under the executive retirement plan ($166,414) and the value of accelerated vesting under the 401(k) plan ($4,391). |
Peter Amalfi
Mr. Amalfi retired on October 28, 2017. He received (i) continued payment of his base salary for 104 weeks (in an aggregate amount of $809,994), (ii) the amount equal to the difference between Mr. Amalfi’s actual
122
Table of Contents
COBRA premium costs and the amount Mr. Amalfi would have paid had he continued coverage as an employee under the Company’s applicable health plans for up to 104 weeks (in an aggregate amount of $24,927), (iii) outplacement assistance for 12 months (in an aggregate amount of $16,000), which Mr. Amalfi did not elect to receive and (iv) a prorated award under the Annual Incentive Plan (in an amount equal to $200,207). The retirement payments and benefits were subject to Mr. Amalfi’s execution of a release of claims in favor of the Company and his compliance with the applicable restrictive covenants.
Cornel Catuna
After the end of fiscal year 2017, Mr. Catuna entered into a General Release and Separation Agreement with the Company pursuant to which he will retire from the Company as of July 2, 2018. From April 9, 2018 to July 2, 2018, Mr. Catuna is serving as an employee of the Company in a transitional role as determined by the Company’s President and Chief Executive Officer. After July 2, 2018, Mr. Catuna will receive (i) continuation of his base salary for a period of 24 months after termination, (ii) an amount equal to the difference between his actual COBRA premium costs and the amount he would have paid had he continued coverage as an employee under the Company’s applicable health plans for up to 24 months, (iii) a pro rata portion of any amounts he would have been entitled to receive under the Company’s annual incentive compensation plan had he remained employed by the Company until the end of the fiscal year and (iv) any other payments or benefits arising from the his participation in other Company plans to the extent such plans provide for post-termination employment benefits, in consideration for the execution and non-revocation of the separation agreement (including the release therein), in addition to any (w) earned by unpaid salary, automobile allowance and vested but unused vacation, (x) any amounts the executive is entitled to that are yet unpaid under the Annual Incentive Plan, (y) his vested account balance under our 401(k) plan, and (z) any unreimbursed expenses incurred in accordance with Company policy.
Director Compensation
The following table sets forth information concerning the compensation of our non-employee directors during fiscal year 2017:
| Name |
Fees Earned or Paid in Cash($)(1) |
All Other Compensation($)(2) |
Total($) | |||||||||
| Cameron Breitner |
— | — | — | |||||||||
| J. Kristopher Galashan |
— | — | — | |||||||||
| Lars Haegg |
— | — | — | |||||||||
| Ken Parent |
70,000 | 262,916 | 332,916 | |||||||||
| Jonathan A. Seiffer |
— | — | — | |||||||||
| Christopher J. Stadler |
— | — | — | |||||||||
| Robert Steele |
70,000 | 350,554 | 420,554 | |||||||||
| Tommy Yin |
— | — | — | |||||||||
| Laura Sen(3) |
1,050,625 | 21,071,223 | 22,121,848 | |||||||||
| (1) | Mr. Baldwin serves as our President and Chief Executive Officer and as a member of our board of directors. His compensation is fully reflected in the Summary Compensation Table, and, therefore, he is not included in the Director Compensation table. |
| (2) | Such amount reflects payments made to certain of our optionholders, including our directors, in connection with a dividend recapitalization in fiscal year 2017. Please see “Long-Term Equity Incentives” for further information on such payments. For Ms. Sen, this amount reflects a 2017 Retention Bonus of $18,906,548 and a 2013 Retention Bonus of $2,164,674 related to options awarded to her in connection with her prior service as the Company’s Chief Executive Officer. |
| (3) | Ms. Sen resigned as a member of our board of directors on March 29, 2018. |
123
Table of Contents
Messrs. Breitner, Galashan, Haegg, Seiffer, Stadler and Yin are affiliates of our Sponsors and did not receive any compensation from us for their services as non-employee directors. As of the end of fiscal year 2017, Mr. Parent, Mr. Steele, and Ms. Sen held 6,000, 4,500 and 272,800 outstanding options in the company, respectively. Ms. Sen’s options were awarded to her in prior years in connection with her service as the Company’s Chief Executive Officer. None of our other non-employee directors held any outstanding options in the Company.
Narrative Disclosure to Director Compensation Table
We historically have compensated non-employee members of our board of directors who are not affiliated with our Sponsors for their service as directors in the form of a retainer of $70,000 per year and a grant of nonqualified stock options. We may in the future decide to pay monetary compensation and/or grant equity awards in connection with the appointment of, or continued service by, a director to our board of directors, from time to time. In fiscal year 2017, each non-employee member of our board of directors was paid $70,000, and we did not grant any nonqualified stock option awards to non-employee members of our board of directors.
The Company also reimburses those directors for any travel or other business expenses related to their service as a director.
In connection with this offering, our board of directors intends to adopt a non-employee director compensation policy and stock ownership guidelines.
Nishad Chande was appointed to our board of directors in May 2018. He is affiliated with our Sponsors, and, therefore, he will not receive any compensation for his service as a non-employee director.
Non-Executive Chairman Agreement with Laura Sen
On January 6, 2016, the Company entered into an agreement with Ms. Sen who previously served as our chief executive officer, effective as of January 31, 2016, pursuant to which Ms. Sen would serve as the non-executive chairman of our board of directors. The term of Ms. Sen’s service under the agreement was for a period of two years beginning on January 31, 2016. Ms. Sen was entitled to a base salary of $1,050,625 per year, and an annual cash bonus with respect to the fiscal year ending on January 31, 2016. Ms. Sen was also subject to 24-month post-termination non-competition and non-solicitation covenants commencing on the effective date of such agreement. Ms. Sen resigned from our board of directors on March 29, 2018.
Incentive Award Plans
2011 Plan
We currently sponsor the Fourth Amended and Restated 2011 Stock Option Plan of BJ’s Wholesale Club Holdings, Inc., or the 2011 Plan, in order to incentivize our employees, consultants and independent directors. The 2011 Plan permits the grant of non-qualified and incentive stock options. When initially adopted, an aggregate of 605,901 shares were reserved for issuance, but the 2011 Plan has been amended to increase the total number of shares available for issuance under the 2011 Plan to 1,536,802 shares. As of February 3, 2018, options to purchase 1,268,460 shares of our common stock, at a weighted average exercise price per share of $27.94, were outstanding under the 2011 Plan. As of February 3, 2018, 50,742 shares of our common stock remained available for future issuance under the 2011 Plan.
Administration. The compensation committee administers the 2011 Plan and the stock options granted under it. Notwithstanding the foregoing, the full board of directors conducts the general administration of the 2011 Plan with respect to options granted to independent directors. Under the 2011 Plan, the compensation committee has the authority to select employees and consultants to be granted options, determine the number of shares to be subject to such options and determine the terms and conditions of such options.
Acquisitions. The 2011 Plan provides that immediately prior to a qualifying change in control, the compensation committee will grant options to purchase a number of shares of common stock equal to 102,900,
124
Table of Contents
less the number of shares subject to options granted after the closing of our acquisition by our Sponsors (and excluding certain grants to our Vice Presidents and new hires) to individuals who received options on the closing of our acquisition by our Sponsors (in amounts as determined by the compensation committee in its sole discretion). Such options will be fully and solely exercisable upon the consummation of the qualifying change in control.
The 2011 Plan provides that in the event of any stock split, spin-off, share combination, reclassification, recapitalization, liquidation, dissolution, reorganization, merger, change in control, payment of a dividend or distribution or other similar transaction or occurrence which affects our equity securities or the value thereof, the compensation committee shall (i) adjust the number and kind of shares subject to the 2011 Plan and available for or covered by options, (ii) adjust the exercise prices related to outstanding options, and/or (iii) take such other action (including, without limitation providing for payment of a cash amount to holders of outstanding options and adjusting performance targets) as it deems reasonably necessary to address, on an equitable basis, the effect of the applicable corporate event on the 2011 Plan and any outstanding options.
Transferability. Options granted under the 2011 Plan are generally not transferable other than by will or the laws of descent and distribution.
Plan Amendment or Termination. The compensation committee or our board of directors has the authority to amend, suspend or terminate the 2011 Plan, although certain material amendments require the approval of our stockholders, and amendments that would impair the rights of any participant require the consent of that participant.
We expect that on and after the completion of this offering and following the effectiveness of the 2018 Plan, as described below, no further grants will be made under the 2011 Plan, though existing awards will remain outstanding.
2012 Director Plan
We currently sponsor the 2012 Director Stock Option Plan of BJ’s Wholesale Club Holdings, Inc., as amended, or the 2012 Director Plan, in order to incentivize our independent directors. The 2012 Director Plan permits the grant of non-qualified stock options only and an aggregate of 25,000 shares were initially reserved for issuance and [50,000] are now reserved. As of February 3, 2018, options to purchase 10,500 shares of our common stock, at a weighted average exercise price per share of $28.14, were outstanding under the 2012 Director Plan. As of February 3, 2018, 39,500 shares of our common stock remained available for future issuance under the 2012 Director Plan.
Administration. Our board of directors conducts the general administration of the 2012 Director Plan with respect to options granted to independent directors. Our board of directors has the authority to select the independent directors to be granted options, determine the number of shares to be subject to such options and determine the terms and conditions of such options.
Acquisitions. The 2012 Director Plan provides that in the event of any stock split, spin-off, share combination, reclassification, recapitalization, liquidation, dissolution, reorganization, merger, change in control, payment of a dividend or distribution or other similar transaction or occurrence which affects our equity securities or the value thereof, our board of directors shall (i) adjust the number and kind of shares subject to the 2012 Director Plan and available for or covered by options, (ii) adjust the exercise prices related to outstanding options, and/or (iii) take such other action (including, without limitation, providing for payment of a cash amount to holders of outstanding options and adjusting performance targets) as it deems reasonably necessary to address, on an equitable basis, the effect of the applicable corporate event on the 2012 Director Plan and any outstanding options.
125
Table of Contents
Transferability. Options granted under the 2012 Director Plan are generally not transferable other than by will or the laws of descent and distribution.
Plan Amendment or Termination. Our board of directors has the authority to amend, suspend or terminate the 2012 Director Plan, although any amendments that would impair the rights of any participant require the consent of that participant.
We expect that on and after the completion of this offering and following the effectiveness of the 2018 Plan, as described below, no further grants will be made under the 2012 Director Plan, though existing awards will remain outstanding.
2018 Incentive Award Plan
We intend to adopt the 2018 Incentive Award Plan, or the 2018 Plan, subject to approval by our stockholders, under which we may grant cash and equity-based incentive awards to eligible service providers in order to attract, motivate and retain the talent for which we compete. The material terms of the 2018 Plan, as it is currently contemplated, are summarized below. Our board of directors is still in the process of developing, approving and implementing the 2018 Plan and, accordingly, this summary is subject to change.
Eligibility and Administration. Our employees, consultants and directors, and employees, consultants and directors of our subsidiaries will be eligible to receive awards under the 2018 Plan. Following our initial public offering, the 2018 Plan will be administered by our board of directors with respect to awards to non-employee directors and by the compensation committee with respect to other participants, each of which may delegate its duties and responsibilities to committees of our directors and/or officers (referred to collectively as the plan administrator below), subject to certain limitations that may be imposed under Section 16 of the Securities Exchange Act of 1934, as amended, or the Exchange Act, and/or stock exchange rules, as applicable. The plan administrator will have the authority to make all determinations and interpretations under, prescribe all forms for use with, and adopt rules for the administration of, the 2018 Plan, subject to its express terms and conditions. The plan administrator will also set the terms and conditions of all awards under the 2018 Plan, including any vesting and vesting acceleration conditions.
Limitation on Awards and Shares Available. The aggregate number of shares of our common stock that will be available for issuance under awards granted pursuant to the 2018 Plan is the sum of (i) and (ii) an annual increase on the first day of each year beginning in 2019 and ending in 2023, equal to the lesser of (A) of the outstanding shares on the last day of the immediately preceding fiscal year and (B) such smaller amount as determined by our board of directors, provided, however, no more than shares may be issued upon the exercise of incentive stock options. The shares may be authorized but unissued shares, or shares purchased in the open market. If an award under the 2018 Plan is forfeited, expires or is settled for cash, any shares subject to such award may, to the extent of such forfeiture, expiration or cash settlement, be used again for new grants under the 2018 Plan. Additionally, shares tendered or withheld to satisfy grant or exercise price or tax withholding obligations associated with an award will be added to the shares authorized for grant. The following shares may not be used again for grant under the 2018 Plan: (1) shares subject to a stock appreciation right, or SAR, that are not issued in connection with the stock settlement of the SAR on its exercise and (2) shares purchased on the open market with the cash proceeds from the exercise of options.
Awards granted under the 2018 Plan upon the assumption of, or in substitution for, awards authorized or outstanding under a qualifying equity plan maintained by an entity with which we enter into a merger or similar corporate transaction will not reduce the shares available for grant under the 2018 Plan. The sum of the grant date fair value of equity-based awards and the amount of any cash-based awards that may be granted to any non-employee director pursuant to the 2018 Plan during any calendar year may not exceed $ .
Awards. The 2018 Plan provides for the grant of stock options, including incentive stock options, or ISOs, and nonqualified stock options, or NSOs, restricted stock, dividend equivalents, stock payments, restricted stock
126
Table of Contents
units, or RSUs, performance shares, other incentive awards, stock appreciation rights, or SARs, and cash awards. No determination has been made as to the types or amounts of awards that will be granted to specific individuals pursuant to the 2018 Plan other than Mr. Baldwin’s restricted stock grant (Please see “Executive Compensation Program Components—2018 IPO Equity Awards”). Certain awards under the 2018 Plan may constitute or provide for a deferral of compensation, subject to Section 409A of the Code, which may impose additional requirements on the terms and conditions of such awards. All awards under the 2018 Plan will be set forth in award agreements, which will detail all terms and conditions of the awards, including any applicable vesting and payment terms and post-termination exercise limitations. Awards other than cash awards generally will be settled in shares of our common stock, but the plan administrator may provide for cash settlement of any award. A brief description of each award type follows.
| • | Stock Options. Stock options provide for the purchase of shares of our common stock in the future at an exercise price set on the grant date. ISOs, by contrast to NSOs, may provide tax deferral beyond exercise and favorable capital gains tax treatment to their holders if certain holding period and other requirements of the Code are satisfied. The exercise price of a stock option may not be less than 100% of the fair market value of the underlying share on the date of grant (or 110% in the case of ISOs granted to certain significant stockholders), except with respect to certain substitute options granted in connection with a corporate transaction. The term of a stock option may not be longer than ten years (or five years in the case of ISOs granted to certain significant stockholders). Vesting conditions determined by the plan administrator may apply to stock options and may include continued service, performance and/or other conditions. |
| • | SARs. SARs entitle their holder, upon exercise, to receive from us an amount equal to the appreciation of the shares subject to the award between the grant date and the exercise date. The exercise price of a SAR may not be less than 100% of the fair market value of the underlying share on the date of grant (except with respect to certain substitute SARs granted in connection with a corporate transaction) and the term of a SAR may not be longer than ten years. Vesting conditions determined by the plan administrator may apply to SARs and may include continued service, performance and/or other conditions. |
| • | Restricted Stock, RSUs and Performance Shares. Restricted stock is an award of nontransferable shares of our common stock that remain forfeitable unless and until specified conditions are met, and which may be subject to a purchase price. RSUs are contractual promises to deliver shares of our common stock in the future, which may also remain forfeitable unless and until specified conditions are met. Delivery of the shares underlying RSUs may be deferred under the terms of the award or at the election of the participant, if the plan administrator permits such a deferral. Performance shares are contractual rights to receive a range of shares of our common stock in the future based on the attainment of specified performance goals, in addition to other conditions which may apply to these awards. Conditions applicable to restricted stock, RSUs and performance shares may be based on continuing service, the attainment of performance goals and/or such other conditions as the plan administrator may determine. |
| • | Stock Payments, Other Incentive Awards and Cash Awards. Stock payments are awards of fully vested shares of our common stock that may, but need not, be made in lieu of base salary, bonus, fees or other cash compensation otherwise payable to any individual who is eligible to receive awards. Other incentive awards are awards other than those enumerated in this summary that are denominated in, linked to or derived from shares of our common stock or value metrics related to our shares, and may remain forfeitable unless and until specified conditions are met. Cash awards are cash incentive bonuses subject to performance goals. |
| • | Dividend Equivalents. Dividend equivalents represent the right to receive the equivalent value of dividends paid on shares of our common stock and may be granted alone or in tandem with awards. Dividend equivalents are credited as of dividend record dates during the period between the date an award is granted and the date such award vests, is exercised, is distributed or expires, as determined by the plan administrator. |
127
Table of Contents
Certain Transactions. The plan administrator has broad discretion to take action under the 2018 Plan, as well as make adjustments to the terms and conditions of existing and future awards, to prevent the dilution or enlargement of intended benefits and facilitate necessary or desirable changes in the event of certain transactions and events affecting our common stock, such as stock dividends, stock splits, mergers, acquisitions, consolidations and other corporate transactions. In addition, in the event of certain non-reciprocal transactions with our stockholders known as “equity restructurings,” the plan administrator will make equitable adjustments to the 2018 Plan and outstanding awards. In the event of a change in control of our company (as defined in the 2018 Plan), if an award is continued, assumed or replaced by the surviving entity, and a participant incurs a termination of service without “cause” (as such term is defined in the discretion of the plan administrator or as set out in an award agreement) upon or within twenty-four months following the change in control, the participant’s award shall become fully vested. To the extent that the surviving entity declines to continue, convert, assume or replace outstanding awards, then the plan administrator may cause all such awards to become fully vested and exercisable in connection with the transaction or to terminate in exchange for cash, rights or other property. Upon or in anticipation of a change of control, the plan administrator may cause any outstanding awards to terminate at a specified time in the future and give the participant the right to exercise such awards during a period of time determined by the plan administrator in its sole discretion. Individual award agreements may provide for additional accelerated vesting and payment provisions.
Foreign Participants, Claw-Back Provisions, Transferability, and Participant Payments. The plan administrator may modify award terms, establish subplans and/or adjust other terms and conditions of awards, subject to the share limits described above, in order to facilitate grants of awards subject to the laws and/or stock exchange rules of countries outside of the United States. All awards will be subject to the provisions of any claw-back policy implemented by us to the extent set forth in such claw-back policy and/or in the applicable award agreement. With limited exceptions for estate planning, domestic relations orders, certain beneficiary designations and the laws of descent and distribution, awards under the 2018 Plan are generally non-transferable prior to vesting, and are exercisable only by the participant. With regard to tax withholding, exercise price and purchase price obligations arising in connection with awards under the 2018 Plan, the plan administrator may, in its discretion, accept cash or check, shares of our common stock that meet specified conditions, a “market sell order” or such other consideration as it deems suitable.
Plan Amendment and Termination. Our board of directors may amend or terminate the 2018 Plan at any time; however, except in connection with certain changes in our capital structure, stockholder approval will be required for any amendment that increases the number of shares available under the 2018 Plan, “reprices” any stock option or SAR, or cancels any stock option or SAR in exchange for cash or another award when the option or SAR price per share exceeds the fair market value of the underlying shares. No award may be granted pursuant to the 2018 Plan after the tenth anniversary of the date on which our board of directors adopts the 2018 Plan.
Section 162(m) Reliance Period. The 2018 Plan provides that to the maximum extent permitted under applicable law, all awards granted pursuant to the 2018 Plan shall be interpreted to qualify for any post-public offering reliance period deduction limit exception set forth in U.S. Treasury Regulation 1.162-27(f) (or any successor thereto). Under current law, for newly public companies, Section 162(m) offers a transition relief period during which time the $1,000,000 deduction limitation does not apply to certain plans or arrangements that existed before the company became publicly held. A company may generally rely on this transition relief period until the earliest of (i) the expiration of the plan; (ii) the material modification of the plan; (iii) the issuance of all employer stock and other compensation allocated under the plan; or (iv) the first meeting of stockholders at which directors are to be elected that occurs after the close of the third calendar year following the calendar year in which the initial public offering occurs or, in the case of a private company that becomes publicly held without an initial public offering, the first calendar year following the calendar year in which the company becomes publicly held.
128
Table of Contents
2018 Employee Stock Purchase Plan
In connection with this offering, we intend to adopt, subject to approval by our stockholders, the 2018 Employee Stock Purchase Plan, or the ESPP. Our employees, other than our executive officers, will be allowed to participate in our ESPP, subject to the eligibility requirements described below. The material terms of the ESPP, as it is currently contemplated, are summarized below. Our board of directors is still in the process of developing, approving and implementing the ESPP and, accordingly, this summary is subject to change.
The aggregate number of shares of our common stock that will be reserved for issuance under our ESPP will be equal to the sum of (i) shares and (ii) an annual increase on the first day of each year beginning in 2019 and ending in 2028, equal to the lesser of (A) shares, (B) % of the shares outstanding (on an as-converted basis) on the last day of the immediately preceding fiscal year and (C) such smaller number of shares as determined by our board of directors. Our board of directors or its committee will have full and exclusive authority to interpret the terms of the ESPP and determine eligibility. Our compensation committee will be the initial administrator of the ESPP.
Our employees, other than our executive officers, and the employees of our subsidiaries will be eligible to participate in the ESPP if they are customarily employed by us or any participating subsidiary for at least 20 hours per week and more than five months in any calendar year. However, an employee may not be granted rights to purchase stock under our ESPP if such employee, immediately after the grant, would own (directly or through attribution) stock possessing 5% or more of the total combined voting power or value of all classes of our common stock.
Our ESPP will be intended to qualify under Section 423 of the Code and stock will be offered under the ESPP during offering periods. The length of the offering periods under the ESPP will be determined by our compensation committee and may be up to months long. Employee payroll deductions will be used to purchase shares on each purchase date during an offering period. The purchase dates will be determined by the compensation committee for each offering period, but will generally be the last day in each offering period. Offering periods under the ESPP will commence when determined by our compensation committee. The compensation committee may, in its discretion, modify the terms of future offering periods.
Our ESPP will permit participants to purchase common stock through payroll deductions of up to % of their eligible compensation, which includes a participant’s gross base compensation for services to the company, including overtime payments, but excluding commissions, incentive compensation, bonuses, expense reimbursements, fringe benefits and other special payments. A participant will be permitted to purchase a maximum of shares of common stock during each offering period. In addition, no employee will be permitted to accrue the right to purchase stock under the ESPP at a rate in excess of $ worth of shares during any calendar year during which such a purchase right is outstanding (based on the fair market value per share of our common stock as of the first day of the offering period).
On the first trading day of each offering period, each participant will be automatically granted an option to purchase shares of our common stock. The option will expire at the end of the offering period or upon termination of employment, whichever is earlier, but is exercised at the end of each purchase period to the extent of the payroll deductions accumulated during such purchase period. The purchase price of the shares will be . Participants may end their participation at any time during an offering period, and will be paid their accrued payroll deductions that have not yet been used to purchase shares of common stock. Participation will end automatically upon termination of employment with us.
A participant may not transfer rights granted under the ESPP other than by will, the laws of descent and distribution or as otherwise provided under the ESPP.
In the event of certain significant transactions or a “Change in Control” (as defined in the ESPP), the compensation committee may provide for (i) either the replacement or termination of outstanding rights in
129
Table of Contents
exchange for cash, (ii) the assumption or substitution of outstanding rights by the successor or survivor corporation or parent or subsidiary thereof, if any, (iii) the adjustment in the number and type of shares of stock subject to outstanding rights, (iv) the use of participants’ accumulated payroll deductions to purchase stock on a new purchase date prior to the next purchase date and termination of any rights under ongoing offering periods or (v) the termination of all outstanding rights.
The compensation committee may amend, suspend or terminate the ESPP. However, stockholder approval of any amendment to the ESPP will be obtained for any amendment which changes the aggregate number or type of shares that may be sold pursuant to rights under the ESPP, changes the corporations or classes of corporations whose employees are eligible to participate in the ESPP or changes the ESPP in any manner that would cause the ESPP to no longer be an employee stock purchase plan within the meaning of Section 423(b) of the Code.
Federal Income Taxes. The material federal income tax consequences of the ESPP under current federal income tax law are summarized in the following discussion, which deals with the general tax principles applicable to the ESPP. The following discussion is based upon laws, regulations, rulings and decisions now in effect, all of which are subject to change. Foreign, state and local tax laws, and employment, estate and gift tax considerations are not discussed due to the fact that they may vary depending on individual circumstances and from locality to locality.
The ESPP, and the right of participants to make purchases thereunder, will be intended to qualify under the provisions of Section 423 of the Code. Under the applicable Code provisions, no income will be taxable to a participant until the sale or other disposition of the shares purchased under the ESPP. This means that an eligible employee will not recognize taxable income on the date the employee is granted an option under the ESPP (i.e., the first day of the offering period). In addition, the employee will not recognize taxable income upon the purchase of shares. Upon such sale or disposition, the participant will generally be subject to tax in an amount that depends upon the length of time such shares are held by the participant prior to disposing of them. If the shares are sold or disposed of more than two years from the first day of the offering period during which the shares were purchased and more than one year from the date of purchase, or if the participant dies while holding the shares, the participant (or his or her estate) will recognize ordinary income measured as the lesser of (1) the excess of the fair market value of the shares at the time of such sale or disposition over the purchase price or (2) an amount equal to 85% of the fair market value of the shares as of the first day of the offering period. Any additional gain will be treated as long-term capital gain. If the shares are held for the holding periods described above but are sold for a price that is less than the purchase price, there will be no ordinary income and the participating employee has a long-term capital loss for the difference between the sale price and the purchase price.
If the shares are sold or otherwise disposed of before the expiration of the holding periods described above, the participant will recognize ordinary income generally measured as the excess of the fair market value of the shares on the date the shares are purchased over the purchase price and we will be entitled to a tax deduction for compensation expense in the amount of ordinary income recognized by the employee. Any additional gain or loss on such sale or disposition will be long-term or short-term capital gain or loss, depending on how long the shares were held following the date they were purchased by the participant prior to disposing of them. If the shares are sold or otherwise disposed of before the expiration of the holding periods described above but are sold for a price that is less than the purchase price, the participant will recognize ordinary income equal to the excess of the fair market value of the shares on the date of purchase over the purchase price (and we will be entitled to a corresponding deduction), but the participant generally will be able to report a capital loss equal to the difference between the sales price of the shares and the fair market value of the shares on the date of purchase.
130
Table of Contents
Equity Compensation Plan Information
The following table provides information as of February 3, 2018 regarding compensation plans under which our equity securities are authorized for issuance:
| Plan Category |
Number of Securities to be Issued Upon Exercise of Outstanding Options, Warrants and Rights |
Weighted Average Exercise Price of Outstanding Options, Warrants and Rights |
Number of Securities Remaining Available for Future Issuance Under Equity Compensation Plans |
|||||||||
| Equity compensation plans approved by stockholders(1) |
1,278,960 | $ | 27.94 | 90,242 | ||||||||
| Equity compensation plans not approved by stockholders |
||||||||||||
| Total |
||||||||||||
| (1) | Consists of the 2011 Plan and the 2012 Director Plan. |
131
Table of Contents
PRINCIPAL AND SELLING STOCKHOLDERS
The following table sets forth information regarding the beneficial ownership of our common stock as of March 31, 2018, and pro forma to reflect the sale of the shares of common stock offered in this offering for:
| • | each person or entity who is known by us to beneficially own more than 5% of our common stock; |
| • | each of our directors and named executive officers; |
| • | all of our directors and executive officers as a group; and |
| • | each selling stockholder. |
Information with respect to beneficial ownership has been furnished to us by each director, executive officer or stockholder listed in the table below, as the case may be. The amounts and percentages of our common stock beneficially owned are reported on the basis of rules of the SEC governing the determination of beneficial ownership of securities. Under these rules, a person is deemed to be a “beneficial owner” of a security if that person has or shares “voting power,” which includes the power to vote or direct the voting of such security, or “investment power,” which includes the power to dispose of or to direct the disposition of such security. A person is also deemed to be a beneficial owner of any securities of which that person has a right to acquire beneficial ownership within 60 days after March 31, 2018, including any shares of our common stock subject to an option that has vested or will vest within 60 days after March 31, 2018. More than one person may be deemed to be a beneficial owner of the same securities.
Percentage of beneficial ownership prior to this offering is based on shares of common stock outstanding as of March 31, 2018. Percentage of beneficial ownership after this offering is based on shares of common stock outstanding (assuming no exercise of the underwriters’ option to purchase additional shares), or shares of common stock outstanding (assuming full exercise of the underwriters’ option to purchase additional shares), in each case, after giving effect to the sale by us of the shares of common stock offered hereby. For a discussion of our stock split, see “Prospectus Summary—The Offering” and “Description of Capital Stock.”
Unless otherwise indicated below, to our knowledge, all persons listed below have sole voting and investment power with respect to their shares of common stock, except to the extent authority is shared by spouses under applicable law. Unless otherwise indicated below, the address for each person or entity listed below is c/o BJ’s Wholesale Club Holdings, Inc., 25 Research Drive, Westborough, Massachusetts 01581.
| Name of Beneficial Owner |
Number of Shares Beneficially Owned |
Percentage of Shares Beneficially Owned Before this Offering |
Percentage of Shares Beneficially Owned After this Offering |
Percentage of Shares Beneficially Owned After this Offering Assuming Full Exercise of Underwriters’ Option |
Number of Shares Subject to Underwriters’ Option |
Number of Shares Beneficially Owned After this Offering Assuming Full Exercise of Underwriters’ Option |
||||||||||||||||||
| 5% Stockholders |
||||||||||||||||||||||||
| CVC Beacon LP(1) |
||||||||||||||||||||||||
| Green Equity Investors V, L.P. and Green Equity Investors Side V, L.P.(2) |
||||||||||||||||||||||||
| Directors and Named Executive Officers |
||||||||||||||||||||||||
| Christopher J. Baldwin |
||||||||||||||||||||||||
| Robert W. Eddy |
||||||||||||||||||||||||
| Cornel Catuna |
||||||||||||||||||||||||
| Lee Delaney |
||||||||||||||||||||||||
| Brian Poulliot |
||||||||||||||||||||||||
132
Table of Contents
| Name of Beneficial Owner |
Number of Shares Beneficially Owned |
Percentage of Shares Beneficially Owned Before this Offering |
Percentage of Shares Beneficially Owned After this Offering |
Percentage of Shares Beneficially Owned After this Offering Assuming Full Exercise of Underwriters’ Option |
Number of Shares Subject to Underwriters’ Option |
Number of Shares Beneficially Owned After this Offering Assuming Full Exercise of Underwriters’ Option |
||||||||||||||||||
| Cameron Breitner |
||||||||||||||||||||||||
| Nishad Chande |
||||||||||||||||||||||||
| J. Kristofer Galashan |
||||||||||||||||||||||||
| Lars Haegg |
||||||||||||||||||||||||
| Ken Parent |
||||||||||||||||||||||||
| Jonathan A. Seiffer |
||||||||||||||||||||||||
| Christopher J. Stadler |
||||||||||||||||||||||||
| Robert Steele |
||||||||||||||||||||||||
| Tommy Yin |
||||||||||||||||||||||||
|
|
|
|
|
|
|
|
|
|
|
|
|
|||||||||||||
| All executive officers and directors as a group (21 persons) |
||||||||||||||||||||||||
|
|
|
|
|
|
|
|
|
|
|
|
|
|||||||||||||
| * | Represents beneficial ownership of less than 1% of our outstanding common stock. |
| (1) | The shares are held of record by CVC Beacon LP. CVC Beacon GP LLC is the general partner of CVC Beacon LP. CVC European Equity V Limited is the managing member of CVC Beacon GP LLC. Investment and voting power with regard to shares held of record by CVC Beacon LP rests with the Board of Directors of CVC European Equity V Limited, which consists of James Culshaw, Carl Hansen and Fred Watt, with address c/o CVC European Equity V Limited, 1 Waverley Place, Union Street, St Helier, Jersey JE1 1SG. As such, each of these entities and individuals may be deemed to share beneficial ownership of the shares held of record by CVC Beacon LP. Each of Messrs, Culshaw, Hansen and Watt disclaim beneficial ownership of the securities held of record by CVC Beacon LP. |
| (2) | Voting and investment power with respect to the shares of our common stock held by Green Equity Investors V, L.P. and Green Equity Investors Side V, L.P. (collectively, “Green V”) is shared. Voting and investment power may also be deemed to be shared with certain affiliated entities and investors (collectively comprising less than % of our outstanding common stock) whose holdings are included in the above amount. Messrs. Seiffer, Galashan and Yin may also be deemed to share voting and investment power with respect to such shares due to their positions with affiliates of Green V, and each disclaims beneficial ownership of such shares except to the extent of his pecuniary interest therein. Each of the foregoing individuals’ address is c/o Leonard Green & Partners, L.P., 11111 Santa Monica Boulevard, Suite 2000, Los Angeles, California 90025. |
133
Table of Contents
CERTAIN RELATIONSHIPS AND RELATED PARTY TRANSACTIONS
The following is a description of transactions to which we were a party since February 1, 2015 in which the amount involved exceeded or will exceed $120,000, and in which any of our executive officers, directors or holders of more than 5% of any class of our voting securities, or an affiliate or immediate family member thereof, had or will have a direct or indirect material interest.
Stockholders Agreement
On September 30, 2011, and in connection with the acquisition of the Company by the Sponsors, the Company and the Sponsors entered into the Stockholders Agreement. The Stockholders Agreement contains, among other things, certain restrictions on the ability of such Sponsors to freely transfer shares of our stock. It also provides that each of the Sponsors has the right to nominate at least one individual for election to our board, and each party to the stockholders’ agreement agrees to vote all of their shares to elect such individual to our board. The Stockholders Agreement also provides for demand and piggyback registration rights as described below. At the consummation of this offering, the provisions of the Stockholders Agreement (subject to the survival of certain obligations, such as those relating to registration rights described below) will terminate.
The Stockholders Agreement contains certain registration rights provisions that survive the consummation of this offering. Following this offering, each of the Sponsors are entitled to demand registrations, subject to certain exceptions. We are not required to effect any registration if the anticipated gross offering price of the shares of registered securities would be less than (i) $25 million in any offering registered on Form S-1, or (ii) $5 million in any offering registered on Form S-3. Management stockholders who are party to the Management Stockholders Agreement are also entitled to piggyback rights in connection with registered public offerings after this offering.
Management Stockholders Agreement
On September 30, 2011, and in connection with the acquisition of the Company by the Sponsors, Beacon Holding Inc. (the “Company”), Green Equity Investors V, L.P., Green Equity Investors Side V, L.P., Beacon Coinvest LLC and certain management stockholders entered into a stockholders agreement (the “Management Stockholders Agreement”). The Management Stockholders Agreement provides that the management stockholders party thereto and those who otherwise become party thereto from time to time will not, subject to certain exceptions, transfer any of their shares in the Company without the prior written consent of each of the principal stockholders party thereto, or seller, transfer or otherwise dispose of their shares for a period of 180 days following the consummation by the Company of an initial public offering. The Management Stockholders Agreement also provides for customary call rights, put rights, stock pre-emptive rights, stock co-sale rights and drag-along rights, as well as piggyback registration rights as described below. At the consummation of this offering, the provisions of the Management Stockholders Agreement (other than those granting piggyback registration rights) will terminate.
Management Services Agreement
On September 30, 2011, and in connection with the acquisition of the Company by the Sponsors, the Company entered into a management services agreement with the advisory affiliates of the Sponsors, pursuant to which the Sponsors agreed to provide certain management and financial services. We paid $8.1 million in fees and out of pocket expenses in both 2015 and 2016 and $8.0 million in fees and out of pocket expenses in 2017 to the advisory affiliates of the Sponsors under the management services agreement. The management services agreement with the Sponsors will terminate without any termination payment automatically upon the closing of this offering, subject to the survival of certain obligations, including as to indemnification.
134
Table of Contents
Christopher J. Baldwin Share Purchase and Promissory Note
On September 8, 2015, Christopher J. Baldwin purchased 24,391 shares of our common stock pursuant to a subscription agreement at a price of $41.00 per share, for an aggregate purchase price of $1,000,031. To finance his purchase of our common stock, we granted Mr. Baldwin a loan in the amount of $500,000, which was evidenced by a promissory note. The promissory note initially bore interest at 0.55% per annum, was payable on October 31, 2016 and was guaranteed by Mr. Baldwin. On October 31, 2016, the interest rate and maturity of the promissory note were amended to 0.66% and October 31, 2019 respectively. The promissory note was repaid on February 3, 2017.
Other Relationships
One of our suppliers, Advantage Solutions Inc., is controlled by affiliates of the Sponsors. Advantage Solutions Inc. is principally a provider of in-club product demonstration and sampling services, and we also engage them from time to time to provide ancillary support services, including for example, seasonal gift wrapping, on-floor sales assistance and display maintenance. In fiscal years 2017, 2016 and 2015 we incurred costs of approximately $44.8 million, $41.0 million and $10.6 million, respectively. The demonstration and sampling service fees are fully funded by our merchandise vendors who participate in the program.
We believe the terms obtained or consideration that we paid or received, as applicable, in connection with the transactions described in this section were comparable to terms available or amounts that would be paid or received, as applicable, in arms’-length transactions with parties unrelated to us.
Indemnification Agreements
Our amended and restated bylaws, as will be in effect prior to the closing of this offering, provide that we will indemnify our directors and officers to the fullest extent permitted by the DGCL, subject to certain exceptions contained in our amended and restated bylaws. In addition, our amended and restated certificate of incorporation, as will be in effect prior to the closing of this offering, will provide that our directors will not be liable for monetary damages for breach of fiduciary duty.
Prior to the closing of this offering, we will enter into indemnification agreements with each of our executive officers and directors. The indemnification agreements will provide the indemnitees with contractual rights to indemnification, and expense advancement and reimbursement, to the fullest extent permitted under the DGCL, subject to certain exceptions contained in those agreements.
There is no pending litigation or proceeding naming any of our directors or officers for which indemnification is being sought, and we are not aware of any pending litigation that may result in claims for indemnification by any director or executive officer.
Our Policy Regarding Related Party Transactions
Our board of directors recognizes the fact that transactions with related persons present a heightened risk of conflicts of interests or improper valuation (or the perception thereof). In connection with this offering, our board of directors intends to adopt a written policy on transactions with related persons that is in conformity with the requirements for issuers having publicly held common stock that is listed on the NYSE. Under such policy:
| • | any related person transaction, and any material amendment or modification to a related person transaction, must be reviewed and approved or ratified by a committee of the board of directors composed solely of independent directors who are disinterested or by the disinterested members of the board of directors; and |
135
Table of Contents
| • | any employment relationship or transaction involving an executive officer and any related compensation must be approved by the compensation committee of the board of directors or recommended by the compensation committee to the board of directors for its approval. |
In connection with the review and approval or ratification of a related person transaction:
| • | management must disclose to the committee or disinterested directors, as applicable, the name of the related person and the basis on which the person is a related person, the material terms of the related person transaction, including the approximate dollar value of the amount involved in the transaction and all the material facts as to the related person’s direct or indirect interest in, or relationship to, the related person transaction; |
| • | management must advise the committee or disinterested directors, as applicable, as to whether the related person transaction complies with the terms of our agreements governing our material outstanding indebtedness that limit or restrict our ability to enter into a related person transaction; |
| • | management must advise the committee or disinterested directors, as applicable, as to whether the related person transaction will be required to be disclosed in our applicable filings under the Securities Act or the Exchange Act, and related rules, and, to the extent required to be disclosed, management must ensure that the related person transaction is disclosed in accordance with such Acts and related rules; and |
| • | management must advise the committee or disinterested directors, as applicable, as to whether the related person transaction constitutes a “personal loan” for purposes of Section 402 of the Sarbanes-Oxley Act. |
In addition, the related person transaction policy will provide that the committee or disinterested directors, as applicable, in connection with any approval or ratification of a related person transaction involving a non-employee director or director nominee, should consider whether such transaction would compromise the director or director nominee’s status as an “independent,” or “outside” director, as applicable, under the rules and regulations of the SEC, the NYSE and the Code.
136
Table of Contents
The following descriptions of our capital stock and provisions of our amended and restated certificate of incorporation and our amended and restated bylaws are summaries and are qualified by reference to the amended and restated certificate of incorporation and the amended and restated bylaws, which are filed as exhibits to the registration statement of which this prospectus forms a part.
General
Our authorized capital stock following this offering consists of shares of common stock, par value $0.01 per share, and shares of preferred stock, par value $0.01 per share. Unless the board of directors determines otherwise, we will issue all shares of our capital stock in uncertificated form. We urge you to read our amended and restated certificate of incorporation and our amended and restated bylaws.
Common Stock
Our amended and restated certificate of incorporation authorizes a total of shares of common stock. Upon the consummation of this offering, we expect that shares of common stock will be issued and outstanding.
Holders of our common stock are entitled to one vote for each share held on all matters submitted to a vote of stockholders and do not have cumulative voting rights. An election of directors by our stockholders shall be determined by a plurality of the votes cast by the stockholders entitled to vote on the election. Holders of common stock are entitled to receive proportionately any dividends as may be declared by our board of directors, subject to any preferential dividend rights of any series of preferred stock that we may designate and issue in the future.
In the event of our liquidation, dissolution, or winding up, the holders of common stock are entitled to receive proportionately our net assets available for distribution to stockholders after the payment in full of all debts and other liabilities and subject to the prior rights of any outstanding preferred stock. Holders of common stock have no preemptive, subscription, redemption or conversion rights. There will be no sinking fund provisions applicable to our common stock. The rights, preferences and privileges of holders of common stock are subject to and may be adversely affected by the rights of the holders of shares of any series of preferred stock that we may designate and issue in the future.
Preferred Stock
Our amended and restated certificate of incorporation authorizes a total of shares of preferred stock. Upon the closing of this offering, we will have no shares of preferred stock issued or outstanding.
Under the terms of our amended and restated certificate of incorporation, our board of directors is authorized to direct us to issue shares of preferred stock in one or more series without stockholder approval. Our board of directors has the discretion to determine the rights, preferences, privileges and restrictions, including voting rights, dividend rights, conversion rights, redemption privileges and liquidation preferences, of each series of preferred stock.
The purpose of authorizing our board of directors to issue preferred stock and determine its rights and preferences is to eliminate delays associated with a stockholder vote on specific issuances. The issuance of preferred stock, while providing flexibility in connection with possible acquisitions, future financings and other corporate purposes, could have the effect of making it more difficult for a third party to acquire, or could discourage a third party from seeking to acquire, a majority of our outstanding voting stock. We have no present plans to issue any shares of preferred stock.
137
Table of Contents
Dividends
The DGCL permits a corporation to declare and pay dividends out of “surplus” or, if there is no “surplus,” out of its net profits for the fiscal year in which the dividend is declared or the preceding fiscal year. “Surplus” is defined as the excess of the net assets of the corporation over the amount determined to be the capital of the corporation by the board of directors. The capital of the corporation is typically calculated to be (and cannot be less than) the aggregate par value of all issued shares of capital stock. Net assets equal the fair value of the total assets minus total liabilities. The DGCL also provides that dividends may not be paid out of net profits if, after the payment of the dividend, capital is less than the capital represented by the outstanding stock of all classes having a preference upon the distribution of assets.
Declaration and payment of any dividend will be subject to the discretion of our board of directors. The time and amount of dividends will depend upon our financial condition, operations, cash requirements and availability, debt repayment obligations, capital expenditure needs, restrictions in our debt instruments, industry trends, the provisions of Delaware law affecting the payment of distributions to stockholders and any other factors our board of directors may consider relevant.
We have no current plans to pay dividends on our common stock. Any decision to declare and pay dividends in the future will be made at the sole discretion of our board of directors and will depend on, among other things, our results of operations, cash requirements, financial condition, contractual restrictions and other factors that our board of directors may deem relevant. Our ability to pay dividends will be limited by covenants in our existing indebtedness and may be limited by the agreements governing other indebtedness that we or our subsidiaries incur in the future. See “Description of Certain Indebtedness.” In addition, because we are a holding company and have no direct operations, we will only be able to pay dividends from funds we receive from our subsidiaries.
Authorized but Unissued Shares
The authorized but unissued shares of our common stock and our preferred stock are available for future issuance without stockholder approval, subject to any limitations imposed by the listing standards of the NYSE. These additional shares may be used for a variety of corporate finance transactions, acquisitions and employee benefit plans. The existence of authorized but unissued and unreserved common stock and preferred stock could make more difficult or discourage an attempt to obtain control of us by means of a proxy contest, tender offer, merger or otherwise.
Registration Rights
Upon the closing of this offering, the holders of shares of our common stock, or their transferees, will be entitled to various rights with respect to the registration of these shares under the Securities Act. Registration of these shares under the Securities Act would result in these shares becoming fully tradable without restriction under the Securities Act immediately upon the effectiveness of the registration, except for shares purchased by affiliates. Shares covered by a registration statement will be eligible for sale in the public market upon the expiration or release from the terms of the lock-up agreement. See “Certain Relationships and Related Party Transactions—Stockholders Agreement” elsewhere in this prospectus.
Exclusive Venue
Our amended and restated certificate of incorporation requires, to the fullest extent permitted by law, that (i) any derivative action or proceeding brought on our behalf, (ii) any action asserting a claim of breach of a fiduciary duty owed by any of our directors, officers or other employees to us or our stockholders, (iii) any action asserting a claim against us arising pursuant to any provision of the DGCL or our amended and restated certificate of incorporation or our amended and restated bylaws, or (iv) any action asserting a claim against us governed by the internal affairs doctrine will have to be brought only in the Court of Chancery in the State of
138
Table of Contents
Delaware. Although we believe this provision benefits us by providing increased consistency in the application of Delaware law in the types of lawsuits to which it applies, the provision may have the effect of discouraging lawsuits against our directors and officers.
Conflicts of Interest
Delaware law permits corporations to adopt provisions renouncing any interest or expectancy in certain opportunities that are presented to the corporation or its officers, directors or stockholders. Our amended and restated certificate of incorporation will, to the maximum extent permitted from time to time by Delaware law, renounce any interest or expectancy that we have in, or right to be offered an opportunity to participate in, specified business opportunities that are from time to time presented to our officers, directors or stockholders or their respective affiliates, other than those officers, directors, stockholders or affiliates who are our or our subsidiaries’ employees. Our amended and restated certificate of incorporation will provide that, to the fullest extent permitted by law, none of the Sponsors or any of their affiliates or any director who is not employed by us (including any non-employee director who serves as one of our officers in both his director and officer capacities) or his or her affiliates will have any duty to refrain from (i) engaging in a corporate opportunity in the same or similar lines of business in which we or our affiliates now engage or propose to engage or (ii) otherwise competing with us or our affiliates. In addition, to the fullest extent permitted by law, in the event that the Sponsors or any non-employee director acquires knowledge of a potential transaction or other business opportunity which may be a corporate opportunity for itself or himself or its or his affiliates or for us or our affiliates, such person will have no duty to communicate or offer such transaction or business opportunity to us or any of our affiliates and they may take any such opportunity for themselves or offer it to another person or entity. Our amended and restated certificate of incorporation will not renounce our interest in any business opportunity that is expressly offered to a non-employee director solely in his or her capacity as a director or officer of the Company. To the fullest extent permitted by law, no business opportunity will be deemed to be a potential corporate opportunity for us unless we would be permitted, to undertake the opportunity under our amended and restated certificate of incorporation, we have sufficient financial resources to undertake the opportunity and the opportunity would be in line with our business.
Limitations on Liability and Indemnification of Officers and Directors
The DGCL authorizes corporations to limit or eliminate the personal liability of directors to corporations and their stockholders for monetary damages for breaches of directors’ fiduciary duties, subject to certain exceptions. Our amended and restated certificate of incorporation includes a provision that eliminates the personal liability of directors for monetary damages for any breach of fiduciary duty as a director, except to the extent such exemption from liability or limitation thereof is not permitted under the DGCL. The effect of these provisions is to eliminate the rights of us and our stockholders, through stockholders’ derivative suits on our behalf, to recover monetary damages from a director for breach of fiduciary duty as a director, including breaches resulting from grossly negligent behavior. However, exculpation does not apply to any director if the director has acted in bad faith, knowingly or intentionally violated the law, authorized illegal dividends or redemptions or derived an improper benefit from his or her actions as a director.
Our amended and restated bylaws provide that we must indemnify and advance expenses to our directors and officers to the fullest extent authorized by the DGCL. We also are expressly authorized to carry directors’ and officers’ liability insurance providing indemnification for our directors, officers and certain employees for some liabilities. We believe that these indemnification and advancement provisions and insurance are useful to attract and retain qualified directors and executive officers.
The limitation of liability, indemnification and advancement provisions in our amended and restated certificate of incorporation and amended and restated bylaws may discourage stockholders from bringing a lawsuit against directors for breach of their fiduciary duty. These provisions also may have the effect of reducing the likelihood of derivative litigation against directors and officers, even though such an action, if successful, might otherwise benefit
139
Table of Contents
us and our stockholders. In addition, your investment may be adversely affected to the extent we pay the costs of settlement and damage awards against directors and officers pursuant to these indemnification provisions.
We currently are party to indemnification agreements with certain of our directors and officers. These agreements require us to indemnify these individuals to the fullest extent permitted under Delaware law against liabilities that may arise by reason of their service to us, and to advance expenses incurred as a result of any proceeding against them as to which they could be indemnified.
There is currently no pending material litigation or proceeding involving any of our directors, officers or employees for which indemnification is sought.
Anti-Takeover Effects of Provisions of Our Amended and Restated Certificate of Incorporation, Our Amended and Restated Bylaws and Delaware Law
Certain provisions of Delaware law and our amended and restated certificate of incorporation and amended and restated bylaws contain provisions that may delay, defer or discourage another party from acquiring control of us. We expect that these provisions, which are summarized below, will discourage coercive takeover practices or inadequate takeover bids. These provisions are also designed to encourage persons seeking to acquire control of us to first negotiate with our board of directors, which we believe may result in an improvement of the terms of any such acquisition in favor of our stockholders. However, they also give our board of directors the power to discourage acquisitions that some stockholders may favor.
Classified Board of Directors
Our amended and restated certificate of incorporation provides that our board of directors is divided into three classes, with the classes as nearly equal in number as possible and, following the expiration of specified initial terms for each class, each class serving three-year staggered terms. As a result, approximately one-third of our directors are elected each year. In addition, our amended and restated certificate of incorporation provides that directors may only be removed from our board of directors for cause. These provisions may have the effect of deferring, delaying or discouraging hostile takeovers, or changes in control of us or our management.
Requirements for Advance Notification of Stockholder Meetings, Nominations and Proposals
Our amended and restated certificate of incorporation will provide that, after the date on which the Sponsors and their affiliates cease to beneficially own, in the aggregate, more than % in voting power of our stock entitled to vote generally in the election of directors, special meetings of the stockholders may be called only by the chairman of the board, a resolution adopted by the affirmative vote of the majority of the directors then in office and not by our stockholders or any other person or persons. Our amended and restated bylaws prohibit the conduct of any business at a special meeting other than as specified in the notice for such meeting. In addition, any stockholder who wishes to bring business before an annual meeting or nominate directors must comply with the advance notice requirements set forth in our amended and restated bylaws. These provisions may have the effect of deferring, delaying or discouraging hostile takeovers or changes in control of us or our management.
Stockholder Action by Written Consent
Pursuant to Section 228 of the DGCL, any action required to be taken at any annual or special meeting of the stockholders may be taken without a meeting, without prior notice and without a vote if a consent or consents in writing, setting forth the action so taken, is signed by the holders of outstanding stock having not less than the minimum number of votes that would be necessary to authorize or take such action at a meeting at which all shares of our stock entitled to vote thereon were present and voted, unless our amended and restated certificate of incorporation provides otherwise. Our amended and restated certificate of incorporation prohibits stockholder action by written consent (and, thus, requires that all stockholder actions be taken at a meeting of our stockholders), if the Sponsors cease to own, or have the right to direct the vote of, % or more of the voting power of our common stock.
140
Table of Contents
Approval for Amendment of Certificate of Incorporation and Bylaws
Our amended and restated certificate of incorporation further provides that the affirmative vote of holders of at least two-thirds of the voting power of all of the then outstanding shares of voting stock, voting as a single class, will be required to amend certain provisions of our amended and certificate of incorporation, including provisions relating to the size of the board, removal of directors, special meetings, actions by written consent and cumulative voting. The affirmative vote of holders of at least two-thirds of the voting power of all of the then outstanding shares of voting stock, voting as a single class, will be required to amend or repeal our bylaws, although our bylaws may be amended by a simple majority vote of our board of directors.
Business Combinations
We have opted out of Section 203 of the DGCL; however, our amended and restated certificate of incorporation contains similar provisions providing that we may not engage in certain “business combinations” with any “interested stockholder” for a three-year period following the time that the stockholder became an interested stockholder, unless:
| • | prior to such time, our board of directors approved either the business combination or the transaction that resulted in the stockholder becoming an interested stockholder; |
| • | upon consummation of the transaction that resulted in the stockholder becoming an interested stockholder, the interested stockholder owned at least 85% of our voting stock outstanding at the time the transaction commenced, excluding certain shares; or |
| • | at or subsequent to that time, the business combination is approved by our board of directors and by the affirmative vote of holders of at least two-thirds of our outstanding voting stock that is not owned by the interested stockholder. |
Generally, a “business combination” includes a merger, asset, or stock sale or other transaction resulting in a financial benefit to the interested stockholder. Subject to certain exceptions, an “interested stockholder” is a person who, together with that person’s affiliates and associates, owns, or within the previous three years owned, 15% or more of our outstanding voting stock. For purposes of this section only, “voting stock” has the meaning given to it in Section 203 of the DGCL.
Under certain circumstances, this provision will make it more difficult for a person who would be an “interested stockholder” to effect various business combinations with us for a three-year period. This provision may encourage companies interested in acquiring us to negotiate in advance with our board of directors because the stockholder approval requirement would be avoided if our board of directors approves either the business combination or the transaction which results in the stockholder becoming an interested stockholder. These provisions also may have the effect of preventing changes in our board of directors and may make it more difficult to accomplish transactions which stockholders may otherwise deem to be in their best interests.
Our amended and restated certificate of incorporation provides that the Sponsors and their affiliates, and any of their respective direct or indirect transferees and any group as to which such persons are a party, do not constitute “interested stockholders” for purposes of this provision.
Transfer Agent and Registrar
The transfer agent and registrar for our common stock will be American Stock Transfer & Trust Company, LLC.
Stock Exchange Listing
We have applied to list our common stock on the NYSE under the symbol “BJ.”
141
Table of Contents
DESCRIPTION OF CERTAIN INDEBTEDNESS
On February 3, 2017, we entered into an amended and restated senior secured asset based revolving credit and term facility (the “ABL Facility”). On February 3, 2017, we entered into a senior secured first lien term loan facility (the “First Lien Facility”), and a senior secured second lien term loan facility (the “Second Lien Facility” and, together with the First Lien Facility, the “Term Loan Facilities”). We entered into the ABL Facility and Term Loan Facilities to amend the Prior ABL Facility and refinance the Prior Term Loan Facilities and to fund (i) a $735.5 million dividend payment to our stockholders, including funds affiliated with the Sponsors, (ii) a $67.5 million payment to certain holders of our outstanding stock options and (iii) a $5.4 million payment to our employees under retention bonus arrangements. Borrowings under the ABL Facility are also used to finance or refinance our working capital and capital expenditures and for general corporate purposes.
We intend to use the proceeds of this offering to repay approximately $ million of principal amount of indebtedness under the Second Lien Facility, as well as any accrued and unpaid interest and premium on the outstanding principal amount of the Second Lien Facility. See “Use of Proceeds.”
ABL Facility
General
On February 3, 2017, BJ’s Wholesale Club, Inc., as borrower, and we, as a guarantor, amended our ABL Facility with the lenders party thereto and Wells Fargo Bank, National Association, as administrative agent and collateral agent (in such capacities, the “ABL Agent”). The ABL Facility is scheduled to mature on February 3, 2022. There is no scheduled amortization under the ABL Facility.
The ABL Facility provides for (i) revolving borrowings of up to $950.0 million subject to borrowing base availability and (ii) a $50.0 million term loan. The borrowing base is equal to the sum (subject to certain reserves and adjustments) of (i) 90% of eligible credit card receivables, (ii) 90% of the amount of eligible accounts, (iii) the net recovery percentage of eligible inventory multiplied by 90% of the cost of eligible inventory, net of inventory reserves attributable to eligible inventory and (iv) qualified cash in an amount of up to 10% the borrowing base as calculated after giving effect to this clause (iv)), minus (v) the then amount of all availability reserves. The term borrowing base is equal to the sum (subject to certain reserves and adjustments) of (i) 5% of eligible credit card receivables, (ii) 5% of eligible accounts and (iii) the net recovery percentage of eligible inventory multiplied by 5% of the cost of eligible inventory, net of inventory reserves attributable to eligible inventory, minus (iv) the then amount of all availability reserves taken in respect of the term borrowing base. Subject to the borrowing base availability, the ABL Facility also includes a letter of credit subfacility of up to $300.0 million and a swing line subfacility for same-day borrowings of up to $75.0 million. Borrowings under the ABL Facility are subject to the satisfaction of customary conditions, including absence of default and accuracy of representations and warranties.
142
Table of Contents
Interest
Borrowings under the ABL Facility bear interest at a rate per annum equal to, at our option, either (a) adjusted LIBOR plus the applicable rate or (b) base rate (determined by reference to the greatest of the prime rate published by Wells Fargo, National Association, the federal funds effective rate plus 0.5% and one-month LIBOR plus 1%) plus the applicable rate. The applicable rates under the ABL Facility are subject to step-ups and step-downs based on the ABL Borrowers’ average daily availability for the immediately preceding fiscal quarter in accordance with the following schedule:
| Pricing |
Average Daily Availability |
Eurodollar Rate Revolving Loans and Letters of Credit |
Base Rate Revolving Loans |
Eurocurrency Rate Term Loans |
Base Rate Term Loans |
|||||||||||||
| I |
Greater than $500.0 million |
1.50 | % | 0.50 | % | 3.00 | % | 2.00 | % | |||||||||
| II |
Less than or equal to $500.0 million but greater than $350.0 million |
1.75 | % | 0.75 | % | 3.25 | % | 2.25 | % | |||||||||
| III |
Less than or equal to $350.0 million |
2.00 | % | 1.00 | % | 3.50 | % | 2.50 | % | |||||||||
Optional and Mandatory Prepayments; Cash Dominion
At our option, the ABL Facility may be prepaid at any time without a premium or penalty with notice to the ABL Agent. We may also terminate or permanently reduce the unused commitments under the ABL Facility, with notice to the ABL Agent. Such termination or reduction must be in a minimum aggregate amount of $1.0 million or in whole multiples of $500,000 in excess thereof. In addition, we are not permitted to terminate or reduce the commitments if such termination or reduction (and any concurrent prepayments) would cause the total outstanding amount to exceed the amount of the ABL Facility. To the extent the borrowings under the ABL Facility at any time exceed the borrowing base at such time, we are required to prepay the borrowings under the ABL Facility in the amount of such excess.
We will be required to sweep substantially all cash receipts from the sale of inventory, collection of receivables and dispositions of the ABL Priority Collateral (defined below) into certain concentration accounts under the dominion and control of the administrative agent under the ABL Facility and all such cash will be used to repay outstanding borrowings under the ABL Facility (i) during the existence of certain specified events of default or (ii) when we fail to maintain availability of at least the greater of $60.0 million and 10.0% of the line cap for five consecutive business days.
Guarantee and Collateral
Obligations in respect of the ABL Facility are guaranteed by us and each of our material existing, newly acquired or created wholly-owned domestic restricted subsidiaries. Obligations under the ABL Facility, as well as obligations to the ABL Facility lenders and their affiliates under certain secured cash management agreements and secured hedge agreements, are secured by a first priority lien on the borrower’s and the guarantors’ accounts receivable, inventory, deposit accounts, securities accounts, commodities accounts, cash and cash equivalents; chattel paper, documents, instruments, general intangibles (excluding intellectual property), books, records, proceeds and supporting obligations relating to the foregoing (collectively, the “ABL Priority Collateral”); and a third priority lien on the borrower’s and the guarantors’ and their wholly-owned subsidiaries’ capital stock (which will be limited, in the case of any foreign subsidiaries, to 65% of the voting stock and 100% of the non-voting stock of any first-tier foreign subsidiaries); and the borrower’s and the guarantors’ intercompany debt and certain other “fixed assets” other than the ABL Priority Collateral (collectively, the “Term Loan Priority Collateral”).
143
Table of Contents
Covenants and Other Matters
The ABL Facility requires that we comply with a number of covenants, as well as certain financial tests. If we fail to maintain availability of at least the greater of $60.0 million and 10% of the line cap, the consolidated fixed charge coverage ratio of the most recently completed period of four consecutive quarters must be 1.00 to 1.00 or higher until our availability is at least the greater of $60.0 million and 10% of the line cap for 30 consecutive days. The covenants also limit, in certain circumstances, our ability to take a variety of actions, including:
| • | incur indebtedness; |
| • | create or maintain liens on property or assets; |
| • | make investments, loans and advances; |
| • | engage in acquisitions, mergers, consolidations and asset sales; |
| • | redeem debt; |
| • | pay dividends and distributions; and |
| • | enter into transactions with affiliates. |
The borrower’s future compliance with its financial covenants and tests under the ABL Facility will depend on its ability to maintain sufficient liquidity, generate earnings and manage its assets effectively. The ABL Facility also has various non-financial covenants, both requiring the borrower and the guarantors to refrain from taking certain future actions (as described above) and requiring the borrower and the guarantors to take certain actions, such as keeping in good standing its corporate existence, maintaining insurance and providing the bank lending group with financial information on a timely basis. The ABL Facility also contains certain customary representations and warranties and events of default, including, among other things, payment defaults, breach of representations and warranties, covenant defaults, cross-defaults to certain indebtedness, certain events of bankruptcy, certain events under ERISA, material judgments, actual or asserted failure of any material guaranty or security document supporting the ABL Facility to be in full force and effect and change of control. If such an event of default occurs, the administrative agent under the ABL Facility would be entitled to take various actions, including the acceleration of amounts due under the ABL Facility and all actions permitted to be taken by a secured creditor.
Term Loan Facilities
General
On February 3, 2017, BJ’s Wholesale Club, Inc., as the borrower, and we, as a guarantor, entered into (i) the First Lien Facility, with the lenders party thereto, and Nomura Corporate Funding Americas, LLC, as administrative agent and collateral agent (in such capacities, the “First Lien Agent”) and (ii) the Second Lien Facility, with the lenders party thereto and Jefferies Finance LLC, as administrative agent and collateral agent (in such capacities, the “Second Lien Agent”).
The Term Loan Facilities provide for term loans of up to (i) $1,925.0 million under the First Lien Facility (the “First Lien Loan”) and (ii) $625.0 million under the Second Lien Facility (the “Second Lien Loan” and, together with the First Lien Loan, the “Term Loans”). The First Lien Loan amortizes in nominal quarterly installments equal to 0.25% of the original aggregate principal amount of the First Lien Loan and matures on February 3, 2024. The Second Lien Loan has no amortization and matures on February 3, 2025. The Term Loan Facilities also permit us to add one or more incremental term loans up to $475.0 million (shared between the First Lien Facility and the Second Lien Facility) plus additional amounts subject to our compliance, with respect to the First Lien Facility, with a first lien net leverage ratio test and, with respect to the Second Lien Facility, with a secured net leverage ratio test.
144
Table of Contents
Interest
The Term Loans bear interest at a rate per annum equal to, at our option, either (a) adjusted LIBOR plus the applicable rate or (b) base rate (determined by reference to the greatest of the prime rate published by Wells Fargo, National Association or the Wall Street Journal (as applicable), the federal funds effective rate plus 0.5% and one-month LIBOR plus 1%) plus the applicable rate. Until delivery of financial statements for the first full fiscal quarter ending after February 3, 2017, the applicable rate under the First Lien Facility is 3.75% for LIBOR loans and 2.75% for base rate loans. Thereafter, the applicable rate under the First Lien Facility shall be based on first lien net leverage ratio levels in accordance with the following schedule:
| Pricing |
First Lien Net Leverage Ratio |
Eurodollar Rate | Base Rate | |||||||
| I |
Greater than 4.25:1.00 |
3.75 | % | 2.75 | % | |||||
| II |
Less than or equal to 4:25:1.00 |
3.50 | % | 2.50 | % | |||||
The applicable rate under the Second Lien Facility is 7.50% for LIBOR loans and 6.50% for base rate loans.
Optional and Mandatory Prepayments
At our option, the First Lien Loan may be prepaid at any time, in whole or in part, with notice to the First Lien Agent; provided, however, any prepayment in connection with a repricing event made prior to August 3, 2017 shall be subject to a prepayment premium equal to the principal amount of the First Lien Loan subject to such prepayment multiplied by 1%. Any prepayment of all or any portion of the outstanding First Lien on or after August 3, 2017 shall not be subject to a premium.
At our option, the Second Lien Loan may be prepaid at any time (but subject to the restrictions contained in the ABL/First Lien/Second Lien Intercreditor Agreement), in whole or in part, with notice to the Second Lien Agent; provided, however, any voluntary prepayment made shall be subject to a prepayment premium equal to the principal amount of the Second Lien Loan subject to such prepayment multiplied by (i) 2% if such prepayment is made prior to February 3, 2018 and (ii) 1% if such prepayment is made on or after February 3, 2018 and prior to February 3, 2019. Any prepayment of all or any portion of the outstanding Second Lien Loan on or after February 3, 2019 shall not be subject to a premium.
In addition, subject to the satisfaction of certain conditions, we are permitted to offer our lenders to repurchase loans held by them under the Term Loan Facilities at a discount.
Under certain circumstances and subject to certain exceptions, the Term Loan Facilities will be subject to mandatory prepayments in the amount equal to: (x) 100% of the net cash proceeds of certain assets sales and issuances or incurrence of non-permitted indebtedness and (y) 50% of annual excess cash flow for any fiscal year, such percentage to decrease to 25% and 0% depending on the attainment of certain first lien net leverage ratio targets.
Guarantee and Collateral
The borrower’s obligations in respect of the Term Loan Facilities are guaranteed by us and each of our material existing and newly acquired or created wholly-owned domestic restricted subsidiaries. Our obligations under the Term Loan Facilities are secured by a first priority lien on the Term Loan Priority Collateral and a second priority lien on the ABL Priority Collateral. As between the First Lien Facility and the Second Lien Facility, liens securing the Second Lien Loan are junior and subordinated to the liens securing the First Lien Loan.
145
Table of Contents
Covenants and Other Matters
The Term Loan Facilities have various non-financial covenants, customary representations and warranties, events of defaults and remedies, substantially similar to those described in respect of the ABL Facility above. There are no financial maintenance covenants in the Term Loan Facilities.
146
Table of Contents
SHARES ELIGIBLE FOR FUTURE SALE
The sale of a substantial amount of our common stock in the public market after this offering could adversely affect the prevailing market price of our common stock. Furthermore, over % of our common stock outstanding prior to the consummation of this offering will be subject to the contractual and legal restrictions on resale described below. The sale of a substantial amount of common stock in the public market after these restrictions lapse, or the expectation that such a sale may occur, could adversely affect the prevailing market price of our common stock and our ability to raise equity capital in the future.
Upon consummation of this offering, we expect to have outstanding an aggregate of shares of our common stock, assuming no exercise of outstanding options. All of the shares of common stock sold in this offering will be freely transferable without restriction or further registration under the Securities Act by persons other than “affiliates,” as that term is defined in Rule 144 under the Securities Act. Generally, the balance of our outstanding shares of common stock are “restricted securities” within the meaning of Rule 144 under the Securities Act, and the sale of those shares will be subject to the limitations and restrictions that are described below. Shares of our common stock that are not restricted securities and are purchased by our affiliates will be “control securities” under Rule 144. Restricted securities may be sold in the public market only if registered under the Securities Act or if they qualify for an exemption from registration under Rule 144 or Rule 701 under the Securities Act. These rules are summarized below. Control securities may be sold in the public market subject to the restrictions set forth in Rule 144, other than the holding period requirement.
Upon the expiration of the lock-up agreements described below 180 days after the date of this prospectus, and subject to the provisions of Rule 144, an additional shares will be available for sale in the public market ( shares if the underwriters fully exercise their option to purchase additional shares from the selling stockholders). The sale of these restricted securities is subject, in the case of shares held by affiliates, to the volume restrictions contained in Rule 144.
Lock-up Agreements
In connection with this offering, we, the selling stockholders, our directors and officers and holders of all of our outstanding shares of our common stock have agreed with the underwriters to enter into lock-up agreements described in “Underwriting,” pursuant to which shares of our common stock outstanding after this offering will be restricted from immediate resale in accordance with the terms of such lock-up agreements without the prior written consent of . Under these agreements, subject to limited exceptions, neither we nor any of our directors or officers or these holders may directly or indirectly sell, dispose of, hedge or otherwise transfer the economic consequences of ownership of any shares of common stock or securities convertible into or exchangeable or exercisable for shares of common stock. These restrictions will be in effect for a period of 180 days after the date of this prospectus. Certain transfers or dispositions can be made sooner, provided the transferee becomes bound to the terms of the lock-up.
Rule 144
In general, under Rule 144 as in effect on the date of this prospectus, beginning 90 days after the consummation of this offering, a person (or persons whose common stock is required to be aggregated), who is an affiliate, and who has beneficially owned our common stock for at least six months, is entitled to sell in any three-month period a number of shares that does not exceed the greater of:
| • | 1% of the number of shares of our common stock then outstanding, which will equal approximately million shares immediately after consummation of this offering ( shares if the underwriters fully exercise their option to purchase additional shares from the selling stockholders); or |
| • | the average weekly trading volume in our common stock on the NYSE during the four calendar weeks preceding the filing of a notice on Form 144 with respect to that sale. |
147
Table of Contents
Sales by our affiliates under Rule 144 are also subject to manner of sale provisions and notice requirements and to the availability of current public information about us. An “affiliate” is a person that directly, or indirectly through one or more intermediaries, controls or is controlled by, or is under common control with an issuer.
Under Rule 144, a person (or persons whose shares are aggregated) who is not deemed to have been an affiliate of ours at any time during the 90 days preceding a sale, and who has beneficially owned the shares proposed to be sold for at least six months (including the holding period of any prior owner other than an affiliate), would be entitled to sell those shares subject only to availability of current public information about us, and after beneficially owning such shares for at least twelve months, would be entitled to sell an unlimited number of shares without restriction. To the extent that our affiliates sell their common stock, other than pursuant to Rule 144 or a registration statement, the purchaser’s holding period for the purpose of effecting a sale under Rule 144 commences on the date of transfer from the affiliate.
Rule 701
In general, under Rule 701 as in effect on the date of this prospectus, any of our employees, directors, officers, consultants or advisors who purchased shares from us in reliance on Rule 701 in connection with a compensatory stock or option plan or other written agreement before the effective date of this offering, or who purchased shares from us after that date upon the exercise of options granted before that date, are eligible to resell such shares 90 days after the effective date of this offering in reliance upon Rule 144. If such person is not an affiliate, such sale may be made subject only to the manner of sale provisions of Rule 144. If such a person is an affiliate, such sale may be made under Rule 144 without compliance with the holding period requirement, but subject to the other Rule 144 restrictions described above. However, substantially all Rule 701 shares are subject to lock-up agreements as described above and will become eligible for sale in compliance with Rule 144 only upon the expiration of the restrictions set forth in those agreements.
Stock Plans
We intend to file a registration statement or statements on Form S-8 under the Securities Act covering shares of common stock reserved for issuance under our 2018 Plan and pursuant to all outstanding option grants made prior to this offering under the 2011 Stock Option Plan. These registration statements are expected to be filed as soon as practicable after the closing date of this offering. Shares issued upon the exercise of stock options after the effective date of the applicable Form S-8 registration statement will be eligible for resale in the public market without restriction, subject to Rule 144 limitations applicable to affiliates and the lock-up agreements described above.
Registration Rights
Following this offering, some of our stockholders will, under some circumstances, have the right to require us to register their shares for future sale. See “Certain Relationships and Related Party Transactions—Stockholders Agreement.”
148
Table of Contents
MATERIAL U.S. FEDERAL TAX CONSIDERATIONS
FOR NON-U.S. HOLDERS OF OUR COMMON STOCK
The following discussion is a summary of the material U.S. federal income tax consequences to Non-U.S. Holders (as defined below) of the purchase, ownership and disposition of our common stock issued pursuant to this offering, but does not purport to be a complete analysis of all potential tax effects. The effects of other U.S. federal tax laws, such as estate and gift tax laws, and any applicable state, local, or non-U.S. tax laws are not discussed. This discussion is based on the U.S. Internal Revenue Code of 1986, as amended, or the Code, Treasury Regulations promulgated thereunder, judicial decisions and published rulings and administrative pronouncements of the U.S. Internal Revenue Service, or the IRS, in each case in effect as of the date hereof. These authorities may change or be subject to differing interpretations. Any such change or differing interpretation may be applied retroactively in a manner that could adversely affect a Non-U.S. Holder of our common stock. We have not sought and will not seek any rulings from the IRS regarding the matters discussed below. There can be no assurance the IRS or a court will not take a contrary position to that discussed below regarding the tax consequences of the purchase, ownership and disposition of our common stock.
This discussion is limited to Non-U.S. Holders that hold our common stock as a “capital asset” within the meaning of Section 1221 of the Code (generally, property held for investment). This discussion does not address all U.S. federal income tax consequences relevant to a Non-U.S. Holder’s particular circumstances, including the impact of the Medicare contribution tax on net investment income. In addition, it does not address consequences relevant to Non-U.S. Holders subject to special rules, including, without limitation:
| • | U.S. expatriates and former citizens or long-term residents of the United States; |
| • | persons subject to the alternative minimum tax; |
| • | persons holding our common stock as part of a hedge, straddle, or other risk reduction strategy or as part of a conversion transaction or other integrated investment; |
| • | persons subject to special tax accounting rules as a result of any item of gross income with respect to our common stock being taken into account in an applicable financial statement; |
| • | banks, insurance companies and other financial institutions; |
| • | brokers, dealers, or traders in securities; |
| • | “controlled foreign corporations,” “passive foreign investment companies,” and corporations that accumulate earnings to avoid U.S. federal income tax; |
| • | partnerships or other entities or arrangements treated as partnerships for U.S. federal income tax purposes (and investors therein); |
| • | tax-exempt organizations or governmental organizations; |
| • | persons deemed to sell our common stock under the constructive sale provisions of the Code; |
| • | persons who hold or receive our common stock pursuant to the exercise of any employee stock option or otherwise as compensation; |
| • | persons that own, or are deemed to own, more than 5% of our common stock (except to the extent specifically set forth below); |
| • | tax-qualified retirement plans; and |
| • | “qualified foreign pension funds” as defined in Section 897(l)(2) of the Code and entities all of the interests of which are held by qualified foreign pension funds. |
If an entity (or arrangement) treated as a partnership for U.S. federal income tax purposes holds our common stock, the tax treatment of a partner or beneficial owner of the entity will depend on the status of the
149
Table of Contents
partner or beneficial owner, the activities of the entity and certain determinations made at the partner or beneficial owner level. Accordingly, entities treated as partnerships for U.S. federal income tax purposes holding our common stock and the partners or beneficial owners in such entities should consult their tax advisors regarding the U.S. federal income tax consequences to them.
THIS DISCUSSION IS FOR INFORMATIONAL PURPOSES ONLY AND IS NOT TAX ADVICE. INVESTORS SHOULD CONSULT THEIR TAX ADVISORS WITH RESPECT TO THE APPLICATION OF THE U.S. FEDERAL INCOME TAX LAWS TO THEIR PARTICULAR SITUATIONS AS WELL AS ANY TAX CONSEQUENCES OF THE PURCHASE, OWNERSHIP AND DISPOSITION OF OUR COMMON STOCK ARISING UNDER THE U.S. FEDERAL ESTATE OR GIFT TAX LAWS OR UNDER THE LAWS OF ANY STATE, LOCAL OR NON-U.S. TAXING JURISDICTION OR UNDER ANY APPLICABLE INCOME TAX TREATY.
Definition of a Non-U.S. Holder
For purposes of this discussion, a “Non-U.S. Holder” is any beneficial owner of our common stock that is neither a “U.S. person” nor an entity (or arrangement) treated as a partnership for U.S. federal income tax purposes. A U.S. person is any person that, for U.S. federal income tax purposes, is or is treated as any of the following:
| • | an individual who is a citizen or resident of the United States; |
| • | an entity created or organized under the laws of the United States, any state thereof, or the District of Columbia that is classified as a corporation for U.S. federal income tax purposes; |
| • | an estate, the income of which is subject to U.S. federal income tax regardless of its source; or |
| • | a trust that (1) is subject to the primary supervision of a U.S. court and the control of one or more “United States persons” (within the meaning of Section 7701(a)(30) of the Code), or (2) has a valid election in effect to be treated as a United States person for U.S. federal income tax purposes. |
Distributions
As described in the section of this prospectus entitled “Dividend Policy,” we do not anticipate declaring or paying dividends to holders of our common stock in the foreseeable future. However, if we do make distributions of cash or property on our common stock, such distributions will constitute dividends for U.S. federal income tax purposes to the extent paid from our current or accumulated earnings and profits, as determined under U.S. federal income tax principles. Amounts not treated as dividends for U.S. federal income tax purposes will first constitute a return of capital and be applied against and reduce a Non-U.S. Holder’s adjusted tax basis in its common stock, but not below zero. Any excess will be treated as capital gain and will be treated as described below under “—Sale or Other Taxable Disposition.”
Except as described below with respect to effectively connected dividends and subject to the discussions below of backup withholding and Sections 1471 to 1474 of the Code (such Sections and related Treasury Regulations commonly referred to as the Foreign Account Tax Compliance Act, or FATCA), dividends paid to a Non-U.S. Holder of our common stock will be subject to U.S. federal withholding tax at a rate of 30% of the gross amount of the dividends (or such lower rate specified by an applicable income tax treaty, provided the Non-U.S. Holder furnishes a valid IRS Form W-8BEN or W-8BEN-E (or other applicable documentation) certifying qualification for the lower treaty rate). If a Non-U.S. Holder holds the stock through a financial institution or other intermediary, the Non-U.S. Holder will be required to provide appropriate documentation to the intermediary, which then will be required to provide appropriate documentation to the applicable withholding agent, either directly or through other intermediaries. A Non-U.S. Holder that does not timely furnish the required documentation, but that qualifies for a reduced treaty rate, may obtain a refund of any excess amounts withheld by timely filing an appropriate claim for refund with the IRS. Non-U.S. Holders should consult their tax advisors regarding their entitlement to benefits under any applicable income tax treaty.
150
Table of Contents
If dividends paid to a Non-U.S. Holder are effectively connected with the Non-U.S. Holder’s conduct of a trade or business within the United States (and, if required by an applicable income tax treaty, the Non-U.S. Holder maintains a permanent establishment in the United States to which such dividends are attributable), the Non-U.S. Holder will be exempt from the U.S. federal withholding tax described above. To claim the exemption, the Non-U.S. Holder must furnish to the applicable withholding agent a valid IRS Form W-8ECI, certifying that the dividends are effectively connected with the Non-U.S. Holder’s conduct of a trade or business within the United States.
Any such effectively connected dividends will be subject to U.S. federal income tax generally in the same manner as if the Non-U.S. Holder were a U.S. person and be subject to U.S. federal income tax on a net income basis at the regular graduated U.S. federal income tax rates. A Non-U.S. Holder that is a corporation also may be subject to a branch profits tax at a rate of 30% (or such lower rate specified by an applicable income tax treaty) on its effectively connected earnings and profits for the taxable year that are attributable to such dividends, as adjusted for certain items. Non-U.S. Holders should consult their tax advisors regarding any applicable tax treaties that may provide for different rules or rates.
Sale or Other Taxable Disposition
Subject to the discussions below regarding FATCA and backup withholding, a Non-U.S. Holder will not be subject to U.S. federal income tax on any gain realized upon the sale or other taxable disposition of our common stock unless:
| • | the gain is effectively connected with the Non-U.S. Holder’s conduct of a trade or business within the United States (and, if required by an applicable income tax treaty, the Non-U.S. Holder maintains a permanent establishment in the United States to which such gain is attributable); |
| • | the Non-U.S. Holder is a nonresident alien individual present in the United States for 183 days or more during the taxable year of the disposition and certain other requirements are met; or |
| • | our common stock constitutes a U.S. real property interest, or USRPI, by reason of our status as a U.S. real property holding corporation, or USRPHC, for U.S. federal income tax purposes. |
Gain described in the first bullet point above generally will be subject to U.S. federal income tax generally in the same manner as if the Non-U.S. Holder were a U.S. person and be taxed on the net gain derived from the sale or other taxable disposition under regular graduated U.S. federal income tax rates. A Non-U.S. Holder that is a corporation also may be subject to a branch profits tax at a rate of 30% (or such lower rate specified by an applicable income tax treaty) on a portion of its effectively connected earnings and profits for the taxable year that are attributable to such gain, as adjusted for certain items.
Gain described in the second bullet point above will be subject to U.S. federal income tax at a rate of 30% (or such lower rate specified by an applicable income tax treaty), which may be offset by U.S. source capital losses of the Non-U.S. Holder (even though the individual is not considered a resident of the United States), provided the Non-U.S. Holder has timely filed U.S. federal income tax returns with respect to such losses.
With respect to the third bullet point above, we believe we currently are not, and do not anticipate becoming, a USRPHC. Because the determination of whether we are a USRPHC depends, however, on the fair market value of our USRPIs relative to the fair market value of our non-U.S. real property interests and our other business assets, there can be no assurance that we currently are not a USRPHC or that will not become a USRPHC in the future. Even if we are or were to become a USRPHC, our common stock will not be treated as a USRPI if our common stock is “regularly traded,” as defined by applicable Treasury Regulations, on an established securities market, and such Non-U.S. Holder owned, actually or constructively, 5% or less of our common stock throughout the shorter of the five-year period ending on the date of the sale or other taxable disposition of, or the Non-U.S. Holder’s holding period for, our common stock.
Non-U.S. Holders should consult their tax advisors regarding potentially applicable income tax treaties that may provide for different rules.
151
Table of Contents
Information Reporting and Backup Withholding
Payments of dividends on our common stock will not be subject to backup withholding, provided the applicable withholding agent does not have actual knowledge or reason to know the holder is a U.S. person and the holder either certifies its non-U.S. status, such as by furnishing a valid IRS Form W-8BEN, W-8BEN-E, W-8ECI, or W-8EXP, or otherwise establishes an exemption. However, information returns are required to be filed with the IRS in connection with any dividends on our common stock paid to the Non-U.S. Holder, regardless of whether any tax was actually withheld. In addition, proceeds of the sale or other taxable disposition of our common stock within the United States or conducted through certain U.S.-related brokers generally will not be subject to backup withholding or information reporting, if the applicable withholding agent receives the certification described above and does not have actual knowledge or reason to know that such holder is a U.S. person, or the holder otherwise establishes an exemption. Proceeds of a disposition of our common stock conducted through a non-U.S. office of a non-U.S. broker generally will not be subject to backup withholding or information reporting.
Copies of information returns that are filed with the IRS may also be made available under the provisions of an applicable treaty or agreement to the tax authorities of the country in which the Non-U.S. Holder resides or is established or organized.
Backup withholding is not an additional tax. Any amounts withheld under the backup withholding rules may be allowed as a refund or a credit against a Non-U.S. Holder’s U.S. federal income tax liability, provided the required information is timely furnished to the IRS.
Additional Withholding Tax on Payments Made to Foreign Accounts
Withholding taxes may be imposed under FATCA on certain types of payments made to non-U.S. financial institutions and certain other non-U.S. entities. Specifically, a 30% withholding tax may be imposed on dividends on, or gross proceeds from the sale or other disposition of, our common stock paid to a “foreign financial institution” (as defined by the Code to include, in addition to banks and traditional financial institutions, entities such as investment funds and certain holding companies) or a “non-financial foreign entity” (as defined in the Code), unless (1) the foreign financial institution undertakes certain diligence, reporting and withholding obligations, (2) the non-financial foreign entity either certifies it does not have any “substantial United States owners” (as defined in the Code) or furnishes identifying information regarding each substantial United States owner, or (3) the foreign financial institution or non-financial foreign entity otherwise qualifies for an exemption from these rules. If the payee is a foreign financial institution and is subject to the diligence, reporting and withholding requirements in (1) above, it must enter into an agreement with the U.S. Department of the Treasury requiring, among other things, that it undertake to identify accounts held by certain “specified United States persons” or “United States-owned foreign entities” (each as defined in the Code), annually report certain information about such accounts and withhold 30% on certain payments to non-compliant foreign financial institutions and certain other account holders. Accordingly, the entity through which our common stock is held will affect the determination of whether such withholding is required. Foreign financial institutions located in jurisdictions that have an intergovernmental agreement with the United States governing FATCA may be subject to different rules.
Under the applicable Treasury Regulations and related guidance published by the IRS, withholding under FATCA generally applies currently to payments of dividends on our common stock and will apply to payments of gross proceeds from the sale or other disposition of such stock on or after January 1, 2019. The FATCA withholding tax will apply to all withholdable payments without regard to whether the beneficial owner of the payment would otherwise be entitled to an exemption from imposition of withholding tax pursuant to an applicable tax treaty with the United States or U.S. domestic law.
Prospective investors should consult their tax advisors regarding the potential application of withholding under FATCA to their investment in our common stock.
152
Table of Contents
The Company, the selling stockholders and the underwriters named below propose to enter into an underwriting agreement with respect to the shares being offered. Subject to certain conditions, each underwriter will severally agree to purchase the number of shares indicated in the following table. are the representatives of the underwriters.
| Underwriters |
Number of Shares |
|||
| Merrill Lynch, Pierce, Fenner & Smith |
||||
|
Incorporated |
||||
| Deutsche Bank Securities Inc. |
||||
| Goldman Sachs & Co. LLC |
||||
| J.P. Morgan Securities LLC |
||||
|
|
|
|||
| Total |
||||
|
|
|
|||
The underwriters will be committed to take and pay for all of the shares being offered, if any are taken, other than the shares covered by the option described below unless and until this option is exercised. The underwriting agreement also provides that if an underwriter defaults, the purchase commitments of non-defaulting underwriters may also be increased or the offering may be terminated.
The underwriters will have an option to buy up to an additional shares from the selling stockholders to cover sales by the underwriters of a greater number of shares than the total number set forth in the table above. They may exercise this option for 30 days. If any shares are purchased pursuant to this option, the underwriters will severally purchase shares in approximately the same proportion as set forth in the table above.
The following table shows the per share and total underwriting discounts to be paid to the underwriters by the Company and the selling stockholders. Such amounts are shown assuming both no exercise and full exercise of the underwriters’ option to purchase additional shares.
| Paid by the Selling Stockholders |
||||||||||||
| Paid by Us | No Exercise | Full Exercise | ||||||||||
| Per Share |
$ | $ | $ | |||||||||
| Total |
$ | $ | $ | |||||||||
Shares sold by the underwriters to the public will initially be offered at the initial public offering price set forth on the cover of this prospectus. Any shares sold by the underwriters to securities dealers may be sold at a discount of up to $ per share from the initial public offering price. After the initial offering of the shares, the representatives may change the offering price and the other selling terms. The offering of the shares by the underwriters is subject to receipt and acceptance and subject to the underwriters’ right to reject any order in whole or in part.
The Company, its directors, officers, the selling stockholders and holders of all of the Company’s common stock have agreed with the underwriters, subject to certain exceptions, not to dispose of or hedge any of their common stock or securities convertible into or exchangeable for shares of common stock during the period from the date of this prospectus continuing through the date 180 days after the date of this prospectus, except with the prior written consent of the representatives. This agreement does not apply to any existing employee benefit plans. See “Shares Eligible for Future Sale” for a discussion of certain transfer restrictions.
Prior to the offering, there has been no public market for the shares. The initial public offering price has been negotiated among the Company and the representatives. Among the factors to be considered in determining
153
Table of Contents
the initial public offering price of the shares, in addition to prevailing market conditions, will be the Company’s historical performance, estimates of the business potential and earnings prospects of the Company, an assessment of the Company’s management and the consideration of the above factors in relation to market valuation of companies in related businesses.
An application has been made to list the common stock on the NYSE under the symbol “BJ.”
In connection with the offering, the underwriters may purchase and sell shares of common stock in the open market. These transactions may include short sales, stabilizing transactions and purchases to cover positions created by short sales. Short sales involve the sale by the underwriters of a greater number of shares than they are required to purchase in the offering, and a short position represents the amount of such sales that have not been covered by subsequent purchases. A “covered short position” is a short position that is not greater than the amount of additional shares for which the underwriters’ option described above may be exercised. The underwriters may cover any covered short position by either exercising their option to purchase additional shares or purchasing shares in the open market. In determining the source of shares to cover the covered short position, the underwriters will consider, among other things, the price of shares available for purchase in the open market as compared to the price at which they may purchase additional shares pursuant to the option described above. “Naked” short sales are any short sales that create a short position greater than the amount of additional shares for which the option described above may be exercised. The underwriters must cover any such naked short position by purchasing shares in the open market. A naked short position is more likely to be created if the underwriters are concerned that there may be downward pressure on the price of the common stock in the open market after pricing that could adversely affect investors who purchase in the offering. Stabilizing transactions consist of various bids for or purchases of common stock made by the underwriters in the open market prior to the consummation of the offering.
The underwriters may also impose a penalty bid. This occurs when a particular underwriter repays to the underwriters a portion of the underwriting discount received by it because the representatives have repurchased shares sold by or for the account of such underwriter in stabilizing or short covering transactions.
Purchases to cover a short position and stabilizing transactions, as well as other purchases by the underwriters for their own accounts, may have the effect of preventing or retarding a decline in the market price of the company’s stock, and together with the imposition of the penalty bid, may stabilize, maintain or otherwise affect the market price of the common stock. As a result, the price of the common stock may be higher than the price that otherwise might exist in the open market. The underwriters are not required to engage in these activities and may end any of these activities at any time. These transactions may be effected on NYSE, in the over-the-counter market or otherwise.
The Company estimates that its share of the total expenses of the offering, excluding underwriting discounts, will be approximately $ .
The Company and the selling stockholders have agreed to indemnify the several underwriters against certain liabilities, including liabilities under the Securities Act of 1933.
A prospectus in electronic format may be made available on the web sites maintained by one or more underwriters, or selling group members, if any, participating in the offering. The underwriters may agree to allocate a number of shares to underwriters and selling group members for sale to their online brokerage account holders. Internet distributions will be allocated by the representatives to underwriters and selling group members that may make Internet distributions on the same basis as other allocations.
The underwriters and their respective affiliates are full service financial institutions engaged in various activities, which may include sales and trading, commercial and investment banking, advisory, investment management, investment research, principal investment, hedging, market making, brokerage and other financial
154
Table of Contents
and non-financial activities and services. Certain of the underwriters and their respective affiliates have provided, and may in the future provide, a variety of these services to the Company and to persons and entities with relationships with the Company, for which they received or will receive customary fees and expenses. For example, an affiliate of Merrill Lynch Pierce Fenner & Smith Incorporated is a joint bookrunner, co-lead arranger and lender under our ABL Facility and an affiliate of Deutsche Bank Securities Inc. is a co-lead arranger and lender under our ABL Facility.
In the ordinary course of their various business activities, the underwriters and their respective affiliates, officers, directors and employees may purchase, sell or hold a broad array of investments and actively trade securities, derivatives, loans, commodities, currencies, credit default swaps and other financial instruments for their own account and for the accounts of their customers, and such investment and trading activities may involve or relate to assets, securities and/or instruments of the Company (directly, as collateral securing other obligations or otherwise) and/or persons and entities with relationships with the Company. The underwriters and their respective affiliates may also communicate independent investment recommendations, market color or trading ideas and/or publish or express independent research views in respect of such assets, securities or instruments and may at any time hold, or recommend to clients that they should acquire, long and/or short positions in such assets, securities and instruments.
Sales of shares made outside of the United States may be made by affiliates of the underwriters.
European Economic Area
In relation to each Member State of the European Economic Area which has implemented the Prospectus Directive (each, a “Relative Member State”) an offer to the public of our common shares may not be made in that Relevant Member State, except that an offer to the public in that Relevant Member State of our common shares may be made at any time under the following exemptions under the Prospectus Directive:
| • | To any legal entity which is a qualified investor as defined in the Prospectus Directive; |
| • | To fewer than 150 natural or legal persons (other than qualified investors as defined in the Prospectus Directive), subject to obtaining the prior consent of the representatives for any such offer; or |
| • | In any other circumstances falling within Article 3(2) of the Prospectus Directive; |
provided that no such offer or shares of our common stock shall result in a requirement for the publication by us or any Brazilian placement agent of a prospectus pursuant to Article 3 of the Prospectus Directive.
For the purposes of this provision, the expression an “offer to public” in relation to our common shares in any Relevant Member State means the communication in any form and by any means of sufficient information on the terms of the offer and our common shares to be offered so as to enable an investor to decide to purchase our common shares, as the same may be varied in that Member State by any measure implementing the Prospectus Directive in that Member State, the expression “Prospectus Directive” means Directive 2003/71/EC (as amended), including by Directive 2010/73/EU and includes any relevant implementing measure in the Relevant Member State.
This European Economic Area selling restriction is in addition to any other selling restrictions set out below.
United Kingdom
In the United Kingdom, this prospectus is only addressed to and directed as qualified investors who are (i) investment professionals falling within Article 19(5) of the Financial Services and Markets Act 2000 (Financial Promotion) Order 2005 (the Order); or (ii) high net worth entities and other persons to whom it may
155
Table of Contents
lawfully be communicated, falling within Article 49(2)(a) to (d) of the Order (all such persons together being referred to as “relevant persons”). Any investment or investment activity to which this prospectus relates is available only to relevant persons and will only be engaged with relevant persons. Any person who is not a relevant person should not act or relay on this prospectus or any of its contents.
Canada
The securities may be sold in Canada only to purchasers purchasing, or deemed to be purchasing, as principal that are accredited investors, as defined in National Instrument 45-106 Prospectus Exemptions or subsection 73.3(1) of the Securities Act (Ontario), and are permitted clients, as defined in National Instrument 31-103 Registration Requirements, Exemptions and Ongoing Registrant Obligations. Any resale of the securities must be made in accordance with an exemption form, or in a transaction not subject to, the prospectus requirements of applicable securities laws.
Securities legislation in certain provinces or territories of Canada may provide a purchaser with remedies for rescission or damages if this offering memorandum (including any amendment thereto) contains a misrepresentation, provided that the remedies for rescission or damages are exercised by the purchaser within the time limit prescribed by the securities legislation of the purchaser’s province or territory. The purchaser should refer to any applicable provisions of the securities legislation of the purchaser’s province or territory of these rights or consult with a legal advisor.
Pursuant to section 3A.3 of National Instrument 33-105 Underwriting Conflicts (NI 33-105), the underwriters are not required to comply with the disclosure requirements of NI 33-105 regarding underwriter conflicts of interest in connection with this offering.
Hong Kong
The shares may not be offered or sold in Hong Kong by means of any document other than (i) in circumstances which do not constitute an offer to the public within the meaning of the Companies (Winding Up and Miscellaneous Provisions) Ordinance (Cap. 32 of the Laws of Hong Kong) (“Companies (Winding Up and Miscellaneous Provisions) Ordinance”) or which do not constitute an invitation to the public within the meaning of the Securities and Futures Ordinance (Cap. 571 of the Laws of Hong Kong) (“Securities and Futures Ordinance”), or (ii) to “professional investors” as defined in the Securities and Futures Ordinance and any rules made thereunder, or (iii) in other circumstances which do not result in the document being a “prospectus” as defined in the Companies (Winding Up and Miscellaneous Provisions) Ordinance, and no advertisement, invitation or document relating to the shares may be issued or may be in the possession of any person for the purpose of issue (in each case whether in Hong Kong or elsewhere), which is directed at, or the contents of which are likely to be accessed or read by, the public in Hong Kong (except if permitted to do so under the securities laws of Hong Kong) other than with respect to shares which are or are intended to be disposed of only to persons outside Hong Kong or only to “professional investors” in Hong Kong as defined in the Securities and Futures Ordinance and any rules made thereunder.
Singapore
This prospectus has not been registered as a prospectus with the Monetary Authority of Singapore. Accordingly, this prospectus and any other document or material in connection with the offer or sale, or invitation for subscription or purchase, of the shares may not be circulated or distributed, nor may the shares be offered or sold, or be made the subject of an invitation for subscription or purchase, whether directly or indirectly, to persons in Singapore other than (i) to an institutional investor (as defined under Section 4A of the Securities and Futures Act, Chapter 289 of Singapore (the “SFA”)) under Section 274 of the SFA, (ii) to a relevant person (as defined in Section 275(2) of the SFA) pursuant to Section 275(1) of the SFA, or any person pursuant to Section 275(1A) of the SFA and in accordance with the conditions specified in Section 275 of the
156
Table of Contents
SFA or (iii) otherwise pursuant to, and in accordance with the conditions of, any other applicable provision of the SFA, in each case subject to conditions set forth in the SFA.
Where the shares are subscribed or purchased under Section 275 of the SFA by a relevant person which is a corporation (which is not an accredited investor (as defined in Section 4A of the SFA)) the sole business of which is to hold investments and the entire share capital of which is owned by one or more individuals, each of whom is an accredited investor, the securities (as defined in Section 239(1) of the SFA) of that corporation shall not be transferable for 6 months after that corporation has acquired the shares under Section 275 of the SFA except: (1) to an institutional investor under Section 274 of the SFA or to a relevant person (as defined in Section 275(2) of the SFA), (2) where such transfer arises from an offer in that corporation’s securities pursuant to Section 275(1A) of the SFA, (3) where no consideration is or will be given for the transfer, (4) where the transfer is by operation of law, (5) as specified in Section 276(7) of the SFA, or (6) as specified in Regulation 32 of the Securities and Futures (Offers of Investments) (Shares and Debentures) Regulations 2005 of Singapore (“Regulation 32”)
Where the shares are subscribed or purchased under Section 275 of the SFA by a relevant person which is a trust (where the trustee is not an accredited investor (as defined in Section 4A of the SFA)) whose sole purpose is to hold investments and each beneficiary of the trust is an accredited investor, the beneficiaries’ rights and interest (howsoever described) in that trust shall not be transferable for 6 months after that trust has acquired the shares under Section 275 of the SFA except: (1) to an institutional investor under Section 274 of the SFA or to a relevant person (as defined in Section 275(2) of the SFA), (2) where such transfer arises from an offer that is made on terms that such rights or interest are acquired at a consideration of not less than S$200,000 (or its equivalent in a foreign currency) for each transaction (whether such amount is to be paid for in cash or by exchange of securities or other assets), (3) where no consideration is or will be given for the transfer, (4) where the transfer is by operation of law, (5) as specified in Section 276(7) of the SFA, or (6) as specified in Regulation 32.
Japan
The securities have not been and will not be registered under the Financial Instruments and Exchange Act of Japan (Act No. 25 of 1948, as amended), or the FIEA. The securities may not be offered or sold, directly or indirectly, in Japan or to or for the benefit of any resident of Japan (including any person resident in Japan or any corporation or other entity organized under the laws of Japan) or to others for reoffering or resale, directly or indirectly, in Japan or to or for the benefit of any resident of Japan, except pursuant to an exemption from the registration requirements of the FIEA and otherwise in compliance with any relevant laws and regulations of Japan.
Notice to Prospective Investors in Switzerland
The shares may not be publicly offered in Switzerland and will not be listed on the SIX Swiss Exchange (“SIX”) or on any other stock exchange or regulated trading facility in Switzerland. This document has been prepared without regard to the disclosure standards for issuance prospectuses under art. 652a or art. 1156 of the Swiss Code of Obligations or the disclosure standards for listing prospectuses under art. 27 ff. of the SIX Listing Rules or the listing rules of any other stock exchange or regulated trading facility in Switzerland. Neither this document nor any other offering or marketing material relating to the shares or the offering may be publicly distributed or otherwise made publicly available in Switzerland.
Neither this document nor any other offering or marketing material relating to the offering, the Company, the shares have been or will be filed with or approved by any Swiss regulatory authority. In particular, this document will not be filed with, and the offer of shares will not be supervised by, the Swiss Financial Market Supervisory Authority FINMA (FINMA), and the offer of shares has not been and will not be authorized under the Swiss Federal Act on Collective Investment Schemes (“CISA”). The investor protection afforded to acquirers of interests in collective investment schemes under the CISA does not extend to acquirers of shares.
157
Table of Contents
Notice to Prospective Investors in the Dubai International Financial Centre
This prospectus relates to an Exempt Offer in accordance with the Offered Securities Rules of the Dubai Financial Services Authority (“DFSA”). This prospectus is intended for distribution only to persons of a type specified in the Offered Securities Rules of the DFSA. It must not be delivered to, or relied on by, any other person. The DFSA has no responsibility for reviewing or verifying any documents in connection with Exempt Offers. The DFSA has not approved this prospectus nor taken steps to verify the information set forth herein and has no responsibility for the prospectus. The shares to which this prospectus relates may be illiquid and/or subject to restrictions on their resale. Prospective purchasers of the shares offered should conduct their own due diligence on the shares. If you do not understand the contents of this prospectus you should consult an authorized financial advisor.
Notice to Prospective Investors in Australia
No placement document, prospectus, product disclosure statement or other disclosure document has been lodged with the Australian Securities and Investments Commission (“ASIC”), in relation to the offering. This prospectus does not constitute a prospectus, product disclosure statement or other disclosure document under the Corporations Act 2001 (the “Corporations Act”), and does not purport to include the information required for a prospectus, product disclosure statement or other disclosure document under the Corporations Act.
Any offer in Australia of the shares may only be made to persons (the “Exempt Investors”) who are “sophisticated investors” (within the meaning of section 708(8) of the Corporations Act), “professional investors” (within the meaning of section 708(11) of the Corporations Act) or otherwise pursuant to one or more exemptions contained in section 708 of the Corporations Act so that it is lawful to offer the shares without disclosure to investors under Chapter 6D of the Corporations Act.
The shares applied for by Exempt Investors in Australia must not be offered for sale in Australia in the period of 12 months after the date of allotment under the offering, except in circumstances where disclosure to investors under Chapter 6D of the Corporations Act would not be required pursuant to an exemption under section 708 of the Corporations Act or otherwise or where the offer is pursuant to a disclosure document which complies with Chapter 6D of the Corporations Act. Any person acquiring shares must observe such Australian on-sale restrictions.
This prospectus contains general information only and does not take account of the investment objectives, financial situation or particular needs of any particular person. It does not contain any securities recommendations or financial product advice. Before making an investment decision, investors need to consider whether the information in this prospectus is appropriate to their needs, objectives and circumstances, and, if necessary, seek expert advice on those matters.
158
Table of Contents
At our request, the underwriters have reserved for sale, at the initial public offering price, up to 5% of the shares offered by this prospectus for sale to some of our directors, officers, employees, distributors, dealers, business associates and related persons. If these persons purchase reserved shares it will reduce the number of shares available for sale to the general public. Any reserved shares that are not so purchased will be offered by the underwriters to the general public on the same terms as the other shares offered by this prospectus.
159
Table of Contents
The validity of the shares of common stock offered hereby will be passed upon for us by Latham & Watkins LLP, New York, New York. The underwriters are being represented by White & Case LLP, New York, New York in connection with this offering.
The financial statements as of February 3, 2018 and January 28, 2017 and for each of the three years in the period ended February 3, 2018 included in this Prospectus have been so included in reliance on the report of PricewaterhouseCoopers LLP, an independent registered public accounting firm, given on the authority of said firm as experts in auditing and accounting.
WHERE YOU CAN FIND MORE INFORMATION
We have filed with the SEC a registration statement on Form S-1, including exhibits and schedules, under the Securities Act with respect to the common stock to be sold in this offering. As allowed by SEC rules, this prospectus, which constitutes a part of the registration statement, does not contain all of the information set forth in the registration statement or the exhibits and schedules that are part of the registration statement. For further information about us and our common stock, you should refer to the registration statement, including all amendments, supplements, schedules and exhibits thereto.
Statements included elsewhere in this in this prospectus regarding the contents of any contract or any other document that is filed as an exhibit to the registration statement are not necessarily complete, and each such statement is qualified in all respects by reference to the full text of such contract or other document filed as an exhibit to the registration statement.
You may read, without charge, and copy, at prescribed rates, all or any portion of the registration statement or any reports, statements or other information we file with or furnish to the SEC at the SEC’s Public Reference Room at 100 F Street, N.E., Washington, DC 20549. You may also obtain copies of the documents at prescribed rates by writing to the Public Reference Section of the SEC. Please call the SEC at 1-800-SEC-0330 to obtain information on the operation of the Public Reference Room. In addition, the SEC maintains an internet site that contains reports, proxy and information statements and other information regarding issuers that file electronically with the SEC. You can review the registration statement, as well as our future SEC filings, by accessing the SEC’s website at www.sec.gov. You may also request copies of those documents, at no cost to you, by contacting us at the following address:
BJ’s Wholesale Club Holdings, Inc.
Attn: Investor Relations
25 Research Drive
Westborough, Massachusetts 01581
(774) 512-7400
As a result of this offering, we will become subject to the information and reporting requirements of the Exchange Act and will file annual, quarterly and current reports, proxy statements and other information with the SEC. You can request copies of these documents, for a copying fee, by writing to the SEC. We intend to furnish our stockholders with annual reports containing financial statements audited by our independent auditors.
160
Table of Contents
INDEX TO CONSOLIDATED FINANCIAL STATEMENTS
| F-2 | ||||
| Consolidated Financial Statements |
||||
| Consolidated Balance Sheets as of January 28, 2017 and February 3, 2018 |
F-3 | |||
| F-4 | ||||
| F-5 | ||||
| F-6 | ||||
| F-7 - 36 | ||||
F-1
Table of Contents
Report of Independent Registered Public Accounting Firm
To the Board of Directors and Stockholders of BJ’s Wholesale Club Holdings, Inc.
Opinion on the Financial Statements
We have audited the accompanying consolidated balance sheets of BJ’s Wholesale Club Holdings, Inc. and its subsidiaries as of February 3, 2018 and January 28, 2017, and the related consolidated statements of operations and comprehensive income, of contingently redeemable common stock and stockholders’ deficit and of cash flows for each of the three years in the period ended February 3, 2018, including the related notes (collectively referred to as the “consolidated financial statements”). In our opinion, the consolidated financial statements present fairly, in all material respects, the financial position of the Company as of February 3, 2018 and January 28, 2017, and the results of their operations and their cash flows for each of the three years in the period ended February 3, 2018 in conformity with accounting principles generally accepted in the United States of America.
Basis for Opinion
These consolidated financial statements are the responsibility of the Company’s management. Our responsibility is to express an opinion on the Company’s consolidated financial statements based on our audits. We are a public accounting firm registered with the Public Company Accounting Oversight Board (United States) (“PCAOB”) and are required to be independent with respect to the Company in accordance with the U.S. federal securities laws and the applicable rules and regulations of the Securities and Exchange Commission and the PCAOB.
We conducted our audits of these consolidated financial statements in accordance with the standards of the PCAOB. Those standards require that we plan and perform the audit to obtain reasonable assurance about whether the consolidated financial statements are free of material misstatement, whether due to error or fraud.
Our audits included performing procedures to assess the risks of material misstatement of the consolidated financial statements, whether due to error or fraud, and performing procedures that respond to those risks. Such procedures included examining, on a test basis, evidence regarding the amounts and disclosures in the consolidated financial statements. Our audits also included evaluating the accounting principles used and significant estimates made by management, as well as evaluating the overall presentation of the consolidated financial statements. We believe that our audits provide a reasonable basis for our opinion.
/s/ PricewaterhouseCoopers LLP
Boston, Massachusetts
April 18, 2018, except for the effects of the revision described in Note 3 to the consolidated financial statements, as to which the date is May 17, 2018
We have served as the Company’s auditor since 1996.
F-2
Table of Contents
BJ’S WHOLESALE CLUB HOLDINGS, INC.
(Amounts in thousands, except per share amounts)
| January 28, 2017 |
February 3, 2018 |
Pro Forma February 3, 2018 |
||||||||||
| ASSETS |
(unaudited) | |||||||||||
| Current assets: |
||||||||||||
| Cash and cash equivalents |
$ | 31,964 | $ | 34,954 | $ | 34,954 | ||||||
| Accounts receivable, net |
166,249 | 190,756 | 190,756 | |||||||||
| Merchandise inventories |
1,031,844 | 1,019,138 | 1,019,138 | |||||||||
| Prepaid expenses |
34,105 | 81,972 | 81,972 | |||||||||
| Prepaid federal and state income taxes |
233 | 9,784 | 9,784 | |||||||||
|
|
|
|
|
|
|
|||||||
| Total current assets |
1,264,395 | 1,336,604 | 1,336,604 | |||||||||
| Property and equipment: |
||||||||||||
| Land and buildings |
409,397 | 404,400 | 404,400 | |||||||||
| Leasehold costs and improvements |
171,363 | 184,165 | 184,165 | |||||||||
| Furniture, fixtures and equipment |
813,925 | 924,616 | 924,616 | |||||||||
| Construction in progress |
6,848 | 20,775 | 20,775 | |||||||||
|
|
|
|
|
|
|
|||||||
| 1,401,533 | 1,533,956 | 1,533,956 | ||||||||||
| Less: accumulated depreciation and amortization |
(637,890 | ) | (775,206 | ) | (775,206 | ) | ||||||
|
|
|
|
|
|
|
|||||||
| Total property and equipment, net |
763,643 | 758,750 | 758,750 | |||||||||
| Goodwill |
924,134 | 924,134 | 924,134 | |||||||||
| Intangibles, net |
253,159 | 224,876 | 224,876 | |||||||||
| Other assets |
26,888 | 29,492 | 29,492 | |||||||||
|
|
|
|
|
|
|
|||||||
| Total assets |
$ | 3,232,219 | $ | 3,273,856 | $ | 3,273,856 | ||||||
|
|
|
|
|
|
|
|||||||
| LIABILITIES |
||||||||||||
| Current liabilities: |
||||||||||||
| Current portion of long-term debt |
$ | 20,000 | $ | 219,750 | $ | 219,750 | ||||||
| Accounts payable |
720,632 | 751,948 | 751,948 | |||||||||
| Accrued expenses and other current liabilities |
457,697 | 495,767 | 495,767 | |||||||||
| Closed store obligations due within one year |
2,012 | 2,122 | 2,122 | |||||||||
|
|
|
|
|
|
|
|||||||
| Total current liabilities |
1,200,341 | 1,469,587 | 1,469,587 | |||||||||
| Long-term debt |
2,000,118 | 2,492,660 | 2,492,660 | |||||||||
| Noncurrent closed store obligations |
6,258 | 6,561 | 6,561 | |||||||||
| Deferred income taxes |
92,900 | 57,074 | 57,074 | |||||||||
| Other noncurrent liabilities |
271,668 | 267,393 | 267,393 | |||||||||
| Commitments and contingencies (see Note 8) |
||||||||||||
| Contingently redeemable common stock, par value $0.01; 149 and 208 shares issued and outstanding at January 28, 2017 and February 3, 2018, no shares issued and outstanding, pro forma as of February 3, 2018 |
8,145 | 10,438 | — | |||||||||
| STOCKHOLDERS’ DEFICIT |
||||||||||||
| Common stock, par value $0.01; 20,000 shares authorized; 12,439 shares issued and outstanding at January 28, 2017 and February 3, 2018; 12,648 shares issued and outstanding, pro forma as of February 3, 2018 |
124 | 124 | 126 | |||||||||
| Additional paid-in capital |
6,397 | 2,883 | 13,319 | |||||||||
| Accumulated deficit |
(356,013 | ) | (1,035,265 | ) | (1,035,265 | ) | ||||||
| Accumulated other comprehensive income |
2,281 | 2,401 | 2,401 | |||||||||
|
|
|
|
|
|
|
|||||||
| Total stockholders’ deficit |
(347,211 | ) | (1,029,857 | ) | (1,019,419 | ) | ||||||
|
|
|
|
|
|
|
|||||||
| Total liabilities and stockholders’ deficit |
$ | 3,232,219 | $ | 3,273,856 | $ | 3,273,856 | ||||||
|
|
|
|
|
|
|
|||||||
The accompanying notes are an integral part of the consolidated financial statements.
F-3
Table of Contents
BJ’S WHOLESALE CLUB HOLDINGS, INC.
CONSOLIDATED STATEMENTS OF OPERATIONS AND COMPREHENSIVE INCOME
(Amounts in thousands, except per share amounts)
| Fiscal Year Ended January 30, 2016 |
Fiscal Year Ended January 28, 2017 |
Fiscal Year Ended February 3, 2018 |
||||||||||
| Net sales |
$ | 12,220,215 | $ | 12,095,302 | $ | 12,495,995 | ||||||
| Membership fee income |
247,338 | 255,235 | 258,594 | |||||||||
|
|
|
|
|
|
|
|||||||
| Total revenues |
12,467,553 | 12,350,537 | 12,754,589 | |||||||||
| Cost of sales |
10,476,519 | 10,223,017 | 10,513,492 | |||||||||
| Selling, general and administrative expenses |
1,797,780 | 1,908,752 | 2,017,821 | |||||||||
| Preopening expense |
6,458 | 2,749 | 3,004 | |||||||||
|
|
|
|
|
|
|
|||||||
| Operating income |
186,796 | 216,019 | 220,272 | |||||||||
| Interest expense, net |
150,093 | 143,351 | 196,724 | |||||||||
|
|
|
|
|
|
|
|||||||
| Income from continuing operations before income taxes |
36,703 | 72,668 | 23,548 | |||||||||
| Provision (benefit) for income taxes |
12,049 | 27,968 | (28,427 | ) | ||||||||
|
|
|
|
|
|
|
|||||||
| Income from continuing operations |
24,654 | 44,700 | 51,975 | |||||||||
| Loss from discontinued operations, net of income taxes |
(550 | ) | (476 | ) | (1,674 | ) | ||||||
|
|
|
|
|
|
|
|||||||
| Net income |
$ | 24,104 | $ | 44,224 | $ | 50,301 | ||||||
|
|
|
|
|
|
|
|||||||
| Income per share attributable to common stockholders — basic: |
||||||||||||
| Income from continuing operations |
$ | 1.96 | $ | 3.55 | $ | 4.12 | ||||||
| Loss from discontinued operations |
(0.04 | ) | (0.04 | ) | (0.14 | ) | ||||||
|
|
|
|
|
|
|
|||||||
| Net income |
$ | 1.92 | $ | 3.51 | $ | 3.98 | ||||||
|
|
|
|
|
|
|
|||||||
| Income per share attributable to common stockholders — diluted: |
||||||||||||
| Income from continuing operations |
$ | 1.91 | $ | 3.45 | $ | 3.94 | ||||||
| Loss from discontinued operations |
(0.04 | ) | (0.04 | ) | (0.12 | ) | ||||||
|
|
|
|
|
|
|
|||||||
| Net income |
$ | 1.87 | $ | 3.41 | $ | 3.82 | ||||||
|
|
|
|
|
|
|
|||||||
| Weighted-average number of common shares outstanding: |
||||||||||||
| Basic |
12,553 | 12,595 | 12,627 | |||||||||
| Diluted |
12,892 | 12,962 | 13,181 | |||||||||
| Other comprehensive income, net of tax: |
||||||||||||
| Postretirement medical plan adjustment, net of income tax of $717, $744 and $204, respectively |
$ | 1,045 | $ | (1,086 | ) | $ | (312 | ) | ||||
| Unrealized gain on cash flow hedge, net of income tax of $424, $25 and $0, respectively |
619 | 38 | — | |||||||||
|
|
|
|
|
|
|
|||||||
| Total other comprehensive income, net of tax |
$ | 25,768 | $ | 43,176 | $ | 49,989 | ||||||
|
|
|
|
|
|
|
|||||||
The accompanying notes are an integral part of the consolidated financial statements.
F-4
Table of Contents
BJ’S WHOLESALE CLUB HOLDINGS, INC.
CONSOLIDATED STATEMENTS OF CONTINGENTLY REDEEMABLE COMMON STOCK AND STOCKHOLDERS’ DEFICIT
(Amount in thousands, except share amounts)
| Contingently Redeemable Common Stock |
Common Stock | Additional Paid-in Capital |
Accumulated Deficit |
Accumulated Other Comprehensive Income |
Total Stockholders’ Deficit |
|||||||||||||||||||||||||||
| Shares | Amount | Shares | Amount | |||||||||||||||||||||||||||||
| Balance, January 31, 2015 |
59 | $ | 6,944 | 12,439 | $ | 124 | $ | (4,923 | ) | $ | (424,341 | ) | $ | 1,665 | $ | (427,475 | ) | |||||||||||||||
| Net income |
— | — | — | — | — | 24,104 | — | 24,104 | ||||||||||||||||||||||||
| Postretirement medical plan adjustment, net of tax |
— | — | — | — | — | — | 1,045 | 1,045 | ||||||||||||||||||||||||
| Unrealized gain on cash flow hedge, net of tax |
— | — | — | — | — | — | 619 | 619 | ||||||||||||||||||||||||
| Dividends paid |
— | — | — | — | (25 | ) | — | — | (25 | ) | ||||||||||||||||||||||
| Stock compensation expense |
— | — | — | — | 2,265 | — | — | 2,265 | ||||||||||||||||||||||||
| Stock issuance |
24 | 500 | — | — | — | — | — | — | ||||||||||||||||||||||||
| Option exercises |
72 | 1,313 | — | — | (638 | ) | — | — | (638 | ) | ||||||||||||||||||||||
| Call of shares |
(20 | ) | (806 | ) | — | — | (144 | ) | — | — | (144 | ) | ||||||||||||||||||||
| Other equity transactions |
— | — | — | — | (824 | ) | — | — | (824 | ) | ||||||||||||||||||||||
|
|
|
|
|
|
|
|
|
|
|
|
|
|
|
|
|
|||||||||||||||||
| Balance, January 30, 2016 |
135 | $ | 7,951 | 12,439 | $ | 124 | $ | (4,289 | ) | $ | (400,237 | ) | $ | 3,329 | $ | (401,073 | ) | |||||||||||||||
|
|
|
|
|
|
|
|
|
|
|
|
|
|
|
|
|
|||||||||||||||||
| Net income |
— | — | — | — | — | 44,224 | — | 44,224 | ||||||||||||||||||||||||
| Postretirement medical plan adjustment, net of tax |
— | — | — | — | — | — | (1,086 | ) | (1,086 | ) | ||||||||||||||||||||||
| Unrealized gain on cash flow hedge, net of tax |
— | — | — | — | — | — | 38 | 38 | ||||||||||||||||||||||||
| Dividends paid |
— | — | — | — | (25 | ) | — | — | (25 | ) | ||||||||||||||||||||||
| Stock compensation expense |
— | — | — | — | 11,828 | — | — | 11,828 | ||||||||||||||||||||||||
| Option exercises |
31 | 1,038 | (661 | ) | (661 | ) | ||||||||||||||||||||||||||
| Call of shares |
(17 | ) | (844 | ) | (583 | ) | (583 | ) | ||||||||||||||||||||||||
| Other equity transactions |
— | — | — | — | 127 | — | — | 127 | ||||||||||||||||||||||||
|
|
|
|
|
|
|
|
|
|
|
|
|
|
|
|
|
|||||||||||||||||
| Balance, January 28, 2017 |
149 | $ | 8,145 | 12,439 | $ | 124 | $ | 6,397 | $ | (356,013 | ) | $ | 2,281 | $ | (347,211 | ) | ||||||||||||||||
|
|
|
|
|
|
|
|
|
|
|
|
|
|
|
|
|
|||||||||||||||||
| Net income |
— | $ | — | — | $ | — | $ | — | 50,301 | $ | — | 50,301 | ||||||||||||||||||||
| Postretirement medical plan adjustment, net of tax |
— | — | — | — | — | — | (312 | ) | (312 | ) | ||||||||||||||||||||||
| Dividends paid |
— | — | — | — | (6,397 | ) | (729,121 | ) | — | (735,518 | ) | |||||||||||||||||||||
| Stock compensation expense |
— | — | — | — | 9,102 | — | — | 9,102 | ||||||||||||||||||||||||
| Option exercises |
88 | 3,708 | — | — | (2,850 | ) | — | — | (2,850 | ) | ||||||||||||||||||||||
| Call of shares |
(29 | ) | (1,415 | ) | — | — | (554 | ) | — | — | (554 | ) | ||||||||||||||||||||
| Other equity transactions |
— | — | — | — | (2,815 | ) | (432 | ) | 432 | (2,815 | ) | |||||||||||||||||||||
|
|
|
|
|
|
|
|
|
|
|
|
|
|
|
|
|
|||||||||||||||||
| Balance, February 3, 2018 |
208 | $ | 10,438 | 12,439 | $ | 124 | $ | 2,883 | $ | (1,035,265 | ) | $ | 2,401 | $ | (1,029,857 | ) | ||||||||||||||||
|
|
|
|
|
|
|
|
|
|
|
|
|
|
|
|
|
|||||||||||||||||
The accompanying notes are an integral part of the consolidated financial statements.
F-5
Table of Contents
BJ’S WHOLESALE CLUB HOLDINGS, INC.
CONSOLIDATED STATEMENTS OF CASH FLOWS
(Amounts in thousands)
| Fiscal Year Ended January 30, 2016 |
Fiscal Year Ended January 28, 2017 |
Fiscal Year Ended February 3, 2018 |
||||||||||
| CASH FLOWS FROM OPERATING ACTIVITIES |
||||||||||||
| Net income |
$ | 24,104 | $ | 44,224 | $ | 50,301 | ||||||
| Adjustments to reconcile net income to net cash provided by operating activities: |
||||||||||||
| Charges for discontinued operations |
913 | 802 | 2,766 | |||||||||
| Depreciation and amortization |
177,483 | 178,325 | 164,061 | |||||||||
| Amortization of debt issuance costs and accretion of original issues discount |
16,848 | 17,091 | 8,463 | |||||||||
| Write off of debt issuance costs |
— | — | 9,788 | |||||||||
| Other non cash items, net |
(4,534 | ) | 32 | 3,892 | ||||||||
| Stock-based compensation expense |
2,265 | 11,828 | 9,102 | |||||||||
| Deferred income tax provision |
(21,428 | ) | (23,530 | ) | (35,623 | ) | ||||||
| Increase (decrease) in cash due to changes in: |
||||||||||||
| Accounts receivable |
(2,253 | ) | 26,533 | (24,507 | ) | |||||||
| Merchandise inventories |
(23,660 | ) | 30,010 | 12,706 | ||||||||
| Prepaid expenses |
(967 | ) | 16,184 | (47,867 | ) | |||||||
| Other assets |
(598 | ) | 2,034 | 967 | ||||||||
| Accounts payable |
12,454 | (29,277 | ) | 36,081 | ||||||||
| Change in book overdrafts |
(20,077 | ) | (42,781 | ) | 7,523 | |||||||
| Accrued expenses |
12,086 | 49,441 | 23,241 | |||||||||
| Accrued income taxes |
(13,121 | ) | 6,343 | (12,651 | ) | |||||||
| Closed store obligations |
(2,033 | ) | (1,942 | ) | (2,354 | ) | ||||||
| Other noncurrent liabilities |
1,879 | 12,111 | 4,196 | |||||||||
|
|
|
|
|
|
|
|||||||
| Net cash provided by operating activities |
159,361 | 297,428 | 210,085 | |||||||||
|
|
|
|
|
|
|
|||||||
| CASH FLOWS FROM INVESTING ACTIVITIES |
||||||||||||
| Additions to property and equipment, net of disposals |
(112,363 | ) | (114,756 | ) | (137,466 | ) | ||||||
|
|
|
|
|
|
|
|||||||
| Net cash used in investing activities |
(112,363 | ) | (114,756 | ) | (137,466 | ) | ||||||
|
|
|
|
|
|
|
|||||||
| CASH FLOWS FROM FINANCING ACTIVITIES |
||||||||||||
| Proceeds from long term debt |
— | — | 547,544 | |||||||||
| Payments on long term debt |
(16,760 | ) | (65,161 | ) | (14,437 | ) | ||||||
| Proceeds from ABL facility |
1,841,456 | 1,166,000 | 1,645,000 | |||||||||
| Payments on ABL facility |
(1,871,456 | ) | (1,287,000 | ) | (1,483,000 | ) | ||||||
| Debt issuance costs paid |
— | (754 | ) | (24,635 | ) | |||||||
| Dividends paid |
(25 | ) | (25 | ) | (735,518 | ) | ||||||
| Capital lease and financing obligations payments |
(553 | ) | (535 | ) | (657 | ) | ||||||
| Cash received from stock exercises and issuance |
1,175 | 377 | 858 | |||||||||
| Cash paid for share repurchases |
(950 | ) | (1,427 | ) | (1,969 | ) | ||||||
| Other financing activities |
877 | 407 | (2,815 | ) | ||||||||
|
|
|
|
|
|
|
|||||||
| Net cash used in financing activities |
(46,236 | ) | (188,118 | ) | (69,629 | ) | ||||||
|
|
|
|
|
|
|
|||||||
| Net increase (decrease) in cash and cash equivalents |
762 | (5,446 | ) | 2,990 | ||||||||
| Cash and cash equivalents at beginning of period |
36,648 | 37,410 | 31,964 | |||||||||
|
|
|
|
|
|
|
|||||||
| Cash and cash equivalents at end of period |
$ | 37,410 | $ | 31,964 | $ | 34,954 | ||||||
|
|
|
|
|
|
|
|||||||
| Supplemental cash flow information: |
||||||||||||
| Interest paid, net of capitalized interest |
$ | 132,800 | $ | 126,919 | $ | 152,178 | ||||||
| Income taxes paid |
44,720 | 45,746 | 14,820 | |||||||||
| Noncash financing and investing activities: |
||||||||||||
| Property additions included in accrued expenses |
19,571 | 16,915 | 19,405 | |||||||||
| Property acquired through financing obligations |
— | 6,500 | — | |||||||||
The accompanying notes are an integral part of the consolidated financial statements.
F-6
Table of Contents
BJ’S WHOLESALE CLUB HOLDINGS, INC.
NOTES TO CONSOLIDATED FINANCIAL STATEMENTS
1. Description of Business
BJ’s Wholesale Club Holdings, Inc. and its wholly owned subsidiaries (the “Company” or “BJ’s”) is a leading warehouse club operator in the eastern United States of America. As of February 3, 2018, BJ’s operated 215 warehouse clubs in 16 states.
BJ’s business, in common with the business of retailers generally, is subject to seasonal influences. Sales and operating income have typically been strongest in the fourth quarter holiday season and lowest in the first quarter of each fiscal year.
BJ’s Wholesale Club, Inc. was previously an independent publicly traded corporation until its acquisition on September 30, 2011, by a subsidiary of Beacon Holding Inc., a company incorporated on June 24, 2011 by investment funds affiliated with or advised by Leonard Green & Partners and CVC Capital Partners, (collectively, “the Sponsors”) for the purpose of the acquisition. Beacon Holding Inc. changed its name to BJ’s Wholesale Club Holdings, Inc. on February 23, 2018.
2. Summary of Significant Accounting Policies
Basis of Presentation
The consolidated financial statements have been prepared in conformity with accounting principles generally accepted in the United States of America (“GAAP”). The consolidated financial statements include the Company and its subsidiaries. All intercompany balances and transactions have been eliminated in consolidation.
Fiscal Year
The Company’s fiscal year ends on the Saturday closest to January 31. Fiscal year 2015 (“2015”) consists of the 52 weeks ended January 30, 2016, Fiscal year 2016 (“2016”) consists of the 52 weeks ended January 28, 2017, and fiscal year 2017 (“2017”) consists of the 53 weeks ended February 3, 2018.
Estimates Included in Financial Statements
The preparation of financial statements in conformity with GAAP requires management to make estimates and assumptions that affect the reported amounts of assets, liabilities and stockholders’ equity, and the disclosure of contingent assets and liabilities at the date of the financial statements and the reported amounts of revenues and expenses during the reporting period. Significant estimates relied upon in preparing these consolidated financial statements include, but are not limited to, revenue recognition; vendor rebates and allowances; estimating inventory reserves; estimating impairment assessments of goodwill, intangible assets, and other long-lived assets; estimating self-insurance reserves; estimating income taxes and equity-based compensation. Actual results could differ from those estimates.
Segment Reporting
The Company’s club retail operations, which represent substantially all of the Company’s consolidated total revenues, are the Company’s only reportable segment. All of the Company’s identifiable assets are located in the United States. The Company does not have significant sales outside the United States, nor does any customer represent more than 10% of total revenues for any period presented.
F-7
Table of Contents
The following table summarizes the percentage of net sales by category:
| Fiscal Year | ||||||||||||
| 2015 % of Total |
2016 % of Total |
2017 % of Total |
||||||||||
| Edible Grocery |
24 | % | 25 | % | 24 | % | ||||||
| Perishables |
30 | % | 29 | % | 29 | % | ||||||
| Non-Edible Grocery |
21 | % | 22 | % | 21 | % | ||||||
| General Merchandise |
14 | % | 14 | % | 14 | % | ||||||
| Gasoline & Other Ancillary Services |
11 | % | 10 | % | 12 | % | ||||||
Concentration Risk
An adverse change in the Company’s relationships with its key suppliers could have a material effect on the business and results of operations of the Company. Currently, one distributor consolidates a substantial majority of perishables for shipment to the clubs. While the Company believes that such a consolidation is in its best interest overall, a prolonged disruption in logistics processes could materially impact sales and profitability for the near term.
All of the warehouse clubs are located in the eastern United States. Sales from the New York metropolitan area made up approximately 25% of net sales in 2015, 2016 and 2017.
Financial instruments that potentially subject the Company to concentrations of credit risk principally consist of cash held in financial institutions. The Company considers the credit risk associated with these financial instruments to be minimal. Cash is held by financial institutions with high credit ratings and the Company has not historically sustained any credit losses associated with its cash balances.
Unaudited Pro Forma Balance Sheet Information
The accompanying unaudited pro forma balance sheet as of February 3, 2018 has been prepared to give the effect to the termination of the employees’ put rights on the contingently redeemable common stock upon an initial public offering (“IPO”), as if the Company’s proposed IPO had occurred on February 3, 2018. See Note 10.
Cash and Cash Equivalents
Highly liquid investments with a maturity of three months or less at the time of purchase are considered to be cash equivalents. Book overdrafts not subject to offset with other accounts with the same financial institution are classified as accounts payable.
Accounts Receivable
Accounts receivable consists primarily of credit card receivables and receivables from vendors related to rebates and coupons and is stated net of allowances for doubtful accounts of $1.3 million at January 28, 2017 and $1.2 million at February 3, 2018. The determination of the allowance for doubtful accounts is based on BJ’s historical experience applied to an aging of accounts and a review of individual accounts with a known potential for write-off.
Merchandise Inventories
Inventories are stated at the lower of cost, determined under the average cost method, or net realizable value. The Company recognizes the write-down of slow-moving or obsolete inventory in cost of sales when such
F-8
Table of Contents
write-downs are probable and estimable. The Company writes down inventory for estimated shrinkage for the period between physical inventories based on historical results of previous physical inventories, shrinkage trends or other judgments management believes to be reasonable under the circumstances.
Property and Equipment
Property and equipment are recorded at cost and depreciated over their estimated useful lives using the straight-line method. Buildings and improvements are depreciated over estimated useful lives of 33 years. Interest related to the development of buildings is capitalized during the construction period. Leasehold costs and improvements are amortized over the remaining lease term (which includes renewal periods that are reasonably assured) or the asset’s estimated useful life, whichever is shorter. Furniture, fixtures and equipment are depreciated over estimated useful lives, ranging from three to ten years. Depreciation expense was $145.7 million in 2015, $149.5 million in 2016 and $138.0 million in 2017.
Certain costs incurred in connection with developing or obtaining computer software for internal use are capitalized. Capitalized software costs are included in furniture, fixtures, and equipment and are amortized on a straight-line basis over the estimated useful life of the software, which is three to seven years. Software costs not meeting the criteria for capitalization are expensed as incurred.
Expenditures for betterments and major improvements that significantly enhance the value and increase the estimated useful life of the assets are capitalized and depreciated over the new estimated useful life. Repairs and maintenance costs on all assets are expensed as incurred.
Deferred Issuance Costs
The Company defers costs directly associated with acquiring third-party financing. Debt issuance costs related to the term loans are recorded as a direct deduction from the carrying amount of the debt and debt issuance costs associated with the ABL are recorded within other assets. Debt issuance costs are amortized over the term of the related financing arrangements on a straight-line basis, which is materially consistent with the effective interest method. Amortization of deferred debt issuance costs is recorded in interest expense and was $7.4 million in 2015, $7.7 million in 2016 and $4.1 million in 2017.
Goodwill and Indefinite-Lived Intangible Assets
Goodwill and indefinite-lived trade name intangible assets are not subject to amortization. The Company assesses the recoverability of its goodwill and trade name annually in the fourth quarter or whenever events or changes in circumstances indicate it may be impaired. The Company has determined it has one reporting unit for goodwill impairment testing purposes.
The Company may assess its goodwill for impairment initially using a qualitative approach (“step zero”) to determine whether conditions exist to indicate that it is more likely than not that the fair value of a reporting unit is less than its carrying value. If management concludes, based on its assessment of relevant events, facts and circumstances that it is more likely than not that a reporting unit’s carrying value is greater than its fair value, then a quantitative analysis will be performed to determine if there is any impairment. The Company may also elect to initially perform a quantitative analysis instead of starting with step zero. The quantitative assessment for goodwill is a two-step assessment. “Step one” requires comparing the carrying value of a reporting unit, including goodwill, to its fair value. If the fair value of the reporting unit exceeds its carrying amount, goodwill is not considered to be impaired and no further testing is required. If the carrying amount of the reporting unit exceeds its fair value, the second step of the goodwill impairment test is to measure the amount of impairment loss, if any. “Step two” compares the implied fair value of goodwill to the carrying amount of goodwill. The implied fair value of goodwill is determined by a hypothetical purchase price allocation using the reporting unit’s fair value as the purchase price. If the carrying amount of goodwill exceeds the implied fair value, an impairment
F-9
Table of Contents
charge is recorded to write down goodwill to its implied fair value and is recorded as a component of selling, general and administrative expense (“SG&A”). The Company assessed the recoverability of goodwill in 2015, 2016 and 2017 and determined that there was no impairment.
The Company assesses the recoverability of its trade name whenever there are indicators of impairment, or at least annually in the fourth quarter. If the recorded carrying value of the trade name exceeds its estimated fair value, the Company records a charge to write the intangible asset down to its estimated fair value as a component of SG&A. The Company assessed the recoverability of the BJ’s trade name and determined that its estimated fair value exceeded its carrying value and that no impairment was necessary in 2015, 2016 or 2017.
Impairment of Long-lived Assets
The Company reviews the realizability of long-lived assets periodically and whenever events or changes in circumstances indicate that their carrying amounts may not be recoverable. Current and expected operating results and cash flows and other factors are considered in connection with management’s reviews. For purposes of evaluating the recoverability of long-lived assets, the recoverability test is performed using undiscounted net cash flows of individual clubs and consolidated net cash flows for long-lived assets not identifiable to individual clubs. Impairment losses are measured as the difference between the carrying amount and the estimated fair value of the assets being evaluated. No impairment charges were recorded in 2015, 2016 or 2017.
Asset Retirement Obligations
An asset retirement obligation represents a legal obligation associated with the retirement of a tangible long-lived asset that is incurred upon the acquisition, construction, development or normal operation of that long-lived asset. The Company recognizes asset retirement obligations in the period in which they are placed in service, if a reasonable estimate of fair value can be made. The asset retirement obligation is subsequently adjusted for changes in fair value. The associated estimated asset retirement costs are capitalized in leasehold improvements and depreciated over their useful life. The Company’s asset retirement obligations relate to the future removal of gasoline tanks and related assets from gasoline stations. See Note 15 for further information on the amounts accrued.
Self-Insurance Reserves
The Company is primarily self-insured for workers’ compensation, general liability claims and medical claims. Reported reserves for these claims are derived from estimated ultimate costs based upon individual claim file reserves and estimates for incurred but not reported claims. The Company carries stop-loss insurance on its workers’ compensation and general liability claims to mitigate its exposure to large claims.
Revenue Recognition
Revenue is recognized from the sale of merchandise, net of estimated returns, at the time of purchase by the customer in the club. In the limited instances when the customer is not able to take delivery at the point of sale, revenue from the sale of merchandise is not recognized until title and risk of loss pass to the customer. For sales of merchandise on the Company’s website, revenue is also recognized when title and risk of loss pass to the customer, which is normally at the time the merchandise is received by the customer. Sales incentives redeemable only at BJ’s, such as coupons and instant rebates, are recorded as a reduction of net sales.
The Company evaluates whether it is appropriate to record the gross amount of merchandise or service sales and related costs or the net amount earned as commission. Generally, when the Company is considered the primary obligor in the transaction, revenue is recorded at the gross sales price. If the Company is not considered the primary obligor, as in the case of third party ancillary services such as vision care, travel and insurance that are offered in club or through bjs.com, the net amount retained is recorded.
F-10
Table of Contents
Membership fee income (“MFI”) is recognized on a straight-line basis over the life of the membership, which is typically 12 months.
The Company’s BJ’s Perks Rewards members earn 2% cash back, up to a maximum of $500 per year, on all qualified purchases made at BJ’s. The Company’s My BJ’s Perks Mastercard holders earn 3% or 5% cash back on all qualified purchases made at BJ’s and 1% or 2% cash back on purchases made with the card outside of BJ’s. Cash back is in the form of electronic awards issued in $20 increments that may be used in-club at the register and expire six months from the date issued. The Company accounts for the awards as a reduction of net sales, with the related liability classified within other current liabilities. This liability was $21.1 million in 2016 and $22.7 million in 2017.
BJ’s gift cards are available for purchase at all clubs. Revenue from gift card sales is recognized upon redemption of the gift card. Revenue from gift card and rewards breakage is recorded in net sales when the likelihood of redemption is remote and the Company does not have a legal obligation to escheat the value of unredeemed gift cards and rewards to any jurisdiction. Breakage recorded in 2015, 2016 and 2017 was not material.
The sales returns reserve, which reduces sales and cost of sales for the estimated impact of returns and also includes an estimate for membership cancellations, was $2.3 million in 2015, $3.7 million in 2016 and $3.4 million in 2017.
Warranty Programs
The Company passes on any manufacturers’ warranties to the members. In addition, BJ’s includes an extended warranty on tires sold at the clubs, under which BJ’s customers receive tire repair services or tire replacement in certain circumstances. This warranty is included in the sale price of the tire and it cannot be declined by the customers. The Company is fully liable for claims under the tire warranty program. As the primary obligor in these arrangements, associated revenue is recognized on the date of sale and an estimated warranty obligation is accrued based on claims experience. The liability for future claims under this program is not material to the financial statements.
Extended warranties are also offered on certain types of products such as electronics and jewelry. These warranties are provided by a third party at fixed prices to BJ’s. No liability is retained to satisfy warranty claims under these arrangements. The Company is not the primary obligor under these warranties, and as such net revenue is recorded on these arrangements at the time of sale. Revenue from warranty sales is included in net sales on the income statement.
Cost of Sales
The Company’s cost of sales includes the direct costs of sold merchandise, which includes customs, taxes, duties and inbound shipping costs, inventory shrinkage and adjustments and reserves for excess, aged and obsolete inventory. Cost of goods sold also includes certain distribution center costs and allocations of certain indirect costs, such as occupancy, depreciation, amortization, labor and benefits.
Presentation of Sales Tax Collected from Customers and Remitted to Governmental Authorities
In the ordinary course of business, sales tax is collected on items purchased by the members that are taxable in the jurisdictions when the purchases take place. These taxes are then remitted to the appropriate taxing authority. These taxes collected are excluded from revenues in the financial statements.
Vendor Rebates and Allowances
The Company receives various types of cash consideration from vendors, principally in the form of rebates, based on purchasing or selling certain volumes of product, time-based rebates or allowances, which may include
F-11
Table of Contents
product placement allowances or exclusivity arrangements covering a predetermined period of time, price protection rebates and allowances for retail price reductions on certain merchandise and salvage allowances for product that is damaged, defective or becomes out-of-date.
Such vendor rebates and allowances are recognized based on a systematic and rational allocation of the cash consideration offered to the underlying transaction that results in progress by BJ’s toward earning the rebates and allowances, provided the amounts to be earned are probable and reasonably estimable. Otherwise, rebates and allowances are recognized only when predetermined milestones are met. The Company recognizes product placement allowances as a reduction of cost of sales in the period in which the product placement is completed. Time-based rebates or allowances are recognized as a reduction of cost of sales over the performance period on a straight-line basis. All other vendor rebates and allowances are recognized as a reduction of cost of sales when the merchandise is sold or otherwise disposed.
Cash consideration is also received for advertising products in publications sent to BJ’s members. Such cash consideration is recognized as a reduction of SG&A to the extent it represents a reimbursement of specific, incremental and identifiable SG&A costs incurred by BJ’s to sell the vendors’ products. If the cash consideration exceeds the costs being reimbursed, the excess is characterized as a reduction of cost of sales. Cash consideration for advertising vendors’ products is recognized in the period in which the advertising takes place.
Manufacturers’ Incentives Tendered by Consumers
Consideration from manufacturers’ incentives (such as rebates or coupons) is recorded gross in net sales when the incentive is generic and can be tendered by a consumer at any reseller and the Company receives direct reimbursement from the manufacturer, or clearinghouse authorized by the manufacturer, based on the face value of the incentive. If these conditions are not met, such consideration is recorded as a decrease in cost of sales.
Leases
The majority of leases are accounted for as operating leases in accordance with ASC 840, Leases. Assets subject to an operating lease and the related lease payments are not recorded on the balance sheet. Rent expense is recognized on a straight-line basis over the expected lease term. The lease term begins on the date the Company becomes legally obligated for the rent payments or takes possession of the property, whichever is earlier. The lease term includes cancelable option periods where failure to exercise such options would result in economic penalty.
Sometimes, the Company is involved in the construction of leased clubs. In these situations, the Company evaluates whether it is deemed the owner of the club for accounting purposes. If deemed the owner of the construction project, the Company capitalizes the construction costs of the club on the balance sheet and records financing obligations equal to the cash proceeds or fair value of the assets received from the landlord. Upon the completion of the project, a sale-leaseback analysis is performed pursuant to current leasing guidance to determine if the assets and related financing obligations can be removed from the balance sheet. Assuming the assets and liabilities are removed from the balance sheet, leases are classified as either operating or capital. In some of the leases, the Company is reimbursed only a portion of the construction cost or the lease has terms that fix the rental payments for a significant percentage of the leased asset’s economic life. These items generally are considered continuing involvement which precludes removing the assets and related financing obligation from the balance sheet when construction is complete. Rent expense is not reported for any properties which are considered owned for accounting purposes. Rental payments under these leases are allocated as a reduction of the financing obligation and interest expense.
Assets recorded under capital lease and financing obligations are included in land and buildings on the balance sheet and are depreciated over their estimated useful lives using the straight-line method. As of January 28, 2017, and February 3, 2018, the gross amount of assets recorded under capital lease and financing
F-12
Table of Contents
obligations was $49.4 million. Related accumulated depreciation for these assets as of January 30, 2016, January 28, 2017 and February 3, 2018 was $8.1 million, $10.2 million and $12.2 million, respectively.
Preopening Costs
Preopening costs consist of direct incremental costs of opening or relocating a facility and are expensed as incurred.
Advertising Costs
Advertising costs generally consist of efforts to acquire new members and typically include media advertising (some of which is vendor-funded). BJ’s expenses advertising as incurred as a component of SG&A. Advertising expenses were approximately 0.4%, 0.5% and 0.6% of net sales in 2015, 2016 and 2017, respectively.
Stock-Based Compensation
The fair value of service-based employee awards is recognized as compensation expense on a straight-line basis over the requisite service period of the award. The fair value of the performance-based awards is recognized as compensation expense ratably over the service period of each performance tranche. The fair value of the stock-based awards is determined using the Black-Scholes option pricing model. Determining the fair value of options at the grant date requires judgment, including estimating the expected term that stock options will be outstanding prior to exercise and the associated volatility.
The estimated fair value of the Company’s stock is determined by its board of directors, with input from management and considering third-party valuations of common stock. See Note 11 for an additional description of the accounting for stock-based awards.
Earnings Per Share
Basic net income per share attributable to common stockholders is calculated by dividing net income available to common stockholders by the weighted average number of common shares outstanding for the period, including contingently redeemable common stock recorded outside of stockholders’ equity. Basic income from continuing operations per share attributable to common stockholders is calculated by dividing income from continuing operations available to common stockholders by the weighted average number of common shares outstanding for the period, including contingently redeemable common stock recorded outside of stockholders’ equity. Basic loss from discontinuing operations per share attributable to common stockholders is calculated by dividing loss from discontinuing operations available to common stockholders by the weighted average number of common shares outstanding for the period, including contingently redeemable common stock recorded outside of stockholders’ equity.
Diluted net income per share attributable to common stockholders is calculated by dividing net income available to common stockholders by the diluted weighted average number of common shares outstanding for the period. Diluted income from continuing operations per share attributable to common stockholders is calculated by dividing income from continuing operations available to common stockholders by the diluted weighted average number of common shares outstanding for the period. Diluted loss from discontinuing operations per share attributable to common stockholders is calculated by dividing loss from discontinuing operations available to common stockholders by the diluted weighted average number of common shares outstanding for the period.
Income Taxes
The Company accounts for income taxes using the asset and liability method. Under this method, deferred tax assets and liabilities are recognized for the expected future tax consequences of temporary differences
F-13
Table of Contents
between the financial statement carrying values and their respective tax bases, using enacted tax rates expected to be applicable in the years in which the temporary differences are expected to reverse. Changes in deferred tax assets and liabilities are recorded in the provision for income taxes. The Company evaluates the realizability of its deferred tax assets and establishes a valuation allowance when it is more likely than not that all or a portion of the deferred tax assets will not be realized. Potential for recovery of deferred tax assets is evaluated by estimating the future taxable profits expected, scheduling of anticipated reversals of taxable temporary differences, and considering prudent and feasible tax planning strategies.
The Company records liabilities for uncertain income tax positions based on a two-step process. The first step is recognition, where an individual tax position is evaluated as to whether it has a likelihood of greater than 50% of being sustained upon examination based on the technical merits of the position, including resolution of any related appeals or litigation processes. For tax positions that are currently estimated to have less than a 50% likelihood of being sustained, no tax benefit is recorded. For tax positions that have met the recognition threshold in the first step, the Company performs the second step of measuring the benefit to be recorded. The amount of the benefit that may be recognized is the largest amount that has a greater than 50% likelihood of being realized on ultimate settlement. The actual benefits ultimately realized may differ from the estimates. In future periods, changes in facts, circumstances and new information may require the Company to change the recognition and measurement estimates with regard to individual tax positions. Changes in recognition and measurement estimates are recorded in income tax expense and liability in the period in which such changes occur.
Any interest or penalties incurred related to unrecognized tax benefits are recorded as a component of the provision for income tax expense.
Derivative Financial Instruments
All derivatives are recognized as either assets or liabilities on the consolidated balance sheet and measurement of these instruments is at fair value. If the derivative is designated as a cash flow hedge, the effective portions of changes in the fair value of the derivative are recorded as a component of accumulated other comprehensive income and are recognized in the consolidated statement of operations when the hedged item affects earnings. Any portion of the change in fair value that is determined to be ineffective is immediately recognized in earnings as SG&A. Derivative gains or losses included in accumulated other comprehensive income are reclassified into earnings at the time the hedged transaction occurs as a component of SG&A.
Fair Value of Financial Instruments
Certain assets and liabilities are carried at fair value in accordance with GAAP. Fair value is defined as the exchange price that would be received for an asset or paid to transfer a liability (an exit price) in the principal or most advantageous market for the asset or liability in an orderly transaction between market participants on the measurement date.
The Company uses a three-level hierarchy that prioritizes the inputs used to measure fair value. This hierarchy requires entities to maximize the use of observable inputs and minimize the use of unobservable inputs. Financial assets and liabilities carried at fair value are to be classified and disclosed in one of the following three levels of the fair value hierarchy, of which the first two are considered observable and the last is considered unobservable:
| ● | Level 1, quoted market prices in active markets for identical assets or liabilities. |
| ● | Level 2, observable inputs other than quoted market prices included in Level 1 such as quoted market prices for markets that are not active or other inputs that are observable or can be corroborated by observable market data. |
| ● | Level 3, unobservable inputs that are supported by little or no market activity and that are significant to the fair value of the assets or liabilities, including certain pricing models, discounted cash flow methodologies and similar techniques that use significant unobservable inputs. |
F-14
Table of Contents
Comprehensive Income
Comprehensive income is a measure of net income and all other changes in equity that result from transactions other than with equity holders, and would normally be recorded in the consolidated statements of stockholders’ equity and the consolidated statements of comprehensive income. Other comprehensive income consists of unrealized gains and losses from derivative instruments designated as cash flow hedges, and postretirement medical plan adjustments.
Recently Adopted Accounting Pronouncements
In March 2016, the FASB issued an accounting standard update that aims to simplify accounting for stock-based compensation. The changes include accounting for income tax consequences, classification of awards as either equity or liabilities, an option to recognize gross share compensation expense with actual forfeitures recognized as they occur, as well as certain classifications on the statement of cash flows. The Company elected to account for forfeitures as they occur rather than apply an estimated forfeiture rate to stock-based compensation expense. The Company adopted this standard update in 2017 and applied the changes prospectively.
In July 2015, the FASB issued an accounting standard update that aims to simplify the measurement of inventory. The changes include measuring inventory at the lower of cost and net realizable value. Net realizable value is the estimated selling prices in the ordinary course of business, less reasonably predictable costs of completion, disposal, and transportation. The Company adopted this standard update on a prospective basis in 2017 and prior periods were not retrospectively adjusted.
In February 2018, the FASB issued an accounting standard update that allows the reclassification of stranded tax effects resulting from the Tax Cuts and Jobs Act from accumulated other comprehensive income to retained earnings. The Company adopted this standard update in 2017 and applied the changes prospectively for the year ended February 3, 2018 and reclassified $432 thousand from accumulated other comprehensive income to retained earnings as of February 3, 2018.
Recent Accounting Pronouncements
In May 2014, the FASB issued a new standard that creates common revenue recognition guidance for GAAP and International Financial Reporting Standards. The new guidance supersedes most preexisting revenue recognition guidance. The standard’s core principle is that a company will recognize revenue when it transfers promised goods or services to customers in an amount that reflects the consideration to which the company expects to be entitled in exchange for those goods or services. The standard defines a five-step process to achieve this principle, and will require companies to use more judgment and make more estimates than under the current guidance. The new standard also requires additional disclosure about the nature, amount, timing and uncertainty of revenue and cash flows arising from customer contracts. The standard is effective for public entities for annual periods beginning after December 15, 2017 and for interim periods within those fiscal years.
The Company is currently evaluating the impact that the adoption of the new standard will have on its consolidated financial statements. The Company expects that the areas impacted will include accounting for the Company’s co-branded credit card agreement, breakage using a proportional performance method, assessing certain sales promotion programs and presentation of sales returns and allowances. The Company plans to adopt the new standard using the modified retrospective adoption method.
In February 2016, the FASB issued an accounting standard update that creates new accounting and reporting guidelines for leasing arrangements. The new guidance requires organizations that lease assets to recognize assets and liabilities on the balance sheet related to the rights and obligations created by those leases, regardless of whether they are classified as finance or operating leases. Consistent with current guidance, the recognition,
F-15
Table of Contents
measurement, and presentation of expenses and cash flows arising from a lease primarily will depend on its classification as a finance or operating lease. The guidance also requires new disclosures to help financial statement users better understand the amount, timing, and uncertainty of cash flows arising from leases. The new standard is effective for annual reporting periods beginning after December 15, 2018. The new standard is to be applied using a modified retrospective approach. The Company is currently evaluating the impact of the new pronouncement on its consolidated financial statements, however, the Company expects to have a material impact to its consolidated balance sheet upon adoption.
In August 2016, the FASB issued an accounting standard update that is intended to add or clarify guidance on the classification of certain cash receipts and payments in the statement of cash flows and to eliminate the diversity in practice related to such classifications. The guidance in the accounting standard update is required to be adopted for annual reporting periods beginning after December 15, 2017, with early adoption permitted. The Company is currently evaluating the impact of the standard update on its consolidated cash flow statements.
In January 2017, the FASB issued an accounting standard update for Intangibles - Goodwill and Other, simplifying the test for goodwill impairment. Under the existing standard, when the carrying value of a reporting unit exceeds the reporting unit’s fair value, an entity would then proceed to a Step 2 goodwill impairment analysis, which requires calculating the impaired fair value by assigning the fair value of a reporting unit to all of its assets and liabilities, as if that reporting unit had been acquired in a business combination. Under the new standard a goodwill impairment will be the amount by which a reporting unit’s carrying value exceeds its fair value, not to exceed the carrying value of the reporting unit’s goodwill. The new standard is effective January 1, 2020, with early adoption permitted. The Company does not believe this will have an impact on the consolidated financial statements.
In March 2017, the FASB issued new guidance, which changes certain presentation and disclosure requirements for employers that sponsor defined benefit pension and other postretirement benefit plans. This guidance requires entities to (1) report the service cost component of net periodic pension/postretirement benefit cost in the same line item or items as other compensation costs arising from services rendered by the pertinent employees during the period; (2) capitalize only the service cost component of net periodic pension/postretirement benefit cost (when applicable); and (3) present other components of net periodic pension/postretirement benefit cost separately from the service cost component and outside a subtotal of income from operations (if applicable). The standard is effective for fiscal years beginning after December 15, 2018, with early adoption permitted as of January 1, 2017. The Company is currently evaluating the impact of the standard update on its consolidated financial statements.
In May 2017, the FASB issued an accounting standard update, which provides guidance about changes to the terms or conditions of a share-based payment award requiring an entity to apply modification accounting. The standard is effective for fiscal years beginning after December 15, 2018, with early adoption permitted, including adoption in any interim period, for public business entities for reporting periods for which financial statements have not yet been issued. The amendments in this standard update should be applied prospectively to an award modified on or after the adoption date, and, therefore, the Company will consider the provisions of this update in conjunction with awards issued on or after February 2, 2019, as applicable.
3. Related Party Transactions
Management Agreement
The Company has a management services agreement with the Sponsors for ongoing consulting and advisory services. The management services agreement provides for the aggregate payment of management fees to the Sponsors (or advisory affiliates thereof) of $8.0 million per year, plus out of pocket expenses. The Company expensed $8.1 million of management fees and out of pocket expenses in 2015 and 2016 respectively, and $8.0 million of management fees and out of pocket expenses in 2017. Management fees and expenses are reported in SG&A in the consolidated statements of operations and comprehensive income.
F-16
Table of Contents
Other Relationships
One of the Company’s suppliers, Advantage Solutions Inc., is controlled by affiliates of the Sponsors. Advantage Solutions Inc. is principally a provider of in-club product demonstration and sampling services, and the Company also engages them from time to time to provide ancillary support services, including for example, seasonal gift wrapping, on-floor sales assistance and display maintenance. In fiscal years 2017, 2016 and 2015 the Company incurred costs of approximately $44.8 million, $41.0 million and $10.6 million, respectively. The demonstration and sampling service fees are fully funded by merchandise vendors who participate in the program.
The Company believes the terms obtained or consideration paid or received, as applicable, in connection with the transactions were comparable to terms available or amounts that would be paid or received, as applicable, in arms’-length transactions with unrelated parties.
The Company determined that the related-party disclosure for Advantage Solutions Inc. was misstated in the previously issued consolidated financial statements for the fiscal years 2017, 2016 and 2015. In evaluating whether the Company’s previously issued consolidated financial statements were materially misstated, after considering both qualitative and quantitative considerations, the Company concluded that the disclosure errors were not material to any of the Company’s prior annual consolidated financial statements and therefore, amendments of previously filed reports were not required. However, the Company has revised the disclosure to correct errors incurred with Advantage Solutions Inc. to the amounts reflected above for fiscal years 2017, 2016 and 2015.
4. Dividend Recapitalization
On February 3, 2017, the Company distributed a $735.5 million dividend to its common stockholders. In conjunction with the dividend, the Company paid $67.5 million to stock option holders of the Company as required under the Fourth Amended and Restated 2011 Stock Option Plan of BJ’s Wholesale Club Holdings, Inc. (as further amended) (“2011 Plan”), and the 2012 Director Stock Option Plan of BJ’s Wholesale Club Holdings, Inc. (as further amended) (“2012 Director Plan”). The payments to option holders were recorded as compensation expense in SG&A in 2017. The Company also paid $5.4 million to employees under retention bonus arrangements, of which $4.6 million was accrued in 2016 and the remaining $0.8 million was recognized as compensation expense in 2017. In order to fund these payments, the Company executed the following transactions immediately prior to the payment of the dividend:
| • | Refinanced and upsized the First Term Loan to $1,925.0 million, subject to an original issue discount (“OID”) of $4.8 million. The First Term Loan now matures on February 3, 2024. |
| • | Refinanced and upsized the Second Term Loan to $625.0 million, subject to an OID of $6.2 million. The Second Lien Term Loan now matures on February 3, 2025. |
| • | Amended and restated the ABL Facility and borrowed $340.0 million. The maturity date on the ABL Facility was extended to February 3, 2022 and there were no changes to the material terms. |
The Company paid accrued outstanding interest of $11.0 million and capitalized debt issuance costs of $24.6 million in conjunction with the refinancing. The Company recorded a loss on the debt refinancing of $21.1 million in 2017 of which $9.8 million represents the write-off of previously capitalized deferred debt issuance costs.
F-17
Table of Contents
5. Debt and Credit Arrangements
Debt consisted of the following at January 28, 2017 and February 3, 2018 (in thousands):
| January 28, 2017 |
February 3, 2018 |
|||||||
| ABL Facility |
$ | 55,000 | $ | 217,000 | ||||
| First Lien Term Loan |
1,425,273 | 1,910,563 | ||||||
| Second Lien Term Loan |
577,183 | 625,000 | ||||||
| Unamortized debt discount and debt issuance costs |
(37,338 | ) | (40,153 | ) | ||||
| Less: current portion |
(20,000 | ) | (219,750 | ) | ||||
|
|
|
|
|
|||||
| Long-term debt |
$ | 2,000,118 | $ | 2,492,660 | ||||
|
|
|
|
|
|||||
ABL Credit Facility
On February 3, 2017 the Company amended and restated the ABL Facility to extend the maturity date to February 3, 2022. The Company wrote-off $2.2 million of previously capitalized debt issuance costs, expensed $0.2 million of new third-party fees and capitalized $7.9 million of new debt issuance costs.
The ABL Facility is comprised of a $950.0 million revolving credit facility and a $50.0 million term loan. The ABL Facility is secured on a senior basis by certain “liquid assets” of the Company and secured on a junior basis by certain “fixed assets” of the Company. The $50.0 million term loan payment terms are restricted in that the term loan cannot be repaid unless all loans outstanding under the ABL Facility are repaid, and once repaid, cannot be re-borrowed. The availability under the $950.0 million revolving credit facility is restricted based on eligible monthly merchandise inventories and receivables as defined in the facility agreement. Interest rates under the revolving credit facility are calculated either on LIBOR plus a range of 150 to 200 basis points based on excess availability, or an alternative base rate calculation based on the higher of prime, the federal funds rate plus 50 basis points or one-month LIBOR plus 100 basis points, plus a range of 50 to 100 basis points based on excess availability. The Company may elect one week or one, two, three, or six-month LIBOR terms. Interest on the term loan is based either on LIBOR plus a range of 300 to 350 basis points or the alternative base rate described above, plus a range of 200 to 250 basis points based on excess availability. The ABL Facility also provides a subfacility for issuances of letters of credit subject to certain fees defined in the ABL Facility agreement. The ABL Facility is subject to various commitment fees during the term of the facility based on utilization of the revolver.
At January 28, 2017, there was $55.0 million outstanding in loans under the ABL Facility and $48.0 million in outstanding letters of credit. At February 3, 2018, there was $217.0 million outstanding in loans under the ABL Facility and $44.2 million in outstanding letters of credit. As of February 3, 2018, the interest rate on the revolving credit facility was 3.08% and borrowing availability was $574.8 million.
First Lien Term Loan
On February 3, 2017 the Company refinanced its senior secured first lien term loan facility (the “First Lien Term Loan”) to extend the maturity date to February 3, 2024, increase the First Lien Term Loan borrowings to $1,925.0 million subject to a $4.8 million original issue discount and change the interest rate. Interest on the First Lien Term Loan is calculated either at LIBOR plus a range of 350 to 375 basis points where LIBOR is subject to a floor of zero or an alternative base rate calculation based on the higher of prime, the federal funds effective rate plus 50 basis points or one-month LIBOR plus 100 basis points, plus a range of 250 to 275 basis points.
As a result of the refinancing, there was a change in the bank syndicate. The Company wrote-off $3.1 million of previously capitalized debt issuance costs, expensed $8.3 million of new third-party fees and capitalized $8.5 million of new debt issuance costs. At February 3, 2018, the interest rate for the First Lien Term Loan was 4.95%.
F-18
Table of Contents
Principal payments on the First Lien Term Loan are required in quarterly installments of 0.25% of the original principal amount with the balance due upon maturity on February 3, 2024. Voluntary prepayments are permitted. Principal payments must be made on the First Lien Term Loan pursuant to an annual excess cash flow calculation. The First Lien Term Loan is subject to certain affirmative and negative covenants but no financial covenants. It is secured on a senior basis by certain “fixed assets” of the Company and on a junior basis by certain of “liquid” assets of the Company . At February 3, 2018 there was $1,910.6 million outstanding on the First Lien Term Loan.
Second Lien Term Loan
On February 3, 2017 the Company refinanced the existing senior secured second lien term loan facility (the “Second Lien Term Loan”) to extend the maturity date to February 3, 2025 and increase the Second Lien Term Loan borrowings to $625.0 million, subject to a $6.2 million original issue discount. Interest is calculated either at LIBOR plus 750 basis points where LIBOR is subject to a floor of zero or an alternative base rate calculation based on the higher of the prime, the federal funds effective rate plus 50 basis points or one-month LIBOR plus 100 basis points, plus 650 basis points.
As a result of the refinancing, there was a change in the bank syndicate. The Company wrote-off $4.5 million of previously capitalized debt issuance costs, expensed $2.8 million of new third-party fees and capitalized $8.2 million of new debt issuance costs. At February 3, 2018, the interest rate for the Second Lien Term Loan was 8.95%.
The Second Lien Term Loan matures on February 3, 2025 with the entire principal balance due on such maturity date. Voluntary prepayments are permitted, subject to certain prepayment premiums. Principal payments must be made on the Second Lien Term Loan pursuant to an annual excess cash flow calculation. The Second Lien Term Loan is subject to certain affirmative and negative covenants but no financial covenants. At February 3, 2018 there was $625.0 million outstanding on the Second Lien Term Loan.
Future minimum payments
Scheduled future minimum principal payments on debt as of February 3, 2018 are as follows:
| Fiscal Year: |
Dollars in thousands |
|||
| 2018 |
$ | 219,750 | ||
| 2019 |
19,250 | |||
| 2020 |
19,250 | |||
| 2021 |
19,250 | |||
| 2022 |
69,250 | |||
| Thereafter |
2,405,813 | |||
|
|
|
|||
| Total |
$ | 2,752,563 | ||
|
|
|
|||
F-19
Table of Contents
6. Interest Expense, net
The following details the components of interest expense for the periods presented (in thousands):
| Fiscal Year Ended January 30, 2016 |
Fiscal Year Ended January 28, 2017 |
Fiscal Year Ended February 3, 2018 |
||||||||||
| Interest on debt |
$ | 127,273 | $ | 122,193 | $ | 163,210 | ||||||
| Interest on capital lease and financing obligations |
5,003 | 4,244 | 4,205 | |||||||||
| Debt issuance costs amortization |
7,408 | 7,693 | 4,060 | |||||||||
| Original issue discount amortization |
9,440 | 9,398 | 4,403 | |||||||||
| Charges related to debt refinancing |
— | — | 21,061 | |||||||||
| Capitalized interest |
(1,288 | ) | (68 | ) | (215 | ) | ||||||
| Unrealized loss on interest rate caps |
2,257 | 73 | — | |||||||||
| Other interest income |
— | (182 | ) | — | ||||||||
|
|
|
|
|
|
|
|||||||
| Interest expense, net |
$ | 150,093 | $ | 143,351 | $ | 196,724 | ||||||
|
|
|
|
|
|
|
|||||||
7. Intangible Assets and Liabilities
Intangible assets and liabilities consist of the following (in thousands):
| January 28, 2017 | ||||||||||||
| Gross Carrying Amount |
Accumulated Amortization |
Net Amount | ||||||||||
| Goodwill |
$ | 924,134 | $ | — | $ | 924,134 | ||||||
|
|
|
|
|
|
|
|||||||
| Intangible Assets Not Subject to Amortization: |
||||||||||||
| BJ’s trade name |
$ | 90,500 | $ | — | $ | 90,500 | ||||||
| Intangible Assets Subject to Amortization: |
||||||||||||
| Member relationships |
245,000 | (146,875 | ) | 98,125 | ||||||||
| Private label brands |
8,500 | (3,778 | ) | 4,722 | ||||||||
| Below market leases |
120,182 | (60,370 | ) | 59,812 | ||||||||
|
|
|
|
|
|
|
|||||||
| Total intangible assets |
$ | 464,182 | $ | (211,023 | ) | $ | 253,159 | |||||
|
|
|
|
|
|
|
|||||||
| Intangible Liabilities Subject to Amortization: |
||||||||||||
| Above market leases |
$ | (30,515 | ) | $ | 12,472 | $ | (18,043 | ) | ||||
|
|
|
|
|
|
|
|||||||
| February 3, 2018 | ||||||||||||
| Gross Carrying Amount |
Accumulated Amortization |
Net Amount | ||||||||||
| Goodwill |
$ | 924,134 | $ | — | $ | 924,134 | ||||||
|
|
|
|
|
|
|
|||||||
| Intangible Assets Not Subject to Amortization: |
||||||||||||
| BJ’s trade name |
$ | 90,500 | $ | — | $ | 90,500 | ||||||
| Intangible Assets Subject to Amortization: |
||||||||||||
| Member relationships |
245,000 | (163,668 | ) | 81,332 | ||||||||
| Private label brands |
8,500 | (4,486 | ) | 4,014 | ||||||||
| Below market leases |
120,182 | (71,152 | ) | 49,030 | ||||||||
|
|
|
|
|
|
|
|||||||
| Total intangible assets |
$ | 464,182 | $ | (239,306 | ) | $ | 224,876 | |||||
|
|
|
|
|
|
|
|||||||
| Intangible Liabilities Subject to Amortization: |
||||||||||||
| Above market leases |
$ | (30,515 | ) | $ | 14,709 | $ | (15,806 | ) | ||||
|
|
|
|
|
|
|
|||||||
F-20
Table of Contents
The Company records amortization expenses of intangible assets as a component of SG&A expenses. Member relationships are amortized over a period of 15.3 years, Private label brands are amortized over 12 years and below and above market leases are amortized over the estimated benefit of the intangible asset that was created.
The Company recorded amortization expense of $31.8 million, $28.8 million and $26.0 million as a component of SG&A for the fiscal years ended January 30, 2016, January 28, 2017 and February 3, 2018, respectively. The Company estimates that amortization expense (income) related to intangible assets and liabilities will be as follows in each of the next five fiscal years (in thousands):
| Below Market Leases | Above Market Leases | Other Intangibles | Total | |||||||||||||||
| 2018 | $ | 8,636 | $ | (2,162 | ) | $ | 15,371 | $ | 21,845 | |||||||||
| 2019 | 7,633 | (2,077 | ) | 13,491 | 19,047 | |||||||||||||
| 2020 | 7,117 | (1,846 | ) | 11,862 | 17,133 | |||||||||||||
| 2021 | 6,153 | (1,581 | ) | 10,483 | 15,055 | |||||||||||||
| 2022 | 4,507 | (1,526 | ) | 9,230 | 12,211 | |||||||||||||
8. Commitment and Contingencies
Leases
The Company is obligated under long-term leases for the rental of real estate. In addition, generally the Company is required to pay insurance, real estate taxes and other operating expenses and, in some cases, additional rentals based on a percentage of sales in excess of certain thresholds, or other factors. Many of the leases require escalating payments during the lease term. Rent expense for such leases is recognized on a straight-line basis over the lease term. The initial primary term of the real estate leases (excluding ground leases) ranges from 5 to 25 years. Most of these leases have an initial term of 20 years. The initial primary term of the ground leases ranges from 15 to 44 years, and averages approximately 22 years. As of February 3, 2018, the Company has options to renew all but three of its leases for periods that range from 5 to 65 years, and average approximately 21 years.
Future minimum lease payments of operating leases as of February 3, 2018 were as follows (in thousands):
| Fiscal Year |
Dollars in Thousands |
|||
| 2018 |
$ | 302,622 | ||
| 2019 |
303,112 | |||
| 2020 |
292,917 | |||
| 2021 |
282,214 | |||
| 2022 |
266,405 | |||
| Thereafter |
1,978,138 | |||
|
|
|
|||
| Total |
$ | 3,425,408 | ||
|
|
|
|||
The payments above do not include future payments due under the leases for two BJ’s clubs, which closed in January 2011. Rent liabilities for the closed locations are included in current and noncurrent closed store obligations on the consolidated balance sheets.
Rental expense under real estate operating leases (including contingent rentals, which were not material) was $287.5 million in 2015, $298.1 million in 2016 and $301.9 million in 2017. These amounts do not include rental expense on equipment and equipment space of $0.8 million in 2015 and $0.7 million for both 2016 and 2017.
F-21
Table of Contents
Future minimum lease payments of capital leases and financing obligations for arrangements that did not qualify for sale-lease back accounting as of February 3, 2018 are as follows (in thousands):
| Fiscal Year |
Future minimum payments |
|||
| 2018 |
$ | 4,791 | ||
| 2019 |
4,510 | |||
| 2020 |
4,807 | |||
| 2021 |
4,833 | |||
| 2022 |
4,894 | |||
| Thereafter |
39,333 | |||
|
|
|
|||
| 63,168 | ||||
| Amount representing interest |
(27,466 | ) | ||
|
|
|
|||
| Total |
$ | 35,702 | ||
|
|
|
|||
These capital lease and financing obligations are primarily included in other noncurrent liabilities on the consolidated balance sheet.
Legal Contingencies
The Company is involved in various legal proceedings that are typical of a retail business. In accordance with applicable accounting guidance, an accrual will be established for legal proceedings if and when those matters present loss contingencies that are both probable and estimable. The Company does not believe the resolution of any current proceedings will result in a material loss to the consolidated financial statements.
9. Discontinued Operations
The following tables summarize the activity for 2016 and 2017 associated with discontinued operations, which consist of closing two BJ’s clubs in January 2011 (in thousands):
| Discontinued Operations-2016 | ||||||||||||||||||||
| Liabilities January 30, 2016 |
Charges | Payments/ Increase |
Liabilities January 28, 2017 |
Cumulative Charges to Date, Net |
||||||||||||||||
| BJ’s clubs |
$ | 9,411 | $ | 802 | $ | (1,942 | ) | $ | 8,271 | $ | 56,833 | |||||||||
|
|
|
|
|
|
|
|
|
|
|
|||||||||||
| Current portion |
$ | 2,048 | $ | 2,013 | ||||||||||||||||
| Long-term portion |
7,363 | 6,258 | ||||||||||||||||||
|
|
|
|
|
|||||||||||||||||
| Total |
$ | 9,411 | $ | 8,271 | ||||||||||||||||
|
|
|
|
|
|||||||||||||||||
| Discontinued Operations-2017 | ||||||||||||||||||||
| Liabilities January 28, 2017 |
Charges | Payments/ Increase |
Liabilities February 3, 2018 |
Cumulative Charges to Date, Net |
||||||||||||||||
| BJ’s clubs |
$ | 8,271 | $ | 2,766 | $ | (2,354 | ) | $ | 8,683 | $ | 59,599 | |||||||||
|
|
|
|
|
|
|
|
|
|
|
|||||||||||
| Current portion |
$ | 2,013 | $ | 2,122 | ||||||||||||||||
| Long-term portion |
6,258 | 6,561 | ||||||||||||||||||
|
|
|
|
|
|||||||||||||||||
| Total |
$ | 8,271 | $ | 8,683 | ||||||||||||||||
|
|
|
|
|
|||||||||||||||||
The charges for BJ’s lease obligations are based on the present value of rent liabilities under the relevant leases, including estimated real estate taxes and common area maintenance charges, reduced by estimated income from the potential subleasing of these properties. Charges in both periods represent accretion expense on lease obligations.
F-22
Table of Contents
On June 12, 2014, the Company entered into a sublease agreement for one of the clubs that pays a portion of BJ’s lease obligation through the end of the lease term. The rental income received from that sublease is included in the payments referenced in the tables above. During the second half of 2017, the Company experienced a lapse in the sublease rental income which resulted in eviction of the current tenant. In January 2018, the Company entered into a new sublease agreement for the same property which will continue to pay a portion of the BJ’s lease obligation through the end of the lease term. The interruption of sublease income in the second half of 2017, and adjustment of future rental income from the new sublease agreement signed in January 2018, resulted in an additional charge of $0.7 million to the reserve. In addition, the Company lowered the estimated sublease income at the other existing closed location which resulted in an additional charge of $1.4 million to the reserve. The income tax benefit recorded related to loss from discontinued operations was $0.4 million, $0.3 million and $1.1 million for 2015, 2016 and 2017, respectively.
The lease obligations are expected to be paid over the next seven years. The liabilities for the closed club leases are included in current and noncurrent closed store obligations on the consolidated balance sheet.
10. Contingently Redeemable Common Stock
The Company and certain current and former management employees are party to the Management Stockholders’ Agreement (the “MSA”). All grants of equity by the Company to the employees are governed by the terms of individual equity award agreements and the MSA. The MSA specifies certain transfer restrictions, tag-along and drag-along rights, put and call rights and various other rights and restrictions applicable to any equity held by employees. The call right permits the Company to repurchase common stock held by an employee stockholder following a minimum holding period and prior to the expiration of a specified time period following the later of the employee’s termination of employment with the Company or acquisition of the common stock. If the employee’s employment is terminated for cause, the repurchase price is the least of (a) the fair market value as of the repurchase date, (b) the fair market value at issuance or (c) the price paid by the employee stockholder for such shares. If the employee’s employment is terminated other than for cause, the repurchase price is the fair market value as of the repurchase date.
The MSA also gives the employees the ability to put any shares back to the Company at fair market value upon death or disability while actively employed. As neither death nor disability while actively employed is a certainty, the shares of common stock held by the employee stockholders are considered to be contingently redeemable common stock and are accounted for outside of stockholders’ equity until the shares of common stock are either repurchased by the Company or the put right terminates. Both the Company’s repurchase right and the employee stockholder’s put right will terminate upon the consummation of an IPO. The contingently redeemable common stock was recorded at fair value of the common stock at the date of issuance. Because meeting the contingency is not probable, the contingently redeemable common stock is not remeasured to fair value at each reporting date. The Company has recorded $8.1 million and $10.4 million of mezzanine equity on its consolidated balance sheet related to these agreements as of January 28, 2017 and February 3, 2018, respectively.
When the Company exercises its call option to repurchase shares classified outside of stockholders’ equity, it is deemed to be a constructive retirement of the contingently redeemable share for accounting purposes. The Company records the excess of the fair value paid to repurchase the share over the carrying value of the contingently redeemable share within additional paid-in capital, as the Company has an accumulated deficit.
11. Stock Incentive Plans
The Company grants stock-based compensation to employees and non-employee directors, respectively, under the Fourth Amended and Restated 2011 Stock Option Plan of Beacon Holding Inc. (as further amended) (“2011 Plan”), and the 2012 Director Stock Option Plan of Beacon Holding Inc. (as further amended) (“2012 Director Plan”), which as of February 3, 2018 authorizes stock awards to be granted for up to 1,724,052 shares
F-23
Table of Contents
and 50,000, respectively. As of February 3, 2018, there were 46,667 and 39,500 shares available for future grant under the 2011 Plan and the 2012 Director Plan, respectively. All grants of equity awards under the 2011 Plan and 2012 Director Plan are conditioned on the recipient executing the MSA.
The MSA also gives the employee stockholders the ability to put vested options back to the Company at fair value upon death or disability while actively employed. These awards have been classified in the consolidated balance sheet as contingently redeemable common stock and have been presented outside of stockholders’ equity. See Note 10.
Stock option awards are generally granted with 60% of the awarded options vesting over a requisite service period ranging from three to five years and 40% of the awarded options vesting upon achieving pre-determined annual EBITDA targets. The awards contain a vesting catch-up provision on the performance-based portion if cumulative EBITDA targets are achieved. All options have a contractual term of ten years. The Company recognized $2.3 million ($1.4 million post-tax), $11.8 million ($7.1 million post-tax) and $9.1 million ($5.4 million post-tax) of total stock-based compensation for 2015, 2016 and 2017, respectively. As of February 3, 2018, there was approximately $4.0 million of unrecognized compensation cost, which is expected to be recognized over the next three years.
On March 24, 2016, the Company amended the EBITDA targets on options granted prior to August 31, 2015 to make the performance targets more achievable. In addition, performance based awards that remained unvested due to not achieving EBITDA targets in prior fiscal years would vest upon achieving the new targets. The Company accounted for the modification as an improbable to probable award modification and calculated the total fair value of the modified awards to be $9.0 million, of which $7.2 million was recognized in 2016 and $1.8 million was recognized in 2017.
Presented below is a summary of stock option activity and weighted-average exercise prices for year ended February 3, 2018 (options in thousands):
| Options | Weighted-average exercise price |
Weighted-average remaining contractual life (in years) |
||||||||||
| Outstanding, beginning of period |
1,490 | $ | 31.49 | |||||||||
| Granted |
50 | 49.00 | ||||||||||
| Exercised |
(213 | ) | 18.70 | |||||||||
| Forfeited |
(44 | ) | 29.39 | |||||||||
|
|
|
|
|
|
|
|||||||
| Outstanding, end of period |
1,283 | $ | 27.98 | 6.0 | ||||||||
|
|
|
|
|
|
|
|||||||
| Vested and expected to vest, end of period |
1,283 | $ | 27.98 | 6.0 | ||||||||
|
|
|
|
|
|
|
|||||||
| Exercisable, end of period |
995 | $ | 24.39 | 5.4 | ||||||||
|
|
|
|
|
|
|
|||||||
The total intrinsic value of options exercised in 2015, 2016 and 2017 was $3.5 million, $1.2 million and $7.6 million, respectively. As of February 3, 2018, the total intrinsic value of options vested and expected to vest was $53.9 million. The Company received a tax benefit related to these option exercises of approximately $1.4 million, $0.5 million and $3.1 million in 2015, 2016 and 2017, respectively.
F-24
Table of Contents
The fair value of the options was estimated using the Black-Scholes option pricing model with the following weighted-average assumptions (no dividends were expected):
| Fiscal Year Ended January 30, 2016 |
Fiscal Year Ended January 28, 2017 |
Fiscal Year Ended February 3, 2018 | ||||
| Risk-free interest rate range |
1.50% - 1.76% | 1.35% - 1.98% | 1.40% - 1.40% | |||
| Expected volatility factor |
35.0% | 35.0% | 35.0% | |||
| Weighted-average expected option life (yrs.) |
5.0 | 6.0 | 5.7 | |||
| Weighted-average grant-date fair value |
$13.63 | $30.79 | $17.59 |
The Company historically has been a private company and lacks certain company-specific historical and implied volatility information. Expected volatility was determined based on the historical and implied volatilities of comparable public companies. The risk-free interest rate was based on United States Treasury yields in effect at the time of the grant for notes with terms comparable to the awards. The expected option life represents an estimate of the period of time options are expected to remain outstanding based upon an average of the vesting and contractual terms of the options. Forfeitures are recorded as incurred.
12. Income Taxes
The provision (benefit) for income taxes from continuing operations includes the following (in thousands):
| Fiscal Year Ended January 30, 2016 |
Fiscal Year Ended January 28, 2017 |
Fiscal Year Ended February 3, 2018 |
||||||||||
| Federal: |
||||||||||||
| Current |
$ | 27,096 | $ | 42,268 | $ | 1,976 | ||||||
| Deferred |
(17,400 | ) | (19,457 | ) | (33,219 | ) | ||||||
| State: |
||||||||||||
| Current |
6,381 | 9,230 | 5,220 | |||||||||
| Deferred |
(4,028 | ) | (4,073 | ) | (2,404 | ) | ||||||
|
|
|
|
|
|
|
|||||||
| Total income tax provision (benefit) |
$ | 12,049 | $ | 27,968 | $ | (28,427 | ) | |||||
|
|
|
|
|
|
|
|||||||
A reconciliation of the statutory federal income tax rate with the Company’s effective income tax rate is as follows:
| Fiscal Year Ended January 30, 2016 |
Fiscal Year Ended January 28, 2017 |
Fiscal Year Ended February 3, 2018 |
||||||||||
| Statutory federal income tax rates |
35.0% | 35.0% | 33.7% | |||||||||
| State income taxes, net of federal tax benefit |
3.9 | 4.5 | 7.5 | |||||||||
| Effect of federal rate change |
— | — | (136.2) | |||||||||
| Work opportunity and solar tax credit |
(2.1) | (1.6) | (17.9) | |||||||||
| Charitable contributions |
(1.4) | (0.3) | (1.0) | |||||||||
| Prior year adjustments |
0.6 | — | (3.2) | |||||||||
| Stock options |
— | — | (4.8) | |||||||||
| Other |
(3.2) | 0.9 | 1.2 | |||||||||
|
|
|
|
|
|
|
|||||||
| Effective income tax rate |
32.8% | 38.5% | (120.7)% | |||||||||
|
|
|
|
|
|
|
|||||||
F-25
Table of Contents
On December 22, 2017, the TCJA was signed into law. The TCJA includes significant changes to the Internal Revenue Code (the “Code”) impacting the taxation of business entities. The most significant change in the TCJA that impacts the Company as of February 3, 2018, is the reduction in the corporate federal income tax rate from 35% to 21% for tax years (or portions thereof) beginning after December 31, 2017. This change in the Code from the TCJA had a material impact on the financial statements in 2017.
ASC Topic 740, Income Taxes (“ASC 740”) requires the tax effects of changes in tax laws must be recognized in the period in which the law is enacted, or December 22, 2017 for the TCJA. ASC 740 also requires deferred tax assets and liabilities to be measured at the enacted tax rate expected to apply when temporary differences are to be realized or settled. Thus, at the date of enactment, the Company’s deferred taxes were re-measured utilizing the new federal income tax rate of 21%.
The US Securities and Exchange Commission (“SEC”) has recognized the complexity of reflecting the impacts of the TCJA, and on December 22, 2017 issued guidance in Staff Accounting Bulletin No 118 (“SAB 118”) which clarifies accounting for income taxes under ASC 740 if information is not yet available or complete and provides for up to a one-year period in which to complete the required analyses and accounting (the measurement period). SAB 118 describes three scenarios (or “buckets”) associated with a company’s status of accounting for income tax reform: (1) a company is complete with its accounting for certain effects of tax reform, (2) a company is able to determine a reasonable estimate for certain effects of tax reform and records that estimate as a provisional amount, or (3) a company is not able to determine a reasonable estimate and therefore continues to apply ASC 740, based on the provisions of the tax laws that were in effect immediately prior to the TCJA being enacted.
As of February 3, 2018, the Company had not fully completed its accounting for the tax effects of the enactment of the TCJA since a complete assessment will require additional time, information, and resources than currently available to the Company. The Company’s provision for income taxes for the fiscal year ended February 3, 2018 is based in part on a reasonable estimate of the effects on its existing deferred tax balances. Specifically, the Company recorded a provisional tax amount of $32.1 million to re-measure certain deferred tax assets and liabilities as a result of the enactment of the TCJA. The Company is still analyzing certain aspects of the TCJA and refining the estimate of the expected reversal of its deferred tax balances. This can potentially affect the measurement of these balances or potentially give rise to new deferred tax amounts.
F-26
Table of Contents
Significant components of the Company’s deferred tax assets and liabilities as of January 28, 2017 and February 3, 2018 were as follows (in thousands):
| January 28, 2017 |
February 3, 2018 |
|||||||
| Deferred tax assets: |
||||||||
| Self-insurance reserves |
$ | 39,977 | $ | 27,595 | ||||
| Rental step liabilities |
28,501 | 21,336 | ||||||
| Compensation and benefits |
24,276 | 15,975 | ||||||
| Capital lease and financing obligations |
11,274 | 7,542 | ||||||
| Intangible liabilities |
7,338 | 4,408 | ||||||
| Closed store obligations |
3,363 | 2,421 | ||||||
| Deferred gain amortization |
8,223 | 5,279 | ||||||
| Environment clean up reserve |
4,401 | 3,312 | ||||||
| Startup costs |
5,977 | 3,675 | ||||||
| Lease incentive gain |
4,326 | 3,029 | ||||||
| Other |
19,077 | 13,677 | ||||||
|
|
|
|
|
|||||
| Total deferred tax assets |
$ | 156,733 | $ | 108,249 | ||||
|
|
|
|
|
|||||
| January 28, 2017 |
February 3, 2018 |
|||||||
| Deferred tax liabilities: |
||||||||
| Fixed assets |
$ | 116,070 | $ | 79,388 | ||||
| Intangible assets |
102,955 | 62,716 | ||||||
| Debt costs |
9,190 | 7,728 | ||||||
| Capital lease and financings obligations |
10,596 | 7,014 | ||||||
| Other |
10,822 | 8,477 | ||||||
|
|
|
|
|
|||||
| Total deferred tax liabilities |
249,633 | 165,323 | ||||||
|
|
|
|
|
|||||
| Net deferred tax liabilities |
$ | (92,900 | ) | $ | (57,074 | ) | ||
|
|
|
|
|
|||||
The ultimate realization of deferred tax assets is dependent upon the Company’s ability to generate sufficient taxable income during the periods in which the temporary differences become deductible. The Company has determined that it is more likely than not that the results of future operations and the reversals of existing taxable temporary differences will generate sufficient taxable income to realize the deferred tax assets. Therefore, no valuation allowance has been recorded. In making this determination, the Company considered historical levels of income as well as projections for future periods.
A reconciliation of the beginning and ending amount of unrecognized tax benefits is as follows (in thousands):
| Fiscal Year Ended January 28, 2017 |
Fiscal Year Ended February 3, 2018 |
|||||||
| Balance at the beginning of the period |
$ | 5,084 | $ | 4,199 | ||||
| Additions for tax positions taken during prior years |
— | 607 | ||||||
| Additions for tax positions taken during the current year |
56 | 43 | ||||||
| Settlements |
— | (260 | ) | |||||
| Lapses in statute of limitations |
(941 | ) | (232 | ) | ||||
|
|
|
|
|
|||||
| Balance at the end of the period |
$ | 4,199 | $ | 4,357 | ||||
|
|
|
|
|
|||||
F-27
Table of Contents
The total amount of unrecognized tax benefits, reflective of federal tax benefits at January 28, 2017 and February 3, 2018 that, if recognized, would favorably affect the effective tax rate was $3.4 million and $3.9 million, respectively.
As of February 3, 2018, management has determined it is reasonably possible that the total amount of unrecognized tax benefits could decrease within the next twelve months by as much as $3.2 million, due to the expected resolution of state tax audits and the expiration of statute of limitations. The Company’s tax years from 2012 forward remain open and are subject to examination by the IRS and various state taxing jurisdictions.
The Company classifies interest expense and any penalties related to income tax uncertainties as a component of income tax expense, which is consistent with the recognition of these items in prior reporting periods. For the periods ended January 30, 2016 and January 28, 2017, the Company had recognized $0.3 million in interest expense in each year. For the period ended February 3, 2018, the Company recognized $0.7 million in interest expense. As of January 28, 2017, and February 3, 2018, the Company had $0.3 million and $1.0 million, respectively, of accrued interest related to income tax uncertainties.
13. Retirement Plans
Under BJ’s 401(k) savings plans, participating employees may make pretax contributions up to 50% of covered compensation subject to federal limits. BJ’s matches employee contributions at 50% of the first six percent of covered compensation. The Company’s expense under these plans was $8.1 million, $8.7 million and $9.6 million for 2015, 2016 and 2017, respectively.
The Company has a non-contributory defined contribution retirement plan for certain key employees. Under this plan, BJ’s funds annual retirement contributions for the designated participants on an after-tax basis. For the last two years, the Company’s contributions equaled 5% of the participants’ base salary. Participants become fully vested in their contribution accounts at the end of the fiscal year in which they complete four full fiscal years of service. Pretax expense under this plan was $2.3 million in 2015 and 2016, and $2.4 million in 2017.
14. Postretirement Medical Benefits
The Company has a defined benefit postretirement medical plan which covers employees who retire after age 55 with at least 10 years of service, who are not eligible for Medicare, and who participated in a Company-sponsored medical plan. Spouses and eligible dependents are also covered under the plan. Amounts contributed by retired employees under this plan are based on years of service prior to retirement. The plan was amended in 2015 to limit eligibility to only those who meet the eligibility criteria, of age and years of service, by June 30, 2017. The plan can no longer accept any new enrollees with estimated future benefit payments ending by June 30, 2027.
The Company recognizes the funded status of the postretirement medical plan in the balance sheet. The funded status represents the difference between the projected benefit liability obligation of the plan and the fair value of the plan’s assets. Previously unrecognized deferred amounts such as actuarial gains and losses and the impact of plan changes are included in accumulated other comprehensive income. Changes in these amounts in future years are adjusted as they occur through accumulated other comprehensive income. The discount rates presented in the tables below were selected by referencing yields on high quality corporate bonds, using the Citigroup Pension Yield Curve.
F-28
Table of Contents
Obligation and Funded Status
The change in obligation and funded status of the plan at January 28, 2017 and February 3, 2018 was as follows (in thousands):
| Fiscal Year Ended January 28, 2017 |
Fiscal Year Ended February 3, 2018 |
|||||||
| Change in Obligation |
||||||||
| Projected benefit obligation at beginning of period |
$ | 6,182 | $ | 5,927 | ||||
| Company service cost |
204 | 182 | ||||||
| Interest cost |
142 | 147 | ||||||
| Plan participants’ contributions |
302 | 316 | ||||||
| Net actuarial gain/(loss) |
590 | (392 | ) | |||||
| Benefit payments made directly by the Company |
(1,493 | ) | (820 | ) | ||||
|
|
|
|
|
|||||
| Projected benefit obligation at end of period |
$ | 5,927 | $ | 5,360 | ||||
|
|
|
|
|
|||||
| Change in Plan Assets |
||||||||
| Fair value of plan assets at beginning of period |
$ | — | $ | — | ||||
| Company contributions |
1,191 | 504 | ||||||
| Plan participants’ contributions |
302 | 316 | ||||||
| Benefit payments made directly by the Company |
(1,493 | ) | (820 | ) | ||||
| Fair value of plan assets at end of period |
— | — | ||||||
|
|
|
|
|
|||||
| Funded status at end of year |
$ | (5,927 | ) | $ | (5,360 | ) | ||
|
|
|
|
|
|||||
The funded status of the plan as of February 3, 2018 is recognized as a net liability in other noncurrent liabilities on the consolidated balance sheet. The Company expects to contribute approximately $0.7 million to the postretirement plan in 2018.
F-29
Table of Contents
Components of Net Periodic Benefit Cost and Amounts Recognized in Other Comprehensive Income
Net periodic postretirement benefit cost for the last three fiscal years consists of the following (in thousands):
| Fiscal Year Ended January 30, 2016 |
Fiscal Year Ended January 28, 2017 |
Fiscal Year Ended February 3, 2018 |
||||||||||
| Company service cost |
$ | 491 | $ | 204 | $ | 182 | ||||||
| Interest cost |
198 | 142 | 147 | |||||||||
|
|
|
|
|
|
|
|||||||
| 689 | 346 | 329 | ||||||||||
| Net prior service credit amortization |
(229 | ) | (693 | ) | (693 | ) | ||||||
| Amortization of unrecognized gain |
(490 | ) | (510 | ) | (250 | ) | ||||||
|
|
|
|
|
|
|
|||||||
| Net periodic postretirement benefit cost |
$ | (30 | ) | $ | (857 | ) | $ | (614 | ) | |||
|
|
|
|
|
|
|
|||||||
| Discount rate used to determine cost |
2.76% | 2.45% | 2.63% | |||||||||
| Health care cost trend rates |
7.00% | 7.00% | 7.00% | |||||||||
The change in accumulated other comprehensive income (“AOCI”), gross of tax, consists of the following (in thousands):
| Fiscal Year Ended January 28, 2017 |
Fiscal Year Ended February 3, 2018 |
|||||||
| AOCI at the beginning of period |
$ | (5,675 | ) | $ | (3,882 | ) | ||
| Net prior service credit amortization |
693 | 693 | ||||||
| Amortization of net actuarial gain |
510 | 250 | ||||||
| Net actuarial (gain) loss for the period |
590 | (392 | ) | |||||
|
|
|
|
|
|||||
| AOCI at the end of the period |
$ | (3,882 | ) | $ | (3,331 | ) | ||
|
|
|
|
|
|||||
The Company expects to amortize approximately $0.3 million of net actuarial gain from AOCI into net periodic postretirement benefit cost in 2018.
Assumptions
The following weighted-average assumptions were used to determine the postretirement benefit obligations:
| January 28, 2017 |
February 3, 2018 |
|||||||
| Discount rate |
2.63 | % | 3.00 | % | ||||
| Health care cost trend rate assumed for next year |
7.00 | % | 6.50 | % | ||||
| Ultimate trend rate |
5.00 | % | 5.00 | % | ||||
| Year that the rate reaches the ultimate trend rate |
2021 | 2024 | ||||||
F-30
Table of Contents
Assumed health care cost trend rates have a significant effect on the amounts reported for the post-retirement health care plans. A one-percentage point change in assumed health care cost trend rates would have the following effects as of February 3, 2018:
| Effect of 1% Increase in Medical Trend Rates (in Thousands) |
||||
| Postretirement benefit obligation increases by |
$ | 283 | ||
| Total of service and interest cost increases by |
20 | |||
| Effect of 1% Decrease in Medical Trend Rates (in Thousands) |
||||
| Postretirement benefit obligation decreases by |
$ | 268 | ||
| Total of service and interest cost decreases by |
19 |
Cash Flows
The estimated future benefit payments for the postretirement health care plan at February 3, 2018 are (in thousands):
| Fiscal Year |
Future minimum payments |
|||
| 2018 |
$ | 733 | ||
| 2019 |
800 | |||
| 2020 |
727 | |||
| 2021 |
712 | |||
| 2022 |
734 | |||
| 2023 to 2027 |
2,717 | |||
15. Asset Retirement Obligations
The following is a summary of activity relating to the liability for asset retirement obligations, which the Company will incur in connection with the future removal of gasoline tanks and related infrastructure from gasoline stations and are included in other noncurrent liabilities on the consolidated balance sheet (in thousands):
| Fiscal Year Ended January 30, 2016 |
Fiscal Year Ended January 28, 2017 |
Fiscal Year Ended February 3, 2018 |
||||||||||
| Balance, beginning of period |
$ | 17,018 | $ | 10,714 | $ | 11,846 | ||||||
| Accretion expense |
1,436 | 895 | 959 | |||||||||
| Liabilities incurred during the year |
581 | 237 | 193 | |||||||||
| Change in estimated liability |
(8,054 | ) | — | — | ||||||||
| Settlement of existing liabilities |
(267 | ) | — | — | ||||||||
|
|
|
|
|
|
|
|||||||
| Balance, end of period |
$ | 10,714 | $ | 11,846 | $ | 12,998 | ||||||
|
|
|
|
|
|
|
|||||||
In 2015, the Company changed its estimate of future cash flows for the removal of the gasoline tanks and other infrastructure at the stations. The revised estimate was based on the actual costs incurred in 2015 and other recent periods to remove these assets. This change in estimate resulted in a reduction to the asset retirement obligation liability of $8.1 million, of which $7.1 million was recorded as a reduction in SG&A expenses and $1.0 million was recorded as a reduction of the related net assets recorded in property and equipment on the consolidated balance sheet.
F-31
Table of Contents
16. Accrued Expenses and Other Current Liabilities
The major components of accrued expenses and other current liabilities are as follows (in thousands):
| January 28, 2017 |
February 3, 2018 |
|||||||
| Deferred membership fee income |
$ | 116,483 | $ | 126,216 | ||||
| Employee compensation |
80,903 | 82,037 | ||||||
| Insurance reserves |
41,340 | 40,620 | ||||||
| Repairs and maintenance |
23,758 | 18,260 | ||||||
| Outstanding checks |
21,713 | 34,002 | ||||||
| BJ’s Perks rewards |
21,125 | 22,736 | ||||||
| Professional services |
19,062 | 7,626 | ||||||
| Fixed asset accruals |
16,915 | 19,405 | ||||||
| Accrued interest |
10,192 | 25,428 | ||||||
| Sales and use taxes |
10,058 | 16,151 | ||||||
| Gift card liability |
10,138 | 10,578 | ||||||
| Utilities, advertising and other |
86,010 | 92,708 | ||||||
|
|
|
|
|
|||||
| $ | 457,697 | $ | 495,767 | |||||
|
|
|
|
|
|||||
The following table summarizes membership fee income activity for each of the last two fiscal years (in thousands):
| Fiscal Year Ended January 28, 2017 |
Fiscal Year Ended February 3, 2018 |
|||||||
| Deferred MFI, beginning of period |
$ | 117,806 | $ | 116,483 | ||||
| Cash received from members |
253,912 | 268,327 | ||||||
| Revenue recognized in earnings |
(255,235 | ) | (258,594 | ) | ||||
|
|
|
|
|
|||||
| Deferred MFI, end of period |
$ | 116,483 | $ | 126,216 | ||||
|
|
|
|
|
|||||
17. Other Noncurrent Liabilities
The major components of other noncurrent liabilities are as follows (in thousands):
| January 28, 2017 |
February 3, 2018 |
|||||||
| Workers’ compensation and general liability |
$ | 71,243 | $ | 72,317 | ||||
| Rent escalation liability |
70,082 | 76,867 | ||||||
| Capital leases and financing obligations |
35,783 | 35,147 | ||||||
| Deferred gain on sale leasebacks |
18,929 | 17,639 | ||||||
| Above market leases |
18,043 | 15,806 | ||||||
| Lease incentives |
15,511 | 14,985 | ||||||
| Asset retirement obligations |
11,846 | 12,998 | ||||||
| Postretirement medical benefit and other |
30,231 | 21,634 | ||||||
|
|
|
|
|
|||||
| $ | 271,668 | $ | 267,393 | |||||
|
|
|
|
|
|||||
18. Book Overdrafts
Banking arrangements provide for the daily replenishment of vendor payable bank accounts as checks are presented. The balances of checks outstanding in these bank accounts, which represent book overdrafts, totaled
F-32
Table of Contents
approximately $62.5 million at January 28, 2017 and approximately $70.0 million at February 3, 2018. Amounts payable to merchandise vendors are included in accounts payable on the consolidated balance sheets and were approximately $40.8 million and $36.0 million at the end of 2016 and 2017, respectively. Amounts payable to non-merchandise vendors are included in accrued expenses and other current liabilities on the consolidated balance sheets and were approximately $21.7 million and $34.0 million at the end of 2016 and 2017, respectively. Changes in these balances are reflected in operating activities in the consolidated statements of cash flows.
19. Derivative Financial Instruments
Interest Rate Caps
Both the Company’s First Lien Term Loan and Second Lien Term Loan are subject to interest rates based on LIBOR. The Company had interest rate hedge arrangements that effectively capped a portion of its interest rate exposure on three-month LIBOR at 1.5% through March 31, 2016 (the “Interest Rate Caps”). The aggregate notional amount of the Interest Rate Caps was $1.7 billion. The Company also had a 2.5% forward cap arrangement covering $1.0 billion notional of the outstanding principal balance of the First and Second Lien Term Loans from April 1, 2016 through September 29, 2017.
Hedge accounting for these arrangements was not elected and therefore all unrealized gains and losses required to value the instruments to fair value were recorded in earnings for the period of the change. Unrealized losses were $2.0 million for 2015, and not material for 2016 and 2017. Unrealized losses were recorded in interest expense in order to value the cap arrangements at fair value.
Interest Rate Swaps
The Company was party to two separate interest rate swap arrangements whereby the Company fixed a portion of its interest rate exposure on one-month LIBOR (the “Interest Rate Swaps”). Each of these Interest Rate Swaps was for a notional amount of $100.0 million and required us to pay the counterparty a fixed interest rate and receive from the counterparty a floating interest rate based on one-month LIBOR.
On September 9, 2015, $0.3 million was paid to terminate one of the swap agreements that had an original termination date of March 10, 2016. The realized loss of $0.3 million was included in interest expense. The remaining swap agreement expired on March 30, 2016.
The Company elected hedge accounting for the Interest Rate Swap agreements, and as such, the effective portion of the gains and losses was recorded as a component of other comprehensive income. There were $1.0 million of unrealized gains recorded in 2015, and immaterial amounts for 2016 and 2017. Unrealized gains were recorded in other comprehensive income on the Interest Rate Swaps.
20. Fair Value Measurements
Assets and Liabilities Measured at Fair Value on a Recurring Basis
The fair values of the Company’s derivative instruments are based on quotes received from third-party banks and represent the estimated amount the Company would pay to terminate the agreements taking into consideration current interest rates as well as the creditworthiness of the counterparties. These inputs are considered to be Level 2.
F-33
Table of Contents
Financial Assets and Liabilities
The gross carrying amount and fair value of the Company’s debt at February 3, 2018 are as follows (in thousands):
| Carrying Amount |
Fair Value | |||||||
| First Lien Term Loan |
$ | 1,910,563 | $ | 1,908,174 | ||||
| Second Lien Term Loan |
625,000 | 625,000 | ||||||
| ABL Facility |
217,000 | 217,000 | ||||||
|
|
|
|
|
|||||
| Total Debt |
$ | 2,752,563 | $ | 2,750,174 | ||||
|
|
|
|
|
|||||
The fair value of debt was determined based on quoted market prices and on borrowing rates available to the Company at February 3, 2018. These inputs are considered to be Level 2.
Assets and Liabilities Measured at Fair Value on a Non-Recurring Basis
The Company measures certain non-financial assets and liabilities, including long-lived assets, at fair value on a non-recurring basis. See Note 2 for further information.
The Company believes that the carrying amounts of its other financial instruments, including cash, accounts receivable, and accounts payable approximates their carrying value due to the short-term maturities of these instruments.
21. Earnings Per Share
The table below reconciles basic weighted-average common shares outstanding to diluted weighted-average common shares outstanding for 2015, 2016 and 2017:
| Fiscal Year Ended January 30, 2016 |
Fiscal Year Ended January 28, 2017 |
Fiscal Year Ended February 3, 2018 |
||||||||||
| Weighted-average common shares outstanding, used for basic computation |
12,552,749 | 12,594,856 | 12,626,552 | |||||||||
| Plus: Incremental shares of potentially dilutive securities |
||||||||||||
| Stock options: |
338,873 | 367,441 | 553,959 | |||||||||
|
|
|
|
|
|
|
|||||||
| Weighted-average number of common and dilutive potential common shares outstanding |
12,891,622 | 12,962,297 | 13,180,511 | |||||||||
Stock options not included in the computation of diluted earnings were 383,041, 488,101 and 115,896 as of the end of 2015, 2016 and 2017 respectively.
F-34
Table of Contents
22. Condensed Financial Information of Registrant (Parent Company Only)
BJ’S WHOLESALE CLUB HOLDINGS, INC.
(PARENT COMPANY ONLY)
CONDENSED BALANCE SHEETS
(Amounts in thousands, except per share amounts)
| Fiscal Year Ended January 28, 2017 |
Fiscal Year Ended February 3, 2018 |
|||||||
| ASSETS |
||||||||
| Investment in subsidiaries |
$ | (339,066 | ) | $ | (1,019,419 | ) | ||
|
|
|
|
|
|||||
| Contingently redeemable common stock, par value $0.01; 149 and 208 shares issued and outstanding: |
8,145 | 10,438 | ||||||
| STOCKHOLDERS’ DEFICIT |
||||||||
| Common stock, par value $0.01; 20,000 shares authorized; 12,439 shares issued and outstanding |
124 | 124 | ||||||
| Additional paid-in capital |
8,678 | 5,284 | ||||||
| Accumulated deficit |
(356,013 | ) | (1,035,265 | ) | ||||
|
|
|
|
|
|||||
| Total contingently redeemable common stock and stockholders’ deficit |
$ | (339,066 | ) | $ | (1,019,419 | ) | ||
|
|
|
|
|
|||||
BJ’S WHOLESALE CLUB HOLDINGS, INC.
(PARENT COMPANY ONLY)
CONSOLIDATED STATEMENTS OF OPERATIONS AND COMPREHENSIVE INCOME
(Amounts in thousands, except per share amounts)
| Fiscal Year Ended January 30, 2016 |
Fiscal Year Ended January 28, 2017 |
Fiscal Year Ended February 3, 2018 |
||||||||||
| Equity in net income of subsidiaries |
$ | 24,104 | $ | 44,224 | $ | 50,301 | ||||||
| Net income |
24,104 | 44,224 | 50,301 | |||||||||
| Net income per share attributable to common stockholders’: |
||||||||||||
| Basic |
$ | 1.92 | $ | 3.51 | $ | 3.98 | ||||||
| Diluted |
1.87 | 3.41 | 3.82 | |||||||||
| Weighted average number of common shares outstanding: |
||||||||||||
| Basic |
12,553 | 12,595 | 12,627 | |||||||||
| Diluted |
12,892 | 12,962 | 13,181 | |||||||||
A statement of cash flows has not been presented as BJ’s Wholesale Club, Holdings, Inc. did not have any cash as of, or for the years ended January 30, 2016, January 28, 2017 or February 3, 2018. See Note 4 for dividends paid to parent.
Basis of Presentation
These condensed parent company-only financial statements have been prepared in accordance with Rule 12-04, Schedule I of Regulation S-X, as the restricted net assets of the subsidiaries of BJ’s Wholesale Club Holdings, Inc. (as defined in Rule 4-08(e)(3) of Regulation S-X) exceed 25% of the consolidated net assets of the
F-35
Table of Contents
Company. The ability of BJ’s Wholesale Club Holdings, Inc.’s operating subsidiaries to pay dividends may be restricted due to terms of the subsidiaries’ first and second lien term loans and ABL credit agreements, as defined in Note 5. For example, the covenants of the ABL credit agreement restrict the payment of dividends to, among other exceptions, (i) a $25.0 million general basket, (ii) a basket for unlimited dividends and distributions if there is no event of default, availability under the ABL credit agreement is greater than 15% of the lesser of the commitments under the ABL credit agreement and the borrowing base under the ABL credit agreement for 6 months following such dividend or distribution and, if availability is less than 20% of the lesser of the commitments under the ABL credit agreement and the borrowing base under the ABL credit agreement, a 1.00 to 1.00 (or higher) fixed charge coverage ratio for 12 months after giving effect to such dividend or distribution, and (iii) following this offering, a basket for up to 6.0% per annum of the net proceeds received by or contributed to the borrower’s common stock from certain of such public offerings. The covenants of the first and second lien term loan facilities restrict the payment of dividends and distributions to, among other exceptions, (i) a $25.0 million general basket, (ii) a basket for unlimited dividends and distributions if no event of default exists and the pro forma total net leverage ratio is less than or equal to 4.25 to 1.00, (iii) a “growing” basket based on, among other things, retained excess cash flow subject to no event of default and compliance with a pro forma interest coverage ratio of greater than or equal to 2.00 to 1.00, and (iv) following this offering, a basket for 6% per annum of the net cash proceeds received from such qualified IPO that are contributed to the borrower in cash. As of February 3, 2018, the amount of net income free of such restrictions and available for payment by BJ’s Wholesale Club Holdings, Inc. as dividends was $50.3 million, and the total amount of restricted net assets of consolidated subsidiaries of BJ’s Wholesale Club Holdings, Inc. was $144.0 million.
All subsidiaries of BJ’s Wholesale Club, Inc. are consolidated.
These condensed parent company financial statements have been prepared using the same accounting principles and policies described in the notes to the consolidated financial statements, with the only exception being that the parent company accounts for its subsidiaries using the equity method.
23. Subsequent Event
The Company has evaluated subsequent events from the balance sheet date through April 18, 2018, the date at which the consolidated financial statements were available to be issued, and determined that there are no other material items to disclose.
F-36
Table of Contents
Shares
BJ’s Wholesale Club Holdings, Inc.
Common Stock
| BofA Merrill Lynch |
Deutsche Bank Securities |
Goldman Sachs & Co. LLC | J.P. Morgan |
Through and including , 2018 (the 25th day after the date of this prospectus), all dealers that effect transactions in these securities, whether or not participating in this offering, may be required to deliver a prospectus. This is in addition to the dealer’s obligation to deliver a prospectus when acting as an underwriter and with respect to unsold allotments or subscriptions.
Table of Contents
PART II
INFORMATION NOT REQUIRED IN PROSPECTUS
Item 13. Other Expenses of Issuance and Distribution
The following table sets forth all the costs and expenses, other than underwriting discounts, payable in connection with the sale of the shares of common stock being registered hereby. Except as otherwise noted, the Registrant will pay all of the costs and expenses set forth in the following table. All amounts shown below are estimates, except the SEC registration fee, the FINRA filing fee and the stock exchange listing fee:
| Amount | ||||
| SEC registration fee |
$ | 12,450 | ||
| FINRA filing fee |
$ | 15,500 | ||
| Stock exchange listing fee |
$ | 25,000 | ||
| Printing and engraving expenses |
* | |||
| Legal fees and expenses |
* | |||
| Accounting fees and expenses |
* | |||
| Transfer agent and registrar fees |
* | |||
| Miscellaneous expenses |
* | |||
|
|
|
|||
| Total |
* | |||
|
|
|
|||
| * | To be filed by amendment. |
Item 14. Indemnification of Directors and Officers
Section 102 of the Delaware law allows a corporation to eliminate the personal liability of a director to the corporation or its stockholders for monetary damages for breach of fiduciary duty as a director, except in cases where the director breached his or her duty of loyalty to the corporation or its stockholders, failed to act in good faith, engaged in intentional misconduct or a knowing violation of the law, willfully or negligently authorized the unlawful payment of a dividend or approved an unlawful stock redemption or repurchase or obtained an improper personal benefit. Our certificate of incorporation contains a provision which eliminates directors’ personal liability as set forth above.
Our certificate of incorporation and bylaws provide in effect that we shall indemnify our directors and officers to the extent permitted by the Delaware law. Section 145 of the Delaware law provides that a Delaware corporation has the power to indemnify its directors, officers, employees and agents in certain circumstances. Subsection (a) of Section 145 of the Delaware law empowers a corporation to indemnify any director, officer, employee or agent, or former director, officer, employee or agent, who was or is a party, or is threatened to be made a party to any threatened, pending or completed action, suit or proceeding, whether civil, criminal, administrative or investigative (other than an action by or in the right of the corporation), against expenses (including attorneys’ fees), judgments, fines and amounts paid in settlement actually and reasonably incurred in connection with such action, suit or proceeding provided that such director, officer, employee or agent acted in good faith and in a manner he or she reasonably believed to be in, or not opposed to, the best interests of the corporation and, with respect to any criminal action or proceeding, provided that such director, officer, employee or agent had no reasonable cause to believe that his or her conduct was unlawful.
Subsection (b) of Section 145 of the Delaware law empowers a corporation to indemnify any director, officer, employee or agent, or former director, officer, employee or agent, who was or is a party or is threatened to be made a party to any threatened, pending or completed action or suit by or in the right of the corporation to procure a judgment in its favor by reason of the fact that such person acted in any of the capacities set forth above, against expenses (including attorneys’ fees) actually and reasonably incurred in connection with the
II-1
Table of Contents
defense or settlement of such action or suit provided that such person acted in good faith and in a manner he or she reasonably believed to be in or not opposed to the best interests of the corporation, except that no indemnification may be made in respect of any claim, issue or matter as to which such person shall have been adjudged to be liable to the corporation unless and only to the extent that the Court of Chancery shall determine that despite the adjudication of liability such person is fairly and reasonably entitled to indemnity for such expenses which the court shall deem proper.
Section 145 further provides that to the extent that a director or officer or employee of a corporation has been successful in the defense of any action, suit or proceeding referred to in subsections (a) and (b) or in the defense of any claim, issue or matter therein, he or she shall be indemnified against expenses (including attorneys’ fees) actually and reasonably incurred by him or her in connection therewith; that indemnification provided by Section 145 shall not be deemed exclusive of any other rights to which the party seeking indemnification may be entitled; and the corporation is empowered to purchase and maintain insurance on behalf of a director, officer, employee or agent of the corporation against any liability asserted against him or her or incurred by him or her in any such capacity or arising out of his or her status as such whether or not the corporation would have the power to indemnify him or her against such liabilities under Section 145; and that, unless indemnification is ordered by a court, the determination that indemnification under subsections (a) and (b) of Section 145 is proper because the director, officer, employee or agent has met the applicable standard of conduct under such subsections shall be made by (1) a majority vote of the directors who are not parties to such action, suit or proceeding, even though less than a quorum, or (2) if there are no such directors, or if such directors so direct, by independent legal counsel in a written opinion, or (3) by the stockholders.
We have in effect insurance policies for general officers’ and directors’ liability insurance covering all of our officers and directors. In addition, we have entered into indemnification agreements with our directors and officers. These indemnification agreements may require us, among other things, to indemnify each such director or officer for certain expenses, including attorneys’ fees, judgments, fines and settlement amounts incurred by such director or officer in any action or proceeding arising out of his or her service as one of our directors or officers.
Item 15. Recent Sales of Unregistered Securities
During the three years preceding the filing of this registration statement, we have issued the following securities which were not registered under the Securities Act of 1933, as amended (all share numbers before the proposed split):
On September 8, 2015, we sold 24,391 shares of our common stock to Christopher J. Baldwin, one of our executive officers. See “Certain Relationships and Related Party Transactions—Christopher J. Baldwin Share Purchase and Promissory Note.”
During the past three years, we issued options to purchase an aggregate of shares of common stock under the 2011 Stock Option Plan and the Director Stock Option Plan.
The issuances of the securities in the transactions described above were deemed to be exempt from registration under the Securities Act in reliance upon Section 4(a)(2) of the Securities Act or Rules 506 and 701 promulgated thereunder. The securities were issued directly by the registrant and did not involve a public offering or general solicitation. The recipients of such securities represented their intentions to acquire the securities for investment purposes only and not with a view to, or for sale in connection with, any distribution thereof.
Item 16. Exhibits and Financial Statement Schedules
(a) Exhibits.
See the Exhibit Index attached to this registration statement, which is incorporated by reference herein.
II-2
Table of Contents
(b) Financial Statement Schedules.
Schedules not listed above have been omitted because the information required to be set forth therein is not applicable or is shown in the financial statements or the notes thereto.
Item 17. Undertakings
The undersigned Registrant hereby undertakes to provide to the underwriters at the closing specified in the underwriting agreement certificates in such denominations and registered in such names as required by the underwriters to permit prompt delivery to each purchaser.
Insofar as indemnification for liabilities arising under the Securities Act of 1933 may be permitted to directors, officers and controlling persons of the Registrant pursuant to the foregoing provisions, or otherwise, the Registrant has been advised that in the opinion of the Securities and Exchange Commission such indemnification is against public policy as expressed in the Securities Act of 1933 and is, therefore, unenforceable. In the event that a claim for indemnification against such liabilities (other than the payment by the Registrant of expenses incurred or paid by a director, officer or controlling person of the Registrant in the successful defense of any action, suit or proceeding) is asserted by such director, officer or controlling person in connection with the securities being registered, the Registrant will, unless in the opinion of its counsel the matter has been settled by controlling precedent, submit to a court of appropriate jurisdiction the question whether such indemnification by it is against public policy as expressed in the Securities Act of 1933 and will be governed by the final adjudication of such issue.
The undersigned Registrant hereby undertakes that:
| (1) | For purposes of determining any liability under the Securities Act of 1933, the information omitted from the form of prospectus filed as part of this registration statement in reliance upon Rule 430A and contained in a form of prospectus filed by the Registrant pursuant to Rule 424(b)(1) or (4) or 497(h) under the Securities Act shall be deemed to be part of this registration statement as of the time it was declared effective. |
| (2) | For the purpose of determining any liability under the Securities Act of 1933, each post-effective amendment that contains a form of prospectus shall be deemed to be a new registration statement relating to the securities offered therein and the offering of such securities at that time shall be deemed to be the initial bona fide offering thereof. |
II-3
Table of Contents
INDEX TO EXHIBITS
II-4
Table of Contents
| * | To be filed by amendment. |
II-5
Table of Contents
Pursuant to the requirements of the Securities Act of 1933, as amended, the Registrant has duly caused this Registration Statement to be signed on its behalf by the undersigned, thereunto duly authorized, in the City of Westborough, State of Massachusetts, on this 17th day of May, 2018.
| BJ’S WHOLESALE CLUB HOLDINGS, INC. | ||||
| By: | /s/ Robert W. Eddy | |||
| Name: | Robert W. Eddy | |||
| Title: | Executive Vice President, Chief Financial and Administrative Officer | |||
POWER OF ATTORNEY
We, the undersigned officers and directors of BJ’s Wholesale Club Holdings, Inc. hereby severally constitute and appoint Robert W. Eddy and Graham N. Luce, and each of them singly (with full power to each of them to act alone), our true and lawful attorneys-in-fact and agents, with full power of substitution and resubstitution in each of them for him and in his name, place and stead, and in any and all capacities, to sign any and all amendments (including post-effective amendments) to this registration statement (or any other registration statement for the same offering that is to be effective upon filing pursuant to Rule 462(b) under the Securities Act of 1933), and to file the same, with all exhibits thereto and other documents in connection therewith, with the Securities and Exchange Commission, granting unto said attorneys-in-fact and agents, and each of them, full power and authority to do and perform each and every act and thing requisite or necessary to be done in and about the premises, as full to all intents and purposes as he might or could do in person, hereby ratifying and confirming all that said attorneys-in-fact and agents or any of them, or their or his substitute or substitutes, may lawfully do or cause to be done by virtue hereof.
Pursuant to the requirements of the Securities Act of 1933, as amended, this Registration Statement has been signed below by the following persons on behalf of the Registrant and in the capacities and on the dates indicated.
| Signature |
Title |
Date | ||
| /s/ Christopher J. Baldwin Christopher J. Baldwin |
Chairman, President & Chief Executive Officer (principal executive officer) |
May 17, 2018 | ||
| /s/ Robert W. Eddy Robert W. Eddy |
Executive Vice President, Chief Financial and Administrative Officer (principal financial officer) |
May 17, 2018 | ||
| /s/ Laura L. Felice Laura L. Felice |
Senior Vice President, Finance (principal accounting officer) |
May 17, 2018 | ||
| /s/ Cameron Breitner Cameron Breitner |
Director | May 17, 2018 | ||
| /s/ Nishad Chande Nishad Chande |
Director | May 17, 2018 | ||
II-6
Table of Contents
| Signature |
Title |
Date | ||
| /s/ J. Kristofer Galashan J. Kristofer Galashan |
Director | May 17, 2018 | ||
| /s/ Lars Haegg Lars Haegg |
Director | May 17, 2018 | ||
| /s/ Ken Parent Ken Parent |
Director | May 17, 2018 | ||
| /s/ Jonathan A. Seiffer Jonathan A. Seiffer |
Director | May 17, 2018 | ||
| /s/ Christopher J. Stadler Christopher J. Stadler |
Director | May 17, 2018 | ||
| /s/ Robert Steele Robert Steele |
Director | May 17, 2018 | ||
| /s/ Tommy Yin Tommy Yin |
Director | May 17, 2018 | ||
II-7