Attached files
| file | filename |
|---|---|
| EX-23.1 - CONSENT OF INDEPENDENT APPRAISAL FIRM - OLB GROUP, INC. | f8k050918ex23-1_theolbgroup.htm |
| EX-10.2 - SHARE EXCHANGE AGREEMENT, DATED MAY 9, 2018, BY AND BETWEEN THE OLB GROUP, INC. - OLB GROUP, INC. | f8k050918ex10-2_theolbgroup.htm |
| EX-10.1 - SHARE EXCHANGE AGREEMENT, DATED MAY 9, 2018, BY AND BETWEEN THE OLB GROUP, INC. - OLB GROUP, INC. | f8k050918ex10-1_theolbgroup.htm |
| 8-K - CURRENT REPORT - OLB GROUP, INC. | f8k050918_theolbgroup.htm |
Exhibit 99.1
OLB Group, Inc.
Equity Valuation
Made as of April 30, 2018
![]()
![]()
May 8, 2018
Mr. Ronny Yakov
Chief Executive Officer
OLB Group, Inc.
200 Park Avenue, Suite 1700
New York, NY 10166
Re: Valuation of OLB Group, Inc.
Dear Mr. Yakov:
At your request and pursuant to your authorization, we have conducted a valuation of the total equity of each of OLB Group, Inc. (hereinafter referred to as "OLB" or the "Company") after giving effect to its acquisition of certain assets of Excel Corporation on April 9, 2018, OmniSoft, Inc. ("OmniSoft") and CrowdPay.us, Inc. ("CrowdPay"). The purpose of this valuation has been to express our opinion of the Fair Market Value of the total equity of the Company, OmniSoft and CrowdPay as of April 30, 2018. It is our understanding that this valuation may be relied upon in connection with (i) determining the number of shares of OLB to be exchanged as consideration for the mergers of OmniSoft and CrowdPay by and into OLB and (ii) efforts by OLB to raise $5.0 million of additional equity capital.
The term "Fair Market Value" is defined as the amount at which the equity of each of the Company, OmniSoft and CrowdPay would equitably exchange between a willing buyer and a willing seller, neither being under compulsion to buy or sell and both having reasonable knowledge of a relevant facts.
Our valuation report consists of:
| ● | This letter which identifies the subject and scope of this investigation and valuation and summarizes our opinions of value. |
| ● | A report containing (i) descriptive data on each of OLB, OmniSoft and CrowdPay, (ii) a discussion of the appropriate valuation methodologies and the application of those methodologies to the valuation of the equity of each of OLB, OmniSoft and CrowdPay and (iii) the conclusions attained through this analysis. |
All data provided for our use in this analysis has been accepted as accurate and reflective of actual business operations and conditions.

Mr. Ronny Yakov
May 8, 2018
Page 2
Based upon the valuation procedures employed which are more fully described in the accompanying report, it is our opinion that the Fair Market Value of the total equity of each of OLB, OmniSoft and CrowdPay, as of April 30, 2018, is reasonably stated in the following amounts:
Fair Market Value
Of Total Equity – OLB
THIRTY THREE MILLION
FOUR HUNDRED THIRTEEN THOUSAND DOLLARS
($33,413,000)
Fair Market Value
Of Total Equity – OmniSoft
TWENTY TWO MILLION DOLLARS
($22,000,000)
Fair Market Value
Of Total Equity – CrowdPay
THIRTY FIVE MILLION DOLLARS
($35,000,000)
We have made no investigation of, and assume no responsibility for, the title to or any encumbrances against OLB, its subsidiaries or their assets. Neither Corporate Valuation Advisors, Inc., nor any of its employees have any financial interest in OLB, its subsidiaries or their assets. We certify that the compensation received for this study is not in any manner contingent upon the conclusions stated. This report is subject to the limiting factors and assumptions which appear at the end of the report.
Respectfully Submitted,

James W. Volkman, AM
Managing Director – Financial Valuation Services
Corporate Valuation Advisors, Inc
TABLE OF CONTENTS
| Page No. | |
| INTRODUCTION | 1 |
| Purpose and Scope of the Valuation | 1 |
| Definition of Fair Market Value | 1 |
| Date of the Valuation | 1 |
| Date of the Report | 1 |
| Property Included | 1 |
| HISTORY AND NATURE OF THE BUSINESS | 2 |
| INDUSTRY REVIEW | 3 |
| VALUATION THEORY | 4 |
| Introduction | 4 |
| Approaches Used | 4 |
| VALUATION OF OLB | 5 |
| Financial Review | 5 |
| Valuation | 6 |
| Conclusion | 15 |
| VALUATION OF OMNISOFT | 16 |
| Financial Review | 16 |
| Valuation | 16 |
| Conclusion | 20 |
| CROWDPAY VALUATION | 21 |
| Financial Review | 21 |
| Valuation | 21 |
| Conclusion | 25 |
| MERGER CONSIDERATION AND DILUTION | 26 |
| CONCLUSION | 26 |
LIMITING FACTORS AND ASSUMPTIONS
APPRAISAL CERTIFICATE
PROFESSIONAL QUALIFICATIONS
EXHIBITS
Exhibit 1 – Comparative Income Statements
Exhibit 2 – Pro Forma Consolidating Balance Sheet
Exhibit 3 – Transaction Market Data
Exhibit 4 – Guideline Company Market Data
Exhibit 5 – Guideline Company Financial Ratio
Exhibit 6 – Discounted Cash Flow Approach – OLB
Exhibit 7 – Discounted Cash Flow Approach – OmniSoft
Exhibit 8 – Discounted Cash Flow Approach – CrowdPay
| OLB Group, Inc. | Page 1 |
INTRODUCTION
Purpose and Scope of the Valuation
The investigation and valuation described in this report was made for the purpose of expressing our opinion of the total equity value of each of OLB Group, Inc. (hereinafter referred to as "OLB" or the "Company") after giving effect to its acquisition of Excel Corporation on April 9, 2018, OmniSoft, Inc. ("OmniSoft") and CrowdPay.us, Inc. ("CrowdPay") as of April 30, 2018. The purpose of the appraisal is to (i) determine the number of shares of OLB to be equitably exchanged as consideration for the mergers of OmniSoft and CrowdPay by and into OLB and (ii) efforts by OLB to raise $5.0 million of additional equity capital.
Definition of Fair Market Value
For purposes of this engagement, the term "Fair Market Value" is defined as the amount at which the equity of each of the Company, OmniSoft and CrowdPay would equitably exchange between a willing buyer and a willing seller, neither being under compulsion to buy or sell and both having reasonable knowledge of a relevant facts.
Date of the Valuation
This valuation is made as of April 30, 2018.
Date of the Report
This report is prepared as of May 8, 2018.
Property Included
The scope of this valuation relates to the total equity of OLB, OmniSoft and CrowdPay.
The valuation of the equity of the subject companies requires an examination of all potential factors affecting value. In the course of this valuation, we have considered the following:
| ● | The history of OLB, OmniSoft and CrowdPay, the nature of their businesses and their reasonably anticipated growth opportunities. |
| ● | The outlook of the economy and the effect of the economy on the industry in which OLB, OmniSoft and CrowdPay participate. |
| ● | The historical trend of the earnings and expenses of OLB, OmniSoft and CrowdPay and their current capital structure. |
| ● | The current market for publicly traded guideline companies engaged in the same industry or an industry similar to the industry in which the subject companies compete. |
| ● | The risks involved in an investment in OLB, OmniSoft and CrowdPay as related to earnings stability, capital structure and competition. |
In valuing each of OLB, OmniSoft and CrowdPay, the Market and Income Approaches were applied.
In applying the Market Approach, market and financial data on publicly traded guideline companies was analyzed and relevant valuation multiples were formulated from that data. The valuation of each of OLB, OmniSoft and CrowdPay also includes an Income Approach which is based on a cash flow projection for each entity. Value indications were independently derived from the Market and Income Approaches. The resulting values were compared and our conclusion of value was derived from a subjective review and weighting of these approaches.
Corporate Valuation Advisors, Inc.
| OLB Group, Inc. | Page 2 |
HISTORY AND NATURE OF THE BUSINESS
The Company was incorporated in Delaware in 2004 for the purpose of merging with OLB.com, Inc., a New York corporation formed in 1993. OLB has historically been engaged in selling health benefit packages on a subscription basis.
Effective April, 9, 2018, OLB acquired certain assets of Excel Corporation and its subsidiaries in a bankruptcy sale for $12.5 million. The Company borrowed substantially all of consideration payable to the bankruptcy trustee.
Excel Corporation was founded in 2010 and is headquartered in Irving, Texas. Through its subsidiaries, the company provides integrated financial and transaction processing services to businesses in the United States. It offers an integrated suite of third-party merchant payment processing services and related proprietary software enabling products that deliver credit and debit card-based Internet payments processing solutions to small and mid-sized merchants. Excel Corporation served approximately 8,300 merchants as of the date its assets were acquired by OLB.
OmniSoft offers software as a service ("SaaS") to small and medium sized merchants. Its software suite offers a broad range of functions including inventory management, content management, web site building, point-of-sale devices, marketing tools, mobile commerce and social media integration. These services are largely unavailable through most other merchant payment service providers.
CrowdPay is web based crowdfunding software system. The software provides broker-dealer, merchant banks and law firms a platform to market crowdfunding offerings, collect payments and issue securities. The software has been developed in response to, and to comply with, recent changes in investment regulations including Regulation D 506(b) and 506(C), Regulation A+ and Title III of the Jobs Act.
The founder and controlling shareholder of OLB is Mr. Ronny Yakov who currently serves as the Chief Executive Officer, Interim Chief Financial Officer and a director of the Company. Mr. Yakov owns approximately 58% of the outstanding common stock of OLB, Mr. John Herzog owns approximately 29% of its common stock and outside shareholders own the remaining 13% of its common shares. It is our understanding that Mr. Yakov also owns a controlling interest in OmniSoft and CrowdPay and has agreed to merge these companies into OLB in exchange for additional common shares of the Company.
Corporate Valuation Advisors, Inc.
| OLB Group, Inc. | Page 3 |
INDUSTRY REVIEW
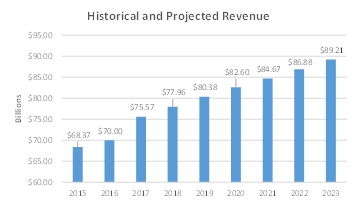
The operations of the Company are most similar to the credit card processing industry. Our industry review is based upon available information including IBISWorld Industry Report 54151 Credit Card Processing & Money Transferring in the U.S. This industry includes companies that provide financial transaction processing, check or other financial clearinghouse services and reserve and liquidity services. Electronic transactions associated with the US Federal Reserve are not included in this industry.
The industry is estimated to grow at 3.2% per year on average over the 2013 to 2018 period. Growth in 2018 is estimated at 3.2%, increasing revenue to $77.96 billion. Overall, the industry is projected to grow at an average annual rate of 2.7% to $89.21 billion from 2018 to 2023. Revenues of the credit card processing and money transferring industry for the 2015 through projected 2023 period are shown below:
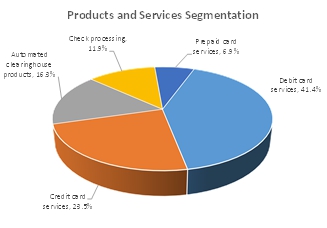
The industry generates most of its revenue through transaction and data processing fees from debit card and credit card purchases. The estimated 2018 products and services segmentation or the credit card processing and money transferring industry is as follows:
There are several key external drivers that impact this industry. Purchase frequency and volume from consumer spending impacts industry revenues. A majority of consumers in the U.S. use electronic payments for purchases. IBISWorld expects an increase in consumer spending in 2018 which would lead to an increase in industry revenues. The Consumer Confidence Index is tied to trends in employment, surveys on economic outlook and income. A decline in consumer confidence leads to a decrease in frequency of consumer purchases. The Consumer Confidence Index is expected to decline in 2018, a potential threat to this industry. Per capita disposable income determines a person's ability to purchase goods. The more income an individual has, the more that individual has to spend on purchases which increases payment transactions. An increase in per capita disposable income is expected in 2018 which will have a positive impact on industry revenues. Another key external driver for this industry is regulation. An increase in regulation typically lowers profitability due to the increased costs with complying with the new standards.
The industry has a medium level of concentration. In 2018, IBISWorld estimates that the four largest firms in the industry will account for 46.9% of industry revenue. There are a number of large firms in the industry that control significant market share and earn billions in revenue annually. However, there are small, independent and privately owned companies serving niche markets. The industry is becoming increasingly fragmented due to the large number of companies with different specialties. The largest companies in this industry consist of Visa, Inc., PayPal Holdings, Inc., Kohlberg Kravis Roberts and Co. LP, MasterCard, Inc. and Fidelity National Information Services, Inc.
From 2017 to 2023, the number of industry firms is expected to increase from 5,835 firms to 6,847 firms in 2023. Over the same period, employment numbers are expected to increase from 131,721 employees in 2017 to 155,115 employees in 2023. The industry EBIT margin is estimated at 12.4% of total revenue in 2018, a decrease from 2013 as a result of increasing wages and regulatory costs. Wage costs are expected to amount to 16.3% of industry revenue in 2018, and increase from 14.8% of industry revenue in 2013. However, increases in consumer electronic payment activity and technological advancements in automation have caused margins to remain at an acceptable level.
Corporate Valuation Advisors, Inc.
| OLB Group, Inc. | Page 4 |
VALUATION THEORY
Introduction
Generally accepted valuation principles require reliance on three basic approaches: the Cost Approach, the Market Approach and the Income Approach. These approaches are respectively based upon the cost to reproduce the assets, the market exchanges for comparable assets and the capitalization of income. The Cost, Market and Income Approaches are briefly summarized below:
Cost Approach
The Cost Approach is a valuation technique that uses the concept of replacement as a value based on the principle of substitution. A prudent investor would pay no more for an asset than the amount for which he could replace the asset new. The replacement cost is then adjusted for losses in value (appraised depreciation) due to a variety of factors.
Market Approach
The Market Approach is a valuation technique in which the estimated market value is based on market prices in actual transactions. The technique consists of collecting selling prices for comparable assets. After studying the selling prices, value adjustments are made for comparability differences. This process is essentially one of comparison and correlation.
Income Approach
The Income Approach is a valuation technique that capitalizes the anticipated income from an appraised asset. This approach is predicated on developing either cash flow or income projections which are then discounted for time and risk. The Income Approach requires that the appraiser be able to isolate a relevant income stream for the subject asset. If the income is anticipated to continue in perpetuity, the value can be calculated by dividing the income by the capitalization rate. If the earnings are expected to be stable for a known duration, the use of an annuity factor is preferable. If future earnings are variable, the expected income in each future year can be discounted to present worth and accumulated. A perpetual income stream with a variable income amount may also be discounted to its present worth over a given period if a terminal value is estimated beyond the discrete forecast period.
Approaches Used
Under ideal circumstances, all three approaches may be applicable to the valuation of an asset. For certain types of property, one or more value concepts may be inappropriate. In certain instances, results indicated by one approach may vary widely from the other two approaches. When this situation exists, the appraiser must discern the reasons for this difference and select the methods that best represent the considerations of both a willing and knowledgeable buyer and seller.
In valuing each of OLB, OmniSoft and CrowdPay, primary consideration is given to the Market and Income Approaches. The Cost Approach, as a valuation technique, has little relevance since investors in a firm are primarily concerned with the earnings and cash flow potential from operations as opposed to the costs that would be incurred in recreating the enterprise.
In the following sections of this report, we describe the valuation procedures utilized in estimating the Fair Market Value of the equity of each company.
Corporate Valuation Advisors, Inc.
| OLB Group, Inc. | Page 5 |
VALUATION OF OLB
Financial Review
OLB reports its operating results on a calendar year basis. We have been provided with a pro forma income statement for OLB for the year ending December 31, 2017 (assuming that the assets of Excel Corporation had been purchased on January 1, 2017), the estimated income statement for the year ending December 31, 2018 and the projected income statements for the two, one-year periods ending December 31, 2020, as prepared by management. We have extended the projected income statements for an additional four, one-year periods ending December 31, 2024 based upon the projected trend in revenues and earnings of OLB.
The 2017 pro forma income statement and 2018 estimated income statement for OLB are presented in Exhibit 1 to this report, along with the historical financial statements of Excel Corporation for the three, one-year periods ending December 31, 2016. A pro forma consolidating balance sheet for OLB, as of April 30, 2018, is summarized on Exhibit 2 to this report.
Income Statement
Revenues amounted to $9.57 million in 2014 and decreased to $5.63 million in 2015. Revenues increased to $17.12 million in 2016 and decreased to $14.90 million in 2017. Revenues are estimated at $14.18 million in 2018.
Cost of revenues amounted to $1.42 million in 2014. No cost of revenues was reported in each of 2015 and 2016. Cost of revenues amounted to $5.51 million in 2017 and is estimated at $8.98 million in 2018.
Subtracting cost of revenues from revenues results in gross profit. Gross profit amounted to $8.14 million in 2014 and decreased to $5.63 million in 2015. Gross profit increased to $17.12 million in 2016 and decreased to $9.39 million in 2017. Gross profit is estimated at $5.21 million in 2018.
Total operating expense amounted to $11.09 million in 2014 and decreased to $3.48 million in 2015. Total operating expense increased to $13.81 million in 2016 and decreased to $6.49 million in 2017. Total operating expense is estimated at $2.42 million in 2018.
Subtracting total operating expense from gross profit results in EBITDA (earnings before interest expense, taxes and depreciation and amortization expense). EBITDA amounted to negative $2.95 million in 2014 and increased to $2.15 million in 2015. EBITDA further increased to $3.31 million in 2016 and decreased to $2.90 million in 2017. EBITDA is estimated at $2.79 million in 2018.
Corporate Valuation Advisors, Inc.
| OLB Group, Inc. | Page 6 |
Depreciation expense amounted to $76,000 in 2014 and increased to $143,000 in 2015. Depreciation expense further increased to $485,000 in 2016 and to $500,000 in 2017. Depreciation expense is estimated at $438,000 in 2018.
Subtracting depreciation expense from EBITDA results in EBIT (earnings before interest expense and taxes). EBIT amounted to negative $3.02 million in 2014 and increased to $2.00 million in 2015. EBIT further increased to $2.82 million in 2016 and decreased to $2.40 million in 2017. EBIT is estimated at $2.35 million in 2018.
Balance Sheet
A pro forma balance sheet of OLB as of April 30, 2018 is presented in Exhibit 2 to this report. Pro forma total assets of OLB amounted to $14.51 million as of April 30, 2018. Pro forma current assets, as of April 30, 2018, amounted to $1.50 million and consisted solely of cash and cash equivalents.
Pro forma current liabilities, as of April 30, 2018, amounted to $93,000 and consisted of accounts payable of $90,000 and accrued expenses and other current liabilities of $3,000. Based upon the pro forma current assets and pro forma current liabilities, the net working capital (excluding current debt) of OLB, as of April 30, 2018, amounted to $1.41 million.
The net property and equipment acquired in the Excel Corporation transaction is estimated at $100,000 and the goodwill and customer relationships value is estimated at $12.40 million. Capitalized software of OLB has a net book value of $5,000 and capitalized acquisition costs are estimated at $500,000.
Pro forma long-term liabilities, as of April 30, 2018, amounted to $9.50 million and consisted solely of long-term debt. Accordingly, the pro forma book value of stockholders' equity, as of April 30, 2018, amounted to $4.91 million.
Valuation
Market Approach
The Market Approach compares the entity being appraised with similar companies that have recently sold or with companies that are publicly traded. The value of the entity is estimated from the various multiples developed from those sales or from the comparable public companies which are then applied to the respective earnings of the subject. The primary criteria for selecting comparables include similarities in lines of business and other relevant factors such as size, profitability, leverage, growth prospects and risk.
Corporate Valuation Advisors, Inc.
| OLB Group, Inc. | Page 7 |
Sales Transactions
We conducted an investigation as to the recent acquisition of companies in the financial advisory or related industries. That investigation resulted in the identification of 12 acquisitions involving comparable companies. The identified transactions are shown on Exhibit 3 to this report. Given (i) the age of the transactions identified, (ii) the limited financial information available on the companies which sold and (iii) the wide variation of valuation multiples indicated by these transactions, we have relied primarily upon the multiples indicated by our public market analysis for purposes of determining the business enterprise value under the Market Approach.
Public Market Analysis
We have identified seven publicly traded companies for the purpose of conducting a comparative evaluation with OLB. The companies selected for comparative evaluation are all engaged, to some extent, in the financial advisory or related industries.
Rarely does there exist exact comparability between the subject of the valuation and the guideline companies selected for comparative evaluation. Differences typically exist in terms of size, products, product mix and structure.
Despite the potential infirmities underlying the comparative evaluation process, it is still a valid method for formulating valuation multiples. First of all, to the extent the guideline companies are engaged in a business similar to that of OLB, investor perception as to the desirability or attractiveness of an investment in OLB can be ascertained. Secondly, multiples indicated by the publicly traded guideline companies can be adjusted to reflect the economic advantages or disadvantages of OLB on a comparative basis.
The seven publicly traded guideline companies selected for comparative evaluation with OLB are summarized below:
| ● | Shopify, Inc.: – This company is engaged in providing a cloud-based multi-channel commerce platform for small and medium-sized businesses in Canada, the U.S., the United Kingdom, Australia and internationally. The platform of the company gives merchants the ability to manage products and inventory, process orders and payments, ship orders, build customer relationships, leverage analytics and reporting and access financing. The stock of Shopify, Inc. is traded on the Toronto Stock Exchange and closed at the equivalent of $133.94 per share on April 30, 2018. |
| ● | Evertec, Inc.: – This company is engaged in processing credit, debit, EBT and other transactions for merchants. In addition, the company owns and operates an electronic payment network that supports 4,100 ATMs and 104,000 point-of-sale terminals. Other services offered by the company include bank processing, technology outsourcing and cash management services to financial institutions, companies and governments. The stock of Evertec, Inc. is traded on the New York Stock Exchange and closed at $18.25 per share on April 30, 2018. |
Corporate Valuation Advisors, Inc.
| OLB Group, Inc. | Page 8 |
| ● | Square, Inc.: – This company is engaged in providing payment and point-of-sale solutions in the U.S. and internationally. The company is primarily engaged in providing point-of-sale software and hardware to enable mobile and computer devices into payment and point-of-sale solutions. The card readers of the company attach to smartphones and tablets, providing a business with a low-cost point-of-sale option. Software of the company handles the backend of the transaction, making sure accounts square up between the merchant, the card company, the bank and the consumer. The stock of Square, Inc. is traded on the New York Stock Exchange and closed at $47.34 per share on April 30, 2018. |
| ● | First Data Corporation: – This firm is engaged in providing a variety of secure funds transfer and related services. These services include credit card payment processing, fraud protection and authentication, check guarantee, electronic bill payment management and point-of-sale services. The company serves approximately six million merchants and 4,000 card issuers in 100 countries. The stock of First Data Corporation is traded on the New York Stock Exchange and closed at $18.10 per share on April 30, 2018. |
| ● | Total System Services, Inc.: – This company is engaged in providing credit authorization, payment processing, e-commerce services, card issuance and fraud monitoring. The firm also provides merchant services to customers in the U.S. Customers of the company include financial institutions and other companies that issue bank, private-label, prepaid and other types of cards. The stock of Total System Services, Inc. is traded on the New York Stock Exchange and closed at $84.06 per share on April 30, 2018. |
| ● | Global Payments, Inc.: – This company provides credit and debit card processing, check authorization and other electronic payment processing services. Approximately 2.5 million merchant and business locations are served worldwide. Customers of the company are engaged in the retail, financial institution, government and gaming industries. The stock of Global Payments, Inc. is traded on the New York Stock Exchange and closed at $113.05 per share on April 30, 2018. |
| ● | Worldpay, Inc.: – This company is engaged in providing payment processing between merchants and customers and their banks. The firm also handles PIN transactions, fraud detection and management and credit card issuing for financial institutions. Merchants of the company include retailers, grocers, pharmacies, restaurants and small to mid-sized banks and credit unions. The stock of Worldpay, Inc. is traded on the New York Stock Exchange and closed at $81.22 per share on April 30, 2018. |
Corporate Valuation Advisors, Inc.
| OLB Group, Inc. | Page 9 |
The above companies have latest trailing twelve-month revenues ranging from $407.14 million to $12.05 billion. The minority equity value of these companies range from $1.32 billion to $18.00 billion. Market and financial data on these companies is presented as Exhibit 4 and Exhibit 5 to this report. The financial data on these companies was obtained from their 10K and 10Q filings with the Securities and Exchange Commission ("SEC") and/or their web site.
In using the Market Approach, we have applied business enterprise multiples to the 2017 revenues, EBIT and EBITDA of the Company. In addition, a market derived total asset multiple was applied to the April 30, 2017 pro forma total assets of the Company. Business enterprise multiples, determined by adding interest bearing debt to the market value of equity, are intended to reduce the bias which might otherwise result from a comparison of firms where there is a substantial variation in leverage.
Based upon the financial data shown on Exhibit 4 and Exhibit 5 to this report, we formulated valuation multiples which we applied to the appropriate segment of the earnings stream of OLB.
Multiples for each of the guideline companies are shown below:
| Market Multiples | ||||||||||||||||
| Guideline Company | EBIT | EBITDA | Revenues | Total Assets | ||||||||||||
| Shopify, Inc. | 2,229,672.62 | 572.00 | 19.87 | 12.01 | ||||||||||||
| Evertec, Inc. | 16.59 | 10.70 | 4.76 | 2.15 | ||||||||||||
| Square, Inc. | 81.69 | 66.90 | 6.22 | 6.30 | ||||||||||||
| First Data Corporation | 13.14 | 8.73 | 2.32 | 0.58 | ||||||||||||
| Total System Services, Inc. | 23.68 | 15.57 | 3.75 | 2.92 | ||||||||||||
| Global Payments, Inc. | 38.95 | 22.20 | 5.86 | 1.79 | ||||||||||||
| Worldpay, Inc. | 35.39 | 22.70 | 5.00 | 2.33 | ||||||||||||
| High (1) | 38.95 | 22.70 | 5.86 | 2.92 | ||||||||||||
| Low (1) | 13.14 | 8.73 | 2.32 | 0.58 | ||||||||||||
| Average (1) | 25.55 | 15.98 | 4.34 | 1.95 | ||||||||||||
(1) Excludes Shopify, Inc. and Square, Inc. due to outlier multiples.
In applying multiples to the 2017 revenues, EBIT, EBITDA and the April 30, 2018 pro forma total assets of OLB, we have made adjustments to the EBIT, revenues and total asset multiples to reflect the differences in depreciation and amortization expense, profit margins and return on assets of OLB as compared to the guideline companies. The adjustments made to each multiple and a summary of the selected multiples are shown below:
Corporate Valuation Advisors, Inc.
| OLB Group, Inc. | Page 10 |
| Selected Market Multiples | ||||||||||||||||
| EBIT | EBITDA | Revenues | Total Assets | |||||||||||||
| Average Multiple | 25.55 | 15.98 | 4.34 | 1.95 | ||||||||||||
| Subject Earnings Ratios | ||||||||||||||||
| EBIT/EBITDA | 82.8 | % | ||||||||||||||
| EBITDA/Revenues | 19.5 | % | ||||||||||||||
| EBITDA/Total Assets | 20.0 | % | ||||||||||||||
| Guideline Average Earnings Ratios | ||||||||||||||||
| EBIT/EBITDA | 63.6 | % | ||||||||||||||
| EBITDA/Revenues | 28.7 | % | ||||||||||||||
| EBITDA/Total Assets | 12.7 | % | ||||||||||||||
| Earnings Adjustment | 76.8 | % | 100.0 | % | 67.8 | % | 156.8 | % | ||||||||
| Adjusted Multiple (Rounded) | 19.75 | 16.00 | 2.95 | 3.05 | ||||||||||||
Based upon the application of the above described multiples, business enterprise value indications for OLB range from $43.96 million to $47.40 million, as shown below:
Guideline Public Company Market Approach
| Valuation Measure ($000) | Earnings Base | Multiple Selected | Business Enterprise Value | |||||||||
| EBIT | 2,400 | 19.75 | 47,400 | |||||||||
| EBITDA | 2,900 | 16.00 | 46,400 | |||||||||
| Revenues | 14,900 | 2.95 | 43,955 | |||||||||
| Total Assets | 14,506 | 3.05 | 44,243 | |||||||||
The mean and median value indications are $45.50 million and $45.32 million, respectively.
Income Approach
In applying the Income Approach, a discounted cash flow technique was employed. This valuation method begins with a net sales and expense forecast which is used to develop a pro forma cash flow statement. For purposes of this study, we have relied upon projections prepared by management for the three, one-year periods ending December 31, 2020. We have extended the projections for an additional four, one-year periods ending December 31, 2024 based upon the projected trend in net sales and earnings of OLB.
Corporate Valuation Advisors, Inc.
| OLB Group, Inc. | Page 11 |
The discounted cash flow technique has two value components. The first equals the sum of the present value of the cash flows over the seven-year period. Mid-year discounting was used to reflect the continuous income generation throughout the year. The terminal value equals the present value of the projected cash flow in the terminal period, capitalized into perpetuity at an appropriate discount rate less the terminal growth rate. The terminal value reflects the ongoing potential of the business.
Available cash flows are typically equal to the sum of net income plus depreciation, less capital expenditures and working capital requirements.
The discount rate affects the business enterprise value. This rate, an approximation of the cost of capital, is used to determine the present value of the cash flow streams. A company's cost of capital is equal to the weighted average of its after-tax cost of debt and equity.
The cost of capital varies with differences in financial and operating risk. In order to determine the appropriate cost of capital, we need to estimate three components. These three components are the cost of debt, the cost of equity and the capital structure. It is our opinion that the cost of debt for OLB is approximated by the rate for Baa bonds as surveyed by Moody's Investors Service, Inc. This rate reflects the cost of debt for companies of comparable risk and size. Since all economic decisions are based on an after-tax basis, the cost of debt is adjusted through the following equation:
| Rd | = B x (1-t) | ||
| = 4.74% x .74 | |||
| = 3.51% | |||
| Where: | |||
| Rd | = After-Tax Cost of Debt | ||
| B | = Moody's Baa Bond Rate on 4/30/18 | ||
| t | = Tax Rate (26%) |
The cost of equity is also consistent with particular risk levels. To determine the appropriate risk level, we have considered the average returns for the Standard and Poor's 500 adjusted for industry risk using beta. Beta is a measure of correlation between a particular security and the representative equity market (Standard and Poor's 500). For example, a security with a beta of 1 has a risk level equal to the market, a beta of .5 has a risk level less than the market and a beta of 2 reflects a risk level greater than the market.
Average beta values for the guideline companies relied upon under the Market Approach range from 0.59 to 4.21 with a mean beta of 1.59. We have unlevered the guideline company betas to eliminate the impact of their capital structures. The unlevered betas were then relevered to account for the capital structure (discussed below) of OLB which resulted in an adjusted beta of 1.60. As such, a beta of 1.60 (rounded) was selected for OLB.
Corporate Valuation Advisors, Inc.
| OLB Group, Inc. | Page 12 |
Using the above beta, the equity risk premium, the small company risk premium and the risk-free rate, an overall equity return is estimated. In estimating the equity risk premium, we relied upon historical data published in the 2017 Guide to Cost of Capital by Duff & Phelps, LLC. Based on this information, we concluded that the equity risk premium is equal to 5.97%. The size of the equity risk premium is equal to the average annualized total return on equity investments in excess of the average annualized bond yield on long-term government bonds over the period January, 1926 to December, 2016.
In order to estimate the small company risk premium, we again relied upon historical data published in the 2017 Guide to Cost of Capital by Duff & Phelps, LLC. The expected risk premium for a company with a market capitalization less than $262.89 million is 5.59%. Based on this information, we added a small company risk premium of 5.59%.
The risk-free rate has been estimated as the yield on 20-year treasury bonds as of April 30, 2018. That yield is indicated at 3.01%.
The equation shown below quantifies the cost of equity:
| Re | = Rf + (ERP x Beta) + SCRP | ||
| = 3.01% + (5.97% x 1.60) + 5.59% | |||
| = 18.15% | |||
| Where: | |||
| Re | = Equity Return | ||
| Rf | = Risk-Free Return (20-year Treasury Bond) | ||
| ERP | = Equity Risk Premium | ||
| SCRP | = Small Company Risk Premium |
The capital structure is the basis for weighting the combination of equity and debt costs. The capital structure of the seven guideline companies used in the Market Approach ranges from 0% debt to 68.7% debt with a mean capital structure consisting of 24.5% debt. Accordingly, we have selected a capital structure for OLB consisting of 25% debt and 75% equity.
All components necessary to compute the cost of capital are available. The equation and computations for determining the weighted average cost of capital are shown below:
| Rc | = (Wd x Rd) + (We x Re) | ||
| = (.25 x 3.51%) + (.75 x 18.15%) | |||
| = 14.49% | |||
| Where: | |||
| Rc | = Weighted Cost of Capital | ||
| Wd | = Weighting of Debt | ||
| Rd | = Cost of Debt | ||
| We | = Weighting of Equity | ||
| Re | = Cost of Equity |
Corporate Valuation Advisors, Inc.
| OLB Group, Inc. | Page 13 |
As shown above, the indicated weighted cost of capital or the discount rate is 14.49% which we have rounded to 14.50%. The development of our weighted cost of capital is shown as Exhibit 6 to this report.
Our discounted cash flow model begins with a net sales and expense forecast based upon management and CVA's projections. Again, the cash flow projections are based upon the three, one-year periods ending December 31, 2020 as provided by management. We have extended the projections for an additional four, one-year periods ending December 31, 2024 based upon the projected trend in net sales and earnings of OLB.
Revenues – Revenues are estimated at $12.19 million in 2018. Revenues are projected to increase in each subsequent year of the projection period to $48.20 million in 2024.
Cost of Revenues – Cost of revenues is estimated at $8.45 million or 69.4% of revenues in 2018. Cost of revenues is projected to increase in each subsequent year of the projection period to $32.56 million or 67.5% of revenues in 2024.
Total Operating Expenses – Total operating expenses are estimated at $2.08 million or 17.06% of revenues in 2018. Total operating expenses are projected to decrease to $1.58 million or 10.37% of revenues in 2019 and increase in each subsequent year of the projection period to $3.30 million or 6.84% of revenues in 2024.
Depreciation and Amortization Expense – Depreciation and amortization expense is estimated at $63,000 or 0.52% of revenues in 2018. Depreciation and amortization expense is projected to vary in each subsequent year of the projection period and amount to $86,000 or 0.18% of revenues in 2024.
Residual Portfolio Amortization Expense – Residual portfolio amortization expense is estimated at $363,000 in 2018. Residual portfolio amortization expense is projected to remain at $363,000 in each of 2019 and 2020. Residual portfolio amortization expense is projected to increase to $460,000 in 2021 and further increase in each subsequent year of the projection period to $660,000 in 2024.
Tax Provision – Estimated at 15.42% of pretax income in 2018, as the Company utilizes its Net Operating Loss Carry Forwards ("NOL'S"). The tax provision is projected to increase to 20.51% in 2019, 22.63% in 2020, 23.72% in 2021, 24.30% in 2022, 24.66% in 2023, 24.88% in 2024 and 24.81% in the terminal period.
Corporate Valuation Advisors, Inc.
| OLB Group, Inc. | Page 14 |
Capital Expenditures – Future capital expenditure requirements are estimated at $70,000 in 2018 and in each remaining year of the projection period.
Working Capital – Future working capital requirements of OLB are projected at 5% of the incremental increase in revenues.
The pro forma cash flow for OLB is presented as Exhibit 6 to this report and indicates a present value for the interim cash flows of $19.01 million.
The terminal value of OLB has been estimated through use of the Gordon Growth Model. This model estimates a terminal value through the capitalization of a stabilized amount that is assumed to grow annually at a constant growth rate. This model is expressed as follows:
| TV | = (Eo x (1 + g))/ (r – g) | ||
| Where: | |||
| TV | = Terminal Value | ||
| Eo | = Stabilized Earnings Stream | ||
| g | = Constant Growth Rate | ||
| r | = Discount Rate |
Assumptions required under the Gordon Growth Model include an estimate of the future stabilized earnings stream and the constant earnings growth rate. Referring to Exhibit 7, the column labeled "Terminal Period" presents the stabilized, debt-free, net cash flow stream used in our calculation. The constant growth rate is estimated at 4.0%.
Based upon a 4.0% earnings growth rate, the growth enhanced earnings stream is then capitalized into perpetuity at "r – g", or 10.5% (14.5% - 4.0%) in order to provide a terminal value of OLB at the end of 2024. The indicated future value of OLB is then discounted to present value using a 14.5% discount rate. The calculations employed to estimate the terminal value of OLB are summarized below:
| Terminal Value | ||||
| Growth Enhanced Earnings Stream | $ | 6,494,000 | ||
| Capitalization Rate @ 10.5% | .105 | |||
| Value at End of 2024 | $ | 61,848,000 | ||
| Present Value Factor @ 14.5% | 0.43360836 | |||
| Present Value of Terminal | $ | 26,818,000 | ||
Additionally, we have calculated the present value of the remaining tax depreciation benefits which extend beyond the projection period for tax purposes. The present value of these benefits are added to the present value of the sum of the seven-year interim cash flows and the present value of the terminal value in order to determine the total business enterprise value of OLB. The present value of the terminal tax depreciation benefits related to the fixed assets is indicated at $10,000.
Corporate Valuation Advisors, Inc.
| OLB Group, Inc. | Page 15 |
Adding the present value of the sum of the seven-year cash flows, the present value of the terminal and the present value of the future tax depreciation benefits results in a business enterprise value of $45.84 million for OLB, as shown below:
| Income Approach Conclusion | ||||
| Present Value of Seven-Year Cash Flows | $ | 19,009,000 | ||
| Present Value of Terminal | 26,818,000 | |||
| Present Value of Remaining Tax Depreciation Benefits | 10,000 | |||
| Business Enterprise Value | $ | 45,837,000 | ||
Conclusion
The valuation of the business enterprise of OLB has considered both the Market and Income Approaches. The guideline public company Market Approach produced mean and median business enterprise values of $45.50 million and $45.32 million, respectively. The Income Approach was based upon the use of a discounted pro forma cash flow model and produced a business enterprise value indication of $45.84 million.
We have applied equal weightings to each of the values indicated under each of the Market and Income Approaches. Based upon this weighting, we have concluded a business enterprise value of $46.00 million (rounded) for OLB. Deducting long term debt of $12.5 million and other liabilities of OLB of $87,000 results in an equity value of $33.41 million for the Company.
Corporate Valuation Advisors, Inc.
| OLB Group, Inc. | Page 16 |
VALUATION OF OMNISOFT
Financial Review
OmniSoft reports its operating results on a calendar year basis. We have been provided with the estimated income statement for the one-year period ending December 31, 2018 and the projected income statements for the two, one-year periods ending December 31, 2020, as prepared by management. We have extended the projected income statements for an additional four, one-year periods ending December 31, 2024 based upon the projected trend in revenues and earnings of OmniSoft.
The estimated 2018 through projected 2024 income statements for OmniSoft are presented as Exhibit 7 to this report.
Income Statement
Revenues are estimated at $500,000 in 2018 and are projected to increase to $2.11 million in 2019. Cost of revenues is estimated at $0 in each year.
Total operating expenses are estimated at $85,000 or 17.06% of revenues in 2018. Total operating expenses are projected at $219,000 or 10.37% of revenues in 2019.
Subtracting total operating expenses from gross profit results in EBITDA. EBITDA is estimated at $415,000 in 2018 and projected at $1.89 million in 2019.
Depreciation expense is estimated at $4,000 in 2018 and is projected to increase to $8,000 in 2019.
Subtracting depreciation expense from EBITDA results in EBIT. EBIT is estimated at $411,000 in 2018 and is projected at $1.89 million in 2019.
Valuation
Market Approach
As previously discussed, the Market Approach compares the entity being appraised with similar companies that have recently sold or with companies that are publicly traded. The value of the entity is estimated from the various multiples developed from those sales or from the comparable public companies which are then applied to the respective earnings of the subject. The primary criteria for selecting comparables include similarities in lines of business and other relevant factors such as size, profitability, leverage, growth prospects and risk.
Corporate Valuation Advisors, Inc.
| OLB Group, Inc. | Page 17 |
Sales Transactions
We conducted an investigation as to the recent acquisition of companies in the financial advisory or related industries. That investigation resulted in the identification of 12 acquisitions involving comparable companies. The identified transactions are shown on Exhibit 3 to this report. Given (i) the age of the transactions identified, (ii) the limited financial information available on the companies which sold and (iii) the wide variation of valuation multiples indicated by these transactions, we have relied primarily upon the multiples indicated by our public market analysis for purposes of determining the business enterprise value under the Market Approach.
Public Market Analysis
In valuing OmniSoft under the Market Approach, we have relied upon the same guideline companies as were used in the valuation of OLB. This information is presented as Exhibit 4 to this report.
In using the Market Approach, we have applied business enterprise multiples to the projected 2019 revenues, EBIT and EBITDA of OmniSoft.
Based upon the financial data shown on Exhibit 4 to this report, we formulated valuation multiples which we applied to the appropriate segment of the earnings stream of OmniSoft.
Multiples for each of the guideline companies are shown below:
| Market Multiples | ||||||||||||
| Guideline Company | EBIT | EBITDA | Revenues | |||||||||
| Shopify, Inc. | 2,229,672.62 | 572.00 | 19.87 | |||||||||
| Evertec, Inc. | 16.59 | 10.70 | 4.76 | |||||||||
| Square, Inc. | 81.69 | 66.90 | 6.22 | |||||||||
| First Data Corporation | 13.14 | 8.73 | 2.32 | |||||||||
| Total System Services, Inc. | 23.68 | 15.57 | 3.75 | |||||||||
| Global Payments, Inc. | 38.95 | 22.20 | 5.86 | |||||||||
| Worldpay, Inc. | 35.39 | 22.70 | 5.00 | |||||||||
| High (1) | 38.95 | 22.70 | 5.86 | |||||||||
| Low (1) | 13.14 | 8.73 | 2.32 | |||||||||
| Average (1) | 25.55 | 15.98 | 4.34 | |||||||||
(1) Excludes Shopify, Inc. and Square, Inc. due to outlier multiples.
Corporate Valuation Advisors, Inc.
| OLB Group, Inc. | Page 18 |
In applying multiples to the projected 2019 revenues, EBIT and EBITDA of OmniSoft, we have made adjustments to the EBIT and revenues multiples to reflect the differences in depreciation and amortization expense and profit margins of OmniSoft as compared to the guideline companies. The adjustments made to each multiple and a summary of the selected multiples are shown below:
| Selected Market Multiples | ||||||||||||
| EBIT | EBITDA | Revenues | ||||||||||
| Average Multiple | 25.55 | 15.98 | 4.34 | |||||||||
| Subject Earnings Ratios | ||||||||||||
| EBIT/EBITDA | 99.6 | % | ||||||||||
| EBITDA/Revenues | 89.6 | % | ||||||||||
| Guideline Average Earnings Ratios | ||||||||||||
| EBIT/EBITDA | 63.6 | % | ||||||||||
| EBITDA/Revenues | 28.7 | % | ||||||||||
| Earnings Adjustment | 63.9 | % | 100.0 | % | 312.2 | % | ||||||
| Adjusted Multiple (Rounded) | 16.30 | 16.00 | 13.55 | |||||||||
We have applied a present value factor of 0.7890 to the value indications derived under the projected 2019 approach using the 14.5% discount rate applied under the Income Approach (discussed later).
Based upon the application of the above described multiples and the present value factor, business enterprise value indications for OmniSoft range from $22.59 million to $24.25 million, as shown below:
Guideline Public Company Market Approach
| Valuation Measure ($000) | Earnings Base | Multiple Selected | Indicated Value | Present Value Factor @ 14.50% | Business Enterprise Value | |||||||||||||||
| EBIT | 1,885 | 16.30 | 30,732 | 0.7890 | 24,248 | |||||||||||||||
| EBITDA | 1,894 | 16.00 | 30,301 | 0.7890 | 23,908 | |||||||||||||||
| Revenues | 2,113 | 13.55 | 28,631 | 0.7890 | 22,591 | |||||||||||||||
The mean and median value indications are $23.58 million and $23.91 million, respectively.
Income Approach
The Income Approach is based upon a seven-year discounted cash flow projection for OmniSoft. We have been provided with the projected income statements for the three, one-year periods ending December 31, 2020, as prepared by management. We have extended the projections for an additional four, one-year periods ending December 31, 2024 based upon the projected trend in revenues and earnings of OmniSoft.
Corporate Valuation Advisors, Inc.
| OLB Group, Inc. | Page 19 |
Our estimation of the discount rate uses the same cost of capital formula which was previously discussed in connection with our valuation of OLB. The principal assumptions underlying the estimation of the discount rate for OmniSoft are as follows:
| Discount Rate Assumptions | ||||
| 20 Yr. Bond | 3.01 | % | ||
| Baa Bond | 4.74 | % | ||
| Debt% | 25.0 | % | ||
| Equity% | 75.0 | % | ||
| Tax Rate | 26.0 | % | ||
| Equity Risk Premium (ERP) | 5.97 | % | ||
| Micro Cap Risk Premium | 5.59 | % | ||
| Beta | 1.60 | |||
Based upon the above assumptions, the discount rate is estimated at 14.50%.
Key assumptions involved in our cash flow model are outlined below:
Revenues – Revenues are estimated at $500,000 in 2018. Revenues are projected to increase in each subsequent year of the projection period to $4.71 million in 2024.
Total Operating Expenses – Total operating expenses are estimated at $85,000 or 17.06% of revenues in 2018. Total operating expenses are projected to increase to $219,000 or 10.37% of revenues in 2019. Total operating expenses are projected to decrease to $205,000 or 6.99% of revenues in 2020. Total operating expenses are projected to increase in each subsequent year of the projection period to $405,000 or 8.60% of revenues in 2024.
Depreciation and Amortization Expense – Depreciation and amortization expense is estimated at $4,000 or 0.80% of revenues in 2018. Depreciation and amortization expense is projected to vary in each subsequent year of the projection period and amount to $10,000 or 0.21% of revenues in 2024.
Tax Provision – Future taxes have been projected at 26.0% of pretax income in each year of the projection period.
Capital Expenditures – Future capital expenditure requirements are estimated at $10,000 in 2018 and in each remaining year of the projection period.
Working Capital – Future working capital requirements of OmniSoft are projected at 5% of the incremental increase in revenues.
The pro forma cash flow for OmniSoft is presented as Exhibit 7 to this report and indicates a present value for the interim cash flows of $8.83 million.
Corporate Valuation Advisors, Inc.
| OLB Group, Inc. | Page 20 |
We again utilized the Gordon Growth Model assuming a 4.0% terminal growth rate in order to estimate the terminal value of OmniSoft. Based upon a 4.0% earnings growth rate, the growth enhanced earnings stream is then capitalized into perpetuity at "r – g", or 10.5% (14.5% - 4.0%) in order to provide a terminal value of OmniSoft at the end of 2024. The indicated future value of OmniSoft is then discounted to present value using a 14.5% discount rate. The calculations employed to estimate the terminal value of OmniSoft are summarized below:
| Terminal Value | ||||
| Growth Enhanced Earnings Stream | $ | 3,013,000 | ||
| Capitalization Rate @ 10.5% | .105 | |||
| Value at End of 2024 | $ | 28,695,000 | ||
| Present Value Factor @ 14.5% | 0.43360836 | |||
| Present Value of Terminal | $ | 12,442,000 | ||
Additionally, we have calculated the present value of the remaining tax depreciation benefits which extend beyond the projection period for tax purposes. The present value of these benefits are added to the present value of the sum of the seven-year interim cash flows and the present value of the terminal value in order to determine the total business enterprise value of OmniSoft. The present value of the terminal tax depreciation benefits related to the fixed assets is indicated at $1,000.
Adding the present value of the sum of the seven-year cash flows, the present value of the terminal and the present value of the future tax depreciation benefits results in a business enterprise value of $21.27 million for OmniSoft, as shown below:
| Income Approach Conclusion | ||||
| Present Value of Seven-Year Cash Flows | $ | 8,828,000 | ||
| Present Value of Terminal | 12,442,000 | |||
| Present Value of Remaining Tax Depreciation Benefits | 1,000 | |||
| Business Enterprise Value | $ | 21,272,000 | ||
Conclusion
The valuation of the business enterprise of OmniSoft has considered both the Market and Income Approaches. The guideline public company Market Approach produced mean and median business enterprise values of $23.58 million and $23.91 million, respectively. The Income Approach was based upon the use of a discounted pro forma cash flow model and produced a business enterprise value indication of $21.27 million.
We have applied equal weightings of 50% to each of the values indicated under each of the Market and Income Approaches. Based upon this weighting, we have concluded a business enterprise value of $22.00 million (rounded) for OmniSoft.
Corporate Valuation Advisors, Inc.
| OLB Group, Inc. | Page 21 |
CROWDPAY VALUATION
Financial Review
CrowdPay reports its operating results on a calendar year basis. We have been provided with the estimated income statement for the one-year period ending December 31, 2018 and the projected income statements for the two, one-year periods ending December 31, 2020, as prepared by management. We have extended the projected income statements for an additional four, one-year periods ending December 31, 2024 based upon the projected trend in net sales and earnings of CrowdPay.
The estimated 2018 through projected 2024 income statements for CrowdPay are presented as Exhibit 8 to this report.
Income Statement
Revenues are estimated at $1.50 million in 2018 and are projected to increase to $4.77 million in 2019.
Cost of revenues are estimated at $523,000 in 2018 and are projected to increase to $1.67 million in 2019.
Subtracting cost of revenues from revenues results in gross profit. Gross profit is estimated at $972,000 in 2018 and is projected at $3.10 million in 2019.
Total operating expenses are estimated at $255,000 or 17.06% of revenues in 2018. Total operating expenses are projected at $495,000 or 10.37% of revenues in 2019.
Subtracting total operating expenses from gross profit results in EBITDA. EBITDA is estimated at $717,000 in 2018 and projected at $2.60 million in 2019.
Depreciation expense is estimated at $8,000 in 2018 and is projected to increase to $17,000 in 2019.
Subtracting depreciation expense from EBITDA results in EBIT. EBIT is estimated at $709,000 in 2018 and is projected at $2.59 million in 2019.
Valuation
Market Approach
As previously discussed, the Market Approach compares the entity being appraised with similar companies that have recently sold or with companies that are publicly traded. The value of the entity is estimated from the various multiples developed from those sales or from the comparable public companies which are then applied to the respective earnings of the subject. The primary criteria for selecting comparables include similarities in lines of business and other relevant factors such as size, profitability, leverage, growth prospects and risk.
Corporate Valuation Advisors, Inc.
| OLB Group, Inc. | Page 22 |
Sales Transactions
We conducted an investigation as to the recent acquisition of companies in the financial advisory or related industries. That investigation resulted in the identification of 12 acquisitions involving comparable companies. The identified transactions are shown on Exhibit 3 to this report. Given (i) the age of the transactions identified, (ii) the limited financial information available on the companies which sold and (iii) the wide variation of valuation multiples indicated by these transactions, we have relied primarily upon the multiples indicated by our public market analysis for purposes of determining the business enterprise value under the Market Approach.
Public Market Analysis
In valuing CrowdPay under the Market Approach, we have relied upon the same guideline companies as were used in the valuation of each of OLB and OmniSoft. This information is presented as Exhibit 4 to this report.
Based upon the financial data shown on Exhibit 4 to this report, we formulated valuation multiples which we applied to the appropriate segment of the earnings stream of CrowdPay.
Multiples for each of the guideline companies are shown below:
| Market Multiples | ||||||||||||
| Guideline Company | EBIT | EBITDA | Revenues | |||||||||
| Shopify, Inc. | 2,229,672.62 | 572.00 | 19.87 | |||||||||
| Evertec, Inc. | 16.59 | 10.70 | 4.76 | |||||||||
| Square, Inc. | 81.69 | 66.90 | 6.22 | |||||||||
| First Data Corporation | 13.14 | 8.73 | 2.32 | |||||||||
| Total System Services, Inc. | 23.68 | 15.57 | 3.75 | |||||||||
| Global Payments, Inc. | 38.95 | 22.20 | 5.86 | |||||||||
| Worldpay, Inc. | 35.39 | 22.70 | 5.00 | |||||||||
| High (1) | 38.95 | 22.70 | 5.86 | |||||||||
| Low (1) | 13.14 | 8.73 | 2.32 | |||||||||
| Average (1) | 25.55 | 15.98 | 4.34 | |||||||||
(1) Excludes Shopify, Inc. and Square, Inc. due to outlier multiples.
Corporate Valuation Advisors, Inc.
| OLB Group, Inc. | Page 23 |
In applying multiples to the projected 2019 revenues, EBIT and EBITDA of OmniSoft, we have made adjustments to the EBIT and revenues multiples to reflect the differences in depreciation and amortization expense and profit margins of CrowdPay as compared to the guideline companies. The adjustments made to each multiple and a summary of the selected multiples are shown below:
| Selected Market Multiples | ||||||||||||
| EBIT | EBITDA | Revenues | ||||||||||
| Adjusted Multiple | 25.55 | 15.98 | 4.34 | |||||||||
| Subject Earnings Ratios | ||||||||||||
| EBIT/EBITDA | 99.4 | % | ||||||||||
| EBITDA/Revenues | 54.6 | % | ||||||||||
| Guideline Average Earnings Ratios | ||||||||||||
| EBIT/EBITDA | 63.6 | % | ||||||||||
| EBITDA/Revenues | 28.7 | % | ||||||||||
| Earnings Adjustment | 64.0 | % | 100.0 | % | 190.3 | % | ||||||
| Adjusted Multiple (Rounded) | 16.50 | 16.00 | 8.25 | |||||||||
We have applied a present value factor of 0.7890 to the value indications derived under the projected 2019 approach using the 14.5% discount rate applied under the Income Approach (discussed later in this report).
Based upon the application of the above described multiples and the present value factor, business enterprise value indications for CrowdPay range from $31.03 million to $33.69 million, as shown below:
Guideline Public Company Market Approach
| Valuation Measure ($000) | Earnings Base | Multiple Selected | Indicated Value | Present Value Factor @ 14.50% | Business Enterprise Value | |||||||||||||||
| EBIT | 2,588 | 16.50 | 42,696 | 0.7890 | 33,688 | |||||||||||||||
| EBITDA | 2,604 | 16.00 | 41,671 | 0.7890 | 32,880 | |||||||||||||||
| Revenues | 4,767 | 8.25 | 39,328 | 0.7890 | 31,031 | |||||||||||||||
The mean and median value indications are $32.53 million and $32.88 million, respectively.
Corporate Valuation Advisors, Inc.
| OLB Group, Inc. | Page 24 |
Income Approach
The Income Approach is based upon a seven-year discounted cash flow projection for CrowdPay. We have been provided with the projected income statements for the three, one-year periods ending December 31, 2020, as prepared by management. We have extended the projections for an additional four, one-year periods ending December 31, 2024 based upon the projected trend in revenues and earnings of CrowdPay. Our estimation of the discount rate uses the same cost of capital formula which was previously discussed in connection with our valuation of OLB. The principal assumptions underlying the estimation of the discount rate for CrowdPay are as follows:
| Discount Rate Assumptions | ||||
| 20 Yr. Bond | 3.01 | % | ||
| Baa Bond | 4.74 | % | ||
| Debt% | 25.0 | % | ||
| Equity% | 75.0 | % | ||
| Tax Rate | 26.0 | % | ||
| Equity Risk Premium (ERP) | 5.97 | % | ||
| Micro Cap Risk Premium | 5.59 | % | ||
| Beta | 1.60 | |||
Based upon the above assumptions, the discount rate is estimated at 14.50%.
Key assumptions involved in our cash flow model are outlined below:
Revenues – Revenues are estimated at $1.50 million in 2018. Revenues are projected to increase in each subsequent year of the projection period to $12.37 million in 2024.
Cost of Revenues – Cost of revenues is estimated at $523,000 or 34.98% of revenues in 2018. Cost of revenues is projected to increase in each subsequent year of the projection period to $4.00 million or 32.33% of revenues in 2024.
Total Operating Expenses – Total operating expenses are estimated at $255,000 or 17.06% of revenues in 2018. Total operating expenses are projected to increase to $495,000 or 10.37% of revenues in 2019 and decrease to $439,000 or 6.99% of revenues in 2020. Total operating expenses are projected to increase in each subsequent year of the projection period to $866,000 or 7.00% of revenues in 2024.
Depreciation and Amortization Expense – Depreciation and amortization expense is estimated at $8,000 or 0.54% of revenues in 2018. Depreciation and amortization expense is projected to vary in each subsequent year of the projection period and amount to $20,000 or 0.16% of revenues in 2024.
Tax Provision – Future taxes have been projected at 26.0% of pretax income in each year of the projection period.
Capital Expenditures – Future capital expenditure requirements are estimated at $20,000 in 2018 and in each remaining year of the projection period.
Working Capital – Future working capital requirements of CrowdPay are projected at 5% of the incremental increase in revenues.
The pro forma cash flow for CrowdPay is presented as Exhibit 8 to this report and indicates a present value for the interim cash flows of $13.20 million.
Corporate Valuation Advisors, Inc.
| OLB Group, Inc. | Page 25 |
We again utilized the Gordon Growth Model assuming a 4.0% terminal growth rate to estimate the terminal value of CrowdPay. Based upon a 4.0% earnings growth rate, the growth enhanced earnings stream is then capitalized into perpetuity at "r – g", or 10.5% (14.5% - 4.0%) in order to provide a terminal value of CrowdPay at the end of 2024. The indicated future value of CrowdPay is then discounted to present value using a 14.5% discount rate. The calculations employed to estimate the terminal value of CrowdPay are summarized below:
| Terminal Value | ||||
| Growth Enhanced Earnings Stream | $ | 5,870,000 | ||
| Capitalization Rate @ 10.5% | .105 | |||
| Value at End of 2024 | $ | 55,905,000 | ||
| Present Value Factor @ 14.5% | 0.43360836 | |||
| Present Value of Terminal | $ | 24,241,000 | ||
Additionally, we have calculated the present value of the remaining tax depreciation benefits which extend beyond the projection period for tax purposes. The present value of these benefits are added to the present value of the sum of the seven-year interim cash flows and the present value of the terminal value in order to determine the total business enterprise value of CrowdPay. The present value of the terminal tax depreciation benefits related to the fixed assets is indicated at $3,000.
Adding the present value of the sum of the seven-year cash flows, the present value of the terminal and the present value of the future tax depreciation benefits results in a business enterprise value of $37.44 million for CrowdPay, as shown below:
| Income Approach Conclusion | ||||
| Present Value of Seven-Year Cash Flows | $ | 13,197,000 | ||
| Present Value of Terminal | 24,241,000 | |||
| Present Value of Remaining Tax Depreciation Benefits | 3,000 | |||
| Business Enterprise Value | $ | 37,441,000 | ||
Conclusion
The valuation of the business enterprise of CrowdPay has considered both the Market and Income Approaches. The guideline public company Market Approach produced mean and median business enterprise values of $32.53 million and $32.88 million, respectively. The Income Approach was based upon the use of a discounted pro forma cash flow model and produced a business enterprise value indication of $37.44 million.
We have applied equal weightings of 50% to each of the values indicated under each of the Market and Income Approaches. Based upon this weighting, we have concluded a business enterprise value of $35.00 million (rounded) for CrowdPay.
Corporate Valuation Advisors, Inc.
| OLB Group, Inc. | Page 26 |
MERGER CONSIDERATION AND DILUTION
The current equity value of OLB is estimated at $7.93 million based upon the 19,825,364 common shares of OLB outstanding on April 30, 2018 and its recent trading price of $.40 per share, as follows:
| Indicated Value Per Share | ||||
| Recent Share Trading Price | $ | .40 | ||
| Shares Outstanding | 19,825,364 | |||
| Total Equity Value of OLB | $ | 7,930,146 | ||
Dividing the equity values of OmniSoft and CrowdPay by the per share value of the Company’s common stock results in a total of 142.5 million shares of OLB as the fair merger consideration to the shareholders of OmniSoft and CrowdPay, as shown below:
| Merger Consideration | ||||||||||||
Equity Value | Share Price | Number of Shares | ||||||||||
| OminSoft | $ | 22,000,000 | .40 | 55,000,000 | ||||||||
| CrowdPay | 35,000,000 | .40 | 87,500,000 | |||||||||
| Total Merger Consideration | $ | 57,000,000 | 142,500,000 | |||||||||
Additional dilution will occur in the shares of OLB in connection with (i) its intention to raise $5.0 million of equity capital and (ii) certain warrants granted in connection with the $12.5 million line of credit. Dilution associated with capital raise is estimated at 12.5 million shares at the current trading price and the warrant allows for the purchase of up to 1.20 million common shares of OLB. Accordingly, the number of common shares expected to be outstanding following the mergers of OmniSoft and CrowdPay, the raising of $5.00 million of equity and the exercise of the warrants is indicated at approximately 176.03 million common shares, determined as follows:
| Pro Forma Fully Diluted Shares | ||||
| Shares | ||||
| Outstanding | 19,825,364 | |||
| New Equity | 12,500,000 | |||
| Warrants | 1,200,000 | |||
| Merger Consideration for Technology Companies | 142,500,000 | |||
| Pro Forma Fully Diluted Shares | 176,025,364 | |||
CONCLUSION
The purpose of this valuation has been to set forth our opinion of the Fair Market Value of the total equity of each of OLB, OmniSoft and CrowdPay.
The Fair Market Value of the total equity of each of OLB, OmniSoft and CrowdPay considered the Market and Income Approaches. A summary of the value indications under the two approaches, their business enterprise values and their total equity values are shown below:
Valuation Summary
| ($000) | Market Approach | Income Approach | Business Enterprise Value | Equity Value | ||||||||||||
| OLB/Excel | 45,500 | 45,837 | 46,000 | 33,413 | ||||||||||||
| OmniSoft | 23,582 | 21,272 | 22,000 | 22,000 | ||||||||||||
| CrowdPay | 32,533 | 37,441 | 35,000 | 35,000 | ||||||||||||
| Total Value | 103,000 | 90,413 |
Corporate Valuation Advisors, Inc.
LIMITING FACTORS AND ASSUMPTIONS
In accordance with recognized professional ethics, the professional fee for this service is not contingent upon our conclusion of value.
The opinion of value expressed herein is valid only for the stated purpose as of the date of the appraisal.
Financial statements and other related information provided by the subject Company or its representatives in the course of this investigation have been accepted, without further verification, as fully and correctly reflecting the Company's business conditions and operating results for the respective periods, except as specifically noted herein.
Public information and industry and statistical information has been obtained from sources we deem to be reliable; however, we make no representation as to the accuracy or completeness of such information, and have accepted the information without further verification.
The conclusions of value are based upon the assumption that the current level of management expertise and effectiveness would continue to be maintained and that the character and integrity of the enterprise through any sale, reorganization, exchange, or diminution of the owner's participation would not be materially or significantly changed.
This report and the conclusions arrived at herein are for the exclusive use of our client for the sole and specific purposes as noted herein. Furthermore, the report and conclusions are not intended by the author, and should not be construed by the reader, to be investment advice in any manner whatsoever. The conclusions reached herein represent the considered opinion of CORPORATE VALUATION ADVISORS, INC., based upon information furnished to them by the Company and other sources.
Neither all nor any part of the contents of this report (especially any conclusions as to value, the identity of any appraiser or appraisers, or the firm with which such appraisers are connected, or any reference to any of their professional designations) should be disseminated to the public through advertising media, public relations, news media, sales media, mail, direct transmittal, or any other public means of communications, without the prior written consent and approval of CORPORATE VALUATION ADVISORS, INC.
It is expressly stated that the scope of our appraisal did not include any investigation of any environmental matters or the negative impact on value which may exist as a result of any existing or future actions brought by any third party relating to such matters.
Corporate Valuation Advisors, Inc.
APPRAISAL CERTIFICATE
I certify that, to the best of my knowledge and belief:
| ● | The statements of fact contained in this report are true and correct. |
| ● | The report analyses, opinions and conclusions are limited only by the reported assumptions and limiting conditions, and are my personal, unbiased professional analyses, opinions and conclusions. |
| ● | I have no present or prospective interest in the property that is the subject of this report, and I have no personal interest with respect to the parties involved. |
| ● | I have performed prior valuation services regarding the property that is the subject of this report within the past three years immediately preceding this assignment. |
| ● | I have no bias with respect to the property that is the subject of this report or to the parties involved with this assignment. |
| ● | My engagement in this assignment was not contingent upon developing or reporting predetermined results. |
| ● | My compensation for completing this assignment is not contingent upon the reporting of a predetermined value or direction in value that favors the cause of the client, the amount of the value opinion, the attainment of a stipulated result, or the occurrence of a subsequent event directly related to the intended use of this appraisal. |
| ● | My analyses, opinions and conclusions were developed, and this report has been prepared, in conformity with the Uniform Standards of Professional Appraisal Practice. |
| ● | I have not made a personal inspection of the property that is the subject of this report. |
| ● | Brad Carlson, ASA, BV/IA, Erik M. Faber and Fred W. Lindenstruth provided significant business and/or intangible asset appraisal assistance to the person signing this certification. |
| /s/ James W. Volkman | ||
| James W. Volkman, AM | ||
| Date: 5/8/18 |
Corporate Valuation Advisors, Inc.
Professional Qualifications
Corporate Valuation Advisors, Inc.
James W. Volkman, AM Managing Director Corporate Valuation Advisors, Inc. jvolkman@corporatevaluationadvisors.com
| |
Professional Experience
1988-Present
1986-1988
1978 to 1986
|
Founder, Managing Director and Principal Shareholder, Corporate Valuation Advisors, Inc.
Manager, Strategis Asset Valuation & Management Company, Inc.
Assistant Vice President, Valuation Research Corporation
|
Academic Credentials |
University of Wisconsin
Bachelor of Science Degree Master Degree in Finance |
| Accreditations | Accredited Member of the American Society of Appraisers ("AM") designated in Business Valuation |
Professional Experience |
Considerable experience in the following areas:
● Fairness Opinions ● Solvency Opinions ● Restructurings and Recapitalizations ● Intellectual Property ● Stock, Options and Other Equity Securities ● Estate Planning |
Corporate Valuation Advisors, Inc.
Exhibits
Corporate Valuation Advisors, Inc.
Exhibit 1
OLB Group, Inc./Excel Corporation
Pro Forma Comparative Income Statements
For Years Ending December 31,
($000)
| Estimated | ||||||||||||||||||||||||||||||||||||||||
| 2018 | 2018 | 2017 | 2017 | 2016 | 2016 | 2015 | 2015 | 2014 | 2014 | |||||||||||||||||||||||||||||||
| (%) | (%) | (%) | (%) | (%) | ||||||||||||||||||||||||||||||||||||
| Revenues | 14,181 | 100.0 | 14,900 | 100.0 | 17,115 | 100.0 | 5,629 | 100.0 | 9,565 | 100.0 | ||||||||||||||||||||||||||||||
| Cost of Revenues | 8,976 | 63.3 | 5,513 | 37.0 | 0 | 0.0 | 0 | 0.0 | 1,422 | 14.9 | ||||||||||||||||||||||||||||||
| Gross Profit | 5,205 | 36.7 | 9,387 | 63.0 | 17,115 | 100.0 | 5,629 | 100.0 | 8,143 | 85.1 | ||||||||||||||||||||||||||||||
| Total Operating Expense | 2,419 | 17.1 | 6,487 | 43.5 | 13,807 | 80.7 | 3,482 | 61.9 | 11,088 | 115.9 | ||||||||||||||||||||||||||||||
| EBITDA | 2,786 | 19.6 | 2,900 | 19.5 | 3,308 | 19.3 | 2,147 | 38.1 | (2,945 | ) | -30.8 | |||||||||||||||||||||||||||||
| Depreciation | 438 | 0.5 | 500 | 3.4 | 485 | 2.8 | 143 | 2.5 | 76 | 0.8 | ||||||||||||||||||||||||||||||
| Amortization | 0 | 0.0 | 0 | 0.0 | 0 | 0.0 | 0 | 0.0 | 0 | 0.0 | ||||||||||||||||||||||||||||||
| EBIT | 2,348 | 19.1 | 2,400 | 16.1 | 2,823 | 16.5 | 2,004 | 35.6 | (3,021 | ) | -31.6 | |||||||||||||||||||||||||||||
Exhibit 2
OLB Group, Inc./Excel Corporation
Pro Forma Balance Sheet
As of April 30, 2018
($000)
| Omnisoft & | ||||||||||||||||||||||||
| OLB Grp.* | Excel | Crowdpay | Financing** | Combined | ||||||||||||||||||||
| (%) | ||||||||||||||||||||||||
| Assets | ||||||||||||||||||||||||
| Current Assets | ||||||||||||||||||||||||
| Cash & Cash Equivalents | 1 | 0 | 0 | 1,500 | 1,501 | 10.35 | ||||||||||||||||||
| Accounts Receivable | 0 | 0 | 0 | 0 | 0 | 0.00 | ||||||||||||||||||
| Inventories | 0 | 0 | 0 | 0 | 0 | 0.00 | ||||||||||||||||||
| Prepaid Expenses & Other Current Assets | 0 | 0 | 0 | 0 | 0 | 0.00 | ||||||||||||||||||
| Total Current Assets | 1 | 0 | 0 | 1,500 | 1,501 | 10.35 | ||||||||||||||||||
| Net Property & Equipment | 0 | 100 | 0 | 0 | 100 | 0.69 | ||||||||||||||||||
| Goodwill/Customer Relationships | 0 | 12,400 | 0 | 0 | 12,400 | 85.48 | ||||||||||||||||||
| Intangibles - Software | 5 | 0 | 0 | 0 | 5 | 0.03 | ||||||||||||||||||
| Deposits & Other Assets | 0 | 0 | 0 | 500 | 500 | 3.45 | ||||||||||||||||||
| Total Assets | 6 | 12,500 | 0 | 2,000 | 14,506 | 100.00 | ||||||||||||||||||
| Liabilities & Stockholders' Equity | ||||||||||||||||||||||||
| Current Liabilities | ||||||||||||||||||||||||
| Notes Payable | 0 | 0 | 0 | 0 | 0 | 0.00 | ||||||||||||||||||
| Capital Leases | 0 | 0 | 0 | 0 | 0 | 0.00 | ||||||||||||||||||
| Accounts Payable | 90 | 0 | 0 | 0 | 90 | 0.62 | ||||||||||||||||||
| Interest Rate Swap | 0 | 0 | 0 | 0 | 0 | 0.00 | ||||||||||||||||||
| Accrued Expenses & Other Current Liabilities | 3 | 0 | 0 | 0 | 3 | 0.02 | ||||||||||||||||||
| Total Current Liabilities | 93 | 0 | 0 | 0 | 93 | 0.64 | ||||||||||||||||||
| Long-Term Debt | 0 | 12,500 | 0 | (3,000 | ) | 9,500 | 65.49 | |||||||||||||||||
| Revolver | 0 | 0 | 0 | 0 | 0 | 0.00 | ||||||||||||||||||
| Deferred Income Taxes | 0 | 0 | 0 | 0 | 0 | 0.00 | ||||||||||||||||||
| Long-Term Capital Leases | 0 | 0 | 0 | 0 | 0 | 0.00 | ||||||||||||||||||
| Total Liabilities | 93 | 12,500 | 0 | (3,000 | ) | 9,593 | 66.13 | |||||||||||||||||
| Total Stockholders' Equity | (87 | ) | 0 | 0 | 5,000 | 4,913 | 33.87 | |||||||||||||||||
| Total Liabilities & Stockholders' Equity | 6 | 12,500 | 0 | 2,000 | 14,506 | 100.00 | ||||||||||||||||||
| Net Working Capital (Excluding Current Debt) | (92 | ) | 1,500 | 1,408 | 9.71 | |||||||||||||||||||
| * | As of December 31, 2017 |
| ** | $5 million equity raise and $9.5 million net debt. |
Exhibit 3
OLB Group, Inc.
Financial Advisory Transactions
As of April 30, 2018
| Purchase | Total | |||||||||||||||||||||||||||||
| Buyer | Target | Date | Description | Price | Revenues | EBITDA | EBIT | Merchants | Assets | |||||||||||||||||||||
| TSYS | Cayan | 12/18/2017 | Provides end-to-end cloud-commerce, payments and marketing solutions to over 70,000 merchants. | $ | 1,050,000,000 | N/A | N/A | N/A | 70,000 | N/A | ||||||||||||||||||||
| Indicated Multiples | N/A | N/A | N/A | 15,000 | N/A | |||||||||||||||||||||||||
| Earnings | N/A | N/A | ||||||||||||||||||||||||||||
| First Data | BluePay | 12/1/2017 | Provider of technology-enabled payment processing for merchants in the U.S. and Canada. | $ | 759,000,000 | N/A | N/A | N/A | 77,000 | N/A | ||||||||||||||||||||
| Indicated Multiples | N/A | N/A | N/A | 9,857 | N/A | |||||||||||||||||||||||||
| Earnings | N/A | N/A | ||||||||||||||||||||||||||||
| Vantiv | Worldpay Group plc | 8/14/2017 | Provides end-to-end cloud-commerce, payments and marketing solutions to businesses. | $ | 10,200,000,000 | $ | 1,449,960,000 | $ | 603,720,000 | $ | 502,068,000 | 400,000 | $ | 5,205,150,000 | ||||||||||||||||
| Indicated Multiples | 7.03 | 16.90 | 20.32 | 25,500 | 1.96 | |||||||||||||||||||||||||
| Earnings | 41.64 | % | 11.60 | % | ||||||||||||||||||||||||||
| Paysafe | Merchants' Choice Payment Solutions | 7/28/2017 | Provides end-to-end cloud-commerce, payments and marketing solutions to businesses. | $ | 470,000,000 | $ | 157,000,000 | $ | 38,000,000 | N/A | 60,000 | N/A | ||||||||||||||||||
| Indicated Multiples | 2.99 | 12.37 | N/A | 7,833 | N/A | |||||||||||||||||||||||||
| Earnings | 24.20 | % | N/A | |||||||||||||||||||||||||||
| First Data | Cardconnect | 5/29/2017 | Provides end-to-end cloud-commerce, payments and marketing solutions to businesses. | $ | 438,000,000 | $ | 156,502,000 | $ | 15,315,000 | ($ | 7,009,000 | ) | 67,000 | $ | 167,848,523 | |||||||||||||||
| Indicated Multiples | 2.80 | 28.60 | N/A | 6,537 | 2.61 | |||||||||||||||||||||||||
| Earnings | 9.79 | % | 9.12 | % | ||||||||||||||||||||||||||
| TSYS | Trans First | 2/26/2016 | Provides payment technology solutions to approximately 235,000 merchants. | $ | 2,350,000,000 | $ | 294,000,000 | $ | 151,000,000 | N/A | 235,000 | N/A | ||||||||||||||||||
| Indicated Multiples | 7.99 | 15.56 | N/A | 10,000 | N/A | |||||||||||||||||||||||||
| Earnings | 51.36 | % | N/A | |||||||||||||||||||||||||||
| Global Payments | Heartland | 4/25/2016 | Provides card payment processing and related services to SME merchants and Network service merchants. | $ | 4,200,000,000 | $ | 797,000,000 | $ | 202,000,000 | $ | 156,683,000 | 185,720 | $ | 1,536,000,000 | ||||||||||||||||
| Indicated Multiples | 5.27 | 20.79 | 26.81 | 22,615 | 2.73 | |||||||||||||||||||||||||
| Earnings | 25.35 | % | 13.15 | % | ||||||||||||||||||||||||||
| Siris Capital Group, LLC | Digital River, Inc. | 2/12/2015 | Provides end-to-end cloud-commerce, payments and marketing solutions to businesses. | $ | 840,000,000 | $ | 389,679,000 | $ | 380,000 | ($ | 30,326,000 | ) | 17,000 | $ | 734,378,000 | |||||||||||||||
| Indicated Multiples | 2.16 | N/A | N/A | 49,412 | 1.14 | |||||||||||||||||||||||||
| Earnings | 0.10 | % | 0.05 | % | ||||||||||||||||||||||||||
| FleetCor Technologies, Inc. | Comdata Inc. | 11/14/2014 | Provides virtual and car-based credit, debit, and stored-value solutions. | $ | 3,420,275,000 | $ | 581,000,000 | $ | 139,900,000 | $ | 74,400,000 | N/A | $ | 2,882,800,000 | ||||||||||||||||
| Indicated Multiples | 5.89 | 24.45 | 45.97 | N/A | 1.19 | |||||||||||||||||||||||||
| Earnings | 24.08 | % | 4.85 | % | ||||||||||||||||||||||||||
| Syniverse Holdings, Inc. | WP Roaming III | 6/28/2013 | Provides clearinghouse, fraud, business intelligence and professional services. | $ | 701,363,000 | $ | 175,619,000 | $ | 53,510,000 | $ | 22,409,000 | N/A | $ | 533,993,000 | ||||||||||||||||
| Indicated Multiples | 3.99 | 13.11 | 31.30 | N/A | 1.31 | |||||||||||||||||||||||||
| Earnings | 30.47 | % | 10.02 | % | ||||||||||||||||||||||||||
| Digital River, Inc. | LML Payment Systems, Inc. | 1/10/2013 | Provides financial payment processing solutions for e-commerce and traditional businesses. | $ | 97,451,059 | $ | 34,916,802 | N/A | $ | 10,852,530 | 13,000 | $ | 68,419,305 | |||||||||||||||||
| Indicated Multiples | 2.79 | N/A | 8.98 | 7,496 | 1.42 | |||||||||||||||||||||||||
| Earnings | N/A | N/A | ||||||||||||||||||||||||||||
| N/A | T-Chek Systems, Inc. | 10/16/2012 | Provides business to business spend management and payment processing services. | $ | 302,500,000 | $ | 49,260,000 | N/A | $ | 24,569,000 | N/A | $ | 191,814,000 | |||||||||||||||||
| Indicated Multiples | 6.14 | N/A | 12.31 | N/A | 1.58 | |||||||||||||||||||||||||
| Earnings | N/A | N/A | ||||||||||||||||||||||||||||
| Mean | 4.71 | 18.82 | 24.28 | 17,139 | 1.74 | |||||||||||||||||||||||||
| Median | 4.63 | 16.90 | 23.56 | 10,000 | 1.50 | |||||||||||||||||||||||||
| High | 7.99 | 28.60 | 45.97 | 49,412 | 2.73 | |||||||||||||||||||||||||
| Low | 2.16 | 12.37 | 8.98 | 6,537 | 1.14 | |||||||||||||||||||||||||
Exhibit 4
OLB Group, Inc./Excel Corporation
Guideline Company Market Data
As of April 30, 2018
($000)
| Total | ||||||||||||||||||||||||||||||||||||
| First | System | Global | Guideline | |||||||||||||||||||||||||||||||||
| Shopify, | Evertec, | Square, | Data | Services, | Payments, | Worldpay, | Company | |||||||||||||||||||||||||||||
| Inc. | Inc. | Inc. | Corporation | Inc. | Inc. | Inc. | Composite | |||||||||||||||||||||||||||||
| Exchange/Symbol | Toronto: SHOP | NYSE: EVTC | NYSE: SQ | NYSE: FDC | NYSE: TSS | NYSE: GPN | NYSE: WP | Pro Forma | ||||||||||||||||||||||||||||
| TTM Ending | 31-Dec-17 | 31-Dec-17 | 31-Dec-17 | 31-Dec-17 | 31-Dec-17 | 31-Dec-17 | 31-Dec-17 | 2017 | ||||||||||||||||||||||||||||
| Price @ 4/30/2018 | $ | 133.94 | $ | 18.25 | $ | 47.34 | $ | 18.10 | $ | 84.06 | $ | 113.05 | $ | 81.22 | $ | 58.03 | ||||||||||||||||||||
| Shares Outstanding (000) | 99,878 | 72,429 | 283,432 | 482,944 | 181,726 | 159,206 | 177,849 | 1,457,464 | ||||||||||||||||||||||||||||
| Minority Value Indication | 13,378,036 | 1,321,832 | 13,417,672 | 8,741,295 | 15,275,851 | 17,998,223 | 14,444,880 | 84,577,789 | ||||||||||||||||||||||||||||
| Control Premium @ 0% | 0 | 0 | 0 | 0 | 0 | 0 | 0 | 0 | ||||||||||||||||||||||||||||
| Preferred Stock | 0 | 0 | 0 | 0 | 0 | 0 | 0 | 0 | ||||||||||||||||||||||||||||
| Market Value of Total Equity | 13,378,036 | 1,321,832 | 13,417,672 | 8,741,295 | 15,275,851 | 17,998,223 | 14,444,880 | 84,577,789 | ||||||||||||||||||||||||||||
| Preferred Stock | 0 | 0 | 0 | 0 | 0 | 0 | 0 | 0 | ||||||||||||||||||||||||||||
| Interest Bearing Debt | 0 | 615,738 | 358,572 | 19,198,000 | 3,193,814 | 5,294,882 | 5,706,745 | 34,367,751 | 9,500 | |||||||||||||||||||||||||||
| Business Enterprise Value | 13,378,036 | 1,937,570 | 13,776,244 | 27,939,295 | 18,469,665 | 23,293,105 | 20,151,625 | 118,945,540 | ||||||||||||||||||||||||||||
| Revenues | 673,304 | 407,144 | 2,214,253 | 12,052,000 | 4,927,965 | 3,975,163 | 4,026,477 | 28,276,306 | 14,900 | |||||||||||||||||||||||||||
| Cost of Revenues | 293,051 | 200,650 | 1,374,947 | 3,122,000 | 3,577,320 | 1,928,037 | 0 | 10,496,005 | 5,513 | |||||||||||||||||||||||||||
| Gross Profit | 380,253 | 206,494 | 839,306 | 8,930,000 | 1,350,645 | 2,047,126 | 4,026,477 | 17,780,301 | 9,387 | |||||||||||||||||||||||||||
| EBITDA | 23,388 | 181,058 | 205,927 | 3,200,000 | 1,185,964 | 1,049,114 | 887,895 | 6,733,346 | 2,900 | |||||||||||||||||||||||||||
| Depreciation & Amortization | 23,382 | 64,250 | 37,279 | 1,073,000 | 405,906 | 451,151 | 318,493 | 2,373,461 | 500 | |||||||||||||||||||||||||||
| EBIT (1) | 6 | 116,808 | 168,648 | 2,127,000 | 780,058 | 597,963 | 569,402 | 4,359,885 | 2,400 | |||||||||||||||||||||||||||
| Interest Expense | 0 | 29,861 | 8,458 | 937,000 | 118,221 | 174,847 | 140,661 | 1,409,048 | 0 | |||||||||||||||||||||||||||
| EBT | 6 | 86,947 | 160,190 | 1,190,000 | 661,837 | 423,116 | 428,741 | 2,950,837 | 2,400 | |||||||||||||||||||||||||||
| Tax Rate | 0.0 | % | 7.9 | % | 0.0 | % | 16.8 | % | 10.7 | % | 20.6 | % | 33.6 | % | 17.2 | % | N/A | |||||||||||||||||||
| Net Income | 6 | 80,043 | 160,190 | 989,605 | 591,236 | 336,071 | 284,869 | 2,442,020 | N/A | |||||||||||||||||||||||||||
| Cash Flow | 23,388 | 144,293 | 197,469 | 2,062,605 | 997,142 | 787,222 | 603,362 | 4,815,481 | N/A | |||||||||||||||||||||||||||
| Cash | 938,039 | 50,423 | 866,050 | 498,000 | 450,357 | 1,335,855 | 126,503 | 4,265,227 | 1,501 | |||||||||||||||||||||||||||
| Accounts Receivable | 21,939 | 83,328 | 620,523 | 2,176,000 | 412,322 | 301,877 | 985,888 | 4,601,877 | 0 | |||||||||||||||||||||||||||
| Inventory | 0 | 0 | 0 | 0 | 0 | 0 | 0 | 0 | 0 | |||||||||||||||||||||||||||
| Current Assets | 1,025,677 | 168,706 | 1,778,294 | 23,372,000 | 1,079,244 | 4,303,579 | 1,372,612 | 33,100,112 | 1,501 | |||||||||||||||||||||||||||
| Total Assets | 1,113,564 | 902,788 | 2,187,270 | 48,269,000 | 6,331,689 | 12,998,069 | 8,666,973 | 80,469,353 | 14,506 | |||||||||||||||||||||||||||
| Accounts Payable | 62,576 | 41,135 | 16,763 | 1,659,000 | 62,310 | 1,039,607 | 622,871 | 3,504,262 | 90 | |||||||||||||||||||||||||||
| Current Liabilities (2) | 94,754 | 88,729 | 972,827 | 22,022,000 | 423,280 | 3,080,116 | 1,718,517 | 28,400,223 | 93 | |||||||||||||||||||||||||||
| Book Equity | 1,001,100 | 144,112 | 786,333 | 3,152,000 | 2,240,993 | 3,794,527 | 532,539 | 11,651,604 | 4,913 | |||||||||||||||||||||||||||
| Capital Expenditures | 20,043 | 11,290 | 26,097 | 271,000 | 70,039 | 181,905 | 110,805 | 691,179 | ||||||||||||||||||||||||||||
| Business Enterprise Value to: | Composite | Average | ||||||||||||||||||||||||||||||||||
| EBIT (3) | 2,229,672.62 | 16.59 | 81.69 | 13.14 | 23.68 | 38.95 | 35.39 | 27.28 | 25.55 | |||||||||||||||||||||||||||
| EBITDA (3) | 572.00 | 10.70 | 66.90 | 8.73 | 15.57 | 22.20 | 22.70 | 17.67 | 15.98 | |||||||||||||||||||||||||||
| Revenues (3) | 19.87 | 4.76 | 6.22 | 2.32 | 3.75 | 5.86 | 5.00 | 4.21 | 4.34 | |||||||||||||||||||||||||||
| Total Assets (3) | 12.01 | 2.15 | 6.30 | 0.58 | 2.92 | 1.79 | 2.33 | 1.48 | 1.95 | |||||||||||||||||||||||||||
| (1) | Adjustments have been made for nonrecurring items. |
| (2) | Current liabilities have been adjusted to reallocate short-term debt to total debt. |
| (3) | Shopify, Inc. and Square, Inc. removed from average due to outlier multiples. |
Exhibit 5
OLB Group, Inc./Excel Corporation
Guideline Company Financial Ratios
As of April 30, 2018
| Total | ||||||||||||||||||||||||||||||||||||||||||||
| First | System | Global | ||||||||||||||||||||||||||||||||||||||||||
| Shopify, | Evertec, | Square, | Data | Services, | Payments, | Worldpay, | Guideline | Guideline | Guideline | |||||||||||||||||||||||||||||||||||
| Inc. | Inc. | Inc. | Corporation | Inc. | Inc. | Inc. | Composite | Average | Median | OLB | ||||||||||||||||||||||||||||||||||
| Trailing Twelve Months Ending | 31-Dec-17 | 31-Dec-17 | 31-Dec-17 | 31-Dec-17 | 31-Dec-17 | 31-Dec-17 | 31-Dec-17 | PF 2017 | ||||||||||||||||||||||||||||||||||||
| Liquidity | ||||||||||||||||||||||||||||||||||||||||||||
| Current Ratio | 10.82 | 1.90 | 1.83 | 1.06 | 2.55 | 1.40 | 0.80 | 1.17 | 2.91 | 1.83 | 16.14 | |||||||||||||||||||||||||||||||||
| Quick Ratio | 10.13 | 1.51 | 1.53 | 0.12 | 2.04 | 0.53 | 0.65 | 0.31 | 2.36 | 1.51 | 16.14 | |||||||||||||||||||||||||||||||||
| Cash & Inventory/Total Assets | 84.24 | % | 5.59 | % | 39.60 | % | 1.03 | % | 7.11 | % | 10.28 | % | 1.46 | % | 5.30 | % | 21.33 | % | 7.11 | % | 10.35 | % | ||||||||||||||||||||||
| Cash & Inventory/Revenues | 139.32 | % | 12.38 | % | 39.11 | % | 4.13 | % | 9.14 | % | 33.61 | % | 3.14 | % | 15.08 | % | 34.40 | % | 12.38 | % | 10.07 | % | ||||||||||||||||||||||
| Asset Management | ||||||||||||||||||||||||||||||||||||||||||||
| Receivables Turnover | 30.69 | 4.89 | 3.57 | 5.54 | 11.95 | 13.17 | 4.08 | 6.14 | 10.56 | 5.54 | N/A | |||||||||||||||||||||||||||||||||
| Payables Turnover | 4.68 | 4.88 | 82.02 | 1.88 | 57.41 | 1.85 | 0.00 | 3.00 | 21.82 | 4.68 | 61.26 | |||||||||||||||||||||||||||||||||
| Revenues/Working Capital | 0.72 | 5.09 | 2.75 | 8.93 | 7.51 | 3.25 | (11.64 | ) | 6.02 | 2.37 | 3.25 | 10.58 | ||||||||||||||||||||||||||||||||
| Revenues/Total Assets | 0.60 | 0.45 | 1.01 | 0.25 | 0.78 | 0.31 | 0.46 | 0.35 | 0.55 | 0.46 | 1.03 | |||||||||||||||||||||||||||||||||
| Working Capital/Revenues | 138.26 | % | 19.64 | % | 36.38 | % | 11.20 | % | 13.31 | % | 30.78 | % | -8.59 | % | 16.62 | % | 34.43 | % | 19.64 | % | 9.45 | % | ||||||||||||||||||||||
| WC (Excl. Cash)/Revenues | -1.06 | % | 7.26 | % | -2.74 | % | 7.07 | % | 4.17 | % | -2.83 | % | -11.73 | % | 1.54 | % | 0.02 | % | -1.06 | % | -0.62 | % | ||||||||||||||||||||||
| Leverage/Coverage | ||||||||||||||||||||||||||||||||||||||||||||
| EBIT/Interest | N/A | 3.91 | 19.94 | 2.27 | 6.60 | 3.42 | 4.05 | 3.09 | 6.70 | 3.98 | N/A | |||||||||||||||||||||||||||||||||
| MV of Equity/MV of Invested Capital (1) | 100.00 | % | 68.22 | % | 97.40 | % | 31.29 | % | 82.71 | % | 77.27 | % | 71.68 | % | 71.11 | % | 75.51 | % | 77.27 | % | N/A | |||||||||||||||||||||||
| Debt/Total Capital | 0.00 | % | 31.78 | % | 2.60 | % | 68.71 | % | 17.29 | % | 22.73 | % | 28.32 | % | 28.89 | % | 24.49 | % | 22.73 | % | N/A | |||||||||||||||||||||||
| Return on Investment | ||||||||||||||||||||||||||||||||||||||||||||
| Pre-Tax Income/Equity | 0.00 | % | 60.33 | % | 20.37 | % | 37.75 | % | 29.53 | % | 11.15 | % | 80.51 | % | 25.33 | % | 34.24 | % | 29.53 | % | 48.85 | % | ||||||||||||||||||||||
| EBITDA/MV of Invested Capital (1) | 0.17 | % | 9.34 | % | 1.49 | % | 11.45 | % | 6.42 | % | 4.50 | % | 4.41 | % | 5.66 | % | 5.40 | % | 4.50 | % | N/A | |||||||||||||||||||||||
| EBIT/MV of Invested Capital (1) | 0.00 | % | 6.03 | % | 1.22 | % | 7.61 | % | 4.22 | % | 2.57 | % | 2.83 | % | 3.67 | % | 3.50 | % | 2.83 | % | N/A | |||||||||||||||||||||||
| Income/Expense Ratios | ||||||||||||||||||||||||||||||||||||||||||||
| EBITDA/Revenues (2) | 3.47 | % | 44.47 | % | 9.30 | % | 26.55 | % | 24.07 | % | 26.39 | % | 22.05 | % | 25.62 | % | 28.71 | % | 26.39 | % | 19.46 | % | ||||||||||||||||||||||
| EBITDA/Total Assets (2) | 2.10 | % | 20.06 | % | 9.41 | % | 6.63 | % | 18.73 | % | 8.07 | % | 10.24 | % | 8.43 | % | 12.75 | % | 10.24 | % | 19.99 | % | ||||||||||||||||||||||
| EBIT/Revenues (2) | 0.00 | % | 28.69 | % | 7.62 | % | 17.65 | % | 15.83 | % | 15.04 | % | 14.14 | % | 16.51 | % | 18.27 | % | 15.83 | % | 16.11 | % | ||||||||||||||||||||||
| EBIT/Total Assets (2) | 0.00 | % | 12.94 | % | 7.71 | % | 4.41 | % | 12.32 | % | 4.60 | % | 6.57 | % | 5.43 | % | 8.17 | % | 6.57 | % | 16.54 | % | ||||||||||||||||||||||
| EBIT/EBITDA (2) | 0.03 | % | 64.51 | % | 81.90 | % | 66.47 | % | 65.77 | % | 57.00 | % | 64.13 | % | 64.44 | % | 63.58 | % | 64.51 | % | 82.76 | % | ||||||||||||||||||||||
| Depreciation & Amort./Revenues | 3.47 | % | 15.78 | % | 1.68 | % | 8.90 | % | 8.24 | % | 11.35 | % | 7.91 | % | 8.39 | % | 8.19 | % | 8.24 | % | 3.36 | % | ||||||||||||||||||||||
| Depreciation & Amort./Total Assets | 2.10 | % | 7.12 | % | 1.70 | % | 2.22 | % | 6.41 | % | 3.47 | % | 3.67 | % | 2.95 | % | 3.81 | % | 3.47 | % | 3.45 | % | ||||||||||||||||||||||
| DuPont Analysis | ||||||||||||||||||||||||||||||||||||||||||||
| EBT/Revenues | 0.00 | % | 21.36 | % | 7.23 | % | 9.87 | % | 13.43 | % | 10.64 | % | 10.65 | % | 10.44 | % | 10.46 | % | 10.64 | % | 16.11 | % | ||||||||||||||||||||||
| Net Sales/Total Asset | 0.60 | 0.45 | 1.01 | 0.25 | 0.78 | 0.31 | 0.46 | 0.35 | 0.55 | 0.46 | 1.03 | |||||||||||||||||||||||||||||||||
| Total Assets/Equity | 1.11 | 6.26 | 2.78 | 15.31 | 2.83 | 3.43 | 16.27 | 6.91 | 6.86 | 3.43 | 2.95 | |||||||||||||||||||||||||||||||||
| 3-Year Revenues CAGR | 81.13 | % | 4.40 | % | 32.19 | % | 2.59 | % | 33.15 | % | 16.06 | % | 12.88 | % | 26.06 | % | 16.06 | % | 24.81 | % | ||||||||||||||||||||||||
| 3-Year EBITDA CAGR | N/A | 2.14 | % | 19.31 | % | 8.79 | % | 19.28 | % | 24.72 | % | 9.40 | % | 13.94 | % | 14.34 | % | N/A | ||||||||||||||||||||||||||
| 3-Year EBIT CAGR | N/A | 3.73 | % | 15.11 | % | 16.36 | % | 16.45 | % | 9.74 | % | 10.67 | % | 12.01 | % | 12.89 | % | N/A | ||||||||||||||||||||||||||
| Beta | 1.29 | 1.20 | 4.21 | 1.44 | 1.25 | 1.18 | 0.59 | 1.59 | 1.25 | |||||||||||||||||||||||||||||||||||
| (1) | Excludes Control Premium. |
Exhibit 6
OLB Group, Inc./Excel Corporation
Business Enterprise Valuation
Discounted Cash Flow Approach
As of April 30, 2018
($000)
| Terminal | ||||||||||||||||||||||||||||||||||||
| For Years Ending December 31st | 2017 | 2018 | 2019 | 2020 | 2021 | 2022 | 2023 | 2024 | Period | |||||||||||||||||||||||||||
| Revenues | ||||||||||||||||||||||||||||||||||||
| Residual Portfolio & Processing Fees | 11,556 | 13,594 | 20,984 | 27,231 | 32,677 | 37,578 | 41,336 | 42,989 | ||||||||||||||||||||||||||||
| Less Bad Debt | (274 | ) | (345 | ) | (729 | ) | (946 | ) | (1,135 | ) | (1,305 | ) | (1,436 | ) | (1,493 | ) | ||||||||||||||||||||
| OmniSoft | (1,495 | ) | (4,767 | ) | (6,281 | ) | (7,964 | ) | (9,340 | ) | (10,470 | ) | (11,295 | ) | (11,747 | ) | ||||||||||||||||||||
| CrowdPay | 1,495 | 4,767 | 6,281 | 8,151 | 9,781 | 11,248 | 12,373 | 12,868 | ||||||||||||||||||||||||||||
| Benefit Packages | 203 | 1,132 | 2,126 | 2,759 | 3,311 | 3,807 | 4,188 | 4,355 | ||||||||||||||||||||||||||||
| Acquistions | 0 | 0 | 0 | 0 | 0 | 0 | 0 | 0 | ||||||||||||||||||||||||||||
| Other | 701 | 890 | 1,542 | 2,001 | 2,401 | 2,761 | 3,038 | 3,159 | ||||||||||||||||||||||||||||
| Revenues | 12,186 | 12,186 | 15,271 | 23,923 | 31,232 | 37,694 | 43,620 | 48,203 | 50,132 | |||||||||||||||||||||||||||
| Growth Rate | 25 | % | 57 | % | 34 | % | 20 | % | 12 | % | 7 | % | 4 | % | ||||||||||||||||||||||
| Cost of Revenues | ||||||||||||||||||||||||||||||||||||
| Residual Portfolio Amort | 0 | 0 | 0 | 0 | 0 | 0 | 0 | 0 | ||||||||||||||||||||||||||||
| Interchange Fees | 5,117 | 6,419 | 10,735 | 13,650 | 16,050 | 18,090 | 19,500 | 19,870 | ||||||||||||||||||||||||||||
| Processing & Servicing | 1,081 | 1,534 | 2,926 | 3,720 | 4,370 | 4,920 | 5,300 | 5,400 | ||||||||||||||||||||||||||||
| Residual Expense | 1,935 | 2,300 | 3,283 | 4,180 | 4,920 | 5,540 | 5,970 | 6,080 | ||||||||||||||||||||||||||||
| CrowdPay Exp. | 0 | 0 | 0 | 0 | 0 | 0 | 0 | 0 | ||||||||||||||||||||||||||||
| Benefit Packages | 83 | 272 | 437 | 560 | 660 | 740 | 800 | 820 | ||||||||||||||||||||||||||||
| Acquistions | 0 | 0 | 0 | 0 | 0 | 0 | 0 | 0 | ||||||||||||||||||||||||||||
| Other Processing | 237 | 316 | 547 | 700 | 820 | 920 | 990 | 1,010 | ||||||||||||||||||||||||||||
| Cost of Revenues | 8,976 | 8,453 | 10,841 | 17,928 | 22,810 | 26,820 | 30,210 | 32,560 | 33,180 | |||||||||||||||||||||||||||
| % of revenues | 69.37 | % | 70.99 | % | 74.94 | % | 73.04 | % | 71.15 | % | 69.26 | % | 67.55 | % | 66.19 | % | ||||||||||||||||||||
| Gross Profit | (8,976 | ) | 3,733 | 4,430 | 5,995 | 8,422 | 10,874 | 13,410 | 15,643 | 16,952 | ||||||||||||||||||||||||||
| % of revenues | -73.66 | % | 30.63 | % | 29.01 | % | 25.06 | % | 26.96 | % | 28.85 | % | 30.74 | % | 32.45 | % | 33.81 | % | ||||||||||||||||||
| Total Operating Expenses | 6,487 | 2,079 | 1,584 | 1,673 | 2,173 | 2,606 | 2,996 | 3,299 | 7,446 | |||||||||||||||||||||||||||
| % of revenues | 53.23 | % | 17.06 | % | 10.37 | % | 6.99 | % | 6.96 | % | 6.91 | % | 6.87 | % | 6.84 | % | 6.84 | % | ||||||||||||||||||
| EBITDA | (15,463 | ) | 1,654 | 2,846 | 4,322 | 6,249 | 8,268 | 10,414 | 12,345 | 9,506 | ||||||||||||||||||||||||||
| % of revenues | -126.89 | % | 13.58 | % | 18.63 | % | 18.07 | % | 20.01 | % | 21.93 | % | 23.87 | % | 25.61 | % | 18.96 | % | ||||||||||||||||||
| Depreciation & Amortization | 63 | 115 | 97 | 86 | 94 | 84 | 86 | 70 | ||||||||||||||||||||||||||||
| % of revenues | 0.52 | % | 0.75 | % | 0.40 | % | 0.28 | % | 0.25 | % | 0.19 | % | 0.18 | % | 0.14 | % | ||||||||||||||||||||
| Residual Portfolio Amortization | 363 | 363 | 363 | 460 | 540 | 610 | 660 | 670 | ||||||||||||||||||||||||||||
| % of revenues | 2.98 | % | 2.38 | % | 1.52 | % | 1.47 | % | 1.43 | % | 1.40 | % | 1.37 | % | 1.34 | % | ||||||||||||||||||||
| Pretax Profit | 1,228 | 2,368 | 3,863 | 5,703 | 7,634 | 9,720 | 11,599 | 8,766 | ||||||||||||||||||||||||||||
| % of revenues | 10.08 | % | 15.51 | % | 16.15 | % | 18.26 | % | 20.25 | % | 22.28 | % | 24.06 | % | 17.49 | % | ||||||||||||||||||||
| Tax Provision | 189 | 486 | 874 | 1,353 | 1,855 | 2,397 | 2,886 | 2,175 | ||||||||||||||||||||||||||||
| % of pretax profit | 15.42 | % | 20.51 | % | 22.63 | % | 23.72 | % | 24.30 | % | 24.66 | % | 24.88 | % | 24.81 | % | ||||||||||||||||||||
| Net Income | 1,039 | 1,882 | 2,988 | 4,350 | 5,779 | 7,323 | 8,713 | 6,591 | ||||||||||||||||||||||||||||
| % of revenues | 8.53 | % | 12.33 | % | 12.49 | % | 13.93 | % | 15.33 | % | 16.79 | % | 18.08 | % | 13.15 | % | ||||||||||||||||||||
| Depreciation & Amortization | 426 | 478 | 460 | 546 | 634 | 694 | 746 | 70 | ||||||||||||||||||||||||||||
| Acquisitions - Cash Consideration @ | 0 | % | 0 | 0 | 0 | 0 | 0 | 0 | 0 | 0 | ||||||||||||||||||||||||||
| Capital Expenditures | (70 | ) | (70 | ) | (70 | ) | (70 | ) | (70 | ) | (70 | ) | (70 | ) | (70 | ) | ||||||||||||||||||||
| % of revenues | -0.57 | % | -0.57 | % | -0.57 | % | -0.57 | % | -0.57 | % | -0.57 | % | -0.57 | % | -0.57 | % | ||||||||||||||||||||
| Working Capital | 0 | (154 | ) | (433 | ) | (365 | ) | (323 | ) | (296 | ) | (229 | ) | (96 | ) | |||||||||||||||||||||
| % of incremental change in revenues | 5.00 | % | 5.00 | % | 5.00 | % | 5.00 | % | 5.00 | % | 5.00 | % | 5.00 | % | 5.00 | % | ||||||||||||||||||||
| Cash Flow | 1,395 | 2,136 | 2,946 | 4,461 | 6,020 | 7,651 | 9,160 | 6,494 | ||||||||||||||||||||||||||||
| Interim Period Adjustment | 0.6712 | 1.0000 | 1.0000 | 1.0000 | 1.0000 | 1.0000 | 1.0000 | |||||||||||||||||||||||||||||
| Period | 0.6712 | 1.6712 | 2.6712 | 3.6712 | 4.6712 | 5.6712 | 6.6712 | |||||||||||||||||||||||||||||
| Present Value Factor | 0.9556 | 0.8533 | 0.7453 | 0.6509 | 0.5685 | 0.4965 | 0.4336 | |||||||||||||||||||||||||||||
| Present Value of Cash Flows | 895 | 1,823 | 2,195 | 2,903 | 3,422 | 3,798 | 3,972 | |||||||||||||||||||||||||||||
| Discount Rate (k) | 14.50 | % | ||||||||||||||||||||||||||||||||||
| Terminal Growth Rate (g) | 4.00 | % | ||||||||||||||||||||||||||||||||||
| Capitalization Rate (k-g) | 10.50 | % | ||||||||||||||||||||||||||||||||||
| Terminal Period Cash Flow | 6,494 | |||||||||||||||||||||||||||||||||||
| Terminal Value | 61,848 | |||||||||||||||||||||||||||||||||||
| Present Value Factor | 0.43360836 | |||||||||||||||||||||||||||||||||||
| Present Value of Terminal | 26,818 | |||||||||||||||||||||||||||||||||||
| Cumulative Present Value of Cash Flows | 19,009 | |||||||||||||||||||||||||||||||||||
| Indicated Business Enterprise Value | 45,827 | |||||||||||||||||||||||||||||||||||
| Less: Marketability Discount of 15% (1) | 0 | |||||||||||||||||||||||||||||||||||
| Less: Working Capital Adjustment | 0 | |||||||||||||||||||||||||||||||||||
| Add: Present Value of Tax Depreciation Benefits | 10 | |||||||||||||||||||||||||||||||||||
| Add: Present Value of Tax Amortization Benefits | 0 | |||||||||||||||||||||||||||||||||||
| Total Business Enterprise Value | 45,837 | |||||||||||||||||||||||||||||||||||
| Less Present Value of Future Acquisitions | 0 | |||||||||||||||||||||||||||||||||||
| Current Value of Business Enterprise | 45,837 | |||||||||||||||||||||||||||||||||||
Exhibit 7
OmniSoft, Inc.
Business Enterprise Valuation
Discounted Cash Flow Approach
As of April 30, 2018
($000)
| Terminal | ||||||||||||||||||||||||||||||||||||
| For Years Ending December 31st | 2017 | 2018 | 2019 | 2020 | 2021 | 2022 | 2023 | 2024 | Period | |||||||||||||||||||||||||||
| Revenues | ||||||||||||||||||||||||||||||||||||
| Residual Portfolio & Processing Fees | 0 | |||||||||||||||||||||||||||||||||||
| Less Bad Debt | ||||||||||||||||||||||||||||||||||||
| OmniSoft | 500 | 2,113 | 2,937 | 3,624 | 4,133 | 4,481 | 4,708 | 4,896 | ||||||||||||||||||||||||||||
| CrowdPay | ||||||||||||||||||||||||||||||||||||
| Benefit Packages | ||||||||||||||||||||||||||||||||||||
| Acquistions | ||||||||||||||||||||||||||||||||||||
| Other | ||||||||||||||||||||||||||||||||||||
| Revenues | 0 | 500 | 2,113 | 2,937 | 3,624 | 4,133 | 4,481 | 4,708 | 4,896 | |||||||||||||||||||||||||||
| Growth Rate | 323 | % | 39 | % | 23 | % | 14 | % | 8 | % | 5 | % | 4 | % | ||||||||||||||||||||||
| Cost of Revenues | ||||||||||||||||||||||||||||||||||||
| Residual Portfolio Amort | ||||||||||||||||||||||||||||||||||||
| Interchange Fees | ||||||||||||||||||||||||||||||||||||
| Processing & Servicing | ||||||||||||||||||||||||||||||||||||
| Residual Expense | ||||||||||||||||||||||||||||||||||||
| CrowdPay Exp. | ||||||||||||||||||||||||||||||||||||
| Benefit Packages | ||||||||||||||||||||||||||||||||||||
| Acquistions | ||||||||||||||||||||||||||||||||||||
| Other Processing | ||||||||||||||||||||||||||||||||||||
| Cost of Revenues | 0 | 0 | 0 | 0 | 0 | 0 | 0 | 0 | 0 | |||||||||||||||||||||||||||
| % of revenues | 0.00 | % | 0.00 | % | 0.00 | % | 0.00 | % | 0.00 | % | 0.00 | % | 0.00 | % | 0.00 | % | ||||||||||||||||||||
| Gross Profit | 0 | 500 | 2,113 | 2,937 | 3,624 | 4,133 | 4,481 | 4,708 | 4,896 | |||||||||||||||||||||||||||
| % of revenues | 100.00 | % | 100.00 | % | 100.00 | % | 100.00 | % | 100.00 | % | 100.00 | % | 100.00 | % | 100.00 | % | ||||||||||||||||||||
| Total Operating Expenses | 85 | 219 | 205 | 267 | 320 | 368 | 405 | 802 | ||||||||||||||||||||||||||||
| % of revenues | 17.06 | % | 10.37 | % | 6.99 | % | 7.36 | % | 7.74 | % | 8.21 | % | 8.60 | % | 8.60 | % | ||||||||||||||||||||
| EBITDA | 0 | 415 | 1,894 | 2,732 | 3,357 | 3,813 | 4,113 | 4,303 | 4,094 | |||||||||||||||||||||||||||
| % of revenues | 82.94 | % | 89.63 | % | 93.01 | % | 92.64 | % | 92.26 | % | 91.79 | % | 91.40 | % | 83.62 | % | ||||||||||||||||||||
| Depreciation & Amortization | 4 | 8 | 9 | 9 | 11 | 11 | 10 | 10 | ||||||||||||||||||||||||||||
| % of revenues | 0.80 | % | 0.40 | % | 0.31 | % | 0.26 | % | 0.26 | % | 0.24 | % | 0.21 | % | 0.20 | % | ||||||||||||||||||||
| Residual Portfolio Amortization | 0 | 0 | 0 | 0 | 0 | 0 | 0 | 0 | ||||||||||||||||||||||||||||
| % of revenues | 0.00 | % | 0.00 | % | 0.00 | % | 0.00 | % | 0.00 | % | 0.00 | % | 0.00 | % | 0.00 | % | ||||||||||||||||||||
| Pretax Profit | 411 | 1,885 | 2,723 | 3,348 | 3,803 | 4,103 | 4,293 | 4,084 | ||||||||||||||||||||||||||||
| % of revenues | 82.14 | % | 89.23 | % | 92.70 | % | 92.38 | % | 92.00 | % | 91.56 | % | 91.18 | % | 83.41 | % | ||||||||||||||||||||
| Tax Provision | 107 | 490 | 708 | 870 | 989 | 1,067 | 1,116 | 1,062 | ||||||||||||||||||||||||||||
| % of pretax profit | 26.00 | % | 26.00 | % | 26.00 | % | 26.00 | % | 26.00 | % | 26.00 | % | 26.00 | % | 26.00 | % | ||||||||||||||||||||
| Net Income | 304 | 1,395 | 2,015 | 2,478 | 2,814 | 3,036 | 3,177 | 3,022 | ||||||||||||||||||||||||||||
| % of revenues | 60.79 | % | 66.03 | % | 68.60 | % | 68.36 | % | 68.08 | % | 67.75 | % | 67.48 | % | 61.73 | % | ||||||||||||||||||||
| Depreciation & Amortization | 4 | 8 | 9 | 9 | 11 | 11 | 10 | 10 | ||||||||||||||||||||||||||||
| Acquisitions - Cash Consideration @ | 0 | % | 0 | 0 | 0 | 0 | 0 | 0 | 0 | 0 | ||||||||||||||||||||||||||
| Capital Expenditures | (10 | ) | (10 | ) | (10 | ) | (10 | ) | (10 | ) | (10 | ) | (10 | ) | (10 | ) | ||||||||||||||||||||
| % of revenues | -2.00 | % | -2.00 | % | -2.00 | % | -2.00 | % | -2.00 | % | -2.00 | % | -2.00 | % | -2.00 | % | ||||||||||||||||||||
| Working Capital | 0 | (81 | ) | (41 | ) | (34 | ) | (25 | ) | (17 | ) | (11 | ) | (9 | ) | |||||||||||||||||||||
| % of incremental change in revenues | 5.00 | % | 5.00 | % | 5.00 | % | 5.00 | % | 5.00 | % | 5.00 | % | 5.00 | % | 5.00 | % | ||||||||||||||||||||
| Cash Flow | 298 | 1,313 | 1,973 | 2,443 | 2,789 | 3,019 | 3,165 | 3,013 | ||||||||||||||||||||||||||||
| Interim Period Adjustment | 0.6712 | 1.0000 | 1.0000 | 1.0000 | 1.0000 | 1.0000 | 1.0000 | |||||||||||||||||||||||||||||
| Period | 0.6712 | 1.6712 | 2.6712 | 3.6712 | 4.6712 | 5.6712 | 6.6712 | |||||||||||||||||||||||||||||
| Present Value Factor | 0.9556 | 0.8533 | 0.7453 | 0.6509 | 0.5685 | 0.4965 | 0.4336 | |||||||||||||||||||||||||||||
| Present Value of Cash Flows | 191 | 1,120 | 1,470 | 1,590 | 1,585 | 1,499 | 1,372 | |||||||||||||||||||||||||||||
| Discount Rate (k) | 14.50 | % | ||||||||||||||||||||||||||||||||||
| Terminal Growth Rate (g) | 4.00 | % | ||||||||||||||||||||||||||||||||||
| Capitalization Rate (k-g) | 10.50 | % | ||||||||||||||||||||||||||||||||||
| Terminal Period Cash Flow | 3,013 | |||||||||||||||||||||||||||||||||||
| Terminal Value | 28,695 | |||||||||||||||||||||||||||||||||||
| Present Value Factor | 0.43361 | |||||||||||||||||||||||||||||||||||
| Present Value of Terminal | 12,442 | |||||||||||||||||||||||||||||||||||
| Cumulative Present Value of Cash Flows | 8,828 | |||||||||||||||||||||||||||||||||||
| Indicated Business Enterprise Value | 21,270 | |||||||||||||||||||||||||||||||||||
| Less: Marketability Discount of 15% (1) | 0 | |||||||||||||||||||||||||||||||||||
| Less: Working Capital Adjustment | 0 | |||||||||||||||||||||||||||||||||||
| Add: Present Value of Tax Depreciation Benefits | 1 | |||||||||||||||||||||||||||||||||||
| Add: Present Value of Tax Amortization Benefits | 0 | |||||||||||||||||||||||||||||||||||
| Total Business Enterprise Value | 21,272 | |||||||||||||||||||||||||||||||||||
| Less Present Value of Future Acquisitions | 0 | |||||||||||||||||||||||||||||||||||
| Current Value of Business Enterprise | 21,272 | |||||||||||||||||||||||||||||||||||
Exhibit 8
CrowdPay.US, Inc.
Business Enterprise Valuation
Discounted Cash Flow Approach
As of April 30, 2018
($000)
| Terminal | ||||||||||||||||||||||||||||||||||||
| For Years Ending December 31st | 2017 | 2018 | 2019 | 2020 | 2021 | 2022 | 2023 | 2024 | Period | |||||||||||||||||||||||||||
| Revenues | ||||||||||||||||||||||||||||||||||||
| Residual Portfolio & Processing Fees | ||||||||||||||||||||||||||||||||||||
| Less Bad Debt | ||||||||||||||||||||||||||||||||||||
| OmniSoft | 1,495 | 4,767 | 6,281 | 8,151 | 9,781 | 11,248 | 12,373 | 12,868 | ||||||||||||||||||||||||||||
| CrowdPay | ||||||||||||||||||||||||||||||||||||
| Benefit Packages | ||||||||||||||||||||||||||||||||||||
| Acquistions | ||||||||||||||||||||||||||||||||||||
| Other | ||||||||||||||||||||||||||||||||||||
| Revenues | 1,495 | 1,495 | 4,767 | 6,281 | 8,151 | 9,781 | 11,248 | 12,373 | 12,868 | |||||||||||||||||||||||||||
| Growth Rate | 219 | % | 32 | % | 19 | % | 11 | % | 7 | % | 4 | % | 4 | % | ||||||||||||||||||||||
| Cost of Revenues | ||||||||||||||||||||||||||||||||||||
| Residual Portfolio Amort | ||||||||||||||||||||||||||||||||||||
| Interchange Fees | ||||||||||||||||||||||||||||||||||||
| Processing & Servicing | ||||||||||||||||||||||||||||||||||||
| Residual Expense | ||||||||||||||||||||||||||||||||||||
| CrowdPay Exp. | 523 | 1,668 | 2,198 | 2,800 | 3,290 | 3,710 | 4,000 | 4,080 | ||||||||||||||||||||||||||||
| Benefit Packages | ||||||||||||||||||||||||||||||||||||
| Acquistions | ||||||||||||||||||||||||||||||||||||
| Other Processing | ||||||||||||||||||||||||||||||||||||
| Cost of Revenues | 523 | 1,668 | 2,198 | 2,800 | 3,290 | 3,710 | 4,000 | 4,080 | ||||||||||||||||||||||||||||
| % of revenues | 34.98 | % | 34.99 | % | 34.99 | % | 34.35 | % | 33.64 | % | 32.98 | % | 32.33 | % | 31.71 | % | ||||||||||||||||||||
| Gross Profit | 0 | 972 | 3,099 | 4,083 | 5,351 | 6,491 | 7,538 | 8,373 | 8,788 | |||||||||||||||||||||||||||
| % of revenues | 0.00 | % | 65.02 | % | 65.01 | % | 65.01 | % | 65.65 | % | 66.36 | % | 67.02 | % | 67.67 | % | 68.29 | % | ||||||||||||||||||
| Total Operating Expenses | 255 | 495 | 439 | 570 | 684 | 787 | 866 | 802 | ||||||||||||||||||||||||||||
| % of revenues | 0.00 | % | 17.06 | % | 10.37 | % | 6.99 | % | 7.00 | % | 7.00 | % | 6.99 | % | 7.00 | % | 7.00 | % | ||||||||||||||||||
| EBITDA | 0 | 717 | 2,604 | 3,644 | 4,780 | 5,807 | 6,752 | 7,507 | 7,986 | |||||||||||||||||||||||||||
| % of revenues | 0.00 | % | 47.96 | % | 54.64 | % | 58.01 | % | 58.65 | % | 59.37 | % | 60.02 | % | 60.67 | % | 62.06 | % | ||||||||||||||||||
| Depreciation & Amortization | 8 | 17 | 18 | 19 | 21 | 21 | 20 | 20 | ||||||||||||||||||||||||||||
| % of revenues | 0.54 | % | 0.35 | % | 0.29 | % | 0.23 | % | 0.22 | % | 0.19 | % | 0.16 | % | 0.16 | % | ||||||||||||||||||||
| Residual Portfolio Amortization | 0 | 0 | 0 | 0 | 0 | 0 | 0 | 0 | ||||||||||||||||||||||||||||
| % of revenues | 0.00 | % | 0.00 | % | 0.00 | % | 0.00 | % | 0.00 | % | 0.00 | % | 0.00 | % | 0.00 | % | ||||||||||||||||||||
| Pretax Profit | 709 | 2,588 | 3,626 | 4,761 | 5,786 | 6,730 | 7,487 | 7,966 | ||||||||||||||||||||||||||||
| % of revenues | 47.42 | % | 54.28 | % | 57.73 | % | 58.42 | % | 59.15 | % | 59.84 | % | 60.51 | % | 61.90 | % | ||||||||||||||||||||
| Tax Provision | 184 | 673 | 943 | 1,238 | 1,504 | 1,750 | 1,947 | 2,071 | ||||||||||||||||||||||||||||
| % of pretax profit | 26.00 | % | 26.00 | % | 26.00 | % | 26.00 | % | 26.00 | % | 26.00 | % | 26.00 | % | 26.00 | % | ||||||||||||||||||||
| Net Income | 525 | 1,915 | 2,683 | 3,523 | 4,281 | 4,980 | 5,540 | 5,895 | ||||||||||||||||||||||||||||
| % of revenues | 35.09 | % | 40.17 | % | 42.72 | % | 43.23 | % | 43.77 | % | 44.28 | % | 44.78 | % | 45.81 | % | ||||||||||||||||||||
| Depreciation & Amortization | 8 | 17 | 18 | 19 | 21 | 21 | 20 | 20 | ||||||||||||||||||||||||||||
| Acquisitions - Cash Consideration @ | 0 | % | 0 | 0 | 0 | 0 | 0 | 0 | 0 | 0 | ||||||||||||||||||||||||||
| Capital Expenditures | (20 | ) | (20 | ) | (20 | ) | (20 | ) | (20 | ) | (20 | ) | (20 | ) | (20 | ) | ||||||||||||||||||||
| % of revenues | -1.34 | % | -1.34 | % | -1.34 | % | -1.34 | % | -1.34 | % | -1.34 | % | -1.34 | % | -1.34 | % | ||||||||||||||||||||
| Working Capital | 0 | (164 | ) | (76 | ) | (93 | ) | (82 | ) | (73 | ) | (56 | ) | (25 | ) | |||||||||||||||||||||
| % of incremental change in revenues | 5.00 | % | 5.00 | % | 5.00 | % | 5.00 | % | 5.00 | % | 5.00 | % | 5.00 | % | 5.00 | % | ||||||||||||||||||||
| Cash Flow | 513 | 1,748 | 2,605 | 3,429 | 4,201 | 4,908 | 5,484 | 5,870 | ||||||||||||||||||||||||||||
| Interim Period Adjustment | 0.6712 | 1.0000 | 1.0000 | 1.0000 | 1.0000 | 1.0000 | 1.0000 | |||||||||||||||||||||||||||||
| Period | 0.6712 | 1.6712 | 2.6712 | 3.6712 | 4.6712 | 5.6712 | 6.6712 | |||||||||||||||||||||||||||||
| Present Value Factor | 0.9556 | 0.8533 | 0.7453 | 0.6509 | 0.5685 | 0.4965 | 0.4336 | |||||||||||||||||||||||||||||
| Present Value of Cash Flows | 329 | 1,492 | 1,942 | 2,232 | 2,388 | 2,437 | 2,378 | |||||||||||||||||||||||||||||
| Discount Rate (k) | 14.50 | % | ||||||||||||||||||||||||||||||||||
| Terminal Growth Rate (g) | 4.00 | % | ||||||||||||||||||||||||||||||||||
| Capitalization Rate (k-g) | 10.50 | % | ||||||||||||||||||||||||||||||||||
| Terminal Period Cash Flow | 5,870 | |||||||||||||||||||||||||||||||||||
| Terminal Value | 55,905 | |||||||||||||||||||||||||||||||||||
| Present Value Factor | 0.43360836 | |||||||||||||||||||||||||||||||||||
| Present Value of Terminal | 24,241 | |||||||||||||||||||||||||||||||||||
| Cumulative Present Value of Cash Flows | 13,197 | |||||||||||||||||||||||||||||||||||
| Indicated Business Enterprise Value | 37,438 | |||||||||||||||||||||||||||||||||||
| Less: Marketability Discount of 15% (1) | 0 | |||||||||||||||||||||||||||||||||||
| Less: Working Capital Adjustment | 0 | |||||||||||||||||||||||||||||||||||
| Add: Present Value of Tax Depreciation Benefits | 3 | |||||||||||||||||||||||||||||||||||
| Add: Present Value of Tax Amortization Benefits | 0 | |||||||||||||||||||||||||||||||||||
| Total Business Enterprise Value | 37,441 | |||||||||||||||||||||||||||||||||||
| Less Present Value of Future Acquisitions | 0 | |||||||||||||||||||||||||||||||||||
| Current Value of Business Enterprise | 37,441 | |||||||||||||||||||||||||||||||||||