Attached files
| file | filename |
|---|---|
| EX-99.1 - EXHIBIT 99.1 - B. Riley Financial, Inc. | s110120_ex99-1.htm |
| 8-K - 8-K - B. Riley Financial, Inc. | s110120_8k.htm |
Exhibit 99.2

NASDAQ:RILY MAY 2018

2 FORWARD LOOKING STATEMENTS Statements in this presentation that are not descriptions of historical facts are forward - looking statements that are based on management’s current expectations and assumptions and are subject to risks and uncertainties . If such risks or uncertainties materialize or such assumptions prove incorrect, our business, operating results, financial condition and stock price could be materially negatively affected . In some cases, you can identify forward - looking statements by terminology including “anticipates,” “believes,” “can,” “continue,” “could,” “estimates,” “expects,” “intends,” “may,” “plans,” “potential,” “predicts,” “should,” “will,” “would” or the negative of these terms or other comparable terminology . You should not place undue reliance on such forward - looking statements, which are based on the information currently available to us and speak only as of the date of this presentation . Such forward looking statements include, but are not limited to, our second quarter 2018 Adjusted EBITDA guidance estimate, express or implied statements regarding future financial performance and future dividends, the effects of our business model, the effects of our balance sheet on our ability to pursue business opportunities, the effects and anticipated benefits of our completed and pending acquisitions and related actions, expectations regarding future transactions and the financial impact, size and consistency of returns and timing thereof, expectations regarding market dynamics, as well as statements regarding the effect of investments in our business segments . Because these forward - looking statements involve known and unknown risks and uncertainties, there are important factors that could cause actual results, events or developments to differ materially from those expressed or implied by these forward - looking statements . Risk factors that could cause actual results to differ from those contained in the forward - looking statements include but are not limited to risks related to : volatility in our revenues and results of operations ; changing conditions in the financial markets ; our ability to generate sufficient revenues to achieve and maintain profitability ; the short term nature of our engagements ; the accuracy of our estimates and valuations of inventory or assets in “guarantee” based engagements ; competition in the asset management business ; potential losses related to our auction or liquidation engagements ; our dependence on communications, information and other systems and third parties ; potential losses related to purchase transactions in our auctions and liquidations business ; the potential loss of financial institution clients ; potential losses from or illiquidity of our proprietary investments ; changing economic and market conditions ; potential liability and harm to our reputation if we were to provide an inaccurate appraisal or valuation ; potential mark - downs in inventory in connection with purchase transactions ; failure to successfully compete in any of our segments ; loss of key personnel ; our ability to borrow under our credit facilities as necessary ; failure to comply with the terms of our credit agreements ; our ability to meet future capital requirements ; our ability to realize the benefits of our completed and proposed acquisitions, including our ability to achieve anticipated opportunities and operating cost savings, and accretion to reported earnings estimated to result from completed and proposed acquisitions in the time frame expected by management or at all ; the possibility that our proposed acquisition of magicJack VocalTec Ltd . (“ magicJack ”) does not close when expected or at all ; our ability to promptly and effectively integrate our business with that of magicJack if such transaction closes ; the reaction to the magicJack acquisition or our and magicJack’s customers, employees and counterparties ; the diversion of management time on acquisition - related issues ; and those risks described from time to time in B . Riley Financial, Inc . ’s filings with the SEC, including, without limitation, the risks described in B . Riley Financial, Inc . ’s Annual Report on Form 10 - K for the year ended December 31 , 2017 under the captions “Risk Factors” and “Management’s Discussion and Analysis of Financial Condition and Results of Operations . ” Additional information is also set forth in our Quarterly Report on Form 10 - Q for the quarter ended March 31 , 2018 . These factors should be considered carefully and readers are cautioned not to place undue reliance on such forward - looking statements . All information is current as of the date this presentation is issued, and B . Riley Financial, Inc . undertakes no duty to update this information . We have filed a registration statement (including a prospectus) with the SEC for the offering to which this presentation relates . Before you invest in such offering, you should read the prospectus in that registration statement, the prospectus supplement for the offering and other documents we have filed with the SEC for more complete information about us and the offering . You may get these documents for free by visiting EDGAR on the SEC Web site at www . sec . gov . Alternatively, we will arrange to send you the prospectus if you request it by calling 1 - 888 - 295 - 0155 . In particular, you should review the preliminary prospectus supplement that we have prepared in connection with the offering and the financial information included or incorporated by reference therein before you invest . Safe Harbor Statement

Introduction

4 Transaction Summary ___________________________ (1) Actual offering size and pricing may differ materially from the figures shown ; offering size and pricing to be determined by negotiations between the Company and the underwriters . Issuer B. Riley Financial, Inc. Security Senior Unsecured Notes Proposed Ticker / Exchange RILYH / NASDAQ Offering Size $50,000,000 (1) Notes Offered 2,000,000 (1) Overallotment Option 15% Par Value $25.00 Coupon 7.250% - 7.375% (1) Maturity 5 Years Call Feature The notes may be called at any time at our option ( i ) on or after May 31, 2020 and prior to May 31, 2021, at a price equal to $25.50 per note, (ii) on or after May 31, 2021 and prior to May 31, 2022, at a price equal to $25.25 per note, and (iii) on or after May 31, 2022 and prior to maturity, at a price equal to 100% of their principal amount, and in each case, plus accrued and unpaid interest to, but excluding, the date of redemption Use of Proceeds If the magicJack acquisition is consummated, a portion of the net proceeds from this offering will be used to fund a portion of the magicJack acquisition. The remaining net proceeds from this offering, if any, will be used for general corporate purposes Expected Pricing Date 5/14/2018 Bookrunning Managers B. Riley FBR, Ladenburg Thalmann , Incapital Co - Managers Boenning & Scattergood, Wedbush Securities, William Blair

5 Credit Metrics ___________________________ (1) Includes impact of proposed $ 50 . 0 M senior unsecured note offering . Actual offering size, pricing, and fees incurred may differ materially from the figures shown ; offering size and pricing to be determined by negotiations between the Company and the underwriters . (2) The pro forma financial information does not reflect any other changes subsequent to March 31 , 2018 , and it specifically excludes ( i ) the completion of the magicJack acquisition, (ii) approximately $ 14 million of incremental sales of senior notes under our at the market sale program and (iii) short term borrowings of $ 300 million under our asset based credit facility with Wells Fargo and $ 51 million from GACP II, L . P . that are used to fund retail liquidation engagements . (3) Includes approximately $ 150 . 8 M in Securities and Other Investments Owned minus $ 19 . 7 M in Securities Sold not yet Purchased . (4) Includes approximately $ 23 . 4 M in Restricted Cash, $ 7 . 7 M in Advances against Customer Contracts, and $ 47 . 9 M in Due from Clearing Brokers . (5) Excludes FBR & Co . results prior to 6 / 1 / 17 and Wunderlich Investment Company, Inc . results prior to 7 / 3 / 17 . (6) For a definition of Adjusted EBITDA and a reconciliation to GAAP financial measures, please see the Appendix . (7) Pro forma adjustment to interest expense is calculated using a coupon rate of 7 . 375 % . Pro Forma Credit Statistics 3/31/2018 B. Riley Pro Forma Pro Forma ($ in millions) Financial Adjustments (1) Total (1) (2) Cash and Cash Equivalents 74.3$ 48.1$ 122.4$ Net Securities and Other Investments Owned, at Fair Value (3) 131.1 - 131.1 Restricted Cash and Other (4) 79.0 - 79.0 Total Cash, Net Securities, and Other (3)(4) 284.4 48.1 332.5 Total Debt 212.8 50.0 262.8 Cash, Securities and Other Investment Owned, Net of Debt 71.5 (1.9) 69.6 LTM 3/31/2018 Revenue (5) 365.1$ -$ 365.1$ LTM 3/31/2018 Adjusted EBITDA (5)(6) 70.8 - 70.8 LTM 3/31/2018 Interest Expense (5)(7) 11.8 3.7 15.5 Total Debt / LTM Adj. EBITDA 3.0x N/A 3.7x LTM Adj. EBITDA / LTM Interest Expense 6.0x N/A 4.6x

6 Key Statistics Trading Data Stock Price (6) $20.50 High/Low (7) $21.25/$13.70 Shares Outstanding (3) 26.7M Public Float, est. (3) 76.7% Inst. Holdings (8) 48.6% Insider Holdings (3) 23.3% Financial Highlights Revenues (1) $365.1M Adj. EBITDA (1)(2) $70.8M Cash & Equivalents (3) $74.3M Marketable Securities, net (3)(4) $131.1M Restricted Cash & Other (3)(5) $79.0M Total Cash, Net Securities, and Other (3)(4)(5) $284.4M Total Debt (3) $212.8M $49M $70M $71M FY 2016 FY 2017 3/31/18 LTM $190M $322M $365M FY 2016 FY 2017 3/31/18 LTM ___________________________ (1) Based on 3 / 31 / 18 LTM results . (2) For a definition of Adjusted EBITDA and a reconciliation to GAAP financial measures, please see the Appendix . (3) As of 3 / 31 / 18 . (4) Includes approximately $ 150 . 8 M in Securities and Other Investments Owned net of $ 19 . 7 M in Securities Sold not yet Purchased . (5) Includes approximately $ 23 . 4 M in Restricted Cash, $ 7 . 7 M in Advances against Customer Contracts, and $ 47 . 9 M in Due from Clearing Brokers . (6) As of 5 / 2 / 18 . (7) Based on closing prices from 5 / 3 / 17 to 5 / 2 / 18 . (8) Source : NASDAQ as of 5 / 12 / 18 . (9) Calculated using closing stock price as of 5 / 2 / 18 and shares outstanding as of 3 / 31 / 18 . (10) Enterprise value is defined as our market capitalization, less cash and cash equivalents, restricted cash, amounts due from clearing brokers, advances against customer contracts, and the net amount of securities and other investments owned and securities sold not purchased, plus senior notes payable and notes payable . (11) Excludes FBR & Co . results prior to 6 / 1 / 17 and Wunderlich Investment Company, Inc . results prior to 7 / 3 / 17 . Valuation Measures Market Cap (9) $546.9M Enterprise Value (9)(10) $475.4M EV/Revenue (1)(9)(10) 1.3x EV/Adj. EBITDA (1)(2)(9)(10) 6.7x Adjusted EBITDA (2) (11) Revenues (11)

7 Capital Markets 64% Auction & Liquidation 13% Valuation & Appraisal 9% Principal Investments 14% ■ 3 / 31 / 18 LTM Adj . EBITDA of $ 70 . 8 M ( 1 ) ( 2 ) ; Q 1 2018 Adj . EBITDA of $ 16 . 1 M ( 1 ) ■ Q 2 2018 Adj . EBITDA guidance estimate in the range of $ 22 M to $ 30 M ( 1 ) ■ Capital Markets activity driven by enhanced deal flow, brokerage ● B . Riley FBR and Wunderlich offer broad research and banking coverage ; substantial wealth management assets under administration ■ Liquidation outlook favorable due to consumer and retail opportunity ● Secular trends and “the Amazon effect” expected to continue to exert pressure on retailers for years ■ Appraisal maintains consistent volume of appraisals with steady annual increase in revenue flow ■ Principal Investments offers compelling risk - adjusted returns ● United Online provides steady revenue and cash flow ■ Strong balance sheet ; significant cash and securities balances Key Investment Highlights 3/31/18 LTM Gross Revenue Mix (2) Highlights 3/31/17 LTM (2) +64% $223.3M $365.1M Meaningful value created translated into earnings growth ___________________________ (1) For a definition of Adjusted EBITDA and a reconciliation to GAAP financial measures, please see the Appendix . (2) Excludes FBR & Co . results prior to 6 / 1 / 17 and Wunderlich Investment Company, Inc . results prior to 7 / 3 / 17 . 3/31/18 LTM (2)

8 B. Riley Financial, Inc. at a Glance Diverse business mix produces steady, predictable results with multiple high - margin revenue streams ■ Diversified provider of financial and business advisory services ■ Invests in and acquires companies with attractive return profiles ■ Leverages cross - platform expertise of 800 + ( 1 ) colleagues for capital raising and the financial advisory needs of public and private companies and high net worth individuals ■ Operates through four primary business divisions : ● An investment bank and brokerage firm ● An investment and capital management division ● An asset disposition and appraisal business ● And a principal investment platform ■ Headquartered in Los Angeles with offices in major U . S . markets including New York, DC metro, Boston, Chicago, Memphis, Dallas, Houston, San Francisco, as well as in Germany and Australia Company Overview (1) As of 12 / 31 / 17 .

9 Company History and Major Growth Milestones 2017 Acquired FBR & Co. Acquired Wunderlich Securities Merged broker - dealers forming B. Riley FBR 2015 RILY listed on NASDAQ Acquired MK Capital Advisors Launched GA Capital Partners for non - traditional debt lending 2018 Anticipated closing of agreement to acquire magicJack through Principal Investments 1997 Bryant Riley formed B. Riley & Co. Boutique stock - picking and research firm serving small caps in Southern CA 2004 Acquired Friend & Co. Expands into investment banking, corporate finance FRIEND & CO 2012 Acquired Caris & Co. Enhanced equity research and institutional sales division 2014 Merged with publicly - traded Great American Group Diversified financial advisory offering, adding asset disposition and appraisal business 2016 Acquired United Online Established Principal Investments platform Despite significant growth over last 20 years, investment philosophy remains core to the business With a history of organic growth and thoughtful acquisitions, B. Riley Financial has developed a diverse platform capable of delivering uniquely collaborative client solutions.

10 B . Riley FBR, Inc . ■ Leading full service investment bank and FINRA licensed institutional broker - dealer, which provides corporate finance, equity research, sales and trading services to corporate, institutional and high net worth clients Great American Group, LLC ■ Leading provider of advisory and valuation services, asset disposition and auction solutions with deep sector expertise to assist companies, lenders, capital providers, private equity investors and professional service firms in maximizing the value of their assets B . Riley Capital Management, LLC ■ SEC registered investment advisor and provider of capital management solutions through B . Riley Asset Management, B . Riley Wealth Management LLC, and Great American Capital Partners LLC Wunderlich Securities Inc . ■ FINRA registered broker - dealer and SEC registered investment advisor which provides comprehensive wealth management services to individual and corporate clients B . Riley Principal Investments, LLC ■ Focuses on direct investment of firm capital, leveraging resources across B . Riley Financial to identify attractive investment opportunities or acquisitions that generate cash flow Our Companies Comprised of several wholly - owned subsidiaries – each a leader in its respective industry

Segments Overview

12 Capital Markets Segment B. Riley FBR combination creates more recurring lines of business Investment Banking & Brokerage Overview ■ B . Riley FBR is a full service platform with leading equity offering franchises, small - cap focused investment bank ● 80 + investment banking professionals ■ Quality research platform with extensive sector coverage ● 25 + well regarded, highly experienced senior analysts ● Second most small - cap stocks under coverage ■ Deep sector and stock knowledge drives relationships with buyers and sellers in the market, enhancing deal flow ● 100 + sales & trading professionals ● Market - maker in 500 + equity securities ● Covers 1 , 100 + institutional investors ■ Wide field of vision, broad capabilities offer diverse opportunities Segment Highlights ■ Consolidated investment bank and brokerage significantly reducing fixed costs ■ Enhanced research coverage universe from 200 + to 500 + companies ( 4 ) ■ Expanded market presence and distribution on East and West coasts Increased Deal Flow (5) Cumulative Deals and Value ($Billions) 656 722 733 $172Bn $186Bn $187Bn 600 620 640 660 680 700 720 740 $160 $165 $170 $175 $180 $185 $190 2016 2017 3/31/18 Deals Value ($Bn) Research Analyst Rankings Leader in Small & Mid Cap Coverage Top Earnings Estimator # 1 Thomson Reuters Starmine Awards 2017 Top Stock Pickers # 3 Thomson Reuters Starmine Awards 2017 Top Wall Street Analysts 2 # TipRanks Top Analysts 2017 League Table Rankings * Leading Initial Equity Offering Franchise Initial Equity Offerings for Small Cap Issuers (2) # 2 Initial Common Stock Offerings for US Small Caps (3) # 4 144A Equity Offerings (1) # 1 ___________________________ *Totals reflect transactions that occurred at predecessor firms and may not be indicative of future capabilities . (1) Dealogic . Apportioned credit to all book - running managers ; Rank Eligible transactions only, All Market Caps – All industries – 12 / 31 / 2007 – 3 / 31 / 2018 – All PIPOs . (2) Dealogic . Apportioned credit to all book - running managers ; Rank Eligible transactions only, US and Bermuda Issuers – Market Caps < $ 1 . 5 Billion – All industries – 01 / 12 / 2012 – 3 / 31 / 2018 – Initial Common Stock Offerings . (3) Dealogic . Apportioned credit to all book - running managers ; Rank Eligible transactions only, US and Bermuda Issuers – Market Caps < $ 1 . 5 Billion – All industries – 12 / 31 / 2007 – 3 / 31 / 2018 – Initial Common Stock Offerings . (4) From May 2017 to May 2018 . (5) Cumulative deals and value since Q 1 2007 .

13 Wealth Management Overview Capital Markets Segment (cont.) Complementary wealth management businesses provide steady revenue source B. Riley Wealth Management provides bespoke portfolios for business leaders, entrepreneurs and ultra - high net worth families ■ Offers portfolio management, administration, financial management, tax planning, estate and trust planning ■ Multi - family office practice serving a select group of families, with regulatory assets under management in excess of $550M (2) Wunderlich Securities offers wealth management solutions to individuals, families, corporations, foundations and endowments ■ Provides financial planning, retirement planning, investment guidance, trusts, lending resources, and fiduciary services ■ Over $ 8 . 6 billion in assets under administration ( 1 ) ; 34 , 000 + active accounts ( 1 ) ■ 180 + experienced financial advisors ■ Enhanced retail distribution with 24 branch locations in 14 states across the U . S . ( 1 ) ■ Leverages B . Riley FBR research and market commentary Combined scale and large base of assets under administration provide stability of income. ___________________________ (1) As of 3 / 31 / 18 . (2) As of 12 / 31 / 18
14 Direct Lending Overview Capital Markets Segment (cont.) Direct lending and asset management businesses provide consistent cash flows Asset & Fund Management Overview B. Riley Asset Management offers proprietary investment products and tailored solutions to institutional and high net worth investors. ■ Fund products consistently outperform; based on the “best ideas” of B. Riley FBR equity research analysts ■ Benefits from enhanced distribution through large network of HNW, family office and traditional accounts Great American Capital Partners manages direct lending funds with ability to invest >$500M in capital ■ Focused on providing financing to asset - rich companies seeking capital in addition to traditional debt ■ Underwriting analysis based upon recovery from liquidating assets typically in bankruptcy process ■ Leverages Great American’s deep experience in liquidation values and asset appraisals across industries Relationship - driven, research - centric asset management business leverages cross - platform expertise through expanded distribution channels.

15 Auction & Liquidation Segment Strong outlook for highly specialized retail liquidation business provides competitive advantage Segment Overview Illustrative Clients ■ Leading asset disposition provider with 40+ years experience ■ Highly - specialized in large - scale retail liquidation, store closings ■ Deep retail expertise offers competitive advantage with multiple points of entry to engagement ■ Uniquely qualified; leverages cross - platform valuation and real estate expertise to offer single - source solution to retail clients ■ Global network of resources in Europe, Asia and Australia ■ Offers industrial auction services across industry sectors Segment Highlights ■ Strong outlook fueled by fundamental shifts in retail market trends, consumer buying habits and “the Amazon effect” ■ Highly profitable despite cyclical nature of project - based segment revenue Liquidations Completed 2,100+ store closings in 3/31/18 LTM Great American has liquidated assets of $10B+ in aggregate value since 2013 Auctions
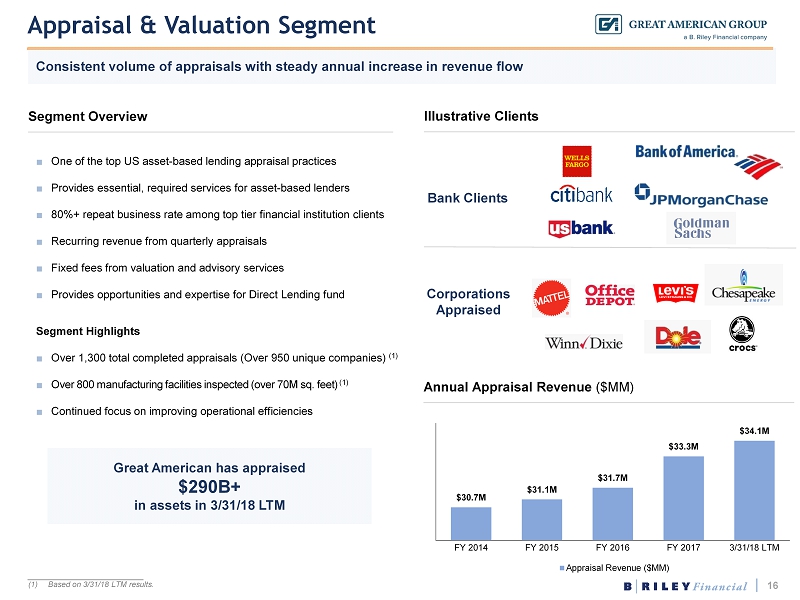
16 Appraisal & Valuation Segment Consistent volume of appraisals with steady annual increase in revenue flow Segment Overview Illustrative Clients ■ One of the top US asset - based lending appraisal practices ■ Provides essential, required services for asset - based lenders ■ 80%+ repeat business rate among top tier financial institution clients ■ Recurring revenue from quarterly appraisals ■ Fixed fees from valuation and advisory services ■ Provides opportunities and expertise for Direct Lending fund Segment Highlights ■ Over 1,300 total completed appraisals (Over 950 unique companies) (1) ■ Over 800 manufacturing facilities inspected (over 70M sq. feet) (1) ■ Continued focus on improving operational efficiencies Annual Appraisal Revenue ($MM) $30.7M $31.1M $31.7M $33.3M $34.1M FY 2014 FY 2015 FY 2016 FY 2017 3/31/18 LTM Appraisal Revenue ($MM) Great American has appraised $290B+ in assets in 3/31/18 LTM Bank Clients Corporations Appraised ___________________________ (1) Based on 3 / 31 / 18 LTM results .

17 Principal Investments Segment Steady cash flows from uncorrelated businesses provide diversification of revenue streams Segment Overview ■ Focuses on investing or acquiring companies and assets that present attractive cash - flow driven returns ■ Replicable model for operationally - focused, control equity investments United Online, Inc . ■ Provider of internet access subscriptions under the NetZero and Juno brands as well as advertising solutions to marketers ■ Internet access includes dial - up service, mobile broadband and DSL ■ Highly profitable business generating significant cash flows ■ Internet access subscription, advertising produce high gross margins ■ Low overhead from successful execution of cost synergies ■ Predictable subscriber attrition contributes to steady cash flow

Financial Overview

19 $190.4M $322.2M $365.1M FY 2016 FY 2017 3/31/18 LTM $48.9M $69.8M $70.8M FY 2016 FY 2017 3/31/18 LTM Financial Highlights Historical Actual Results for Consolidated B. Riley Financial Revenue (1) Adjusted EBITDA (1)(2) ___________________________ (1) Excludes FBR & Co . results prior to 6 / 1 / 17 and Wunderlich Investment Company, Inc . results prior to 7 / 3 / 17 . (2) For a definition of Adjusted EBITDA and a reconciliation to GAAP financial measures, please see the Appendix .

20 Financial Highlights Historical Actual Results for Consolidated B. Riley Financial ___________________________ (1) Excludes FBR & Co . results prior to 6 / 1 / 17 and Wunderlich Investment Company, Inc . results prior to 7 / 3 / 17 . (2) Includes Direct Cost of Services, Cost of Goods Sold, Restructuring Charge, Securities Lending Interest Expense, and Selling, General, and Administrative Expenses . (3) Includes Interest Expense and Loss from Equity Investment, net of Interest Income . B. Riley Financial Consolidated Statement of Operations (1) (000’s) FY 2016 FY 2017 3/31/18 LTM Q1 2017 Q2 2017 Q3 2017 Q4 2017 Q1 2018 Total Revenues $190,351 $322,176 $365,057 $52,897 $66,676 $92,426 $110,177 $95,778 Operating Expenses (2) 141,626 293,332 336,322 42,186 64,116 91,070 95,960 85,176 Operating Income 48,725 28,844 28,735 10,711 2,560 1,356 14,217 10,602 Other Expense (3) (1,678) (8,399) (12,511) (659) (1,744) (2,591) (3,405) (4,771) Income (Loss) before Income Taxes 47,047 20,445 16,224 10,052 816 (1,235) 10,812 5,831 (Provision for) Benefit from Income Taxes (14,321) (8,510) (13,348) 3,849 2,547 1,357 (16,263) (989) Net Income (Loss) Attributable to Noncontrolling Interests 11,200 379 838 (120) 83 (246) 662 339 Net Income (Loss) $21,526 $11,556 $2,038 $14,021 $3,280 $368 ($6,113) $4,503
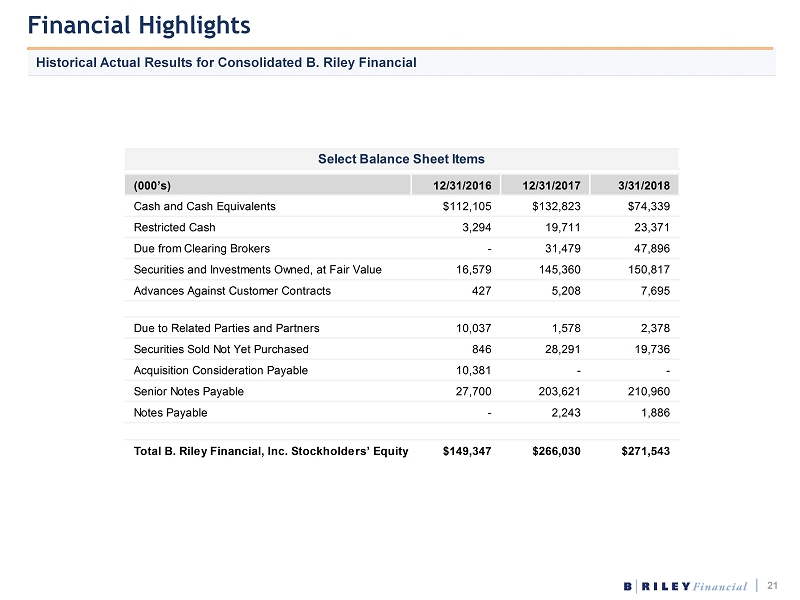
21 Financial Highlights Historical Actual Results for Consolidated B. Riley Financial (000’s) 12/31/2016 12/31/2017 3/31/2018 Cash and Cash Equivalents $112,105 $132,823 $74,339 Restricted Cash 3,294 19,711 23,371 Due from Clearing Brokers - 31,479 47,896 Securities and Investments Owned, at Fair Value 16,579 145,360 150,817 Advances Against Customer Contracts 427 5,208 7,695 Due to Related Parties and Partners 10,037 1,578 2,378 Securities Sold Not Yet Purchased 846 28,291 19,736 Acquisition Consideration Payable 10,381 - - Senior Notes Payable 27,700 203,621 210,960 Notes Payable - 2,243 1,886 Total B. Riley Financial, Inc. Stockholders’ Equity $149,347 $266,030 $271,543 Select Balance Sheet Items

Appendix

23 Financial Highlights Historical Actual Results for Consolidated B. Riley Financial ___________________________ (1) Excludes FBR & Co . results prior to 6 / 1 / 17 and Wunderlich Investment Company, Inc . results prior to 7 / 3 / 17 . (2) Adjusted EBITDA : earnings before interest expense, interest income, provision for or benefit from income taxes, depreciation and amortization, share - based payments, fair value adjustments, insurance settlement recovery, transactions - related costs, and restructuring costs . B. Riley Financial Segment Income (000’s) FY 2016 FY 2017 3/31/18 LTM Q1 2017 Q2 2017 Q3 2017 Q4 2017 Q1 2018 Revenues: Capital Markets (1) 39,335 189,723 232,329 17,723 23,894 63,679 84,427 60,329 Auction and Liquidation 87,746 47,379 48,900 13,996 21,807 7,377 4,199 15,517 Valuation and Appraisal 31,749 33,331 34,055 7,796 7,960 9,043 8,532 8,520 Principal Investments - UOL 31,521 51,743 49,773 13,382 13,015 12,327 13,019 11,412 Total Revenue 190,351 322,176 365,057 52,897 66,676 92,426 110,177 95,778 Segment Operating Income (Loss): Capital Markets (1) 6,091 15,931 9,007 6,627 (4,827) (184) 14,315 (297) Auction and Liquidation 41,100 11,186 17,430 1,807 7,290 2,022 67 8,051 Valuation and Appraisal 8,881 9,713 9,641 2,000 2,274 2,969 2,470 1,928 Principal Investments – UOL 9,215 19,503 20,157 4,202 5,074 4,944 5,282 4,857 Total Segment Income 65,287 56,333 56,235 14,636 9,811 9,751 22,134 14,539 Corporate Expenses (16,562) (27,489) (27,500) (3,925) (7,251) (8,395) (7,917) (3,937) Adjusted EBITDA (2) $48,903 $69,783 $70,800 $15,040 $17,586 $15,760 $21,397 $16,057

24 Non - GAAP Financial Measures ___________________________ (1) Excludes FBR results prior to 6 / 1 / 17 and Wunderlich results prior to 7 / 3 / 17 . (2) Q 2 2017 includes approximately $ 6 . 3 M fair value adjustment, Q 3 2017 includes $ 2 . 8 M fair value adjustment, and FY 2017 includes $ 9 . 0 M fair value adjustment . (3) In addition to restructuring costs, FY 2016 includes approximately $ 1 . 6 M insurance settlement recovery, and Q 2 2017 and FY 2017 include $ 6 . 0 M insurance settlement recovery . B. Riley Financial Standalone Results (1) (000’s) FY 2016 FY 2017 3/31/18 LTM Q1 2017 Q2 2017 Q3 2017 Q4 2017 Q1 2018 Net Income (Loss) $21,526 $11,556 $2,038 $14,021 $3,280 $368 ($6,113) $4,503 Provision for (Benefit from) Income Taxes 14,321 8,510 13,348 (3,849) (2,547) (1,357) 16,263 989 Interest Expense, net 1,678 7,962 11,402 659 1,744 2,434 3,125 4,099 Depreciation and Amortization 4,306 11,140 12,435 2,042 2,248 3,416 3,434 3,337 Share-based Compensation and Fair Value Adjustment (2) 3,567 16,950 18,601 907 7,858 5,523 2,662 2,558 Transaction-Related Costs 1,236 7,291 6,759 886 4,789 480 1,136 354 Restructuring Costs and Other (3) 2,269 6,374 6,217 374 214 4,896 890 217 Total Adjustments 27,377 58,227 68,762 1,019 14,306 15,392 27,510 11,554 Adjusted EBITDA $48,903 $69,783 $70,800 $15,040 $17,586 $15,760 $21,397 $16,057

25 Financial Projections B. Riley Financial Forecasted Adjusted EBITDA Reconciliation Q2 2018 (000’s) Low High Net income attributable to B. Riley Financial, Inc. (estimate) $5,400 $10,000 Adjustments (estimate): Provision for income taxes 2,000 3,700 Interest expense 9,000 9,700 Interest income (100) (100) Share based payments 2,500 3,000 Depreciation and amortization 3,200 3,200 Transactions related costs - 500 Total EBITDA adjustments 16,600 20,000 Adjusted EBITDA (estimate) $22,000 $30,000

26 Contact Us Investor Contact Investor Relations B. Riley Financial, Inc. ir@brileyfin.com Tel: (818) 966 - 1444 11100 Santa Monica Blvd ., Suite 800 Los Angeles , CA 90025 www.brileyfin.com