Attached files
| file | filename |
|---|---|
| EX-99.1 - EX-99.1 - Alta Mesa Resources, Inc. /DE | d587274dex991.htm |
| 8-K - FORM 8-K - Alta Mesa Resources, Inc. /DE | d587274d8k.htm |
| Exhibit 99.2
|
Alta Mesa Resources, Inc. First Quarter 2018 Operational Update May 14, 2018
|
2 Disclaimer FORWARD-LOOKING STATEMENTS The information in this presentation and the oral statements made in connection therewith include “forward-looking statements” within the meaning of Section 27A of the Securities Act of 1933, as amended, and Section 21E of the Securities Exchange Act of 1934, as amended. All statements, other than statements of present or historical fact included in this presentation, regarding our strategy, future operations, financial position, growth, returns, free cash flow, liquidity, budget, drilling and development plans, pipeline construction, projected costs, prospects, and objectives of management are forward-looking statements. When used in this presentation, including any oral statements made in connection therewith, the words “could,” “should,” “will,” “may,” “believe,” “anticipate,” “intend,” “estimate,” “expect,” “project,” the negative of such terms and other similar expressions are intended to identify forward-looking statements, although not all forward-looking statements contain such identifying words. These forward-looking statements are based on management’s current expectations and assumptions about future events and are based on currently available information as to the outcome and timing of future events. We caution you that these forward-looking statements are subject to all of the risks and uncertainties, most of which are difficult to predict and many of which are beyond our control, incident to the development, production, gathering and sale of oil, natural gas and natural gas liquids. These risks include, but are not limited to, commodity price volatility, low prices for oil and/or natural gas, global economic conditions, inflation, increased operating costs, lack of availability of drilling and production equipment, supplies, services and qualified personnel, processing volumes and pipeline throughput, uncertainties related to new technologies, geographical concentration of operations of our subsidiaries Alta Mesa Holdings, LP (“Alta Mesa”) and Kingfisher Midstream, LLC (“KFM”), environmental risks, weather risks, security risks, drilling and other operating risks, regulatory changes, the uncertainty inherent in estimating oil and natural gas reserves and in projecting future rates of production, reductions in cash flow, lack of access to capital, Alta Mesa’s and KFM’s ability to satisfy future cash obligations, restrictions in existing or future debt agreements of Alta Mesa or KFM, the timing of development expenditures, managing Alta Mesa’s and KFM’s growth and integration of acquisitions, failure to realize expected value creation from property acquisitions, title defects and limited control over non-operated properties, our ability to complete an initial public offering of the KFM midstream business and the other risks described in our filings with the Securities and Exchange Commission (the “SEC”). Should one or more of the risks or uncertainties described in this presentation and the oral statements made in connection therewith occur, or should underlying assumptions prove incorrect, our actual results and plans could differ materially from those expressed in any forward-looking statements. Except as otherwise required by applicable law, we disclaim any duty to update any forward-looking statements, all of which are expressly qualified by the statements in this section, to reflect events or circumstances after the date of this presentation. RESERVE INFORMATION Reserve engineering is a process of estimating underground accumulations of hydrocarbons that cannot be measured in an exact way. The accuracy of any reserve estimate depends on the quality of available data, the interpretation of such data and price and cost assumptions made by reserve engineers. In addition, the results of drilling, testing and production activities may justify revisions of estimates that were made previously. If significant, such revisions could impact our strategy and change the schedule of any further production and development drilling. Accordingly, reserve estimates may differ significantly from the quantities of oil and natural gas that are ultimately recovered. Estimated Ultimate Recoveries, or “EURs,” refers to estimates of the sum of total gross remaining proved reserves per well as of a given date and cumulative production prior to such given date for developed wells. These quantities do not necessarily constitute or represent reserves as defined by the SEC and are not intended to be representative of anticipated future well results of all wells drilled on our STACK acreage. INDUSTRY AND MARKET DATA This presentation has been prepared by us and includes market data and other statistical information from sources we believe to be reliable, including independent industry publications, government publications or other published independent sources. Some data is also based on our good faith estimates, which are derived from our review of internal sources as well as the independent sources described above. Although we believe these sources are reliable, we have not independently verified the information and cannot guarantee its accuracy and completeness. TRADEMARKS AND TRADE NAMES We own or have rights to various trademarks, service marks and trade names we use in connection with the operation of our business. This presentation also contains trademarks, service marks and trade names of third parties, which are the property of their respective owners. The use or display of third parties’ trademarks, service marks, trade names or products in this presentation is not intended to, and does not imply, a relationship with us, or an endorsement or sponsorship by or of us. Solely for convenience, the trademarks, service marks and trade names referred to in this presentation may appear without the ®, TM or SM symbols, but such references are not intended to indicate, in any way, that we will not assert, to the fullest extent under applicable law, our rights or the right of the applicable licensor to these trademarks, service marks and trade names.
|
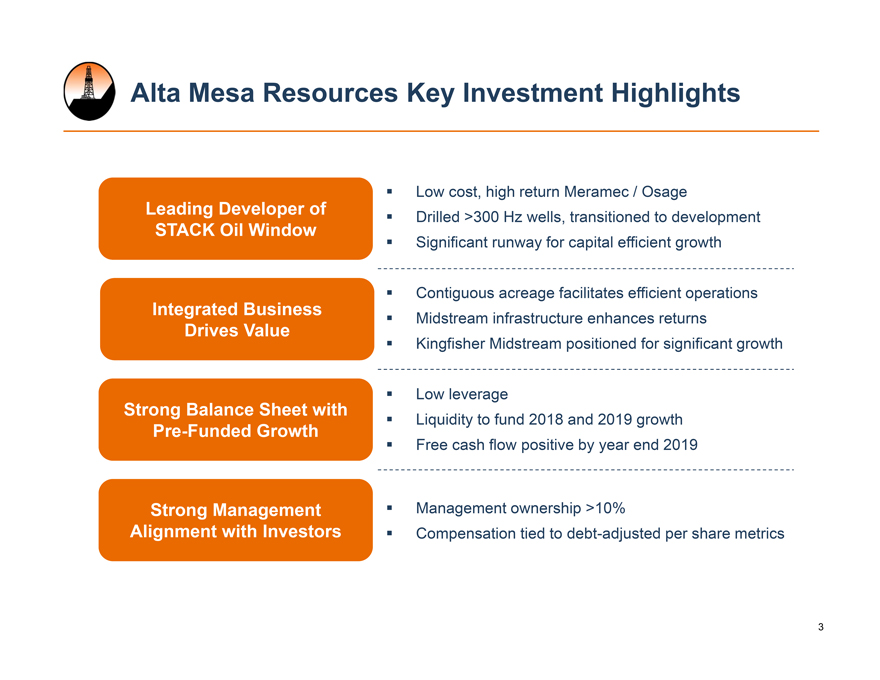
Alta Mesa Resources Key Investment Highlights Leading Developer of STACK Oil Window Integrated Business Drives Value Strong Balance Sheet with Pre-Funded Growth Strong Management Alignment with Investors ï,§ Low cost, high return Meramec / Osage ï,§ Drilled >300 Hz wells, transitioned to development ï,§ Significant runway for capital efficient growth ï,§ Contiguous acreage facilitates efficient operations ï,§ Midstream infrastructure enhances returns ï,§ Kingfisher Midstream positioned for significant growth ï,§ Low leverage ï,§ Liquidity to fund 2018 and 2019 growth ï,§ Free cash flow positive by year end 2019 ï,§ Management ownership >10% ï,§ Compensation tied to debt-adjusted per share metrics 3
|
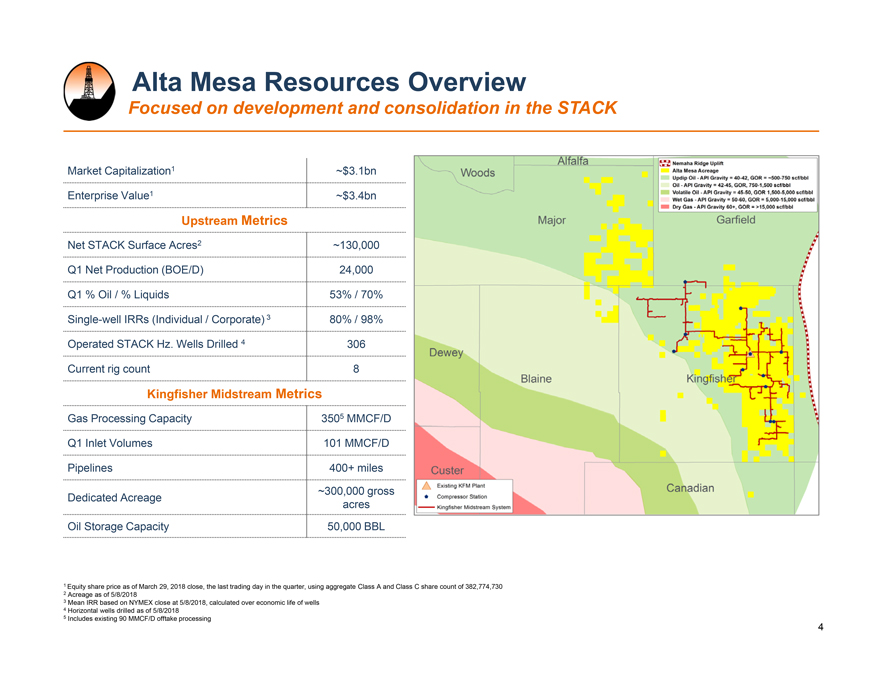
Alta Mesa Resources Overview Focused on development and consolidation in the STACK Market Capitalization1 ~$3.1bn Enterprise Value1 ~$3.4bn Upstream Metrics Net STACK Surface Acres2 ~130,000 Q1 Net Production (BOE/D) 24,000 Q1 % Oil / % Liquids 53% / 70% Single-well IRRs (Individual / Corporate) 3 80% / 98% Operated STACK Hz. Wells Drilled 4 306 Current rig count 8 Kingfisher Midstream Metrics Gas Processing Capacity 3505 MMCF/D Q1 Inlet Volumes 101 MMCF/D Pipelines 400+ miles Dedicated Acreage ~300,000 gross acres Oil Storage Capacity 50,000 BBL 1 Equity share price as of March 29, 2018 close, the last trading day in the quarter, using aggregate Class A and Class C share count of 382,774,730 2 Acreage as of 5/8/2018 3 Mean IRR based on NYMEX close at 5/8/2018, calculated over economic life of wells 4 Horizontal wells drilled as of 5/8/2018 5 Includes existing 90 MMCF/D offtake processing 4
|
Recent Highlights Successful completion of business combination and continued plan execution ï,§ Completed business combination on February 9, creating pure-play STACK-focused company ï,§ 1Q18 net production 24,000 BOE/D, a 24% increase from 1Q17 — Exited March with net production of ~25,800 BOE/D — >260 wells producing, including 11 multi well pads — 16% gross operated horizontal production increase quarter over quarter ï,§ 8th rig added in May to support full year plan ï,§ Expanded Kingfisher Midstream leadership and business development team ï,§ 200 MMCFD Kingfisher Midstream plant expansion placed in service in April ï,§ Launched Cimarron Express crude pipeline to Cushing ï,§ Ended quarter with $261mm in cash for total liquidity in excess of $700mm 5
|
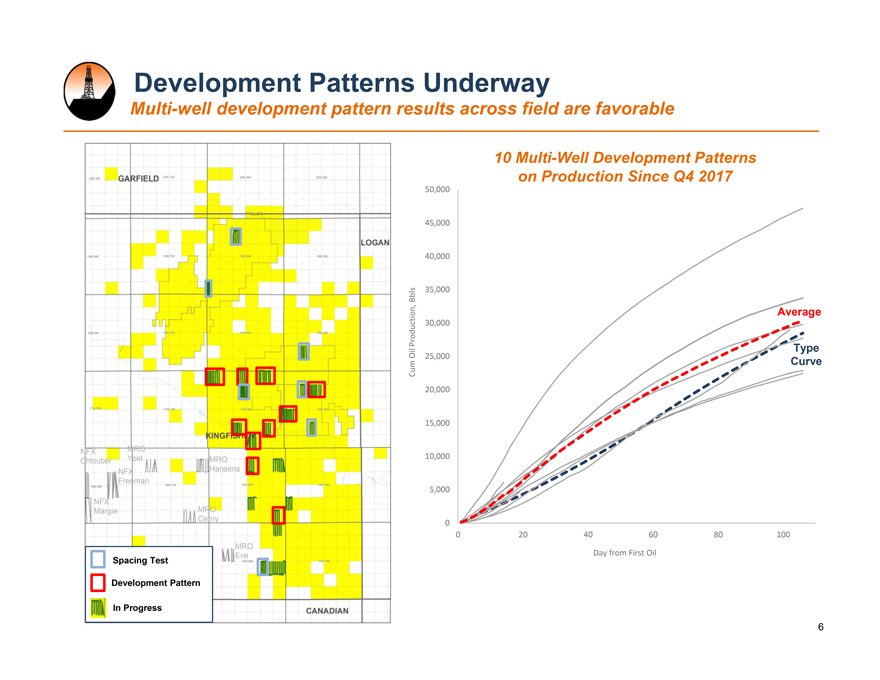
Development Patterns Underway Multi-well development pattern results across field are favorable MRO Hansens MRO Eve MRO Cerny NFX Freeman NFX Chlouber NFX Margie MRO Yost 0 5,000 10,000 15,000 20,000 25,000 30,000 35,000 40,000 45,000 50,000 0 20 40 60 80 100 Cum Oil Production, Bbls Day from First Oil Spacing Test Development Pattern In Progress 10 Multi-Well Development Patterns on Production Since Q4 2017 Average Type Curve 6
|
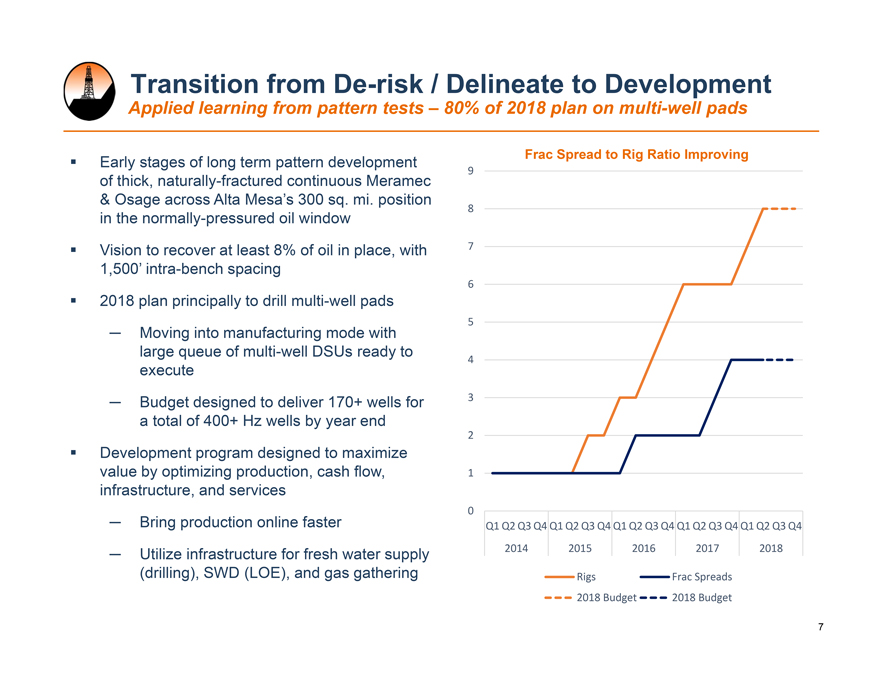
0 1 2 3 4 5 6 7 8 9 Q1 Q2 Q3 Q4 Q1 Q2 Q3 Q4 Q1 Q2 Q3 Q4 Q1 Q2 Q3 Q4 Q1 Q2 Q3 Q4 2014 2015 2016 2017 2018 Rigs Frac Spreads 2018 Budget 2018 Budget Transition from De-risk / Delineate to Development Applied learning from pattern tests – 80% of 2018 plan on multi-well pads Frac Spread to Rig Ratio Improving 7 ï,§ Early stages of long term pattern development of thick, naturally-fractured continuous Meramec & Osage across Alta Mesa’s 300 sq. mi. position in the normally-pressured oil window ï,§ Vision to recover at least 8% of oil in place, with 1,500’ intra-bench spacing ï,§ 2018 plan principally to drill multi-well pads — Moving into manufacturing mode with large queue of multi-well DSUs ready to execute — Budget designed to deliver 170+ wells for a total of 400+ Hz wells by year end ï,§ Development program designed to maximize value by optimizing production, cash flow, infrastructure, and services — Bring production online faster — Utilize infrastructure for fresh water supply (drilling), SWD (LOE), and gas gathering
|
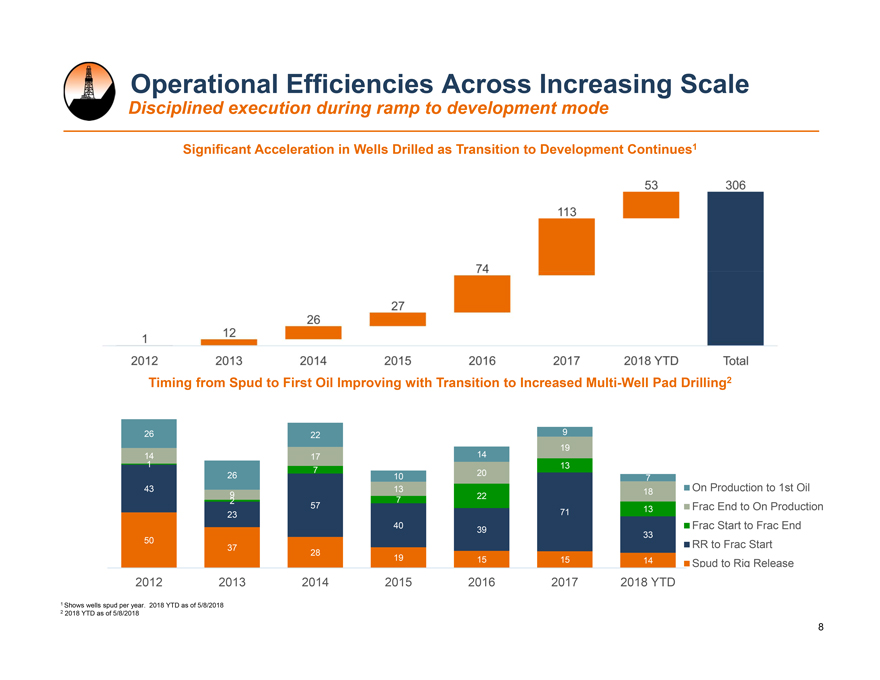
2012 2014 2016 2018 On Production to 1st Oil Frac End to On Production Frac Start to Frac End RR to Frac Start Spud to Rig Release Operational Efficiencies Across Increasing Scale Disciplined execution during ramp to development mode Significant Acceleration in Wells Drilled as Transition to Development Continues1 50 37 28 19 15 15 14 43 23 57 40 39 71 33 1 2 7 7 22 13 13 14 9 17 13 20 19 18 26 26 22 10 14 9 7 0 2012 2013 2014 2015 2016 2017 2018 YTD Timing from Spud to First Oil Improving with Transition to Increased Multi-Well Pad Drilling2 1 Shows wells spud per year. 2018 YTD as of 5/8/2018 2 2018 YTD as of 5/8/2018 8
|
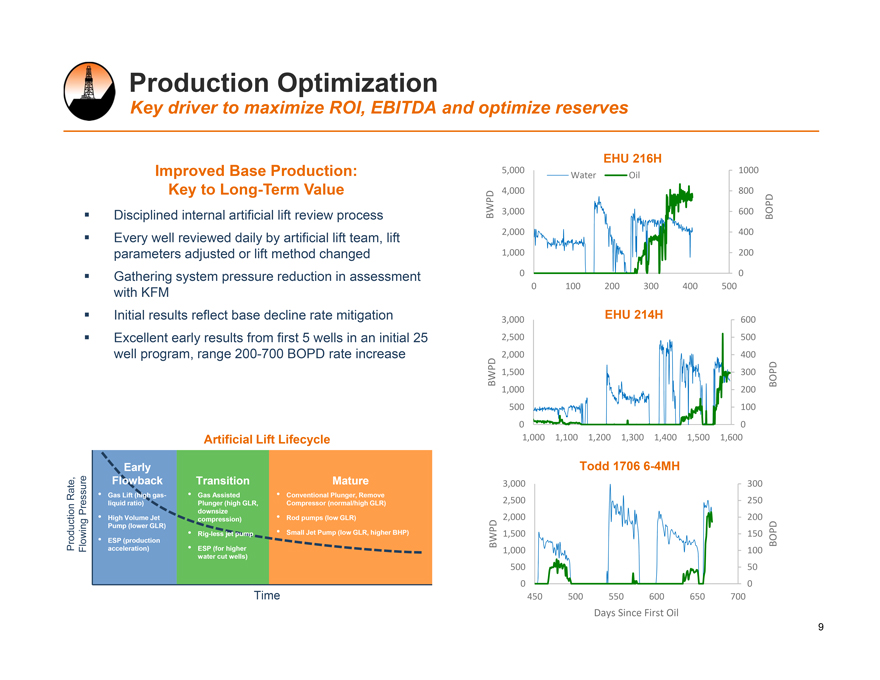
Production Optimization Key driver to maximize ROI, EBITDA and optimize reserves Improved Base Production: Key to Long-Term Value EHU 216H ï,§ Disciplined internal artificial lift review process ï,§ Every well reviewed daily by artificial lift team, lift parameters adjusted or lift method changed ï,§ Gathering system pressure reduction in assessment with KFM ï,§ Initial results reflect base decline rate mitigation ï,§ Excellent early results from first 5 wells in an initial 25 well program, range 200-700 BOPD rate increase Time Production Rate, Flowing Pressure Early Flowback Transition Mature • Gas Lift (high gasliquid ratio) • High Volume Jet Pump (lower GLR) • ESP (production acceleration) • Gas Assisted Plunger (high GLR, downsize compression) • Rig-less jet pump • ESP (for higher water cut wells) • Conventional Plunger, Remove Compressor (normal/high GLR) • Rod pumps (low GLR) • Small Jet Pump (low GLR, higher BHP) Artificial Lift Lifecycle 0 200 400 600 800 1000 0 1,000 2,000 3,000 4,000 5,000 0 100 200 300 400 500 BOPD BWPD Water Oil 0 100 200 300 400 500 600 0 500 1,000 1,500 2,000 2,500 3,000 1,000 1,100 1,200 1,300 1,400 1,500 1,600 BOPD BWPD EHU 214H 0 50 100 150 200 250 300 0 500 1,000 1,500 2,000 2,500 3,000 450 500 550 600 650 700 BOPD BWPD Days Since First Oil Todd 1706 6-4MH 9
|
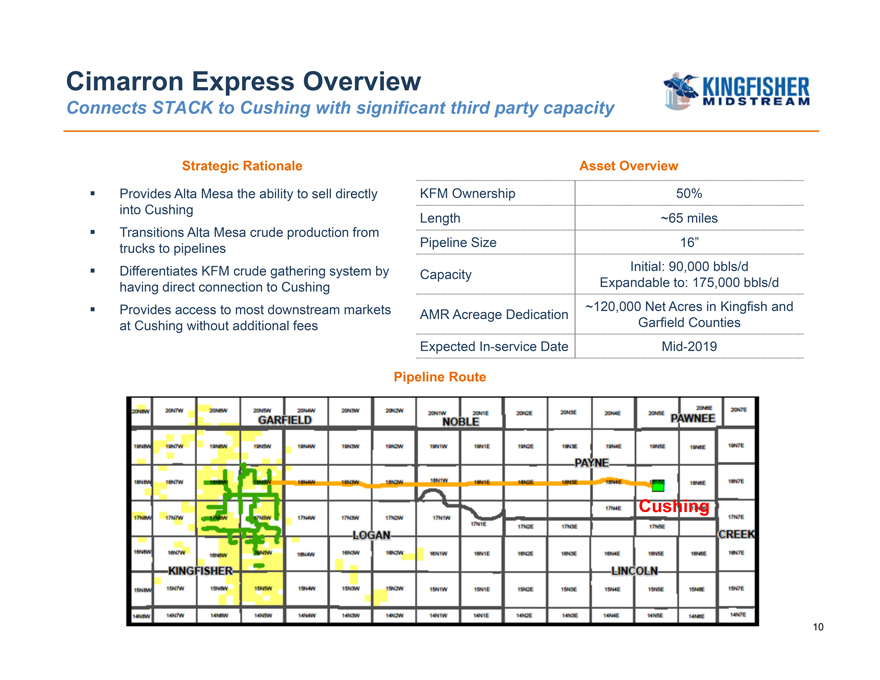
Cimarron Express Overview Connects STACK to Cushing with significant third party capacity KFM Ownership 50% Length ~65 miles Pipeline Size 16” Capacity Initial: 90,000 bbls/d Expandable to: 175,000 bbls/d AMR Acreage Dedication ~120,000 Net Acres in Kingfish and Garfield Counties Expected In-service Date Mid-2019 Strategic Rationale Pipeline Route ï,§ Provides Alta Mesa the ability to sell directly into Cushing ï,§ Transitions Alta Mesa crude production from trucks to pipelines ï,§ Differentiates KFM crude gathering system by having direct connection to Cushing ï,§ Provides access to most downstream markets at Cushing without additional fees Asset Overview Cushing 10
|
APPENDIX
|
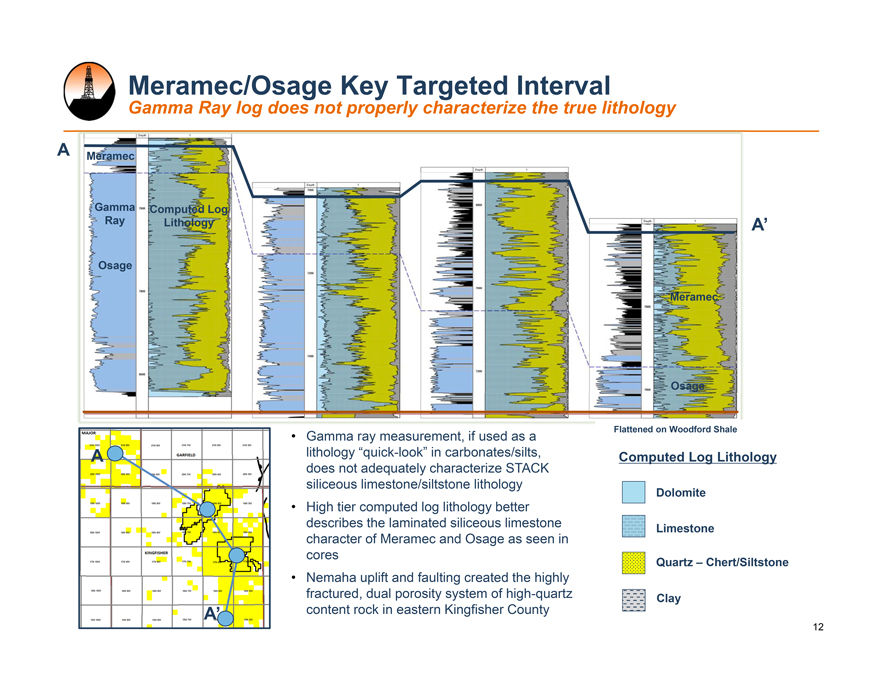
Flattened on Woodford Shale A A’ Meramec/Osage Key Targeted Interval Gamma Ray log does not properly characterize the true lithology Osage Meramec Gamma Ray Computed Log Lithology Meramec Osage A A’ • Gamma ray measurement, if used as a lithology “quick-look” in carbonates/silts, does not adequately characterize STACK siliceous limestone/siltstone lithology • High tier computed log lithology better describes the laminated siliceous limestone character of Meramec and Osage as seen in cores • Nemaha uplift and faulting created the highly fractured, dual porosity system of high-quartz content rock in eastern Kingfisher County Limestone Dolomite Quartz – Chert/Siltstone Clay Computed Log Lithology 12
|
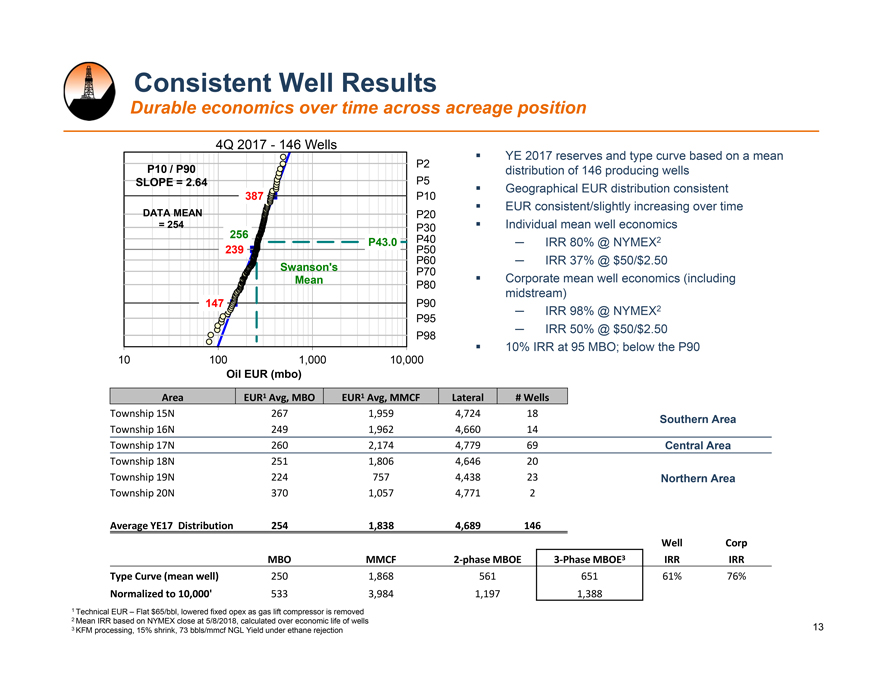
YE 2017 reserves and type curve based on a mean distribution of 146 producing wells ï,§ Geographical EUR distribution consistent ï,§ EUR consistent/slightly increasing over time ï,§ Individual mean well economics — IRR 80% @ NYMEX2 — IRR 37% @ $50/$2.50 ï,§ Corporate mean well economics (including midstream) — IRR 98% @ NYMEX2 — IRR 50% @ $50/$2.50 ï,§ 10% IRR at 95 MBO; below the P90 147 239 387 P2 P5 P10 P20 P30 P40 P50 P60 P70 P80 P90 P95 P98 256 P43.0 Swanson’s Mean 10 100 1,000 10,000 Oil EUR (mbo) 4Q 2017—146 Wells P10 / P90 SLOPE = 2.64 DATA MEAN = 254 Consistent Well Results Durable economics over time across acreage position 1 Technical EUR – Flat $65/bbl, lowered fixed opex as gas lift compressor is removed 2 Mean IRR based on NYMEX close at 5/8/2018, calculated over economic life of wells 3 KFM processing, 15% shrink, 73 bbls/mmcf NGL Yield under ethane rejection Area EUR1 Avg, MBO EUR1 Avg, MMCF Lateral # Wells Township 15N 267 1,959 4,724 18 Township 16N 249 1,962 4,660 14 Township 17N 260 2,174 4,779 69 Township 18N 251 1,806 4,646 20 Township 19N 224 757 4,438 23 Township 20N 370 1,057 4,771 2 Average YE17 Distribution 254 1,838 4,689 146 Well Corp MBO MMCF 2-phase MBOE 3-Phase MBOE3 IRR IRR Type Curve (mean well) 250 1,868 561 651 61% 76% Normalized to 10,000’ 533 3,984 1,197 1,388 Southern Area Central Area Northern Area 13
|
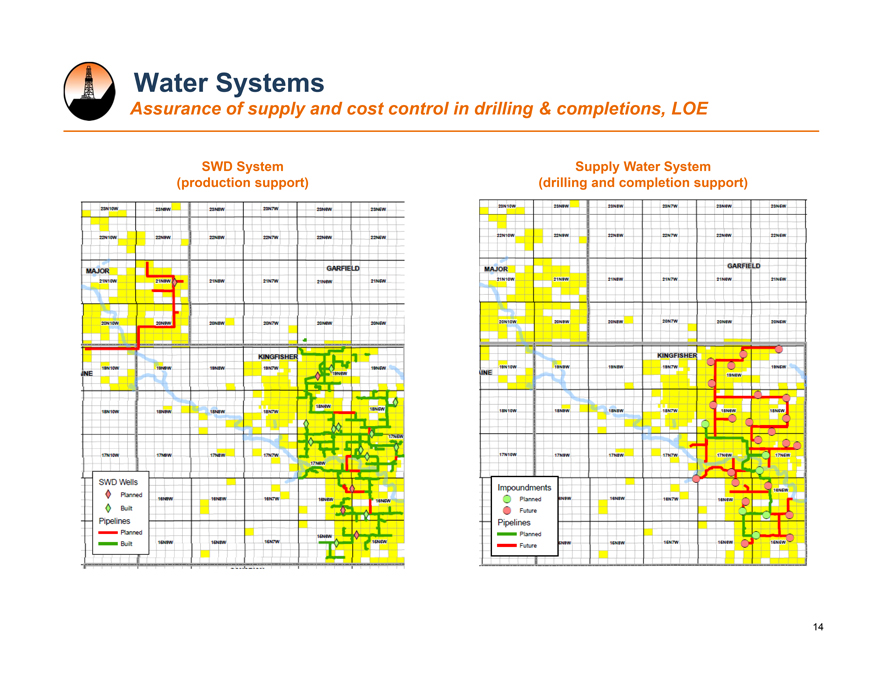
Supply Water System (drilling and completion support) Water Systems Assurance of supply and cost control in drilling & completions, LOE SWD System (production support) 14
|
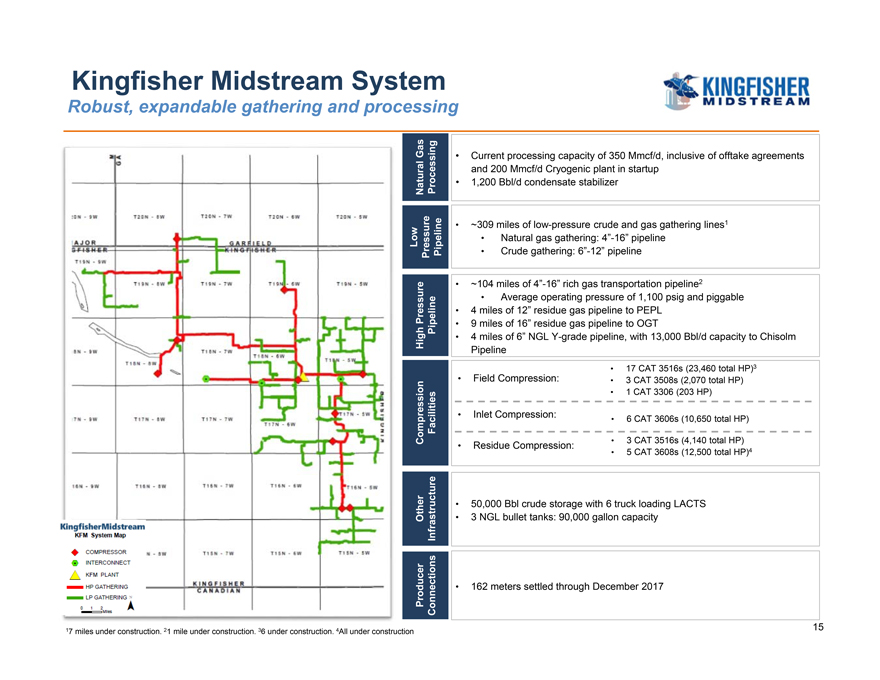
• 3 CAT 3516s (4,140 total HP) • 5 CAT 3608s (12,500 total HP)4 • 6 CAT 3606s (10,650 total HP) • 17 CAT 3516s (23,460 total HP)3 • 3 CAT 3508s (2,070 total HP) • 1 CAT 3306 (203 HP) High Pressure Pipeline Producer Connections Natural Gas Processing Compression Facilities Low Pressure Pipeline Other Infrastructure • Current processing capacity of 350 Mmcf/d, inclusive of offtake agreements and 200 Mmcf/d Cryogenic plant in startup • 1,200 Bbl/d condensate stabilizer • ~309 miles of low-pressure crude and gas gathering lines1 • Natural gas gathering: 4”-16” pipeline • Crude gathering: 6”-12” pipeline • ~104 miles of 4”-16” rich gas transportation pipeline2 • Average operating pressure of 1,100 psig and piggable • 4 miles of 12” residue gas pipeline to PEPL • 9 miles of 16” residue gas pipeline to OGT • 4 miles of 6” NGL Y-grade pipeline, with 13,000 Bbl/d capacity to Chisolm Pipeline • Field Compression: • Inlet Compression: • Residue Compression: • 50,000 Bbl crude storage with 6 truck loading LACTS • 3 NGL bullet tanks: 90,000 gallon capacity • 162 meters settled through December 2017 17 miles under construction. 21 mile under construction. 36 under construction. 4All under construction Kingfisher Midstream System Robust, expandable gathering and processing 15
|
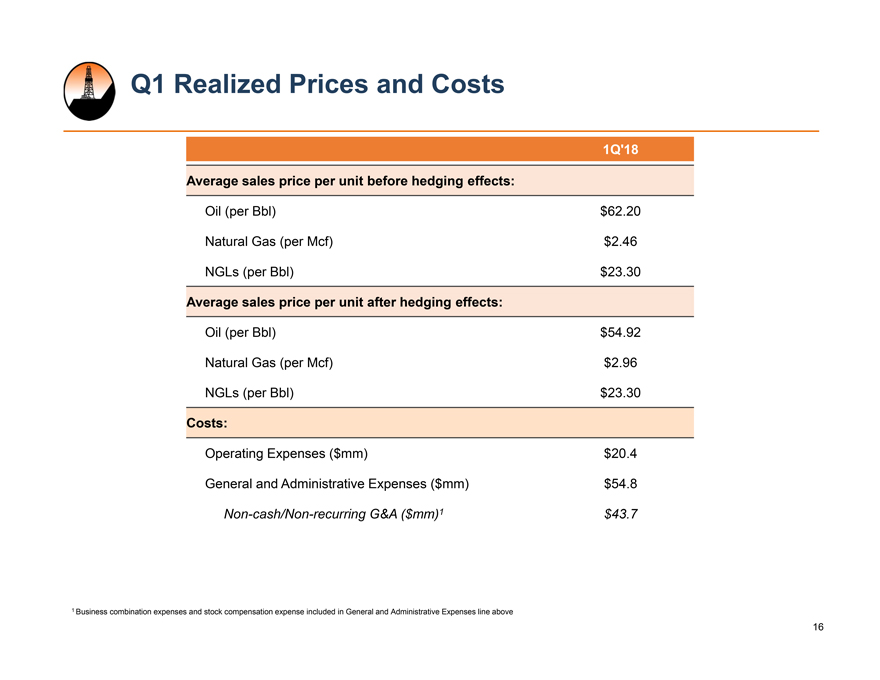
Q1 Realized Prices and Costs 16 1Q’18 Average sales price per unit before hedging effects: Oil (per Bbl) $62.20 Natural Gas (per Mcf) $2.46 NGLs (per Bbl) $23.30 Average sales price per unit after hedging effects: Oil (per Bbl) $54.92 Natural Gas (per Mcf) $2.96 NGLs (per Bbl) $23.30 Costs: Operating Expenses ($mm) $20.4 General and Administrative Expenses ($mm) $54.8 Non-cash/Non-recurring G&A ($mm)1 $43.7 1 Business combination expenses and stock compensation expense included in General and Administrative Expenses line above