Attached files
| file | filename |
|---|---|
| EX-99.2 - LETTER TO SHAREHOLDERS, DATED MAY 10, 2018 - YELP INC | yelp3263138-ex992.pdf |
| EX-99.1 - PRESS RELEASE, DATED MAY 10, 2018 - YELP INC | yelp3263138-ex991.htm |
| 8-K - CURRENT REPORT - YELP INC | yelp3263138-8k.htm |
| 2 | Q1 2018 |
First Quarter 2018
Financial Highlights
| > | First quarter net revenue of $223 million exceeded our outlook, driven by broad-based strength in Yelp’s advertising business. Revenue grew 13% year to year on a reported basis, and 22% excluding revenue from Eat24, which we sold to Grubhub in October 2017, and from Nowait and Turnstyle, which we acquired in 2017. |
| > | Net loss improved to ($2) million, or ($0.03) per share, compared to a net loss of ($4) million, or ($0.05) per share, in the first quarter of 2017. |
| > | Adjusted EBITDA of $33 million increased $3 million compared to the first quarter of 2017. |
| > | Cash flow from operations was $38 million and we finished the quarter with cash, cash equivalents and marketable securities of $830 million. |
| > | We repurchased approximately 822,000 shares of Yelp stock during the quarter at a cost of $33 million. |
Operational Highlights
| Advertising revenue | Transactions revenue | Other services revenue | ||
 |
 |
 | ||
| App unique devices | Paying advertiser accounts | Cumulative reviews | ||
 |
 |
 |
*Reflects the sale of Eat24
**Reflects the acquisition of Nowait and Turnstyle

| 3 | Q1 2018 |
|
Dear fellow
shareholders, | ||

Jeremy Stoppelman |
Starting this quarter, we will communicate our results by publishing a Shareholder Letter. We will also webcast a conference call to answer analysts’ questions about our business. We believe the new format will allow us to share more informative insights about the business and our strategy, as well as provide timely updates on the progress we are making. We hope you’ll find it valuable. As always, we welcome your feedback. “We had a great start to 2018, accelerating advertising revenue growth and attracting a record number of new advertisers in the first quarter. The expansion of our non-term advertising product is showing promising results and we are raising our full-year revenue and adjusted EBITDA outlook.” |

| 4 | Q1 2018 |
| Evolving the business, while staying true to Yelp’s mission |
A lot has changed since our initial public offering back in March 2012. In those days, our traffic came primarily from the web. Our resources were focused on introducing Yelp to new local communities and growing our review base to boost organic search placement. We offered a single advertising solution, primarily to small- and medium-sized businesses, sold entirely through our local salesforce. For the fiscal year 2011, we reported net revenue of $83 million.
Fast forward to today. We have developed the Yelp app into a top mobile property accessed on more than 30 million unique devices on a monthly average basis. We have designed marketing solutions to address the unique needs of advertisers, from the neighborhood shop to national enterprises with hundreds of locations. These solutions are more dynamic, allowing clients to customize their campaigns and tailor their spending. We have expanded our distribution, with the self-serve and multi-location channels together generating nearly a third of advertising revenue. We have also elevated the consumer experience by expanding transactional features to well over one million business locations. Based on our outlook for 2018, we expect to generate net revenue of $943 to $967 million, which would be more than a tenfold increase from our annual revenue at the IPO. We are also expecting yet another year of strong operating cash flow.
Although much has changed about our business over the last several years, our mission to connect consumers with great local businesses remains as powerful a guiding principle as it was at Yelp’s founding. Every day, Yelp connects millions of consumers and local businesses, and everything we are doing today is aimed at increasing the volume and value of those connections far into the future.
30 Million App
Unique Devices

| 5 | Q1 2018 |
| Driving usage to win in mobile |
Winning in mobile requires high frequency usage. It’s one reason why we are so committed to the Restaurants category. Our Restaurants offerings drive significant traffic to Yelp on a daily basis and have been instrumental in achieving penetration of more than one-third of U.S. smartphones. Our strength in Restaurants—where we generate more than half of our traffic—provides Yelp with a sustainable advantage in user acquisition. Unlike the many peer Internet companies with customer acquisition costs exceeding 20% of revenue, we expect to spend a mid-single digit percentage of net revenue in 2018 to attract and grow a monthly audience that already exceeds the domestic unique visitors of some of the largest names on the Internet.
To attract more new users and heighten engagement, we are investing and innovating in the Restaurants category. Today, Yelp helps consumers do more than just discover the best restaurants near them. We are helping them book a table, join the waitlist, and order pickup or delivery at more of the great restaurants they find. To increase the number of restaurants connected to Yelp, we are deploying a dedicated Yelp Reservations and Nowait salesforce. We are also partnering with industry leaders like Grubhub to rapidly expand and upgrade the supply of restaurants available for pickup and delivery on Yelp.
For a more engaging experience in the Restaurants category, we are evolving our mobile app. We are using our review and photo content to provide app users with richly-detailed personalized recommendations. We are introducing new ways to search and filter restaurants according to diner preferences and seating and ordering availability. We believe our focus on restaurants will drive the growth and engagement of our app user base over the next several years. But make no mistake, Yelp has always been about much more than restaurants.
ComScore Top
App Properties
| 1 | |
| 2 | |
| 3 | Snapchat |
| 25 | Yelp |
| 100+ | TripAdvisor |
| Angi HomeServices | |
| OpenTable |
Personalized
Recommendations

| 6 | Q1 2018 |
| Amplifying monetization in our core business |
The vast majority of our advertising revenue comes from businesses in categories other than Restaurants and our monetization strategies capitalize on Yelp’s unique appeal across the full breadth of local businesses. For instance, our focus on Home & Local Services reflects the attractive economics of that category, where consumer purchases are large and customer connections are highly valuable to service providers.
To put the potential of our monetization strategy into context, consider that in April about three-quarters of app users who browsed or searched in the Home & Local Services category had previously browsed or searched in the Restaurants category during the preceding six months. To drive more revenue from these connections, we are evolving our advertising offerings and go-to-market strategy.
Advertisers want to customize and control their advertising and we are delivering more tools and more data to help businesses reach high-intent consumers on Yelp. In March, we introduced Yelp Custom Ads, allowing advertisers to select the photos and reviews presented in their ad campaigns. One-third of our new advertisers are now using this feature and it is already positively impacting client satisfaction.
We are elevating the quality of our leads for businesses in high-monetization categories, such as Home & Local Services, where revenue grew one-and-a-half times faster year on year than all other business categories combined in the first quarter. Much of that growth is attributable to the popularity of Request-A-Quote. We are providing more detailed information about service providers’ offerings and introducing structured requests for better matching. Our improved messaging tools for business owners are also driving even faster response times, with more than half of requests receiving responses within an hour.
In the first quarter, consumers sent service providers more than four million Requests and there are now more than one million professionals receiving these leads. Based on March results, Request-A-Quote is generating revenue of more than $23 million on an annual run rate, a sizable increase from the $18 million December run rate we reported last quarter.
Improved
Messaging Tools


| 7 | Q1 2018 |
We are working closely with our advertisers to ensure they have the best possible experience on our platform. Our Client Success teams are driving greater advertiser satisfaction, which directly contributes to the health and growth of our business. We have significantly reduced account cancellations since early 2017, and our upselling efforts have contributed meaningfully to advertising revenue growth over the past year.
Our advertising products are now easier than ever to buy. We have revamped our self-serve offering, enabling clients to conveniently self-provision campaigns, choose individual products, and purchase without a multi-month commitment. Self serve remains our fastest growing channel and we expect it to contribute to revenue growth for years to come. In the first quarter, we also introduced the Yelp Ads Certified Partner program, providing approved third-party marketing agencies with the ability to purchase and manage Yelp ads campaigns on behalf of their small and medium-sized business clients.
The gains we have made in advertiser acquisition and revenue retention are also paving the way for advances in the distribution of our ad products. Our considered transition away from offering fixed-term contracts in favor of more flexible, open-ended contracts is a great example.
The popularity of our flexible and customizable self-serve offering led us to pilot selling that same product via our salesforce more than a year ago. Client response has been overwhelmingly positive, and we carefully tested and scaled the program during 2017. By the end of the first quarter of 2018, we had migrated the majority of our salesforce to selling these non-term contracts and—as you can see in our first quarter results—we experienced record quarterly advertiser account additions and accelerating year-over-year advertising revenue growth.
We have continued to attract longer duration advertisers just as we did selling fixed-term contracts. By making our advertising products more accessible, we have also opened up the opportunity for first-time advertisers to try Yelp and addressed a challenge that seasonal advertisers experienced with our prior fixed-term approach.
Advertising Revenue
by Category
![]()
Net Paying Advertising
Account Additions

| 8 | Q1 2018 |
Pursuing monetization opportunities beyond the core
Outside of our core advertising business, we are building our transactions capabilities and raising the visibility of transactions throughout the Yelp product. The Grubhub integration brought the number of restaurants available for online food ordering on the Yelp app to around 80,000. We have seen an uptick in food orders on Yelp and an increase in repeat customer orders in conjunction with the added restaurant supply. The growth of transactions extends beyond restaurants. We have also seen more transactions in many other categories—including Beauty & Fitness—as we have added more transactable businesses and increased consumers’ awareness.
Of course, with our large active user base, driving greater awareness of our transactional offerings, particularly in Restaurants, is a top priority. In March, 1 in 65 of our app users ordered food on Yelp, and we see significant opportunity to introduce more users to Yelp’s transactional experiences for restaurants. We have added a new tab for online food ordering and delivery and created carousels that highlight the great restaurants and most popular dishes now available on Yelp.
And while it is early, our increased investments in Yelp Reservations and Nowait are also yielding promising progress. In the first quarter of 2018, we grew the number of diners seated via Yelp by 27% quarter over quarter, and both diner and business owner feedback has been strong. These experiences resonate with our large consumer audience and create significant value for our clients.
New Delivery Interface

| 9 | Q1 2018 |
Positioned to drive strong growth, today and into the future
We are encouraged by our recent progress and excited about Yelp’s future. We have strengthened the core business, re-accelerating Advertising revenue growth by reducing onboarding friction and offering customers more flexibility, support and control. Our competitive advantages in scale and coverage are clear and our strategy to deepen Yelp’s product moats and elevate financial performance is proving effective. We are attracting more users and increasing engagement by taking advantage of our strength in the Restaurants category, while driving more revenue and increasing growth by focusing on high monetization categories like Home & Local Services. Financially, Yelp is as healthy as ever, with a strong balance sheet and consistent cash flow to support our long-term growth strategy. We look forward to connecting with you again next quarter.
 |
 |
| 10 | Q1 2018 |
Financial Review &
Business Outlook
Financial results for 2016 and 2017 have been recast in accordance with ASC 606, which we adopted on January 1, 2018, as detailed in our 10-K and 10-Q SEC filings.
Strong First Quarter Results
First quarter revenue and adjusted EBITDA were greater than expected, propelled primarily by advertising revenue momentum. Total revenue grew to $223 million in the first quarter of 2018, an increase of 13% over the first quarter of 2017. Excluding the impacts of the sale of Eat24 to Grubhub and the acquisitions of Nowait and Turnstyle, revenue grew by 22% year to year. Net Loss improved to ($2) million in the first quarter of 2018 compared to ($4) million a year ago. Adjusted EBITDA was $33 million in the first quarter, up 10% from $30 million in the first quarter of 2017.
Based on first quarter results and the positive underlying trends across the business, we have updated our Business Outlook for 2018. Full year revenue is now expected to be in the range of $943 to $967 million with adjusted EBITDA of $179 to $188 million. Details of the revised Business Outlook appear later in this letter.
Total Revenue

Adjusted EBITDA

| 11 | Q1 2018 |
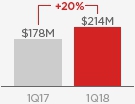
Advertising revenue growth accelerates
Advertising revenue was $214 million in the first quarter of 2018, a 20% increase over first quarter 2017, driven by strong sales productivity and a 29% increase in the size of the local salesforce. The strength in advertising revenue in the first quarter also reflects a record increase in advertising customers during the quarter. Paying advertising accounts increased sequentially by 14,000 to 177,000 for the first quarter, up 27% year to year. The increase in advertising accounts was primarily due to strong sales productivity driven by the positive response to our transition to offering non-term contracts.
Transactions revenue was $4 million in the first quarter of 2018 compared to $18 million in the same period a year earlier. The decrease in transactions revenue reflects the absence of revenue from Eat24, which we sold in October 2017 and which generated $17 million in revenue in the first quarter of 2017. Subsequent to the sale of Eat24, the majority of transactions revenue is derived from the partnership with Grubhub, in which Yelp is paid a fee for food orders originating on Yelp and sent to Grubhub for fulfillment.
Other services revenue was $5 million for the first quarter of 2018, up from $2 million in the first quarter of 2017 due to the acquisitions of Nowait and Turnstyle in February and April 2017, respectively, as well as the growth of Yelp Reservations since a year ago.
| Three Months Ended March 31, | |||||||
| 2018 | 2017 | ||||||
| Net revenue by product | |||||||
| Advertising | $ | 214,043 | $ | 177,900 | |||
| Transactions | 3,839 | 18,065 | |||||
| Other services | 5,192 | 2,209 | |||||
| Total net revenue | $ | 223,074 | $ | 198,174 | |||
| 12 | Q1 2018 |
Expenses & Adjusted EBITDA
Total costs and expenses were $228 million in the first quarter of 2018, up 12% from $203 million in the first quarter of 2017, driven primarily by a 21% increase year to year in the average number of Yelp employees. Employee-related expenses accounted for slightly more than 60% of total costs and expenses.
Cost of revenue was $15 million, down ($2) million or (13%) year to year due primarily to the sale of Eat24. Gross profit was $208 million, up 15% from first quarter 2017. Gross margins improved by one percentage point sequentially and two percentage points year over year, reaching 93% in the first quarter.
Sales and marketing expenses totalled $120 million in the first quarter of 2018, up 10% from a year ago driven by expenses associated with a 29% increase in the average number of sales employees since the first quarter of 2017. Marketing expenditures declined by more than 30% year to year, reflecting the sale of Eat24 and a shift toward more efficient performance-based activities.
Product development expenses were $51 million in the first quarter of 2018, up 29% year over year driven by greater investment in the Yelp consumer experience, the business owner product portfolio, and supporting infrastructure and systems.
General and administrative expenses were $32 million in the first quarter of 2018, up 18% from the same quarter of 2017. Bad debt expense increased by $2 million year to year as a result of the increase in advertising revenue, while other general and administrative expenses grew 12% year to year on employee growth.
Adjusted EBITDA was $33 million in the first quarter of 2018, up 10% from the first quarter of 2017. Adjusted EBITDA margins were 15% in the first quarter, down slightly from the 2017 period, primarily due to investment in employee growth in sales and product development. Stock-based compensation was $28 million in the quarter, $3 million or 14% higher than in the same quarter of 2017.
S&M % of Revenue

PD % of Revenue

G&A % of Revenue

| 13 | Q1 2018 |
Cash flow and the Balance Sheet
As of March 31, 2018, Yelp held $830 million in cash, cash equivalents and investments on its balance sheet, with no debt. The company’s cash, cash equivalents and investments have been reduced by $17 million year to date, as cash generated from operations has been offset by capital spending and share repurchase activity. The company repurchased 822,000 Yelp shares at an aggregate purchase price of $33 million during the first quarter of 2018. The stock repurchase program authorized in July 2017 had $154 million in remaining unused capacity as of March 31, 2018.
| 14 | Q1 2018 |
Second Quarter and Full Year 2018 Business Outlook
As of today, Yelp is providing its outlook for the second quarter and raising the full year 2018 outlook. Please note that the outlook reflects the sale of Eat24, which was completed on October 10, 2017:
| $ and shares in millions | Second Quarter 2018 | Full Year 2018 | ||||||
| Net revenue | $ | 230-233 | $ | 943-967 | ||||
| Adjusted EBITDA* | $ | 39-42 | $ | 179-188 | ||||
| Stock-based compensation | $ | 29-31 | $ | 119-123 | ||||
| Depreciation and amortization as a % of Net revenue |
5% | 5% | ||||||
| Fully diluted share count | 90-92 | 90-92 | ||||||
The updated Business Outlook reflects the first quarter results, encouraging trends in advertiser acquisition, and continued caution about the transition to selling advertising services under non-term contracts, which is expected to be completed during the second quarter of 2018.
Transactions revenue is expected to be approximately $10 million for the year, with $1-2 million in quarterly revenue from payment processing related to the GrubHub/Eat24 transition anticipated to end in the second quarter.
Yelp has not reconciled its adjusted EBITDA outlook to GAAP net income (loss) because it does not provide an outlook for GAAP net income (loss) due to the uncertainty and potential variability of other income, net and provision for (benefit from) income taxes, which are reconciling items between adjusted EBITDA and GAAP net income (loss). Because such items cannot be reasonably predicted and could have a significant impact on the calculation of GAAP net income (loss), a reconciliation of the non-GAAP financial measure outlook to the corresponding GAAP measure is not available without unreasonable effort. For more information regarding the non-GAAP financial measures discussed in this release, please see “Non-GAAP Financial Measures” and “Reconciliation of GAAP to Non-GAAP Financial Measures” below.
| 15 | Q1 2018 |
Quarterly Earnings Webcast
Yelp will host a live webcast today at 2:00 p.m. PDT to discuss the first quarter financial results. The webcast can be accessed on the Yelp Investor Relations website at yelp-ir.com. A replay of the webcast will be available at the same website until May 18, 2018.
About Yelp
Yelp Inc. (www.yelp.com) connects people with great local businesses. With unmatched local business information, photos and review content, Yelp provides a platform for consumers to discover, interact and transact with local businesses of all sizes. Yelp was founded in San Francisco in July 2004.
| 16 | Q1 2018 |
Condensed
Consolidated
Balance Sheets (In
thousands, unaudited)
| March 31, 2018 | December 31, 2017 | ||||||
| Assets | |||||||
| Current assets: | |||||||
| Cash and cash equivalents | $ | 392,335 | $ | 547,850 | |||
| Short-term marketable securities | 422,283 | 273,366 | |||||
| Accounts receivable, net | 75,533 | 76,173 | |||||
| Prepaid expenses and other current assets | 19,975 | 15,700 | |||||
| Total current assets | 910,126 | 913,089 | |||||
| Long-term marketable securities | 14,898 | 25,032 | |||||
| Property, equipment and software, net | 107,889 | 103,651 | |||||
| Goodwill | 109,420 | 107,954 | |||||
| Intangibles, net | 16,009 | 16,893 | |||||
| Restricted cash | 18,800 | 18,554 | |||||
| Other non-current assets | 41,357 | 40,428 | |||||
| Total assets | $ | 1,218,499 | $ | 1,225,601 | |||
| Liabilities and Stockholders’ Equity | |||||||
| Current liabilities: | |||||||
| Accounts payable | $ | 6,620 | $ | 9,033 | |||
| Accrued liabilities | 83,413 | 73,665 | |||||
| Deferred revenue | 3,474 | 3,469 | |||||
| Total current liabilities | 93,507 | 86,167 | |||||
| Long-term liabilities | 32,839 | 30,737 | |||||
| Total liabilities | 126,346 | 116,904 | |||||
| Stockholders' equity | |||||||
| Common stock | - | - | |||||
| Additional paid-in capital | 1,059,168 | 1,038,017 | |||||
| Treasury stock | (15,000) | (46) | |||||
| Accumulated other comprehensive loss | (6,845) | (8,444) | |||||
| Retained earnings | 54,830 | 79,170 | |||||
| Total stockholders' equity | 1,092,153 | 1,108,697 | |||||
| Total liabilities and stockholders' equity | $ | 1,218,499 | $ | 1,225,601 | |||

| 17 | Q1 2018 |
Condensed Consolidated
Statements
of Operations (In
thousands, except per share data; unaudited)
| Three Months Ended March 31, | |||||||
| 2018 | 2017 | ||||||
| Net revenue | $ | 223,074 | $ | 198,174 | |||
| Costs and expenses: | |||||||
| Cost of revenue (1) | 14,732 | 16,914 | |||||
| Sales and marketing (1) | 119,641 | 108,532 | |||||
| Product development (1) | 51,493 | 39,871 | |||||
| General and administrative (1) | 32,007 | 27,166 | |||||
| Depreciation and amortization | 10,028 | 10,151 | |||||
| Restructuring and integration | - | 231 | |||||
| Total costs and expenses | 227,901 | 202,865 | |||||
| Loss from operations | (4,827) | (4,691) | |||||
| Other income, net | 2,604 | 732 | |||||
| Loss before income taxes | (2,223) | (3,959) | |||||
| Provision for income taxes | (63) | (67) | |||||
| Net loss attributable to common stockholders | $ | (2,286) | $ | (4,026) | |||
| Net loss per share attributable to common stockholders: | |||||||
| Basic | $ | (0.03) | $ | (0.05) | |||
| Diluted | $ | (0.03) | $ | (0.05) | |||
| Weighted-average shares used to compute net loss per share attributable to common stockholders: | |||||||
| Basic | 83,785 | 79,843 | |||||
| Diluted | 83,785 | 79,843 | |||||
| (1) Includes stock-based compensation expense as follows: | |||||||
| Three Months Ended March 31, | |||||||
| 2018 | 2017 | ||||||
| Cost of revenue | $ | 1,030 | $ | 981 | |||
| Sales and marketing | 7,518 | 6,868 | |||||
| Product development | 13,435 | 11,208 | |||||
| General and administrative | 5,751 | 5,277 | |||||
| Total stock-based compensation | $ | 27,734 | $ | 24,334 | |||
| 18 | Q1 2018 |
Condensed
Consolidated Statements
of Cash
Flows (In thousands, unaudited)
| Three Months Ended March 31, | |||||||
| 2018 | 2017 | ||||||
| Operating activities | |||||||
| Net loss | $ | (2,286) | $ | (4,026) | |||
| Adjustments to reconcile net loss to net cash provided by operating activities: | |||||||
| Depreciation and amortization | 10,028 | 10,151 | |||||
| Provision for doubtful accounts and sales returns | 8,143 | 5,901 | |||||
| Stock-based compensation | 27,734 | 24,334 | |||||
| Other adjustments | (913) | 253 | |||||
| Changes in operating assets and liabilities: | |||||||
| Accounts receivable | (6,995) | (4,458) | |||||
| Prepaid expenses and other assets | (5,074) | (1,653) | |||||
| Accounts payable, accrued expenses and other liabilities | 7,652 | 10,459 | |||||
| Deferred revenue | 7 | 274 | |||||
| Net cash provided by operating activities | 38,296 | 41,235 | |||||
| Investing activities | |||||||
| Purchases of marketable securities | (280,893) | (73,971) | |||||
| Maturities of marketable securities | 143,000 | 68,000 | |||||
| Acquisition of a business, net of cash received | - | (30,833) | |||||
| Purchases of property, equipment and software | (10,927) | (2,452) | |||||
| Capitalized website and software development costs | (4,698) | (4,208) | |||||
| Other investing activities | 27 | 29 | |||||
| Net cash used in investing activities | (153,491) | (43,435) | |||||
| Financing activities | |||||||
| Proceeds from issuance of common stock for employee stock-based plans | 5,682 | 3,287 | |||||
| Repurchases of common stock | (33,309) | - | |||||
| Taxes paid related to the net share settlement of equity awards | (12,347) | - | |||||
| Net cash (used in) provided by financing activities | (39,974) | 3,287 | |||||
| Effect of exchange rate changes on cash, cash equivalents and restricted cash | (100) | 138 | |||||
| Change in cash, cash equivalents and restricted cash | (155,269) | 1,225 | |||||
| Cash, cash equivalents and restricted cash - Beginning of period | 566,404 | 289,518 | |||||
| Cash, cash equivalents and restricted cash - End of period | $ | 411,135 | $ | 290,743 | |||
| 19 | Q1 2018 |
Reconciliation of GAAP to Non-GAAP
Financial Measures (In thousands, except per share data; unaudited)
| Three Months Ended March 31, | |||||||
| 2018 | 2017 | ||||||
| Reconciliation of GAAP net loss to EBITDA and adjusted EBITDA: | |||||||
| GAAP net loss | $ | (2,286) | $ | (4,026) | |||
| Provision for income taxes | 63 | 67 | |||||
| Other income, net | (2,604) | (732) | |||||
| Depreciation and amortization | 10,028 | 10,151 | |||||
| EBITDA | 5,201 | 5,460 | |||||
| Stock-based compensation | 27,734 | 24,334 | |||||
| Restructuring and integration costs | - | 231 | |||||
| Adjusted EBITDA | $ | 32,935 | $ | 30,025 | |||
| Net revenue | $ | 223,074 | $ | 198,174 | |||
| Adjusted EBITDA margin | 15% | 15% | |||||
First Quarter Net Revenue Adjusted for Eat24,
Nowait, and Turnstyle (In thousands, unaudited)
| Three Months Ended March 31, | |||||||
| 2018 | 2017 | ||||||
| Net revenue as reported | $ | 223,074 | $ | 198,174 | |||
| Eat24 revenue | - | (17,086) | |||||
| Nowait & Turnstyle revenue | (1,977) | (232) | |||||
| Net revenue excluding Eat24, Nowait and Turnstyle | $ | 221,097 | $ | 180,856 | |||
| 20 | Q1 2018 |
Non-Financial Metrics
| 1Q16 | 2Q16 | 3Q16 | 4Q16 | 1Q17 | 2Q17 | 3Q17 | 4Q17 | 1Q18 | ||||||||||
| Non-Financial Metrics (thousands) | ||||||||||||||||||
| App Unique Devices1 | 21,186 | 23,010 | 24,900 | 24,073 | 25,827 | 27,987 | 30,162 | 28,845 | 30,115 | |||||||||
| Desktop Unique Visitors1 | 77,433 | 73,406 | 71,409 | 67,888 | 78,167 | 82,998 | 83,592 | 76,748 | 73,668 | |||||||||
| Mobile Web Unique Visitors1 | 68,551 | 69,327 | 72,040 | 65,351 | 73,192 | 74,101 | 73,508 | 64,221 | 69,901 | |||||||||
| Cumulative Reviews | 101,564 | 108,251 | 115,259 | 121,022 | 127,478 | 134,591 | 142,036 | 148,298 | 155,328 | |||||||||
| Claimed Local Business Locations | 2,834 | 3,010 | 3,192 | 3,363 | 3,559 | 3,753 | 3,975 | 4,189 | 4,439 | |||||||||
| Paying Advertising Accounts2 | 119 | 125 | 132 | 135 | 139 | 148 | 155 | 163 | 177 | |||||||||
| Repeat Rate3 | 76% | 78% | 79% | 80% | 78% | 76% | 78% | 77% | 71% | |||||||||
| Headcount | ||||||||||||||||||
| Total Headcount | 4,050 | 4,150 | 4,350 | 4,250 | 4,350 | 4,600 | 5,050 | 5,200 | 5,250 | |||||||||
| Sales Headcount4 | 2,300 | 2,400 | 2,550 | 2,500 | 2,550 | 2,750 | 3,050 | 3,300 | 3,300 | |||||||||
| Advertising Revenue by Vertical | ||||||||||||||||||
| Home & Local | 29% | 30% | 30% | 30% | 30% | 31% | 31% | 31% | 32% | |||||||||
| Restaurants | 14% | 14% | 15% | 15% | 14% | 14% | 15% | 14% | 14% | |||||||||
| Beauty & Fitness | 12% | 12% | 12% | 12% | 13% | 13% | 12% | 12% | 12% | |||||||||
| Health | 11% | 11% | 10% | 11% | 11% | 11% | 11% | 11% | 11% | |||||||||
| Shopping | 10% | 9% | 10% | 9% | 9% | 9% | 9% | 9% | 8% | |||||||||
| Other | 24% | 24% | 23% | 24% | 23% | 22% | 22% | 22% | 23% |
1 On a monthly average basis
2 Paying advertising accounts comprise all business accounts from which we recognize advertising revenue in a given three-month period.
3 Repeat Rate as defined as the percentage of existing paying advertising accounts from which we recognized advertising revenue at some point in the immediately preceding 12-month period
4 Sales headcount includes Local Client Partners as of 3Q16
More information about the Company, including the factors that could affect the Company’s operating results, is included under the captions “Risk Factors” and “Management’s Discussion and Analysis of Financial Condition and Results of Operations” in the Company’s most recent Quarterly or Annual Report filed with the SEC, available at www.yelp-ir.com or the SEC’s website at www.sec.gov. |
| 21 | Q1 2018 |
Non-GAAP Financial Measures
This letter includes, and statements made during the above referenced conference call will include, information relating to adjusted EBITDA, EBITDA and adjusted EBITDA margin, each of which the Securities and Exchange Commission has defined as a “non-GAAP financial measure.” We define adjusted EBITDA as net income (loss), adjusted to exclude: provision for (benefit from) income taxes; other income, net; depreciation and amortization; stock-based compensation expense; any gain (loss) on the disposal of a business unit; and restructuring and integration costs.
We define EBITDA as net income (loss), adjusted to exclude: provision for (benefit from) income taxes; other income, net; and depreciation and amortization. We define adjusted EBITDA margin as adjusted EBITDA divided by net revenue.
Adjusted EBITDA, EBITDA and adjusted EBITDA margin have been included in this letter, or will be included in the conference call, because they are key measures used by Yelp management and the board of directors to understand and evaluate core operating performance and trends, to prepare and approve Yelp’s annual budget and to develop short- and long-term operational plans.
The presentation of this financial information, which is not prepared under any comprehensive set of accounting rules or principles, is not intended to be considered in isolation or as a substitute for the financial information prepared and presented in accordance with generally accepted accounting principles in the United States (“GAAP”).
Adjusted EBITDA, EBITDA and adjusted EBITDA margin have limitations as analytical tools, and you should not consider them in isolation or as substitutes for analysis of Yelp’s financial results as reported under GAAP. Some of these limitations are:
| > | Although depreciation and amortization are non-cash charges, the assets being depreciated and amortized may have to be replaced in the future, and adjusted EBITDA and EBITDA do not reflect cash capital expenditure requirements for such replacements or for new capital expenditure requirements; |
| > | Adjusted EBITDA and EBITDA do not reflect changes in, or cash requirements for, Yelp’s working capital needs; |
| > | Adjusted EBITDA does not consider the potentially dilutive impact of equity-based compensation; |
| > | Adjusted EBITDA and EBITDA do not reflect tax payments that may represent a reduction in cash available to Yelp; |
| > | Adjusted EBITDA does not take into account any restructuring and integration costs; |
| > | Other companies, including those in Yelp’s industry, may calculate adjusted EBITDA, EBITDA and adjusted EBITDA margin differently, which reduces their usefulness as comparative measures. |
| 22 | Q1 2018 |
Because of these limitations, you should consider adjusted EBITDA, EBITDA and adjusted EBITDA margin alongside other financial performance measures, including various cash flow metrics, net income (loss) and Yelp’s other GAAP results.
Additionally, Yelp has not reconciled its adjusted EBITDA outlook for the second quarter and full year 2018 to net income (loss) because it does not provide an outlook for net income (loss) due to the uncertainty and potential variability of other income, net and provision for (benefit from) income taxes, which are reconciling items between net income (loss) and adjusted EBITDA.
As items that impact net income (loss) are out of Yelp’s control and cannot be reasonably predicted, Yelp is unable to provide such an outlook. Accordingly, reconciliation of adjusted EBITDA outlook to net income (loss) for the second quarter and full year 2018 is not available without unreasonable effort. For a reconciliation of historical non-GAAP financial measures to the nearest comparable GAAP measures, see the non-GAAP reconciliations included below in this letter.
Forward-Looking Statements
This letter contains, and statements made during the above referenced conference call will contain, forward-looking statements relating to, among other things, the future performance of Yelp and its consolidated subsidiaries that are based on Yelp’s current expectations, forecasts and assumptions and involve risks and uncertainties.
These statements include, but are not limited to: statements regarding expected financial results for the second quarter and full year 2018; Yelp’s investment and other priorities for 2018 and beyond, including its ability to increase consumer usage through deepening its product experience in the Restaurants category and attract advertisers through expanding sales channels and increasing ad product flexibility, and its ability to execute against those priorities; trends in advertiser and revenue retention, including the impact of its increased emphasis on offering non-term contracts; the strategic partnership with Grubhub, including Yelp’s ability to capitalize on the partnership, the expected benefits of the partnership and the potential impact of the long-term partnership with Grubhub on Yelp’s business and financial results; Yelp’s ability to improve its earnings, margins, profitability and productivity; Yelp’s ability to capture a meaningful share of the large local market; the future growth in Yelp revenue, including the breakdown of such growth between Yelp’s sales channels and business categories, and advertiser accounts; Yelp’s ability to execute on its monetization strategy of converting traffic in its restaurants category into engagement with businesses in other categories, where the vast majority of its advertising revenue comes from; Yelp’s ability to increase usage of, awareness of and engagement on Yelp among consumers, and deliver value to consumers and local businesses; Yelp’s ability to increase transactions completed on its platform, including the continued development, growth and advertiser acceptance of Request-A-Quote; trends in the appeal of Yelp’s product offerings; Yelp’s ability to build a comprehensive offering in the Restaurants category, including the continued expansion of Yelp Reservations, Yelp Nowait and Yelp WiFi; and Yelp’s plans to manage dilution, includ-
| 23 | Q1 2018 |
ing the implementation of the authorized stock repurchase program and purchase of shares thereunder. Yelp’s actual results could differ materially from those predicted or implied and reported results should not be considered as an indication of future performance.
Factors that could cause or contribute to such differences include, but are not limited to: Yelp’s limited operating history in an evolving industry; Yelp’s ability to generate sufficient revenue to maintain profitability, particularly in light of its significant ongoing sales and marketing expenses, its planned investments in Yelp Reservations, Yelp Nowait and Yelp WiFi, and the sale of Eat24; the risk that Yelp will be unable to realize the intended benefits of the Grubhub partnership, which may adversely affect the Company’s business relationships, operating results and business generally; Yelp’s ability to successfully manage the acquisition and integration of new businesses, solutions or technologies, as well as to monetize the acquired products, solutions or technologies; Yelp’s reliance on traffic to its website from search engines like Google and Bing; Yelp’s ability to generate and maintain sufficient high quality content from its users; maintaining a strong brand and managing negative publicity that may arise; maintaining and expanding Yelp’s base of advertisers, particularly as an increasing portion of advertisers have the ability to cancel their ad campaigns at any time; changes in political, business and economic conditions, including any economic downturn or crisis and any conditions that affect ecommerce growth; Yelp’s ability to deal with the increasingly competitive local search environment; Yelp’s need and ability to manage other regulatory, tax and litigation risks as applicable laws become more restrictive; the competitive and regulatory environment while Yelp continues to introduce new products and as new laws and regulations related to Internet companies come into effect; Yelp’s ability to timely upgrade and develop its systems, infrastructure and customer service capabilities; and Yelp’s ability to purchase shares under the stock repurchase purchase program, or the modification, suspension or termination of that program. The forward-looking statements in this release do not include the potential impact of any acquisitions or divestitures that may be announced and/or completed after the date hereof.
More information about factors that could affect Yelp’s operating results is included under the captions “Risk Factors” and “Management’s Discussion and Analysis of Financial Condition and Results of Operations” in Yelp’s most recent Annual Report on Form 10-K or Quarterly Report on Form 10-Q at www.yelp-ir.com or the SEC’s website at www.sec.gov. Undue reliance should not be placed on the forward-looking statements in this release, which are based on information available to Yelp on the date hereof. Yelp assumes no obligation to update such statements.