Attached files
| file | filename |
|---|---|
| 8-K - 8-K - Tronox Holdings plc | form8k.htm |
| EX-99.1 - EXHIBIT 99.1 - Tronox Holdings plc | ex99_1.htm |
Exhibit 99.2
First Quarter 2018 Conference CallMay 10, 2018

Safe Harbor Statement and Non-U.S. GAAP Financial Terms Statements in this presentation that are not historical are forward-looking statements within the meaning of the safe harbor provisions of the U.S. Private Securities Litigation Reform Act of 1995. These forward-looking statements, which are subject to known and unknown risks, uncertainties and assumptions about us, may include projections of our future financial performance based on our growth strategies and anticipated trends in our business. These statements are only predictions based on our current expectations and projections about future events. There are important factors that could cause our actual results, level of activity, performance or achievements to differ materially from the results, level of activity, performance or achievements expressed or implied by the forward-looking statements. These and other risk factors are discussed in the company's filings with the Securities and Exchange Commission (SEC), including those under the heading entitled “Risk Factors" in our Annual Report on Form 10-K for the year ended December 31, 2017. Moreover, we operate in a very competitive and rapidly changing environment. New risks and uncertainties emerge from time to time, and it is not possible for our management to predict all risks and uncertainties, nor can management assess the impact of all factors on our business or the extent to which any factor, or combination of factors, may cause actual results to differ materially from those contained in any forward-looking statements. Although we believe the expectations reflected in the forward-looking statements are reasonable, we cannot guarantee future results, level of activity, performance or achievements. Moreover, neither we nor any other person assumes responsibility for the accuracy or completeness of any of these forward-looking statements. You should not rely upon forward-looking statements as predictions of future events. Unless otherwise required by applicable laws, we undertake no obligation to update or revise any forward-looking statements, whether as a result of new information or future developments.This presentation contains certain non-U.S. GAAP financial terms that we use in the management of our business, including EBITDA, adjusted EBITDA, adjusted EBITDA margin, free cash flow and adjusted earnings per diluted share. Reconciliations to their nearest U.S. GAAP terms are provided in the Appendix of this presentation.

Significant progress toward closing Cristal acquisitionEuropean Commission conditional clearance now only dependent on reaching agreement on proposed remedy to address remaining objection; negotiating with potential counterparties regarding execution of proposed remedyMotion filed with U.S. FTC seeking to stay administrative proceeding scheduled to start on May 18; stay would allow settlement negotiations directly with FTC CommissionersIf settlement efforts unsuccessful, we will ask FTC Commissioners to consider pursuing the FTC’s case through the typical Federal Court processTechnical Services Agreement and Option Agreement for titanium slagger in Jazan, KSAFurther optimizes vertical integration between TiO2 pigment and feedstock operations post-closing of Cristal and across the cycle over the long termExxaro reaffirmed intention to monetize Tronox shares at a future time Strong top and bottom line first quarter performance in TiO2 Revenue growth of 17 percentAdjusted EBITDA growth of 62 percentAdjusted EBITDA margin of 31 percentFree cash flow of $52 million First Quarter 2018 Highlights

USD millions 1Q18 1Q17 Change TiO2 Revenue 442 378 17% Pigment 333 272 22% Feedstock & Co-products 97 92 5% Zircon 61 50 22% Pig Iron 19 11 73% Feedstock & Other Products 17 31 (45%) TiO2 Commercial Performance First Quarter 2018 vs First Quarter 2017 Higher pigment, zircon and pig iron selling pricesPigment selling prices up 25%, higher in all regionsPigment volumes (2%) due to inventory availability related to plant maintenance timing Feedstock & co-products selling prices increased 34%Feedstock & co-products volumes (22%), shipment timing for zircon and CP slagZircon selling prices increased 52%Pig iron selling prices increased 18% Price and Volume Changes Price Volume Pigment 25% (2%) Feedstock and co-products 34% (22%) Zircon 52% (20%) Pig Iron 18% 41%

USD millions 1Q18 4Q17 Change TiO2 Revenue 442 464 (5%) Pigment 333 316 5% Feedstock & Co-products 97 133 (27%) Zircon 61 67 (9%) Pig Iron 19 20 (5%) Feedstock & Other Products 17 46 (63%) TiO2 Commercial Performance First Quarter 2018 vs Fourth Quarter 2017 Higher selling prices for pigment and all major products in feedstock and co-productsLower sales volumes for zircon, pig iron and CP slag due to shipment timingHigh level of shipments in 4Q17 generated ~$20m revenue and ~$7-8m EBITDAPigment selling prices increased 3% and sales volumes increased 2%Zircon selling prices increased 12%Pig iron selling prices increased 12%Second quarter - sequential growth in pigment sales and double-digit sales growth in zircon and pig iron expectedWorking with customers to stabilize margin volatility across the cycle Price and Volumes Changes Price Volume Pigment 3% 2% Feedstock & Co-products 10% (34%) Zircon 12% (19%) Pig Iron 12% (16%)
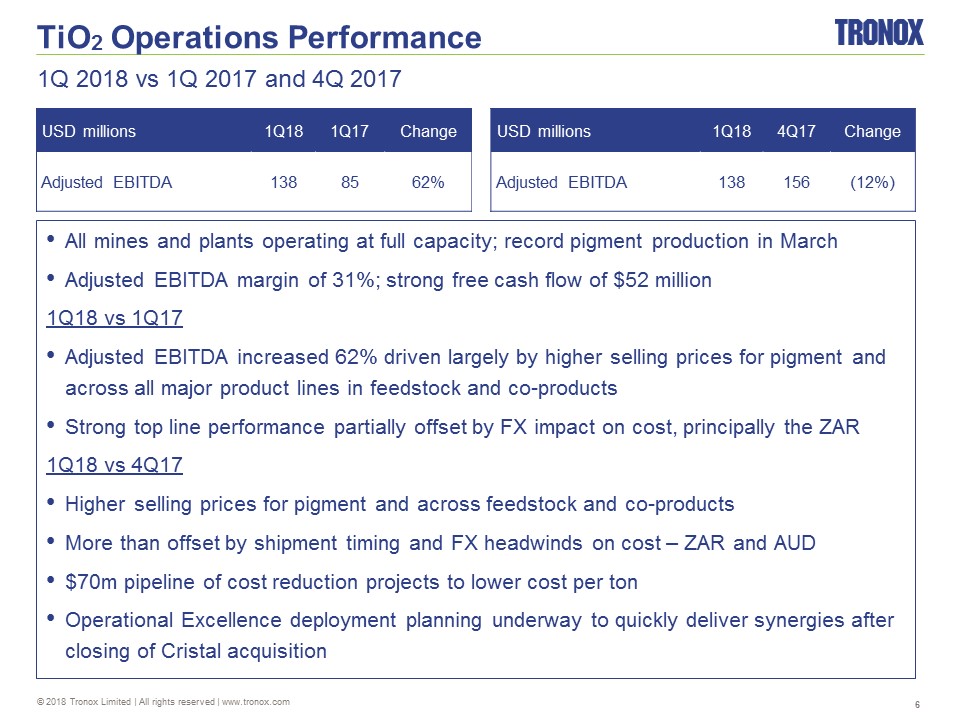
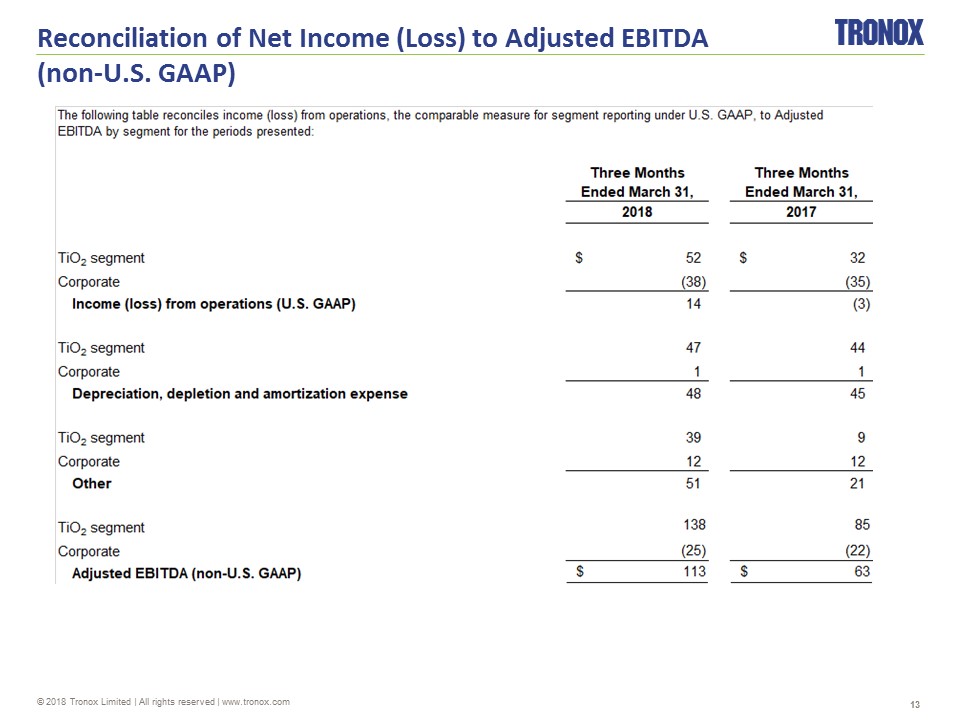
USD millions 1Q18 1Q17 Change Adjusted EBITDA 138 85 62% TiO2 Operations Performance 1Q 2018 vs 1Q 2017 and 4Q 2017 All mines and plants operating at full capacity; record pigment production in MarchAdjusted EBITDA margin of 31%; strong free cash flow of $52 million1Q18 vs 1Q17Adjusted EBITDA increased 62% driven largely by higher selling prices for pigment and across all major product lines in feedstock and co-productsStrong top line performance partially offset by FX impact on cost, principally the ZAR1Q18 vs 4Q17Higher selling prices for pigment and across feedstock and co-productsMore than offset by shipment timing and FX headwinds on cost – ZAR and AUD$70m pipeline of cost reduction projects to lower cost per tonOperational Excellence deployment planning underway to quickly deliver synergies after closing of Cristal acquisition USD millions 1Q18 4Q17 Change Adjusted EBITDA 138 156 (12%)
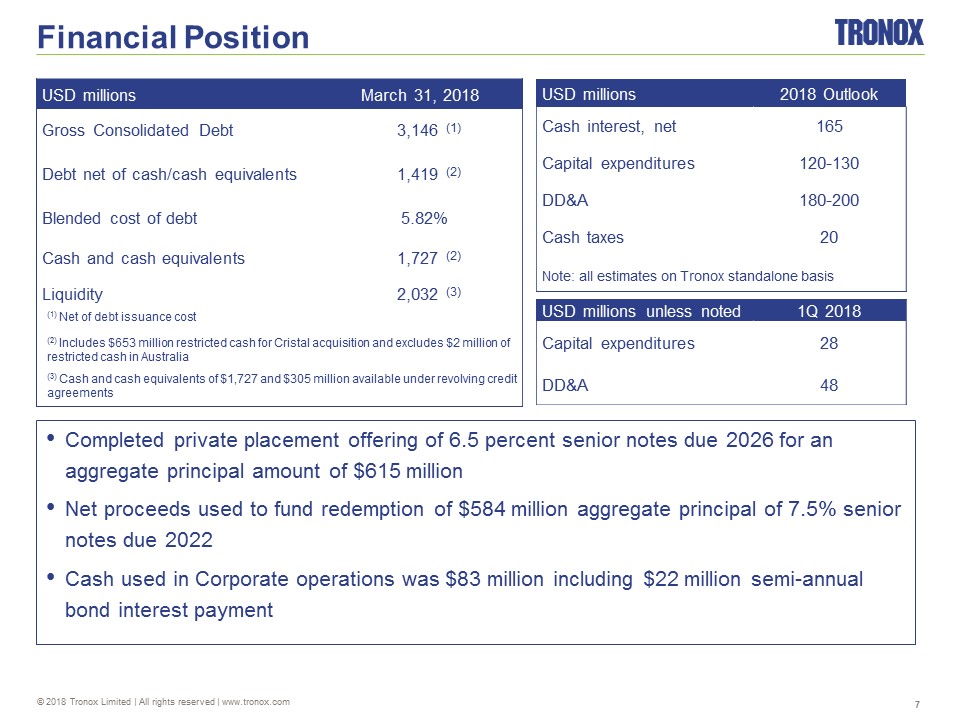
USD millions March 31, 2018 Gross Consolidated Debt 3,146 (1) Debt net of cash/cash equivalents 1,419 (2) Blended cost of debt 5.82% Cash and cash equivalents 1,727 (2) Liquidity 2,032 (3) (1) Net of debt issuance cost (2) Includes $653 million restricted cash for Cristal acquisition and excludes $2 million of restricted cash in Australia (3) Cash and cash equivalents of $1,727 and $305 million available under revolving credit agreements Financial Position Completed private placement offering of 6.5 percent senior notes due 2026 for an aggregate principal amount of $615 millionNet proceeds used to fund redemption of $584 million aggregate principal of 7.5% senior notes due 2022Cash used in Corporate operations was $83 million including $22 million semi-annual bond interest payment USD millions 2018 Outlook Cash interest, net 165 Capital expenditures 120-130 DD&A 180-200 Cash taxes 20 Note: all estimates on Tronox standalone basis USD millions unless noted 1Q 2018 Capital expenditures 28 DD&A 48
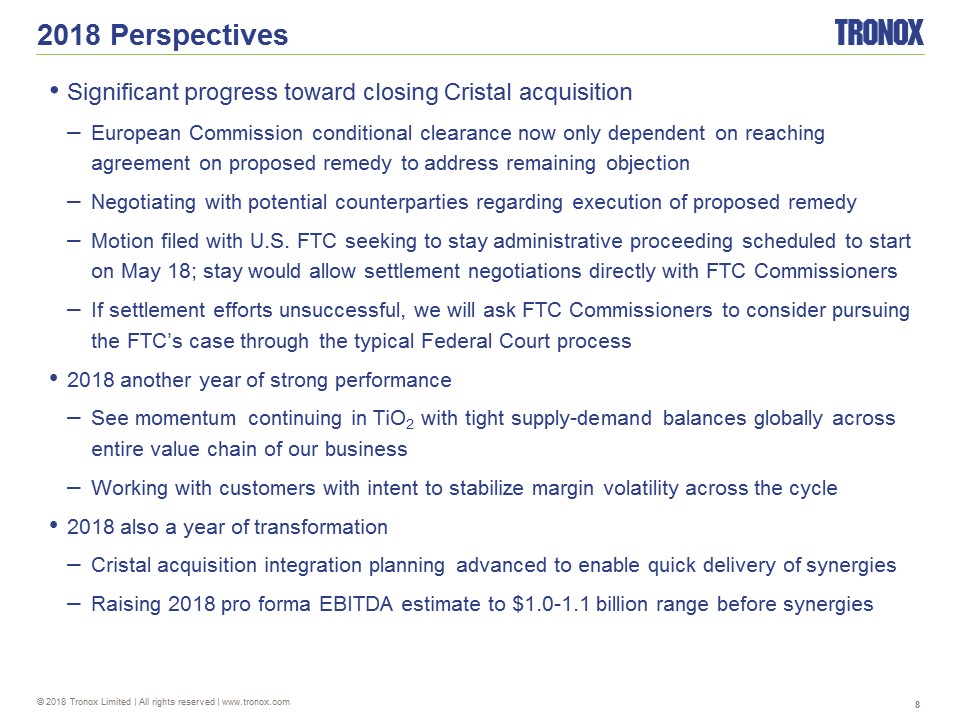
Significant progress toward closing Cristal acquisitionEuropean Commission conditional clearance now only dependent on reaching agreement on proposed remedy to address remaining objectionNegotiating with potential counterparties regarding execution of proposed remedyMotion filed with U.S. FTC seeking to stay administrative proceeding scheduled to start on May 18; stay would allow settlement negotiations directly with FTC CommissionersIf settlement efforts unsuccessful, we will ask FTC Commissioners to consider pursuing the FTC’s case through the typical Federal Court process2018 another year of strong performanceSee momentum continuing in TiO2 with tight supply-demand balances globally across entire value chain of our businessWorking with customers with intent to stabilize margin volatility across the cycle2018 also a year of transformationCristal acquisition integration planning advanced to enable quick delivery of synergies Raising 2018 pro forma EBITDA estimate to $1.0-1.1 billion range before synergies 2018 Perspectives

www.tronox.com Q&A Session

Appendix

Reconciliation of Non-U.S. GAAP Financial Measures

Reconciliation of Net Income (Loss) to EBITDA and Adjusted EBITDA (non-U.S. GAAP)
Reconciliation of Net Income (Loss) to Adjusted EBITDA (non-U.S. GAAP)