Attached files
| file | filename |
|---|---|
| 8-K - FORM 8-K - Wellesley Bancorp, Inc. | tv493598_8k.htm |
Exhibit 99.1
Investor Presentation May 2018 NASDAQ : WEBK www.wellesleybank.com

This presentation contains certain “forward - looking statements” within the meaning of the U . S . Private Securities Litigation Reform Act of 1995 about the Company and the Bank . Forward - looking statements include statements regarding anticipated future events and can be identified by the fact that they do not relate strictly to historical or current facts . They often include words such as “believe,” “expect,” “anticipate,” “estimate,” and “intend” or future or conditional verbs such as “will,” “would,” “should,” “could,” or “may . ” Forward - looking statements, by their nature, are subject to significant assumptions, risks and uncertainties . Certain factors that could cause actual results to differ materially from expected results include increased competitive pressures, changes in the interest rate environment, general economic conditions or conditions within the securities markets, and legislative and regulatory changes that could adversely affect the business in which the Company and the Bank are engaged . More detailed information regarding these factors is included in our filings with the U . S . Securities and Exchange Commission, including in the “Risk Factors” section of our Annual Report on Form 10 - K for the year ended December 31 , 2017 and in other SEC reports we file . In addition, it should be noted that our forward - looking statements speak only as of the date of this presentation . We do not undertake to update our forward - looking statements to reflect the impact of events or circumstances that may arise after the date on which such statements are made . Forward Looking Statements and Associated Risk Factors Use of Non - GAAP Financial Measures This presentation contains certain non - GAAP financial measures which are provided to assist in an understanding of Wellesley Bancorp, Inc . ’s business and its performance . These measures should always be considered in conjunction with the appropriate GAAP measure . Reconciliations of non - GAAP amounts to the relevant GAAP amount are provided on page 24 of this presentation .

Page 3 O VERVIEW OF W ELLESLEY B ANCORP 1) Regulatory Bank level data used Source: S&P Global Market Intelligence ▪ The bank subsidiary, Wellesley Bank, was founded in 1911 ▪ WEBK completed its mutual conversion and IPO in 2012 , raising proceeds of $ 22 . 5 million ▪ WEBK provides premier retail and business banking services : o Local Consumers, Small Businesses, Professional Practices, Nonprofits o Strong, in - market, CRE and Construction L ending Focus o Small Business - focused Business Banking and Cash Management Services ▪ Wealth management services are offered through our wholly - owned subsidiary, Wellesley Investment Partners, LLC, which has $ 406 million in Assets U nder Management as of March 31 , 2018 : o High - Net - Worth Individuals and Families o Endowments o Charitable Organizations and Foundations o Pension and Profit Sharing Plans WEBK is a growth oriented community bank with an attractive branch footprint in the affluent Wellesley and Greater Boston Market Dollar Values in Millions, Except Per Share Amounts As of March 31, 2018 Balance Sheet Total Assets $822 Loans / Deposits 106.66% Total Equity / Total Assets 7.31% NPAs / Assets 0.15% Profitability Core ROAA 0.71% Core ROAE 9.63% Efficiency Ratio 69.1% Regulatory Capital Ratios 1 Tier 1 Leverage Ratio 8.43% Tier 1 Capital Ratio 11.19% Total Capital Ratio 12.23% Market Information (4/30/18) Current Stock Price $33.25 Price / TBV 138% Market Capitalization $83 Dividend Yield 0.6%

Page 4 Our execution will drive long - term shareholder growth ▪ Deep understanding of our markets with collective partnerships with our communities ▪ Company volunteers provide leadership and support to many nonprofit and civic organizations ▪ The Company invests in our communities through products, education and its charitable foundation ▪ Always strive to create and maintain long - term partnerships with our clients ▪ Continued growth of our core deposit base ▪ Real estate solutions for residents and businesses ▪ Emphasis on expanding our commercial and industrial segmentation ▪ Wealth management solutions for high - net - worth clients, endowments, charitable organizations and foundations B USINESS S TRATEGY AND V ISION Building an Unrivaled Platform Platform Growth Community Involvement ▪ Create a different brand by focusing on premier banking and wealth management with an intense focus on organic growth ▪ Hire great bankers and wealth managers who are motivated to create financial solutions for our clients ▪ Maintain our entrepreneurial spirit Working as a team, we will provide personal, customized, premier banking and wealth management services to successful people, families, businesses and non - profit organizations. The foundation of our institution is built on integrity, community, security, and exceptional client service, where everyone is treated fairly and with respect. With a legacy spanning over 105 years, we are committed to being the leading premier banking and wealth management company within the communities and markets we serve.

Page 5 C ORPORATE M ILESTONES ▪ Wellesley Bank has a long - established presence in our core markets dating back to our founding in 1911 ▪ The Bank began its expansion into the Boston and Brookline markets in 2011 , further strengthening its position serving the Greater Boston Metro Market ▪ Leadership team has been built up since the conversion as the bank continues to opportunistically add talent ▪ Continued investments will support future growth Wellesley Bank was founded in 1911 as a Massachusetts chartered cooperative bank, headquartered in Wellesley, Mass. One branch in Wellesley 2011 2012 2013 2014 2015 2016 2018 Wellesley Bancorp was incorporated in September 2011 to be the holding company of Wellesley Bank In January 2012 the Bank was converted from mutual to stock ownership The Company sold 2,407,151 shares of its common stock at $10.00 per share Opened Linden St. branch in Wellesley in 2002 Opened North Hill branch in Needham Opened Lower Falls branch in Newton/Wellesley Opened Boston branch in Financial District Opened Newton Centre branch in Newton Wellesley Investment Partners established in 2007 ; current leadership team instituted in 2014 Hired current Head of Marketing and Human Resources Hired current Chief Lending Officer Hired current CFO. Hired Head of Deposit and Cash Management 1911 2017 Wellesley Investment Partners’ AUM $406 million as of 3/31/18 Completed private placement of $10 million of subordinated notes

Page 6 Thomas J. Fontaine | President and Chief Executive Officer Years in Industry: 32 Years with Wellesley Bank: 19 Thomas Fontaine was elected President and CEO of Wellesley Bank in 2009. Prior to joining Wellesley Bank in 1999 as Vice President Commercial Banking, Fontaine held senior level commercial lending positions at BankBoston and Middlesex Savings Bank. Thomas has a B.A. in Economics from the University of Vermont and an MBA from Babson College. Michael W. Dvorak | EVP, Chief Operating Officer Years in Industry: 31 Years with Wellesley Bank: 2 Michael Dvorak most recently was Senior Vice President of Finance at State Street Corporation. Previously he spent 15 years at Keycorp as CFO of the Community Bank and the Consumer Bank. Michael has a B.A., Economics from Miami University and an MBA of Banking and F ina nce from the Weatherhead School of Management, Case Western Reserve University. Ralph L. Letner | EVP , Chief Banking Officer Years in Industry: 30 Years with Wellesley Bank: 4 Ralph Letner was most recently Senior Vice President/Commercial Team Leader at Boston Private Bank & Trust Company. Previously he served 12 years with Citizens Bank in progressively expanding roles to both small and middle market privately held businesses, with an emphasis on C&I Lending. Ralph has a B.S. from the U.S. Merchant Marine Academy and an MBA from Babson College. Maureen E. Sullivan | EVP, Chief Client Experience Officer Years in Industry: 5 Years with Wellesley Bank: 5 Maureen Sullivan was most recently with Curtco Media for 7 years, where she was President and Publisher for San Diego Magazine, Exquisite Weddings Magazine and 25 other publishing titles . Prior to her tenure in publishing , Maureen held executive level positions in general management, marketing and human resources at Alliance Employment Solutions, Manpower and Mail Boxes Etc. Global Headquarters. Louis P. Crosier | President of Wellesley Investment Partners, LLC Years in Industry 18 Years with Wellesley Bank: 4 Louis Crosier was most recently Senior Managing Director at Windhaven Investment Management, a wholly owned subsidiary of the Charles Schwab Corporation . He served as a member of the Management Committee and Investment Committee. Prior to Windhaven, Louis was Managing Principal of Windward Investment Management. Prior to Windward, Louis was a Vice President in the Wealth Management Div ision of Goldman Sachs & Co. He has a B.A. from Dartmouth College, a M.Ed. from Harvard University, and an MBA from the Amos Tuck School at Dartmouth. E XPERIENCED AND D EDICATED M ANAGEMENT T EAM
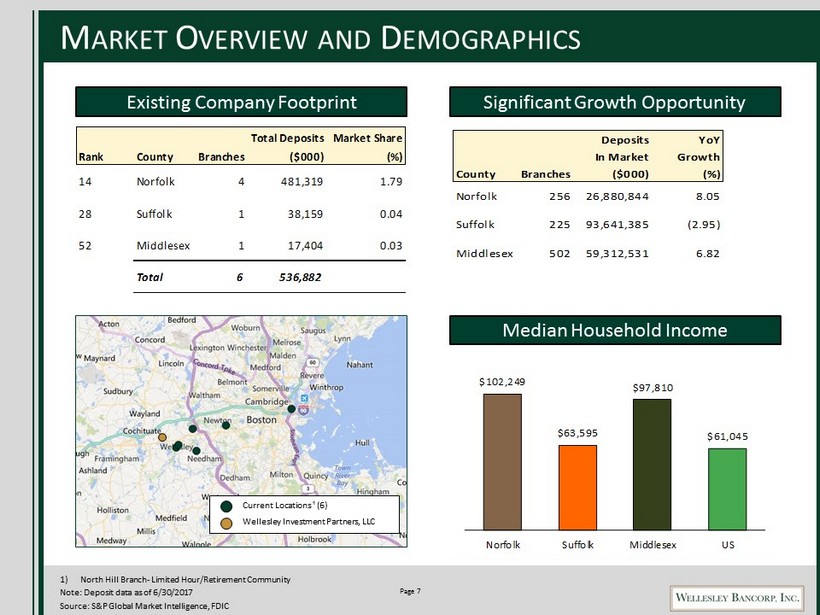
Page 7 M ARKET O VERVIEW AND D EMOGRAPHICS 1) North Hill Branch - Limited Hour/Retirement Community Note: Deposit data as of 6/30/2017 Source: S&P Global Market Intelligence, FDIC Median Household Income Current Locations ¹ (6) Wellesley Investment Partners, LLC Existing Company Footprint Significant Growth Opportunity Total Deposits Market Share Rank County Branches ($000) (%) 14 Norfolk 4 481,319 1.79 28 Suffolk 1 38,159 0.04 52 Middlesex 1 17,404 0.03 Total 6 536,882 $102,249 $63,595 $97,810 $61,045 Norfolk Suffolk Middlesex US Deposits YoY In Market Growth County Branches ($000) (%) Norfolk 256 26,880,844 8.05 Suffolk 225 93,641,385 (2.95) Middlesex 502 59,312,531 6.82

Page 8 Boston-Newton-Wellesley High-Net-Worth Individual Population and Wealth Town/City Boston Newton Wellesley County Suffolk Middlesex Norfolk Annual HNWI Income Filers 2012 1,698 1,136 767 2011 1,443 957 685 2010 1,330 856 602 2 Year % Change 27.7% 32.7% 27.4% Annual Total HNWI Income Reported (in thousands) 2012 $8,347,164 $4,384,093 $3,076,026 2011 $6,318,435 $3,920,042 $2,288,679 2010 $5,869,415 $3,534,034 $2,136,563 2 Year % Change 42.2% 24.1% 44.0% Annual Average Income/Filer (in thousands) 2012 $4,916 $3,859 $4,010 2011 $4,379 $4,096 $3,341 2010 $4,413 $4,129 $3,549 2 Year % Change 11.4% (6.5)% 13.0% ▪ 162 , 000 HNWIs in Boston, ranking 7 th out of the Top 12 U . S . Metropolitan Statistical Areas as of 2014 ▪ $ 618 Billion in HNWI investable wealth, ranking 7 th out of the Top 12 U . S . Metropolitan Statistical Areas as of 2014 ▪ 10 . 8 % increase in Boston HNWI investable wealth from 2013 to 2014 ▪ 15 . 32 % CAGR in Boston HWNI investable wealth from 2011 to 2014 1) Boston defined as the Boston Metropolitan Statistical Area identified by the US Census Bureau. HNWI defined as an individual with $1MM or more in investable assets, excluding primary residence, collectibles, consumables, and consumer durables Source: 2015 World Wealth Report Study by Capgemini M ARKET O VERVIEW AND D EMOGRAPHICS (C ONTINUED ) Snapshot of Boston HNWI¹ Boston HNWI Population and Wealth 110,000 125,000 148,000 162,000 2011 2012 2013 2014 (Population) $378 $404 $403 $459 $558 $618 2009 2010 2011 2012 2013 2014 ($ Billions)

Page 9 9.39 2.61 5.09 3.71 5.21 5.37 5.49 9.63 7.18 0.00 1.25 2.50 3.75 5.00 6.25 7.50 8.75 10.00 2011Y 2012Y 2013Y 2014Y 2015Y 2016Y 2017Y 2018Q1 0.74 0.33 0.55 0.36 0.46 0.45 0.43 0.71 0.57 0 0.1 0.2 0.3 0.4 0.5 0.6 0.7 0.8 2011Y 2012Y 2013Y 2014Y 2015Y 2016Y 2017Y 2018Q1 $3,185 $5,748 $2,005 $1,099 $2,220 $1,777 $2,649 $2,936 $4,164 ¹ $0 $600 $1,200 $1,800 $2,400 $3,000 $3,600 $4,200 $4,800 $5,400 $6,000 2011Y 2012Y 2013Y 2014Y 2015Y 2016Y 2017Y 2018Q1 $303.1 $376.0 $458.5 $535.1 $621.2 $695.3 $805.4 $821.9 $0 $125 $250 $375 $500 $625 $750 $875 $1,000 2011Y 2012Y 2013Y 2014Y 2015Y 2016Y 2017Y 2018Q1 B UILDING O UR F RANCHISE – G ROWTH OF WEBK S INCE O UR IPO 1) See Appendix for GAAP to Non - GAAP Reconciliation of core profitability metrics 2) Represents 2018 Q1 annualized Source : S&P Global Market Intelligence Total Assets ($MM) Net Income ($000) ROAE (%) ROAA (%) Reported WEBK Core WEBK¹ ` ¹ ¹ 2

Page 10 $80.2 $130.6 $181.7 $233.3 $256.5 $268.1 $329.0 $340.1 $71.9 $80.2 $82.4 $94.7 $103.1 $121.1 $138.8 $140.3 $39.3 $48.2 $80.1 $72.7 $94.9 $110.4 $120.0 $107.8 $13.3 $15.7 $16.4 $19.1 $23.7 $49.3 $68.0 $59.0 $21.0 $23.6 $27.5 $28.4 $34.3 $32.7 $36.6 $38.5 $221.9 $303.2 $384.5 $443.9 $508.4 $577.6 $692.4 $685.7 $0 $100 $200 $300 $400 $500 $600 $700 $800 2011Y 2012Y 2013Y 2014Y 2015Y 2016Y 2017Y 2018Q1 Residential Commercial Construction C&I Consumer N ET L OAN G ROWTH AND C OMPOSITION Source: S&P Global Market Intelligence Dollar Values in Millions

Page 11 D IVERSIFIED L ENDING P LATFORM Residential ▪ Sell to secondary market newly originated 15 year or longer - term conforming fixed rate loans (generally servicing released) ▪ Retain conforming and nonconforming AR loans for owner - occupied and investor properties with LTVs of up to 80% ▪ No “interest - only”, “option ARM”, subprime or “Alt - A” loans Commercial Real Estate ▪ Primary focus on individual commercial real estate loan originations to small and mid - sized owner occupants and investors in amounts between $1 - $5 million (average loan size of $1.2 million at March 31 , 2018) ▪ Loans secured by business properties; LTVs of up to 80%; generally subject to interest rate floors Construction ▪ Primarily originate construction loans to experienced, local contractors and builders to finance construction of residential dwellings secured by properties located within a 25 mile radius of Wellesley, MA ▪ Loans generally have a term of 12 - 24 months, with LTVs generally up to 75% Commercial Business ▪ Originate commercial business loans in - market to small to medium - sized, privately - held companies with local or regional businesses ▪ Strong expertise and emphasis on professional service firms ▪ Appropriate deposit relationship required; loans typically secured and supported by personal guarantees

Page 12 A SSET Q UALITY O VERVIEW 1) NPLs defined as the sum of non - accruing and renegotiated loans Source: S&P Global Market Intelligence NPLs¹/Total Loans (%) LLR/Gross Loans (%) NCOs/Average Loans (%) LLR/NPLs¹ (%) 1.51 1.25 1.08 1.06 1.00 0.93 0.89 0.91 0.50 0.70 0.90 1.10 1.30 1.50 1.70 1.90 2.10 2011Y 2012Y 2013Y 2014Y 2015Y 2016Y 2017Y 2018Q1 3.16 2.03 1.64 1.08 0.32 0.13 0.08 0.18 0.00 0.50 1.00 1.50 2.00 2.50 3.00 3.50 4.00 2011Y 2012Y 2013Y 2014Y 2015Y 2016Y 2017Y 2018Q1 47.7 61.7 66.1 98.0 349.2 918.3 1,068.2 506.0 0.00 150.00 300.00 450.00 600.00 750.00 900.00 1,050.00 1,200.00 2011Y 2012Y 2013Y 2014Y 2015Y 2016Y 2017Y 2018Q1 0.09 0.04 0.04 0.03 0.02 0.02 0.00 0.00 0.00 0.03 0.06 0.09 0.12 0.15 0.18 0.21 0.24 2011Y 2012Y 2013Y 2014Y 2015Y 2016Y 2017Y 2018Q1

Page 13 $47.1 $65.0 $71.1 $84.3 $96.7 $130.5 $141.8 $ 149.9 $27.9 $41.7 $66.6 $118.7 $100.6 $97.3 $98.6 $98.6 $50.7 $55.0 $60.3 $76.1 $83.7 $100.0 $143.1 $143.1 $119.6 $136.4 $159.5 $143.1 $182.7 $195.0 $233.3 $251.3 $245.2 $298.1 $357.5 $422.2 $463.7 $522.8 $616.7 $ 642.9 -$40 $40 $120 $200 $280 $360 $440 $520 $600 $680 2011Y 2012Y 2013Y 2014Y 2015Y 2016Y 2017Y 2018Q1 Demand & NOW Savings Money Market Certificates T OTAL D EPOSIT G ROWTH AND C OMPOSITION Source: S&P Global Market Intelligence Dollar Values in Millions ▪ Deposit products include accounts and cash management services specifically designed for small and mid - sized businesses ▪ Deposit relationships required for all commercial loans

Page 14 D EPOSIT C OMPOSITION D ETAIL 2011 (Dollar values in thousands as of December 31, 2011) Deposit Type Balance % of Total Demand & NOW $ 47,095 19.2% Savings 27,904 11.4% Money Market 50,663 20.7% Certificates 119,584 48.8% Total $245,246 100.0% 2018 (Dollar values in thousands as of March 31, 2018) Deposit Type Balance % of Total Demand & NOW $ 149,866 23.3% Savings 98,625 15.3% Money Market 143,120 22.3% Certificates 251,298 39.1% Total $ 642,909 100.0% 2011 - 2018 CAGR Growth % 20.3% 22.4% 18.1% 12.6% Cost of Int. Bearing Deposits: 1.11% Cost of Int. Bearing Deposits: 0.93% Significant Shift to Transaction Accounts 1) Core deposits defined as total deposits less jumbo CDs (greater than $100k) Source: S&P Global Market Intelligence Demand & NOW 19% Savings 11% Money Market 21% Certificates 49% Demand & NOW 23% Savings 16% Money Market 22% Certificates 39%

Page 15 $109 $231 $391 $429 $516 $982 $1,257 $1,536 $0 $400 $800 $1,200 $1,600 2011Y 2012Y 2013Y 2014Y 2015Y 2016Y 2017Y 2018Q1 W ELLESLEY I NVESTMENT P ARTNERS O PPORTUNITY 1) Annualized Source: S&P Global Market Intelligence ▪ Assets Under Management : $ 406 million as of 3 / 31 / 18 ▪ From 2011 to 2018 , WEBK’s wealth management fee income has a compounded annual growth rate of 45 . 9 % ▪ Exceptional leadership team assembled and led by Louis Crosier beginning in 4 th quarter of 2014 o Seven investment professionals with over 110 years of investment management experience o Advisory Board made up of accomplished business executives and former money managers . ▪ Offers several investment strategies (i . e . global asset allocation, dividend growth, social responsibility) to help clients achieve their investment goals and long - term needs o Professional Fee - based Investment Management o Modern Technology with Vintage Service o Focus on Broad Diversification and After - tax Return o Empower Clients through Candor and Transparency ▪ Favorable business characteristics o Average client relationship of $ 2 , 208 , 920 o Scalable investment management model o Cross sale opportunities with Bank clients Opportunity to leverage our market and clientele’s high - net - worth for WEBK’s growth Total Assets Under Management ($M) Total Wealth Management Fees ($000) 1 $64 $109 $106 $149 $235 $307 $368 $406 $0 $125 $250 $375 $500 2011Y 2012Y 2013Y 2014Y 2015Y 2016Y 2017Y 2018Q1 1

Page 16 S TRONG C APITAL L EVELS TO S UPPORT G ROWTH As of 3/31/18 Source: S&P Global Market Intelligence Wellesley Bancorp Wellesley Bank 7.31% 7.55% 10.04% 12.71% 8.16% 8.43% 11.19% 12.23% 0.00% 2.00% 4.00% 6.00% 8.00% 10.00% 12.00% 14.00% TCE/TA Leverage Ratio Tier 1 Ratio Total RBC Ratio

Page 17 H ISTORICAL S TOCK P RICE P ERFORMANCE Stock Price and Volume Since 1/25/2012 * Includes ESOP and exercisable options, as of 12/31/17 Source: S&P Global Market Intelligence 0 10,000 20,000 30,000 40,000 50,000 60,000 70,000 80,000 90,000 100,000 0.00 5.00 10.00 15.00 20.00 25.00 30.00 35.00 Volume Price Current Stock Price 33.25$ Market Capitalization ($M) 83$ 3 Month Avg. Trading Volume 1,227 Market Data (as of April 30, 2018) Total Price Return 1 1/25/2012-4/30/2018 233% Price/ LTM EPS: 21.7x Price /TBV : 138% Institutional Ownership: 26.8% Insider Ownership * 24.7% Dividend Yield: 0.6% Valuation

Page 18 I NVESTMENT C ONSIDERATIONS ▪ Attractive Price/TBV valuation 138 % versus peers ▪ Well positioned in attractive markets ▪ Continued execution of core organic growth initiatives ▪ Unique wealth management opportunity embedded within the franchise ▪ Experienced management team ▪ Insider commitment : 24 . 7 % 1 ownership including ESOP and exercisable options ▪ Clear understanding of risks, opportunities and challenges 1) As of 12/31/2017 Note: See Appendix for detail on WEBK Peer Group

Appendix

Page 20 V ALUE S TATEMENTS Vision Statement Working as a team, we will provide personal, customized, premier banking and wealth management services to successful people, families, businesses and non - profit organizations. The foundation of our institution is built on integrity, community, security, and exceptional client service, where everyone is treated fairly and with respect. With a legacy spanning over 105 years, we are committed to being the leading premier banking and wealth management company within the communities and markets we serve. Culture Statement At Wellesley Bank, it is all about the people: our employees, our community, and most importantly our clients. It’s about hiring great people, developing them and treating them well, which, in turn, is a direct reflection on how we treat our clients. We pride ourselves on having an entrepreneurial spirit, where we continue to evolve, stay open to ideas and make quick sound decisions. The foundation of our Bank is built on integrity, community, security and exceptional client service, where everyone is treated fairly and with respect. We continue to seek excellence, success and satisfaction in our work at Wellesley Bank. The Bank and the directors are dedicated to providing an environment that enables all employees to attain these goals.

Page 21 C OMMUNITY I NVOLVEMENT : S ERVICE & P HILANTHROPY Wellesley Bank Charitable Foundation The Wellesley Bank Charitable Foundation (the “WBCF”) was formed in 2011 for the purpose of funding community organizations which provide services to communities that we serve. Since its inception, the Foundation has supported many area organizations with generous grants. We support organizations that positively impact the lives around them. The broad mission of the Foundation is to support the communities in which it serves, but also ensures that it is supporting Low - to - Moderate Income (“LMI”) individuals with a target allocation of 15 - 20%. Since 2012, the Foundation has been able to provide almost $900,000 in charitable contributions. WBCF has supported over 200 non - profit institutions with charitable contributions and grant awards in 2017. Employee Volunteer Program Provides every employee with paid work days for volunteerism. Our employees are involved in over 30 Non - Profit Organizations serving as volunteers, mentors, board members, and trustees. Everfi Partnership Through a partnership with Everfi, the Company will provide certified financial literacy programs in up to 15 LMI qualified high schools in our assessment area. T he partnership also provides Elder Abuse Prevention learning courses hosted on the Company’s platform.

Page 22 WEBK P EER G ROUP Selected Comparable Companies Market Data as of May 1, 2018 Price/ MRQ MRQ Tang Current Total TCE/ Book Dividend Market Assets TA Value Yield Value Company City, State Ticker ($mm) ($) (%) (%) ($mm) Cambridge Bancorp Cambridge, MA CATC 1,962 7.67 239.5 2.19 360.3 SI Financial Group Inc. Willimantic, CT SIFI 1,598 9.62 115.4 1.67 171.2 PCSB Financial Corp. Yorktown Heights, NY PCSB 1,457 19.17 133.5 - 343.6 Unity Bancorp Inc. Clinton, NJ UNTY 1,440 8.45 192.9 1.10 234.5 Sussex Bancorp Rockaway, NJ SBBX 1,377 8.88 201.7 0.79 241.9 1st Constitution Bancorp Cranbury, NJ FCCY 1,060 9.62 176.6 1.09 178.1 Two River Bncp Tinton Falls, NJ TRCB 1,042 8.87 161.5 1.05 146.8 Salisbury Bancorp Inc. Lakeville, CT SAL 1,015 8.26 138.6 2.73 114.4 Empire Bancorp Inc Islandia, NY EMPK 947 6.97 170.5 - 86.0 Stewardship Financial Corp. 1 Midland Park, NJ SSFN 929 7.93 141.5 1.00 104.5 Provident Bancorp Inc (MHC) Amesbury, MA PVBC 891 13.17 196.5 - 230.6 Bancorp of New Jersey Inc. 1 Fort Lee, NJ BKJ 887 9.39 142.3 0.00 118.8 Patriot National Bancorp Inc. 1 Stamford, CT PNBK 852 7.83 111.3 0.21 73.7 NorthEast Community Bncp (MHC) White Plains, NY NECB 831 14.39 107.2 1.18 124.6 Union Bankshares Inc. Morrisville, VT UNB 723 7.84 408.5 2.33 230.4 Community Bancorp. Derby, VT CMTV 666 6.69 200.5 3.94 88.2 Magyar Bancorp Inc. (MHC) New Brunswick, NJ MGYR 608 8.23 146.9 - 73.5 MSB Financial Corp. Millington, NJ MSBF 564 12.37 145.4 0.00 97.8 PB Bancorp Inc. 1 Putnam, CT PBBI 535 14.75 105.2 2.27 76.5 Randolph Bancorp Inc Stoughton, MA RNDB 534 12.91 112.9 - 97.0 Median 910 8.88 146.9 1.10 121.7 Average 996 10.19 170.3 1.44 159.6 Wellesley Bancorp Wellesley, MA WEBK 822 7.31 134.5 0.62 80.8 1) Asset data as of 12/31/17 Source: S&P Global Market Intelligence

Page 23 H ISTORICAL F INANCIAL H IGHLIGHTS 1) Regulatory bank level data used Source: S&P Global Market Intelligence Dollar Values in Millions, Except Per Share Amounts For the Year Ended, For the Quarter Ended, 2015Y 2016Y 2017Y 2017Q1 2017Q2 2017Q3 2017Q4 2018Q1 Balance Sheet Total Assets $621 $695 $805 $704 $732 $770 $805 $822 Net Loans 508 578 686 587 619 649 686 680 Deposits 464 523 617 526 535 582 617 643 Gross Loans / Deposits 110.50% 111.24% 112.28% 112.64% 116.42% 112.52% 112.28% 106.66% Capital Total Equity $52 $55 $59 $56 $58 $59 $59 $60 Tangible Common Equity / Tangible Assets 8.40% 7.94% 7.36% 8.01% 7.87% 7.67% 7.36% 7.31% Tier 1 Leverage Ratio¹ 9.40% 9.06% 8.37% 9.08% 9.01% 8.66% 8.37% 8.43% Total Capital Ratio¹ 14.20% 12.58% 11.72% 12.64% 12.35% 12.14% 11.72% 12.23% Earnings & Profitability Net Income $2.6 $2.9 $3.2 $0.9 $0.9 $1.2 $0.2 $1.4 ROAA 0.46% 0.45% 0.43% 0.51% 0.53% 0.62% 0.10% 0.71% ROAE 5.21% 5.37% 5.49% 6.27% 6.51% 7.90% 1.36% 9.63% Net Interest Margin 3.31% 3.17% 3.16% 3.10% 3.20% 3.15% 3.15% 3.03% Asset Quality NPLs / Loans 0.28% 0.10% 0.08% 0.10% 0.09% 0.09% 0.08% 0.18% NPAs / Assets¹ 0.24% 0.09% 0.07% 0.08% 0.08% 0.08% 0.07% 0.09% Reserves / Loans 1.00% 0.93% 0.89% 0.91% 0.89% 0.89% 0.89% 0.91% NCOs / Average Loans 0.02% 0.02% 0.00% 0.01% 0.00% 0.00% 0.00% 0.00% Yield and Cost Yield on Earning Assets 3.97% 3.95% 3.95% 3.91% 3.98% 3.92% 3.98% 3.95% Cost of Interest Bearing Deposits 0.74% 0.76% 0.79%¹ 0.74% 0.76% 0.79% 0.85%¹ 0.93% Cost of Interest Bearing Liabilities 0.81% 0.96% 0.98% 0.95% 0.96% 1.00% 1.03% 1.13% Market Information (4/30/18) Current Stock Price $33.25 Price / BV 138% 52 Week High $33.25 Price / TBV 138% 52 Week Low $25.00 Price / LTM EPS 21.7x Market Capitalization $83

Page 24 GAAP TO N ON - GAAP R ECONCILIATION Note: Averages are calculated on an annualized basis Dollars in $000s For the year ended December 31, 2017 Net Income (GAAP) $3,185 TCJA additional tax provision 979 Adjusted Net Income (Non-GAAP) $4,164 Adjusted Net Income (Non-GAAP) $4,164 Average Assets 735,484 Adjusted Return on Average Assets (Non-GAAP) 0.57% Adjusted Net Income (Non-GAAP) $4,164 Average Equity 57,986 Adjusted Return on Average Equity (Non-GAAP) 7.18% Noninterest Expense (GAAP) (Numerator) $17,181 Net Interest Income (GAAP) 22,678 Noninterest Income (GAAP) 1,987 Total Revenue (GAAP) (Denominator) 24,665 Efficiency Ratio (GAAP) 69.7% Reconciliation of Certain GAAP and Non - GAAP Financial Measures (unaudited ) While net income is a financial measure that is recorded in accordance with U.S. general accepted accounting principles (“GAA P”) , “adjusted net income” is not. Nevertheless, management uses this non - GAAP measure in its analysis of our performance, and believes that this non - GAAP measure should be disc losed in our earnings releases and other investor communications to give investors a better understanding of the effect of this one - time, $979 thousand, write - down of th e Company’s net deferred - tax assets caused by the enactment of TCJA on December 22, 2017.