Attached files
| file | filename |
|---|---|
| 8-K - 8-K - PEAPACK GLADSTONE FINANCIAL CORP | form8k-20251_pgfc.htm |

Annual Meeting “Expanding Our Reach” 05/09/2018 P EAPACK - G LADSTONE B ANK

Statement Regarding Forward - Looking Information 2 This presentation contains forward - looking statements within the meaning of the Private Securities Litigation Reform Act of 1995 . Such statements are not historical facts and include expressions about Management’s strategies and Management’s expectations about ne w and existing programs and products, investments, relationships, opportunities and market conditions. These statements may be ide nti fied by such forward - looking terminology as “expect,” “look,” “believe,” “anticipate,” “may,” or similar statements or variations of such ter ms. Actual results may differ materially from such forward - looking statements. Factors that may cause actual results to differ materially from those contemplated by such forward - looking statements include, but are not limited to 1) our inability to successfully grow our busine ss and implement our strategic plan, including an inability to generate revenues to offset the increased personnel and other costs r ela ted to the strategic plan; 2) the impact of anticipated higher operating expenses in 2018 and beyond; 3) our inability to successfully i nte grate wealth management firm acquisitions; 4) our inability to manage our growth; 5) our inability to successfully integrate our expanded emp loyee base; 6) an unexpected decline in the economy, in particular in our New Jersey and New York market areas; 7) declines in our net in ter est margin caused by the interest rate environment and highly competitive market; 8) declines in value in our investment portfolio; 9) h igh er than expected increases in our allowance for loan and lease losses; 10) higher than expected increases in loan and lease losses or in the level of nonperforming loans; 11) unexpected changes in interest rates; 12) an unexpected decline in real estate values within our mar ket areas; 13) legislative and regulatory actions (including the impact of the Dodd - Frank Wall Street Reform and Consumer Protection Act, Basel III and related regulations) that may result in increased compliance costs; 14) changes in monetary policy by the Federal Reserve Boa rd; 15) changes to legislation or policy relating to tax or accounting matters; 16) successful cyberattacks against our IT infrastructure and th at of our IT providers; 17) higher than expected FDIC insurance premiums; 18) adverse weather conditions; 19) our inability to successfull y g enerate new business in new geographic markets; 20) our inability to execute upon new business initiatives; 21) our lack of liquidity to fun d our various cash obligations; 22) reduction in our lower - cost funding sources; 23) our inability to adapt to technological changes; 24) clai ms and litigation pertaining to fiduciary responsibility, environmental laws and other matters; and 25) other unexpected material adverse chang es in our operations or earnings. The Company undertakes no duty to update any forward - looking statement to conform the statement to actual results or changes in the Company’s expectations. Although we believe that the expectations reflected in the forward - looking statements are reasonable, t he Company cannot guarantee future results, levels of activity, performance or achievements.

Strategic Overview and Update P EAPACK - G LADSTONE B ANK

Vision Statement 4 “A high - performing boutique bank, leaders in wealth, lending and deposit solutions, known nationally for unparalleled client service, integrity and trust.”
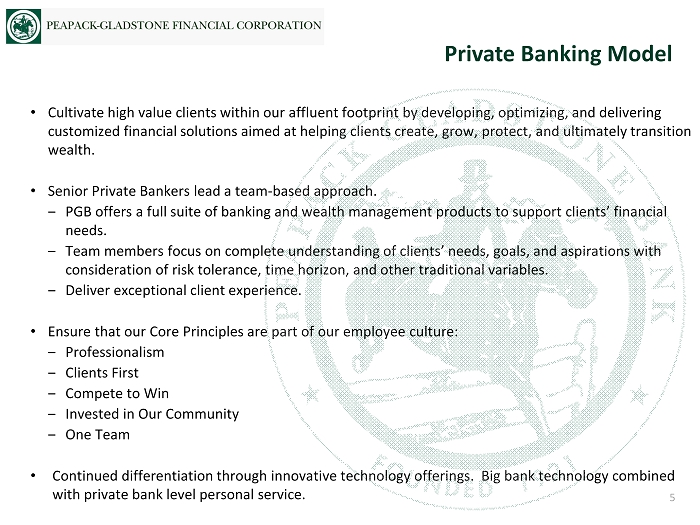
• Cultivate high value clients within our affluent footprint by developing, optimizing, and delivering customized financial solutions aimed at helping clients create, grow, protect, and ultimately transition wealth. • Senior Private Bankers lead a team - based approach. ‒ PGB offers a full suite of banking and wealth management products to support clients’ financial needs. ‒ Team members focus on complete understanding of clients’ needs, goals, and aspirations with consideration of risk tolerance, time horizon, and other traditional variables. ‒ Deliver exceptional client experience. • Ensure that our Core Principles are part of our employee culture: ‒ Professionalism ‒ Clients First ‒ Compete to Win ‒ Invested in Our Community ‒ One Team • Continued differentiation through innovative technology offerings. Big bank technology combined with private bank level personal service. Private Banking Model 5
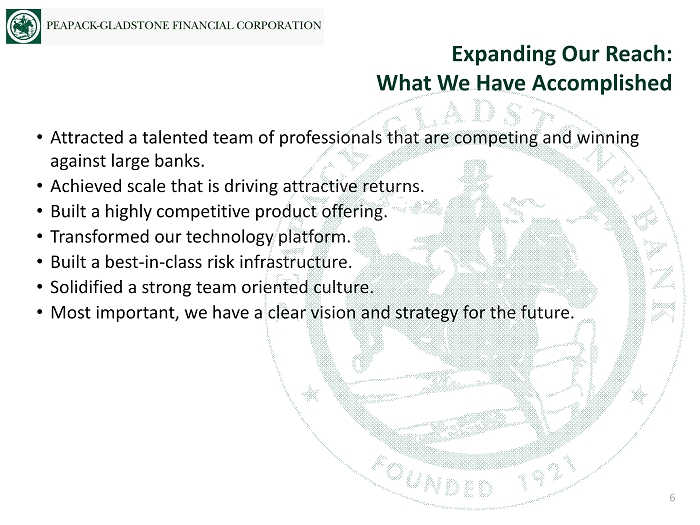
• Attracted a talented team of professionals that are competing and winning against large banks. • Achieved scale that is driving attractive returns. • Built a highly competitive product offering. • Transformed our technology platform. • Built a best - in - class risk infrastructure. • Solidified a strong team oriented culture. • Most important, we have a clear vision and strategy for the future. Expanding Our Reach: What We Have Accomplished 6

• Acquired Murphy Capital Management on August 1, 2017. • Acquired Quadrant Capital Management on November 1, 2017. • Major branch operations and administration technology upgrade. • Initiated multi - year wealth management redesign. • Launched Equipment Finance – Peapack Capital. • Successfully launched Platinum Service Team. • Treasury and Escrow Management platforms greatly enhanced. • First full year for SBA lending as a Preferred Lender : $1.6MM in fee income. • Adopted a robust loan pricing tool. • Supported over 235 community organizations with 1,200 volunteer hours and $313K in charitable donations. 2017 Achievements 7

Financial Highlights Branch Map Franchise Overview 8 NOTE: Financial data as of 03/31/2018. Private Banking Offices Bedminster, NJ Morristown, NJ Princeton, NJ Teaneck, NJ Fairfield, NJ Gladstone, NJ Greenville, DE – Trust and Investment Office Headquarters Bedminster, NJ Year Founded 1921 Branches 20 Total Assets $4.3 Bil Gross Loans $3.7 Bil Total Deposits $3.6 Bil Wealth Mgmt AUM/AUA $5.6 Bil Fee Income / Revenues 27% Market Cap $632 Mil

New Jersey Market Overview 1 Rank reflects ranking amongst all New Jersey counties. Note: Weighted average is calculated as the sum of (percent of state/national franchise * demographic item) within each marke t; banks, thrifts, and savings banks included (retail branches only). Source: S&P Global Market Intelligence, FDIC Population Household Income Median HHI Total Projected $100K - $199K > $200K Projected Branches Population Change Change % of % of HHI Change in Market 2018 2010-2018 2018-2023 Number Total Number Total 2018 2018-2023 NJ Market (County) Total PGC (Actual) (%) (%) (Actual) Market (Actual) Market ($) (%)Rank¹ Markets with PGC Branches Hunterdon, NJ 45 4 123,886 (3.48%) (0.93%) 15,089 32% 10,614 23% $111,743 4.51% 1 Morris, NJ 220 6 498,852 1.34% 0.95% 58,501 32% 42,357 23% $110,971 8.07% 2 Somerset, NJ 124 9 335,447 3.71% 1.98% 37,328 31% 27,557 23% $107,717 7.96% 3 Union, NJ 185 1 559,707 4.33% 2.37% 49,035 25% 26,037 13% $76,739 9.59% 11 PGC Branch Markets 574 20 1,517,892 2.52% 1.55% 159,953 29% 106,565 19% Weighted Avg.: PGC Branch Markets 2.50% 1.48% $107,573 7.73% Markets with PGC Private Banking Office Only Bergen, NJ 449 - 945,893 4.51% 2.38% 104,074 30% 65,331 19% $96,670 9.36% 4 Mercer, NJ 139 - 371,183 1.27% 0.82% 33,953 25% 18,674 14% $77,984 6.36% 10 Aggregate: State of NJ 2,946 20 8,968,348 2.01% 1.30% 872,229 27% 427,066 13% $78,317 8.08% Aggregate: National 326,533,070 5.76% 3.50% $61,045 8.86% 9

Considerable Growth Opportunity 10 Source: SNL Financial; Deposit data as of 06/30/2017 Deposit Market Share Rank Institutions (ST) Branches Deposits ($mm) Market Share (%) Avg Deposits Per Branch ($mm) 1 Bank of America Corp. (NC) 252 53,474 16.2 212 2 Toronto - Dominion Bank 246 39,843 12.1 162 3 Wells Fargo & Co. (CA) 286 39,268 11.9 137 4 PNC Financial Services Group (PA) 292 30,262 9.2 104 5 JPMorgan Chase & Co. (NY) 207 21,829 6.6 105 6 Investors Bancorp Inc (NJ 116 14,171 4.3 122 7 Valley National Bancorp (NJ) 140 11,476 3.5 82 8 Banco Santander 133 10,822 3.3 81 9 M&T Bank Corp. (NY) 97 10,031 3.0 103 10 Provident Financial Services (NJ) 81 6,296 1.9 78 11 Capital One Financial Corp. (VA) 44 6,006 1.8 137 12 OceanFirst Financial Corp. (NJ) 78 5,946 1.8 76 13 New York Community Bancorp (NY) 45 4,478 1.4 100 14 Citigroup Inc. (NY) 9 4,234 1.3 470 15 Lakeland Bancorp (NJ) 54 4,233 1.3 78 16 Peapack - Gladstone Financial (NJ) 20 3,591 1.1 180

Wealth Management Performance AUM / AUA $2.3 $2.7 $3.0 $3.3 $3.7 $5.5 $2.0 $2.5 $3.0 $3.5 $4.0 $4.5 $5.0 $5.5 $6.0 2012 2013 2014 2015 2016 2017 (Dollars in Billions) 11 YOY Growth +49%

Wealth Management Performance Fee Income $13.84 $15.24 $17.04 $18.24 $23.18 $8.00 $10.00 $12.00 $14.00 $16.00 $18.00 $20.00 $22.00 $24.00 2013 2014 2015 2016 2017 (Dollars in Millions) 12 YOY Growth +27%

1. Includes SBA Income, Swap Income, Deposit & Loan Fees, Mortgage Banking, and BOLI Wealth Management Significant Component of Revenue Net Int Income 76% Wealth Fees 16% Fees & Other Inc 8% For Twelve Months Ended December 31, 2017 Total Non - Interest Income: 24% of Total Revenue Net Interest Income before Provision Wealth Fee Income Fees & Other Income 1 Total Non - Interest Income Target 35% - 45% 13

Stock Price Performance 2012 - 2017 Note: Market data as of December 31, 2017 Source: S&P Global Market Intelligence Five Year Comparative Stock Price Performance: 12/31/2012 – 12/31/2017 (20%) 0% 20% 40% 60% 80% 100% 120% 140% 160% 12/31/12 06/30/13 12/31/13 06/30/14 12/31/14 06/30/15 12/31/15 06/30/16 12/31/16 06/30/17 12/31/17 PGC +148.7% NASDAQ Bank +112.9% KBW Nasdaq Bank +108.1% 14

PGC Comparative Stock Price Performance Five Year Comparative Stock Price Performance: 12/31/2012 – 12/31/2017 Note: Market data as of December 31, 2017 Source: S&P Global Market Intelligence 257.7% 174.4% 154.3% 148.7% 147.5% 143.2% 99.7% 88.1% 77.5% 72.8% 67.8% SCHW MS BAC PGC PNC JPM GS C WF AXP USB

Financial Trends and 2017 Results P EAPACK - G LADSTONE B ANK

Steady Growth: Net Income $0.00 $5.00 $10.00 $15.00 $20.00 $25.00 $30.00 $35.00 $40.00 2012 2013 2014 2015 2016 2017 $19.97 $14.89 $9.26 $9.22 $26.48 (Dollars in Millions) 17 $36.50 YOY Growth +38%

Steady Growth: Earnings Per Share $0.00 $0.50 $1.00 $1.50 $2.00 $2.50 2012 2013 2014 2015 2016 2017 $1.29 $1.22 $1.01 $1.05 $1.60 (Dollars per Share) 18 $2.03 YOY Growth +27%

Steady Improvement: ROAA 0.61% 0.54% 0.63% 0.64% 0.72% 0.89% 0.30% 0.40% 0.50% 0.60% 0.70% 0.80% 0.90% 1.00% 2012 2013 2014 2015 2016 2017 19

Steady Improvement: ROAE 8.03% 7.37% 7.96% 7.71% 8.92% 10.12% 5.00% 6.00% 7.00% 8.00% 9.00% 10.00% 11.00% 12.00% 2012 2013 2014 2015 2016 2017 20
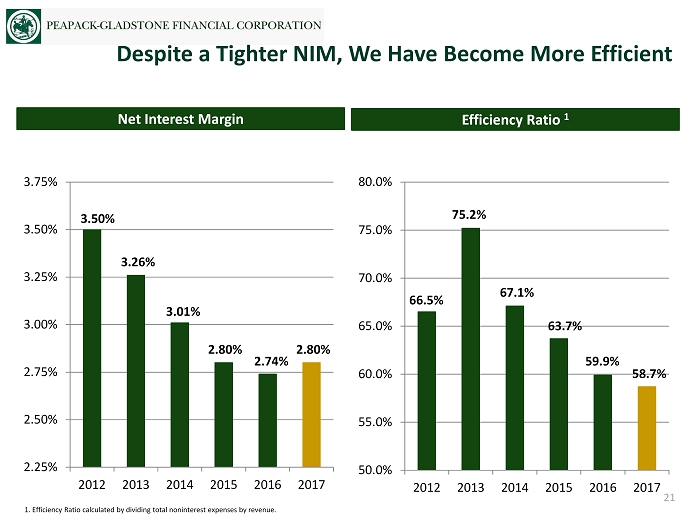
Efficiency Ratio 1 Net Interest Margin Despite a Tighter NIM, We Have Become More Efficient 50.0% 55.0% 60.0% 65.0% 70.0% 75.0% 80.0% 2012 2013 2014 2015 2016 2017 21 2.25% 2.50% 2.75% 3.00% 3.25% 3.50% 3.75% 2012 2013 2014 2015 2016 2017 1. Efficiency Ratio calculated by dividing total noninterest expenses by revenue. 66.5% 75.2% 67.1% 63.7% 59.9% 58.7% 3.50% 3.26% 3.01% 2.80% 2.74% 2.80%

Note: Gross loans include loans held for sale Loan Growth $0.000 $0.500 $1.000 $1.500 $2.000 $2.500 $3.000 $3.500 $4.000 2012 2013 2014 2015 2016 2017 $2.997 $2.251 $1.576 $1.153 $3.314 (Dollars in Billions) 22 $3.706 YOY Growth +12%

Note: Gross loans include loans held for sale. Loan Composition: A Transformational Change 23 MFL 37.5% Target 20% - 30% CRE 16.9% Target 15% - 20% C&I 25.9% Target 35% - 45% Resi / Cons 19.7% Target 15% - 20% Resi / Cons 52.6% C&I 10.0% CRE 22.4% MFL 14.0% As of December 31, 2017 As of December 31, 2012 Gross Loans: $1,153 million Gross Loans: $3,706 million Residential / Consumer Multifamily CRE Commercial & Industrial

NPAs ² / Assets Texas Ratio ¹ Strong Credit Metrics 0.00% 2.00% 4.00% 6.00% 8.00% 10.00% 12.00% 2012 2013 2014 2015 2016 2017 0.00% 0.10% 0.20% 0.30% 0.40% 0.50% 0.60% 0.70% 0.80% 0.90% 1.00% 2012 2013 2014 2015 2016 2017 4.62% 3.13% 2.45% 3.34% 11.34% 0.91% 0.44% 0.30% 0.22% 0.30% 24 3.75% 0.37% 1. Texas Ratio defined as nonaccrual loans plus other real estate owned and loans 90+ day past due as a percentage of the sum of ta ngible common equity and loan loss reserves. 2. Nonperforming assets defined as nonaccrual loans, loans 90+ days past due, and real estate owned. Note: Total loans exclude loans held for sale.

NCOs / Average Loans LLR / Gross Loans Strong Credit Metrics 0.75% 1.00% 1.25% 1.50% 2012 2013 2014 2015 2016 2017 0.00% 0.10% 0.20% 0.30% 0.40% 0.50% 0.60% 0.70% 0.80% 0.90% 2012 2013 2014 2015 2016 2017 1.12% 0.98% 0.87% 0.89% 0.97% 0.04% 0.80% 0.06% 0.03% 0.04% 25 0.98% 0.05%

Deposit Growth $1.516 $1.647 $2.299 $2.935 $3.412 $3.698 $0.000 $0.500 $1.000 $1.500 $2.000 $2.500 $3.000 $3.500 $4.000 2012 2013 2014 2015 2016 2017 (Dollars in Billions) 26 YOY Growth +8%

$28 $49 $63 $78 $96 2013 2014 2015 2016 2017 Year Over Year +23% Deposits Per Branch and Loans Per Employee Net Income / Period End FTE (Dollars in thousands) $66 $72 $100 $140 $171 $185 $3.95 $4.84 $7.36 $9.48 $9.80 $9.65 2012 2013 2014 2015 2016 2017 Deposits Per Branch Loans Per Employee (Dollars in millions) Our People Are Very Productive 27
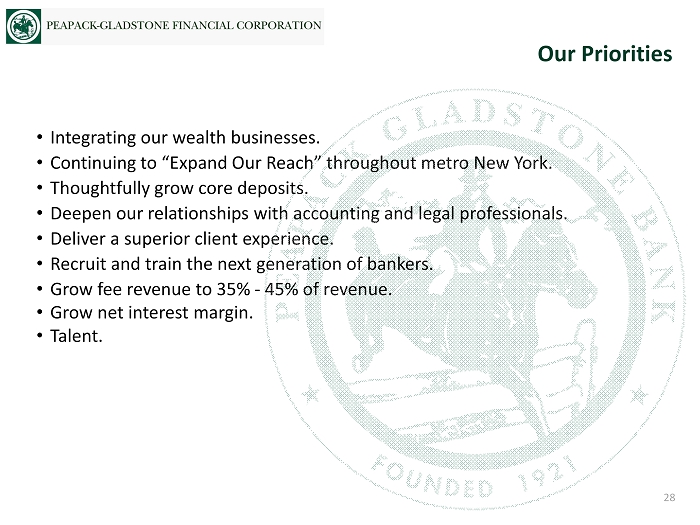
• Integrating our wealth businesses. • Continuing to “Expand Our Reach” throughout metro New York. • Thoughtfully grow core deposits. • Deepen our relationships with accounting and legal professionals. • Deliver a superior client experience. • Recruit and train the next generation of bankers. • Grow fee revenue to 35% - 45% of revenue. • Grow net interest margin. • Talent. Our Priorities 28

Select Financial Highlights Q1 2018 Annual Meeting May 9, 2018 P EAPACK - G LADSTONE B ANK

How Do We Get There: • Wealth Management growth – organic and acquisition. • Continue migration of loan portfolio to C&I. • NIM expansion. • Further efficiencies. Profitability Targets 30 Profitability Metrics Year 2017 Quarter March 2018 Targets Fee Income / Revenue 24% 27% 35% - 45% of revenue EPS Growth - Year Over Year 27% 24% Double digit annually ROAA 0.89% 1.01% 1.15% - 1.20% ROAE 10.12% 10.54% 11% - 12% Efficiency Ratio 59% 60% Low to mid 50's
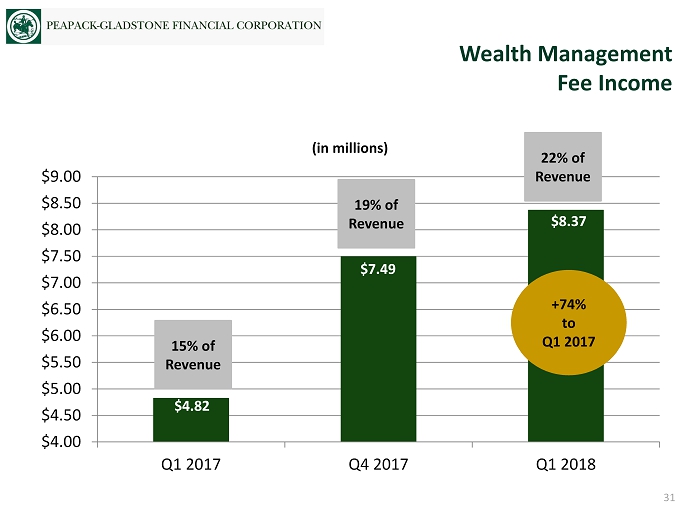
Wealth Management Fee Income $4.00 $4.50 $5.00 $5.50 $6.00 $6.50 $7.00 $7.50 $8.00 $8.50 $9.00 Q1 2017 Q4 2017 Q1 2018 (in millions) $4.82 $7.49 $8.37 +74% to Q1 2017 31 15% of Revenue 22% of Revenue 19% of Revenue

Wealth Management Assets Under Admin/ Mgmt $3.10 $3.40 $3.70 $4.00 $4.30 $4.60 $4.90 $5.20 $5.50 $5.80 Q1 2017 Q4 2017 Q1 2018 (in billions) $3.8 $5.5 $5.6 +47% to Q1 2017 32

Pre - Tax Income $10.00 $12.00 $14.00 $16.00 Q1 2017 Q4 2017 Q1 2018 $11.71 $13.29 $14.02 (in millions) +20% to Q1 2017 33

Net Income $3.00 $4.00 $5.00 $6.00 $7.00 $8.00 $9.00 $10.00 $11.00 $12.00 Q1 2017 Q4 2017 Q1 2018 (in millions) $7.98 $10.81 $10.37 +35% to Q1 2017 34

Earnings Per Share $0.10 $0.15 $0.20 $0.25 $0.30 $0.35 $0.40 $0.45 $0.50 $0.55 $0.60 Q1 2017 Q4 2017 Q1 2018 $0.46 $0.56 $0.57 +24% to Q1 2017 35
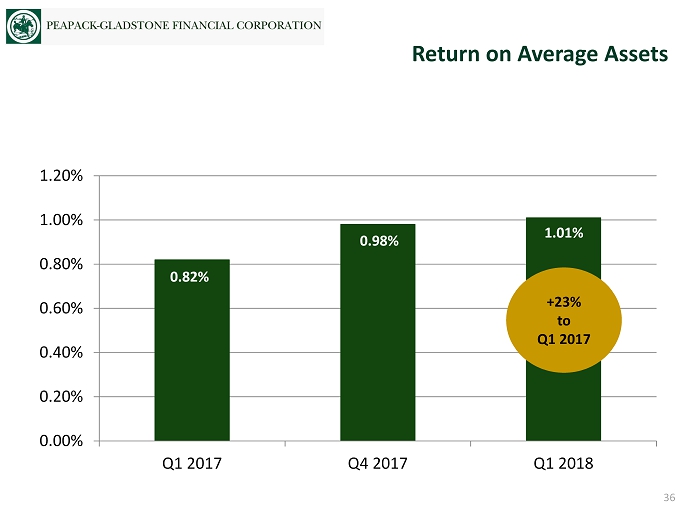
Return on Average Assets 0.00% 0.20% 0.40% 0.60% 0.80% 1.00% 1.20% Q1 2017 Q4 2017 Q1 2018 0.82% 0.98% 1.01% +23% to Q1 2017 36
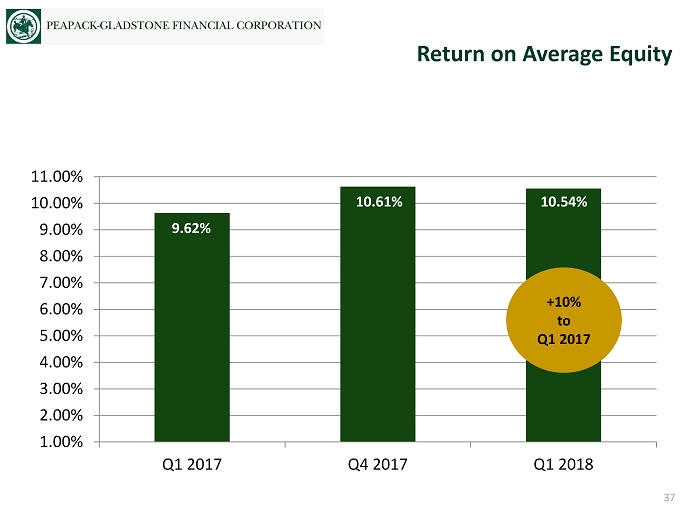
Return on Average Equity 1.00% 2.00% 3.00% 4.00% 5.00% 6.00% 7.00% 8.00% 9.00% 10.00% 11.00% Q1 2017 Q4 2017 Q1 2018 9.62% 10.61% 10.54% +10% to Q1 2017 37
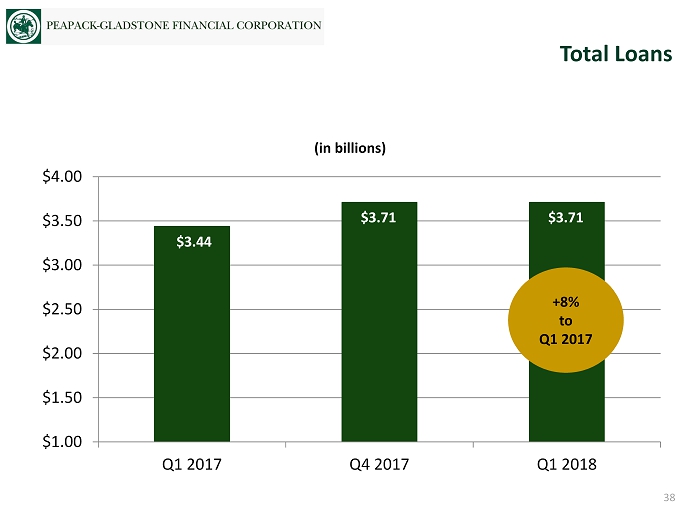
Total Loans $1.00 $1.50 $2.00 $2.50 $3.00 $3.50 $4.00 Q1 2017 Q4 2017 Q1 2018 (in billions) $3.44 $3.71 $3.71 +8% to Q1 2017 38
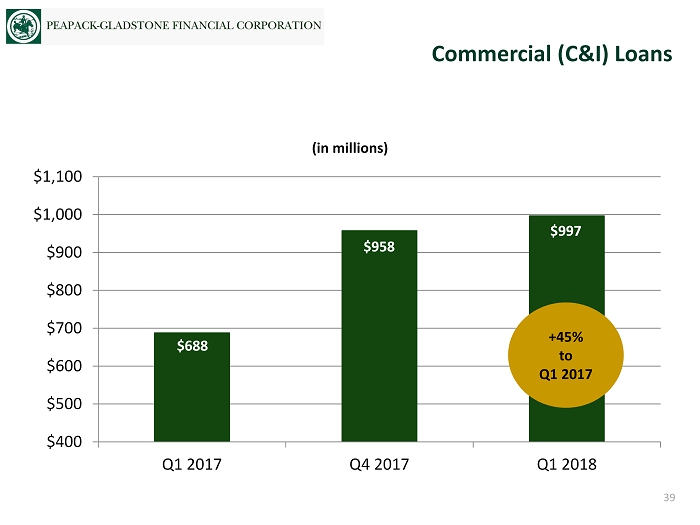
Commercial (C&I) Loans $400 $500 $600 $700 $800 $900 $1,000 $1,100 Q1 2017 Q4 2017 Q1 2018 (in millions) $688 $958 $997 +45% to Q1 2017 39

Total Deposits $1.00 $1.50 $2.00 $2.50 $3.00 $3.50 $4.00 $4.50 Q1 2017 Q4 2017 Q1 2018 (in billions) $3.43 $3.70 $3.55 +4% to Q1 2017 40

Non - Performing Assets Ratio 0.10% 0.30% 0.50% 0.70% 0.90% 1.10% 1.30% 1.50% Q1 2017 Q4 2017 Q1 2018 0.31% 0.37% 0.36% (NPAs as a % of Assets) 41

Tangible Book Value Per Share* $12.00 $13.00 $14.00 $15.00 $16.00 $17.00 $18.00 $19.00 $20.00 $21.00 $22.00 Q1 2017 Q4 2017 Q1 2018 $19.22 $20.40 $21.07 * Tangible book value per share is calculated by dividing tangible equity by period end common shares outstanding. See non - GAAP financial measures reconciliation table on page 46. +10% to Q1 2017 42
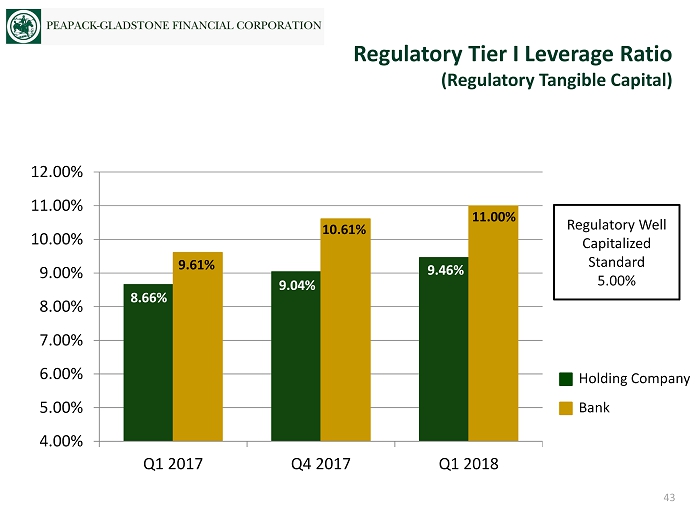
Regulatory Tier I Leverage Ratio (Regulatory Tangible Capital) 4.00% 5.00% 6.00% 7.00% 8.00% 9.00% 10.00% 11.00% 12.00% Q1 2017 Q4 2017 Q1 2018 Regulatory Well Capitalized Standard 5.00% 8.66% 9.04% 9.46% 9.61% 10.61% 11.00% Holding Company Bank 43

8.00% 9.00% 10.00% 11.00% 12.00% 13.00% 14.00% 15.00% 16.00% Q1 2017 Q4 2017 Q1 2018 Regulatory Well Capitalized Standard 10.00% 13.41% 14.84% 15.32% 13.05% 14.34% 14.81% Holding Company Bank Regulatory Tier I and II Capital to RWA (Regulatory Total Capital to Risk Weighted Assets) 44
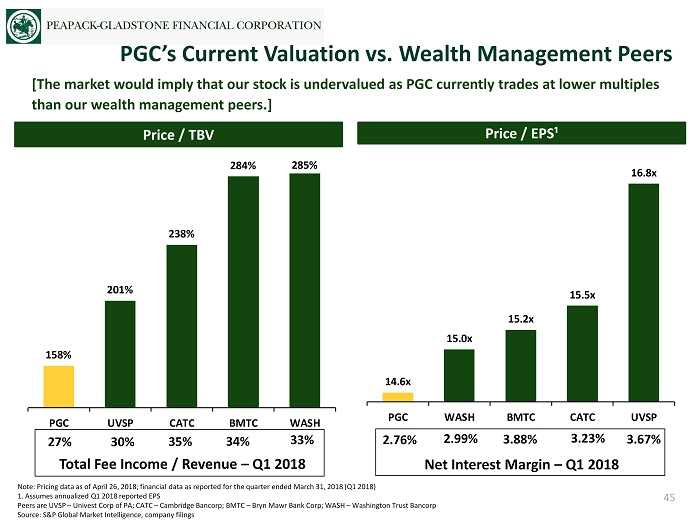
[The market would imply that our stock is undervalued as PGC currently trades at lower multiples than our wealth management peers.] PGC’s Current Valuation vs. Wealth Management Peers 45 Note: Pricing data as of April 26, 2018; financial data as reported for the quarter ended March 31, 2018 (Q1 2018) 1. Assumes annualized Q1 2018 reported EPS Peers are UVSP – Univest Corp of PA; CATC – Cambridge Bancorp; BMTC – Bryn Mawr Bank Corp; WASH – Washington Trust Bancorp Source: S&P Global Market Intelligence, company filings Price / TBV Price / EPS¹ 14.6x 15.0x 15.2x 15.5x 16.8x PGC WASH BMTC CATC UVSP 158% 201% 238% 284% 285% PGC UVSP CATC BMTC WASH Total Fee Income / Revenue – Q1 2018 27% 30% 35% 34% 33% Net Interest Margin – Q1 2018 2.99% 2.76% 3.88% 3.23% 3.67%

We believe that these non - GAAP financial measures provide information that is important to investors and that is useful in under standing our financial position, results and ratios. Our management internally assesses our performance based, in part, on these measures. However, these non - GAAP financ ial measures are supplemental and are not a substitute for an analysis based on GAAP measures. Non - GAAP Financial Measures Reconciliation 46 (Dollars in Thousands, Except Per Share Data) As Reported for the: Three Months Ended Mar 31, Dec 31, Mar 31, 2018 2017 2017 Tangible Book Value Per share Shareholders Equity $ 422,406 $ 403,678 $ 340,928 Less Intangible assets, net 23,656 23,836 3,126 Tangible equity $ 398,750 $ 379,842 $ 337,802 Period end shares outstanding 18,921,114 18,619,634 17,579,274 Tangible book value per share $ 21.07 $ 20.40 $ 19.22 Book value per share 22.32 21.68 19.39