Attached files
| file | filename |
|---|---|
| 8-K - 8-K - UMPQUA HOLDINGS CORP | umpq8-kdadcopresentation.htm |

DA Davidson Financial Institutions Conference May 9, 2018

Forward Looking Statements This presentation includes forward-looking statements within the meaning of the “Safe-Harbor” provisions of the Private Securities Litigation Reform Act of 1995, which management believes are a benefit to shareholders. These statements are necessarily subject to risk and uncertainty and actual results could differ materially due to various risk factors, including those set forth from time to time in our filings with the SEC. You should not place undue reliance on forward-looking statements and we undertake no obligation to update any such statements. In this presentation we make forward-looking statements about corporate initiatives, the credit discount accretion related to loans acquired from Sterling, store consolidations and facilities optimization and related costs and savings, and indirect auto wind down. Risks that could cause results to differ from forward-looking statements we make are set forth in our filings with the SEC and include, without limitation, prolonged low interest rate environment; the effect of interest rate increases on the cost of deposits; unanticipated weakness in loan demand or loan pricing; deterioration in the economy; lack of strategic growth opportunities or our failure to execute on those opportunities; our inability to effectively manage problem credits; our inability to successfully implement efficiency initiatives; our ability to successfully develop and market new products and technology; and changes in laws or regulations. 2

About Umpqua • $25.9 billion in assets • Headquartered in Portland, OR • NASDAQ: UMPQ • Roots dating back to 1953 • Top 10 deposit share in Oregon and Washington • Established mortgage banking franchise • Strong brand and culture 3

Uniquely Positioned Geographic Footprint One of largest regional banks on the West Coast • Ranked 4th in Oregon, with 10.21% deposit share • Ranked 8th in Washington, with 3.26% deposit share • Positioned for future growth in California, specifically Bay Area through central coast to Southern California Top 5 deposit share in half of the MSAs we operate in Projected Population Change 2017-2022 6.00% 5.43% 5.00% 3.77% 4.00% 3.00% 2.00% 1.00% 0.00% Weighted average: UMPQ Aggregate: US markets MSA: Metropolitan statistical area. Source: SNL Financial. FDIC deposit market share data as of June 30, 2017 4

Stock Price Outperforming Peers • Since the beginning of 2017, UMPQ has significantly outperformed the KRX • UMPQ had the highest total shareholder return (TSR) of all 50 KRX bank stocks over that period Stock Price Performance vs KRX 140 133.1 130 Umpqua Next 120 Gen announced 110 100 103.3 90 80 UMPQ KBW Regional Bank Index (KRX) Source: Bloomberg, performance from December 31, 2016 to April 26, 2018. 5

Umpqua Next Gen Operational Balanced Growth Excellence Human Digital Generating valuable new Completed 31 store Re-investing in technology, data and analytics multi-faceted banking consolidations in Q1 2018 Engage app being rolled out relationships Commercial banking re- Re-designed Umpquabank.com More consistent and organization completed Launched new digital diversified growth marketing campaign Back-office efficiency Highlighted by success of new underway (see slide 7) Building new systems to deepen customer relationships Corporate Banking group Indirect auto business in wind Begun relationship-based down training across organization 6

Operational Excellence: Back Office Engaged The Boston Consulting Group to help identify and implement Operational and Focused on non-customer facing areas Back Office Initial diagnostic review completed during Q1 2018 Efficiency Individual workstreams identified, several underway Review Stronger financial performance and improved profitability Better customer experience Financial Targets Workstreams • Phase I • Phase I • Identified $18 - $24 million in annual run-rate savings, or 6% - 8% (1) • Organizational simplification and design • $12 - $16 million annual run-rate savings achieved by Q4 2018 • Procurement • 100% run-rate savings achieved by mid-2019 • $5 - $6 million in charges (severance, professional fees) during both Q2 2018 and Q3 2018 • Phase I additive to 2020 ROATCE goals(2) by ~50 basis points • Phase II • Phase II • Additional $6 - $12 million in annual run-rate savings, • Real-estate optimization or 2% - 4%(1) • Technology simplification • Run-rate savings achieved by end of 2019 • End-to-end customer journey redesign • Additional costs to achieve to be determined (1) Percentage savings calculated off of $300 million in back-office and operations expense base. (2) ROATCE goals of 14.5% in “flat rate” scenario and 17.0% in “moderately increasing” rate scenario, as presented in the 4Q 2017 earnings call slide presentation on January 24, 2018. 7

Q1 2018 Highlights • Net earnings available to common shareholders of $77.7 million, or $0.35 per diluted common share • Net interest income increased by $2.6 million, or 1%, driven primarily by growth in loans and leases and an 8 basis point increase in NIM • Provision for loan and lease losses increased by $0.7 million, driven primarily by continued loan growth and higher net charge-offs, which increased by one basis point to 0.26% of average loans and leases (annualized) • Non-interest income increased by $8.1 million, driven primarily by the change in accounting for subordinated debentures carried at fair value, partially offset by lower mortgage banking revenue and lower gains on portfolio loan sales • Non-interest expense decreased by $6.7 million, driven primarily by lower salaries and benefits expense, partially offset by a linked quarter increase in FDIC assessment expense related to one-time credits recorded in the prior quarter • Provision for income taxes increased by $20.9 million, reflecting the net benefit received in the fourth quarter of 2017 related to the revaluation of the net deferred tax liability, partially offset by a lower corporate tax rate, both attributable to the Tax Cuts and Jobs Act (“Tax Act”) • Gross loan and lease growth of $234.4 million, or 5% annualized, and deposit growth of $158.6 million, or 3% annualized • Non-performing assets to total assets decreased by four basis points to 0.33% • Estimated total risk-based capital ratio of 14.0% and estimated Tier 1 common to risk weighted assets ratio of 11.0% • Increased the quarterly cash dividend by 11.1% to $0.20 per common share 8

Net Interest Income and Margin (in millions) $220.5 $220.6 $223.2 5.50% $220 $212.1 $206.7 5.00% $200 4.50% $180 3.91% 3.94% 3.96% 3.85% 3.88% 4.00% $160 $140 3.50% $120 3.00% $100 2.50% Q1 2017 Q2 2017 Q3 2017 Q4 2017 Q1 2018 Net interest income Net interest margin Adjusted 3.71% 3.78% 3.78% 3.79% 3.87% NIM (1) (1) Net interest margin, excluding interest income related to credit discount from Sterling deal and related to 310-30 covered loan PIFs. 9

Non-interest Income (in millions) $90 $78.6 $80 $75.4 $71.1 $70.5 $70 $15.0 $15.8 $60.2 $15.5 $15.4 $60 $4.2 $3.8 $14.7 $3.9 $4.2 $50 $4.1 $40 $33.4 $38.4 $33.9 $30 $26.8 $42.1 $2.0 $2.1 $20 $2.1 $1.2 $2.1 $8.0 $1.8 $3.3 $10 $2.0 $17.6 $10.7 $12.4 $12.3 $3.7 $0 $3.0 Q1 2017 Q2 2017 Q3 2017 Q4 2017 Q1 2018 Other (1) Gain on loan sales BOLI income Residential mortgage banking revenue, net Brokerage revenue Service charges (1) Includes other income, gains or losses on investment securities and losses on junior subordinated debentures carried at fair value. 10

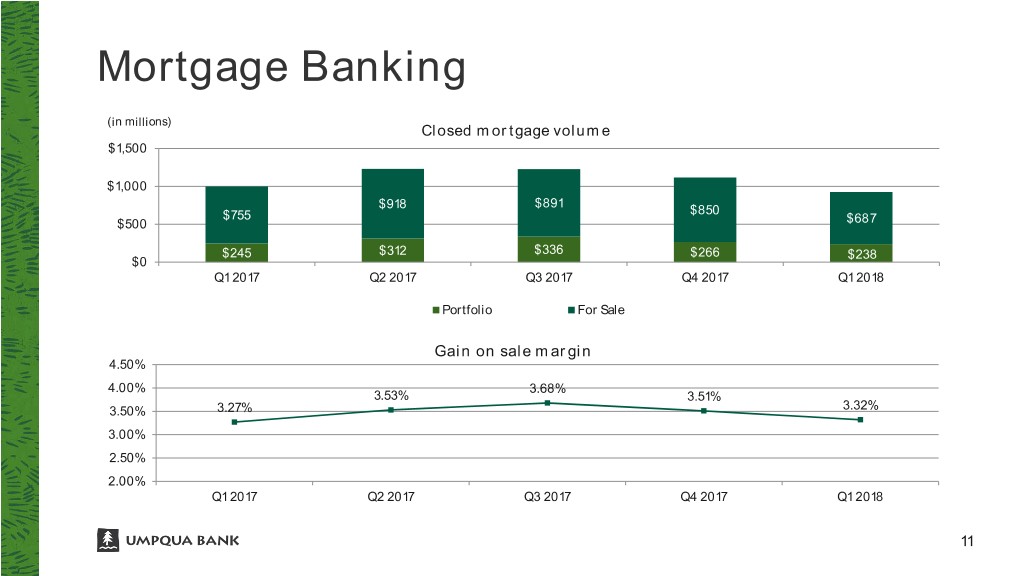
Mortgage Banking (in millions) Closed mortgage volume $1,500 $1,000 $918 $891 $755 $850 $500 $687 $245 $312 $336 $266 $238 $0 Q1 2017 Q2 2017 Q3 2017 Q4 2017 Q1 2018 Portfolio For Sale Gain on sale margin 4.50% 4.00% 3.68% 3.53% 3.51% 3.50% 3.27% 3.32% 3.00% 2.50% 2.00% Q1 2017 Q2 2017 Q3 2017 Q4 2017 Q1 2018 11

Mortgage Banking Outperforming Market • Mortgage business remains a key strength • Total mortgage banking revenues on high end, but within range of peers • Umpqua has outperformed the mortgage industry both in earnings volatility and cost control • Mortgage customers have more products per household and deeper penetration Total Expense Growth (bps, index = 100 in 2015) 120 116 115 109 110 111 105 100 106 100 95 100 2015 2016 2017 MBA Benchmark Umpqua Source: Mortgage Bankers Association (MBA), internal data. 12

MSR Portfolio • Mortgage Servicing Rights (MSR) generate solid long-term cash flows • Fair value adjustments more volatile quarter-to-quarter, but stable over longer-term horizon • Offers natural hedge to mortgage origination business in changing interest rate environment • Valuable in maintaining relationships and meeting customers’ needs MSR as a % of Serviced Portfolio 1.20% 1.07% 1.03% 1.01% 1.00% 1.00% 0.98% 0.98% 0.96% 0.94% 1.00% 0.88% 0.83% 0.82% 0.80% 0.60% 0.40% 0.20% 0.00% Q2 2015 Q3 2015 Q4 2015 Q1 2016 Q2 2016 Q3 2016 Q4 2016 Q1 2017 Q2 2017 Q3 2017 Q4 2017 Q1 2018 13

Non-interest Expense Non-interest Expense and Efficiency Ratio Non-interest Expense Bridge (in millions) (in millions) $192.8 $6.8 $205.0 130.0% $192.8 $4.5 $(2.4) $186.1 $195.0 $188.4 120.0% $(2.7) $184.0 $186.1 $185.0 $182.7 110.0% $3.3 $(3.4) $0.6 $175.0 100.0% $165.0 90.0% $155.0 80.0% 68.2% 64.7% 66.0% $145.0 63.4% 61.6% 70.0% $135.0 60.0% $125.0 50.0% $115.0 40.0% Q1 2017 Q2 2017 Q3 2017 Q4 2017 Q1 2018 Non-interest expense Efficiency ratio 14

Loan and Deposit Growth (in billions) Loans and Leases (Gross) As of Mar 31, 2018 $19.1 $19.3 $17.5 $16.9 4% Non-owner occupied term CRE $15.3 Owner occupied term CRE 6% Multifamily 18% Commercial construction $7.7 17% Residential development $6.4 $6.5 $7.2 13% Commercial term 6% Commercial lines of credit & other Leases & equipment finance 16% 6% 10% Mortgage Home equity lines & loans 1% 3% Consumer & other (in billions) Total Deposits $19.9 $20.1 $19.0 As of Mar 31, 2018 $16.9 $17.7 Demand, non-interest 15% $9.4 $9.2 $9.4 $9.1 bearing Demand, interest bearing 7% 33% Money market Savings 33% 12% Time 15

Credit Quality Non-performing Assets to Total Assets Net Charge-offs to Average Loans and Leases 1.00% 1.00% 0.80% 0.80% 0.60% 0.60% 0.37% 0.30% 0.33% 0.40% 0.40% Annualized 0.26% 0.24% 0.23% 0.22% 0.22% 0.20% 0.25% 0.20% 0.20% 0.00% 0.00% Q1 2017 Q2 2017 Q3 2017 Q4 2017 Q1 2018 Q1 2017 Q2 2017 Q3 2017 Q4 2017 Q1 2018 Allowance for Loan and Lease Losses to Loan and Lease Losses 1.00% 0.80% 0.60% 0.76% 0.75% 0.75% 0.74% 0.73% 0.40% 0.20% 0.00% Q1 2017 Q2 2017 Q3 2017 Q4 2017 Q1 2018 16

Capital • All regulatory capital ratios remained in excess of well-capitalized and internal policy limits • Focused on prudently managing capital • Quarterly dividend of $0.20 per share, ~3.4% current dividend yield • Q1 total payout ratio of 57% Q1 2018 Capital Ratios (1) 14.0% 11.0% 11.0% 9.1% 9.5% Tangible Common Tier 1 Leverage Tier 1 Common Risk Tier 1 Risk Based Total Risk Based Equity/Tangible Assets Based (1) Regulatory capital ratios are estimates pending completion and filing of the Company’s regulatory reports. 17

Questions?
