Attached files
| file | filename |
|---|---|
| EX-99.1 - EX-99.1 - TripAdvisor, Inc. | trip-ex991_6.htm |
| 8-K - 8-K - TripAdvisor, Inc. | trip-8k_20180508.htm |
Exhibit 99.2

TripAdvisor, Inc. Q1 2018 Prepared Remarks
(All comparisons are against the same period of the prior year, unless otherwise noted; some calculations may not foot due to rounding)
We’ve had a strong start to 2018. We saw continued auction stability and our click-based results were ahead of our expectations. Hotel profitability improved for a second straight quarter and Non-Hotel continues to scale rapidly.
Q1 consolidated revenue grew 2%, with 36% Non-Hotel segment revenue growth more than offsetting a 5% decline in Hotel segment revenue. On the bottom line, consolidated adjusted EBITDA grew 10%.
We are encouraged by a number of underlying trends. Stabilizing Hotel adjusted EBITDA performance was a good result relative to tough year-over-year comparisons for auction pricing. Our ongoing initiative to increase the profitability of our online marketing investments has benefitted Hotel adjusted EBITDA, and has come with the expected near-term trade-offs to hotel shopper growth and click-based revenue growth. We’ve also continued to get positive consumer response to our TV campaign. In Non-Hotel, Experiences (formerly Attractions) and Restaurants drove accelerated revenue growth in Q1 and we continue to see plenty of growth opportunity ahead.
Solid Q1 trends have extended into Q2, and our good start to the year has improved our 2018 adjusted EBITDA outlook.
At the same time, our travel platform continues to strengthen. Our rich travel content grew 26% to 630 million reviews and opinions, and our large travel community grew 12% to 433 million average monthly unique visitors in Q1. Scale and global reach give TripAdvisor a differentiated competitive position and present us with unique, attractive growth opportunities within the $1.6 trillion travel ecosystem. This year we continue to lay important groundwork – building a more holistic end-to-end user experience and more advertising opportunities for more partners – that we believe will enable us to deliver healthy, profitable and diversified growth for years to come.
Q1 2018 Hotel Segment Update
Hotel segment revenue declined 5% while Hotel adjusted EBITDA was flat. Click-based revenue declined 10%, display and subscription revenue grew 9% and other hotel revenue grew 3%.
In our click-based auction, we’ve made progress in two key areas: driving product enhancements and optimizing our marketing investments across online and offline channels.
Building upon the momentum of last year’s re-design and our increased emphasis on mobile, during Q1 we continued to enhance the user experience and deliver more high-performing leads to our partners. Nowhere is our progress more evident than on mobile. Revenue per mobile hotel shopper again grew in
1
excess of 20% during Q1, driving 50% click-based revenue growth on mobile. User engagement remained strong as well, as mobile average monthly unique hotel shoppers grew 20%.
We’ve also had continued success optimizing our online marketing investments. Maximizing the number of bookings and total booking value we drive for our partners – as opposed to clicks – has enabled us to allocate marketing dollars more efficiently and to increase the profitability of our online marketing channels.
We continue to re-invest some of our online marketing savings to grow our brand advertising campaign. During Q1 we increased investments in markets that we launched last year, and launched TV ads in a handful of new markets. In all, we invested $24 million during the period. We expect to ramp this investment over the next couple of quarters and we continue to target a $100 to $130 million investment this year to amplify our “best price” consumer message.
Despite investing in brand advertising in Q1 2018, but not in the comparable period last year, consolidated direct selling and marketing expenses declined year-over-year – highlighting our material reduction of non-TV direct marketing expense. This helped generate improved Q1 Hotel segment adjusted EBITDA margin of 29%.

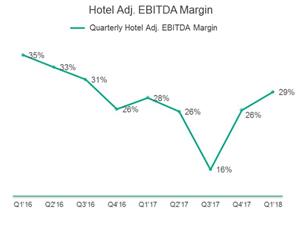
Our total selling and marketing expense growth has been on a comparable trend to what is reflected in the direct selling and marketing expense graph above. Absent our brand advertising investment, Hotel segment direct selling and marketing expense has decreased as a percentage of Hotel segment revenue in every quarter since Q1 2017. As expected, this has contributed to slower year-over-year hotel shopper growth, which was flat in Q1 2018. Q1 TripAdvisor click-based and transaction revenue declined 10%, a slight improvement compared to an 11% year-over-year decline in Q4 2017. Revenue per hotel shopper declined 11% in Q1, which was three percentage points better than the 14% decline in Q4 2017. These results were slightly better than we expected for Q1, and we expect click-based revenue trends to start to improve later in the year when we begin to lap the second half 2017 changes our partners made to their online marketing efficiency targets.
Looking at the rest of our Hotel segment, display and subscription revenue grew 9% due to some wins that came earlier in the year than we anticipated, as well as due to early traction for our media ad products aimed at helping more hoteliers increase their visibility on our platform. Other hotel revenue grew a modest 3%.
2
Our 2018 focus remains on changing the profit trajectory of our Hotel business, and Q1 results showed nice progress. Longer-term, our focus is to get our Hotel segment back to sustainable, profitable revenue growth.
Q1 2018 Non-Hotel Segment Update
Experiences and Restaurants drove accelerated Non-Hotel segment revenue growth of 36% and adjusted EBITDA improved year-over-year. We are capitalizing on our platform’s distinct supply and demand advantages to enhance the user experience, to drive value for partners and to drive diversified revenue growth.
In Experiences, during Q1 we continued moving fast to further reinforce TripAdvisor’s leadership position as the world’s largest and most comprehensive online platform to find and book travel experiences.
While our supply acquisition and onboarding initiatives are still ramping, the pace of supply growth accelerated in Q1, up 86% to 104,000 bookable experiences compared to 48% growth in Q4 2017. (This bookable supply count is now inclusive of seasonal products, which added roughly 11 percentage points to our Q1 supply growth rate). Continued rapid supply growth has been powered largely by improvements we made in mid-2017 to reduce onboarding friction for suppliers, making it easier for them to seamlessly upload product descriptions, pricing and availability onto our platform.
Further to our comprehensive global supply growth strategy, we recently announced our acquisition of Bokun, a leading provider of business management software created specifically for suppliers of tours, attractions and other travel experiences. We’re excited to equip partners with a world-class SaaS solution that can help them harness the powerful TripAdvisor platform, manage distribution channels and pricing, and drive more bookings from our massive global travel audience.
Restaurants also continued its rapid revenue growth in Q1, due to continued strong seated diner growth of 30%, supply growth initiatives in key markets, and early traction for our media ad products that help more restauranteurs increase their visibility on TripAdvisor. Turning to Rentals, we had 800,000 listings at the end of Q1, and this offering remains a nice complementary asset in an attractive and competitive alternative accommodations industry.
We are keeping the pedal down, delivering product improvements and platform expansion as we match more users with more great travel experiences.
Q1 2018 Consolidated Financials
Our Q1 consolidated total revenue increased 2% year-over-year in reported currency. We estimate that changes in foreign currency provided a 5% tailwind in the period.
Q1 consolidated GAAP net income declined $8 million, partially driven by a $5 million income tax adjustment charge recorded in Q1. This charge was an incremental adjustment to the mandatory one-time transition tax resulting from the deemed repatriation tax on the accumulated earnings from our foreign subsidiaries pursuant to the U.S. Tax Cuts and Jobs Act of 2017.
3
Our Q1 GAAP effective tax rate was 76%. In addition to the aforementioned tax adjustment charge, foreign valuation allowances and stock-based compensation shortfalls contributed to this elevated GAAP tax rate. Offset partially by favorable provisions related to U.S. tax reform, we expect these factors will result in a full-year 2018 GAAP effective tax rate in the mid-30 percent range while our non-GAAP tax rate, which is not subject to share price volatility, will be less impacted.
Q1 consolidated total adjusted EBITDA increased by 10% in reported currency. We estimate that changes in foreign currency provided a 7% tailwind in the period.
Q1 cash provided by operating activities was $174 million, or 46% of revenue, up from $134 million in Q1 2017. Capital expenditures were $15 million, or 4% of revenue, and have remained relatively flat since the fourth quarter of 2015, a testament to our capital light operating model. As a result, Q1 free cash flow was $159 million, up 37% from $116 million in Q1 2017.
Cash, cash equivalents and short-term and long-term marketable securities were $655 million at March 31, 2018, a decrease of $80 million in the period driven primarily by our net repayment of $230 million of borrowings under our 2015 credit facility, offset partially by our strong free cash flow generation.
In Q1 our Board of Directors authorized $250 million for the repurchase of our common stock, and, as of May 7, we had repurchased 2.6 million shares for $100 million.
In summary, it was a strong start to the year. The TripAdvisor travel platform is strong and growing and we have exciting opportunities ahead.
2018 Outlook
As a reminder, consumer adoption of mobile, competition on marketing channels, travel industry competitive dynamics, bidding volatility in our click-based auction and macro-economic events – among a number of other factors outside of our control – can limit our visibility into near-term financial performance. We endeavor to be as accurate as possible with our forward-looking commentary, though these factors can cause actual results to vary materially.
In February we outlined our expectation of approximately flat consolidated adjusted EBITDA in 2018 compared to 2017. Our solid start to the year makes us more positive, and we now expect to deliver year-over-year consolidated adjusted EBITDA growth in 2018.
We are also incrementally positive about our revenue prospects, while maintaining our expectation that 2018 Hotel segment revenue will decline compared to 2017, due primarily to tough year-over-year comparisons for click-based revenue. We expect revenue trends to start to improve later in the year.
As stated in the past, over the long-term, we believe our market opportunity, our differentiated assets and our growth strategy position us well to return to double-digit revenue growth and higher adjusted EBITDA levels. We will continue taking important steps in 2018 as we seek to maximize long-term shareholder value.
* * *
4
TripAdvisor’s first quarter 2018 earnings press release is available on the Investor Relations section of the TripAdvisor website at http://ir.tripadvisor.com/. The earnings release is also included as Exhibit 99.1 to our Current Report on Form 8-K as furnished to the U.S. Securities Exchange Commission, or SEC, on May 8, 2018, which is available on the Investor Relations section of our website at http://ir.tripadvisor.com/ and the SEC’s website at www.sec.gov.
Forward-Looking Statements:
These prepared remarks contain “forward-looking statements” within the meaning of Section 27A of the Securities Act of 1933, as amended, or the Securities Act, and Section 21E of the Securities Exchange Act of 1934, as amended, or the Exchange Act. The following words, when used, are intended to identify forward-looking statements: “anticipate,” “believe,” “could,” “estimate,” “expect,” “intend,” “may,” “might,” “plan,” “project,” “should,” “will,” and similar expressions which do not relate solely to historical matters. We caution investors that any forward-looking statements in these prepared remarks, or which management may make orally or in writing from time to time, are based on management’s beliefs and on assumptions made by, and information currently available to, management. Such statements are subject to risks, uncertainties and assumptions and are not guarantees of future performance, which may be affected by known and unknown risks, trends, uncertainties and factors that are beyond our control. Some of the risks and uncertainties that may cause our actual results, performance or achievements to differ materially from those expressed or implied by forward-looking statements are more fully described in Part II. Item 1A. "Risk Factors" of our Quarterly Report on Form 10-Q. Moreover, we operate in a rapidly changing environment. New risk factors emerge from time to time and it is not possible for management to predict all such risk factors, nor can we assess the impact of all such risk factors on our business or the extent to which any factor, or combination of factors, may cause actual results to differ materially from those contained in any forward-looking statements. We caution you that, while forward-looking statements reflect our good faith beliefs when we make them, they are not guarantees of future performance and are impacted by actual events when they occur after we make such statements. We expressly disclaim any responsibility to update our forward-looking statements, whether as a result of new information, future events or otherwise.
Investors should also refer to our quarterly reports on Form 10-Q for future periods and current reports on Form 8-K as we file them with the SEC and to other materials we may furnish to the public from time to time through current reports on Form 8-K or otherwise, for a discussion of risks and uncertainties that may cause actual results, performance or achievements to differ materially from those expressed or implied by forward-looking statements.
Use of Non-GAAP Financial Measures:
These prepared remarks may include references to non-GAAP measures, such as adjusted EBITDA (including forecasted adjusted EBITDA), free cash flow, and constant currency measurements, such as, non-GAAP revenue before effects of foreign exchange, and adjusted EBITDA before effects of foreign exchange, which are considered non-GAAP financial measures as they are not prepared in conformity with accounting principles generally accepted in the United States (“GAAP”). These non-GAAP financial measures are not prepared under a comprehensive set of accounting rules and, therefore, should only be reviewed alongside results reported under GAAP.
5
We encourage investors to review our earnings press release as it contains important information about our financial results, including tabular reconciliations to the most directly comparable GAAP financial measure, definitions, limitations and other related information about these non-GAAP financial measures. The earning press release in addition to other supplemental financial information is available on the Investor Relations section of our website at http://ir.tripadvisor.com/. The earnings press release is also included as Exhibit 99.1 to our Current Report on Form 8-K as furnished to the SEC on May 8, 2018, which is available on the Investor Relations section of our website at http://ir.tripadvisor.com/ and the SEC’s website at www.sec.gov.
6