Attached files
| file | filename |
|---|---|
| EX-99 - EXHIBIT 99 - SOUTH JERSEY INDUSTRIES INC | southjerseyindustriesq118ear.pdf |
| 8-K - 8-K - SOUTH JERSEY INDUSTRIES INC | a8k-q12018resultslidedeck.htm |

First Quarter 2018 Earnings Conference Call May 8, 2018

Forward-Looking Statements and Use of Non-GAAP Measures Certain statements contained in this presentation may qualify as “forward-looking statements” within the meaning of Section 27A of the Securities Act of 1933 and Section 21E of the Securities Exchange Act of 1934. All statements other than statements of historical fact should be considered forward-looking statements made in good faith and are intended to qualify for the safe harbor from liability established by the Private Securities Litigation Reform Act of 1995. Words such as “anticipate”, “believe”, “expect”, “estimate”, “forecast”, “goal”, “intend”, “objective”, “plan”, “project”, “seek”, “strategy”, “target”, “will” and similar expressions are intended to identify forward-looking statements. Such forward-looking statements are subject to risks and uncertainties that could cause actual results to differ materially from those expressed or implied in the statements. These risks and uncertainties include, but are not limited to, the following: general economic conditions on an international, national, state and local level; weather conditions in our marketing areas; changes in commodity costs; changes in the availability of natural gas; “non-routine” or “extraordinary” disruptions in our distribution system; regulatory, legislative and court decisions; competition; the availability and cost of capital; costs and effects of legal proceedings and environmental liabilities; the failure of customers or suppliers to fulfill their contractual obligations; and changes in business strategies. These cautionary statements should not be construed by you to be exhaustive. While SJI believes these forward- looking statements to be reasonable, there can be no assurance that they will approximate actual experience. Further, SJI undertakes no obligation to update or revise any of its forward-looking statements, whether as a result of new information, future events or otherwise. This presentation includes certain non-GAAP financial measures, which the Company believes are useful in evaluating its performance. You should not consider the presentation of this additional information in isolation or as a substitute for results prepared in accordance with GAAP. The Company has provided reconciliations of comparable GAAP to non-GAAP measures in tables found in the supplemental information portion of this presentation. Investor Contact: Eric Jacobson 609-561-9000 x4363 ejacobson@sjindustries.com 2

Participants on Today’s Call Mike Renna Steve Clark President and CEO EVP/CFO South Jersey Industries South Jersey Industries Greg Nuzzo Dave Robbins SVP/President Energy Solutions SVP/President SJG South Jersey Industries South Jersey Industries Marissa Travaline Ann Anthony VP/Communications VP/Treasurer and Corporate Secretary South Jersey Industries South Jersey Industries 3

Table of Contents • Executive Summary • Business Transformation • Acquisition Update • 1Q’18 Financial Results • Guidance • Appendix 4

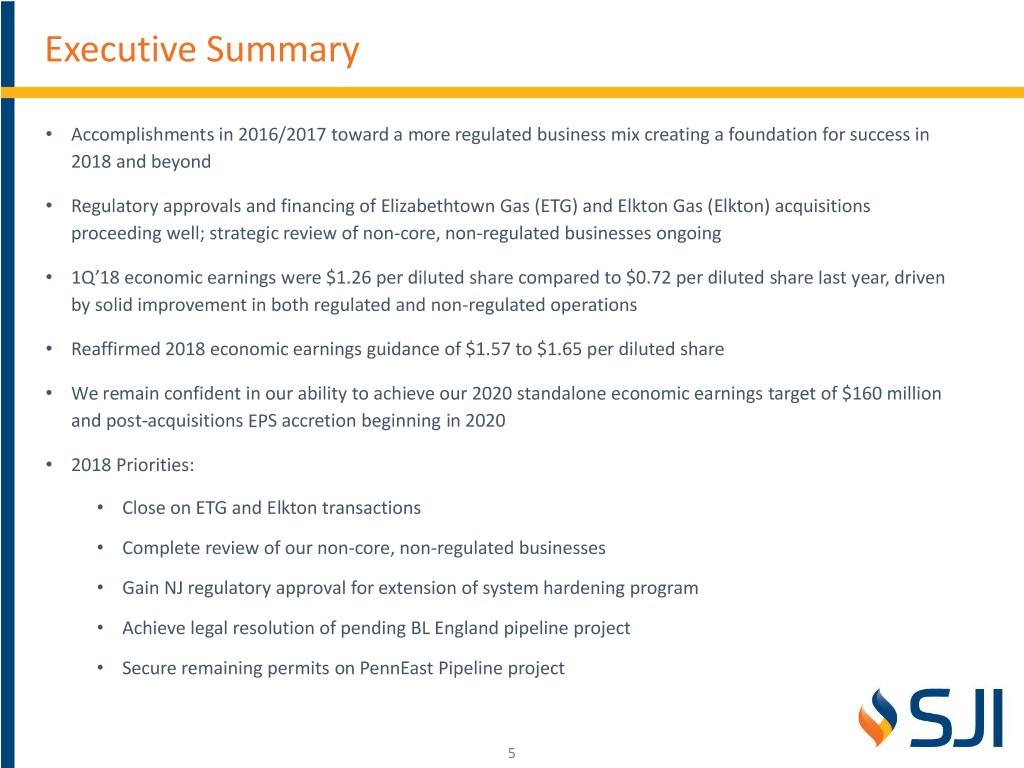
Executive Summary • Accomplishments in 2016/2017 toward a more regulated business mix creating a foundation for success in 2018 and beyond • Regulatory approvals and financing of Elizabethtown Gas (ETG) and Elkton Gas (Elkton) acquisitions proceeding well; strategic review of non-core, non-regulated businesses ongoing • 1Q’18 economic earnings were $1.26 per diluted share compared to $0.72 per diluted share last year, driven by solid improvement in both regulated and non-regulated operations • Reaffirmed 2018 economic earnings guidance of $1.57 to $1.65 per diluted share • We remain confident in our ability to achieve our 2020 standalone economic earnings target of $160 million and post-acquisitions EPS accretion beginning in 2020 • 2018 Priorities: • Close on ETG and Elkton transactions • Complete review of our non-core, non-regulated businesses • Gain NJ regulatory approval for extension of system hardening program • Achieve legal resolution of pending BL England pipeline project • Secure remaining permits on PennEast Pipeline project 5

Business Transformation On Track • In 2015, began planned shift in operating strategy toward a more regulated business mix • Plan driven by desire to increase the quality of earnings by increasing investment in utility and FERC-regulated assets that provide highly-visible cash flows and earnings • Plan also sought to reduce earnings volatility and optimizing the value of our non-core, non- regulated businesses • In 2016, announced cessation of new investment in solar projects, reduced our portfolio of on- site energy production businesses, and significantly strengthened our balance sheet through a successful equity offering • In 2017, announced plan to acquire ETG and Elkton, and received Certificate of Public Convenience and Necessity for PennEast from FERC • In 2018, completed highly-successful equity raise for ETG and Elkton, and announced strategic review of non-regulated businesses 6

NYNY Acquisitions of ETG and Elkton Progressing Well Transaction • In October 2017, announced acquisitions of Elizabethtown Gas (ETG) in New Jersey and Elkton Gas (Elkton) in Maryland in a $1.7B transaction, with an effective purchase price of $1.5B. (1) • Transformative transaction that reinforces regulated business mix and PAPA builds scale, increasing rate base by 45%. South Jersey Gas Elizabethtown Gas • Accretive to 2020 economic earnings per share, building off ETG and Elkton Gas Elkton 2016 standalone net income of $35 million. NJNJ • Visibility for growth well beyond SJI standalone 5-year plan. Recent Developments • In December, filed for regulatory approval in New Jersey (NJBPU). In January, filed for regulatory approval in Maryland (MPSC). Settlement discussions have commenced in both jurisdictions. MDMD • In February, received approval from Federal Communications Commission (FCC) and Hart-Scott-Rodino; FERC approval is pending. DEDE • In April, completed an offering of equity units and common stock as part of our permanent financing plan (detailed on following slide). 980388_1.wor - NY008P5T • Transactions remain on track to close in mid-2018. VAVA (1) Adjusted for approximately $200M tax basis step-up 7

Successful Equity Offering Completed in April Common Equity . $168M in net proceeds . 5.9M shares issued, including overalottment . Issued at $29.50 Per Share Common Stock Forward Sale . $200M in potential proceeds . 6.8M shares at $29.50 Per Share . Forward sale can be adjusted depending on capital needs . $279M in net proceeds . 5.75 million units issued, including overalottment . Issued at $50 Per Unit Equity Units Each unit is comprised of two parts: . Purchase contract to buy SJI shares that pays 3.55% per year; number of shares (8.1 - 9.7 million shares) dependent on price of SJI stock at settlement . 5% interest in re-marketable junior subordinated notes (RSNs) that pay 3.7% annual interest 8

Earnings Performance – Q1’18 Versus Q1’17 First Quarter Ended March 31 Millions Per Diluted Share GAAP Earnings 2018 2017 +/- 2018 2017 +/- South Jersey Gas $66.7 $46.5 $20.3 $0.84 $0.58 $0.25 Midstream 0.3 2.0 (1.7) 0.00 0.03 (0.02) Energy Group 52.5 (8.1) 60.6 0.66 (0.10) 0.76 Energy Services (2.7) (4.3) 1.6 (0.03) (0.05) 0.02 Other (5.5) 1.6 (7.1) (0.07) 0.01 (0.08) $111.3 $37.7 $73.7 $1.40 $0.47 $0.93 First Quarter Ended March 31 Millions Per Diluted Share Economic Earnings 2018 2017 +/- 2018 2017 +/- South Jersey Gas $66.7 $46.5 $20.3 $0.84 $0.58 $0.25 Midstream 0.3 2.0 (1.7) 0.00 0.03 (0.02) Energy Group 35.9 9.8 26.1 0.45 0.12 0.33 Energy Services (2.7) (2.4) (0.3) (0.03) (0.03) (0.00) Other 0.2 1.7 (1.6) 0.00 0.02 (0.02) $100.4 $57.6 $42.8 $1.26 $0.72 $0.54 *SJI uses the non-GAAP measure of Economic Earnings when discussing results. A full explanation and reconciliation of this non- GAAP measure is provided under “Explanation and Reconciliation of Non-GAAP Financial Measures” in the Earnings Release. 9

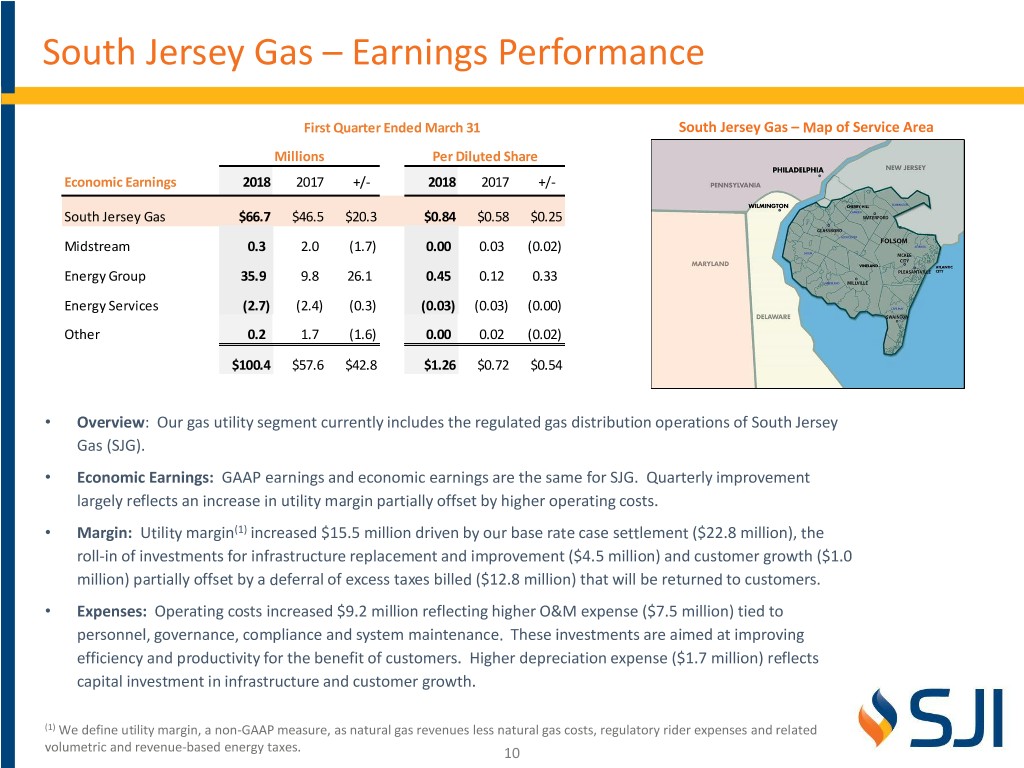
South Jersey Gas – Earnings Performance First Quarter Ended March 31 South Jersey Gas – Map of Service Area Millions Per Diluted Share Economic Earnings 2018 2017 +/- 2018 2017 +/- South Jersey Gas $66.7 $46.5 $20.3 $0.84 $0.58 $0.25 Midstream 0.3 2.0 (1.7) 0.00 0.03 (0.02) Energy Group 35.9 9.8 26.1 0.45 0.12 0.33 Energy Services (2.7) (2.4) (0.3) (0.03) (0.03) (0.00) Other 0.2 1.7 (1.6) 0.00 0.02 (0.02) $100.4 $57.6 $42.8 $1.26 $0.72 $0.54 • Overview: Our gas utility segment currently includes the regulated gas distribution operations of South Jersey Gas (SJG). • Economic Earnings: GAAP earnings and economic earnings are the same for SJG. Quarterly improvement largely reflects an increase in utility margin partially offset by higher operating costs. • Margin: Utility margin(1) increased $15.5 million driven by our base rate case settlement ($22.8 million), the roll-in of investments for infrastructure replacement and improvement ($4.5 million) and customer growth ($1.0 million) partially offset by a deferral of excess taxes billed ($12.8 million) that will be returned to customers. • Expenses: Operating costs increased $9.2 million reflecting higher O&M expense ($7.5 million) tied to personnel, governance, compliance and system maintenance. These investments are aimed at improving efficiency and productivity for the benefit of customers. Higher depreciation expense ($1.7 million) reflects capital investment in infrastructure and customer growth. (1) We define utility margin, a non-GAAP measure, as natural gas revenues less natural gas costs, regulatory rider expenses and related volumetric and revenue-based energy taxes. 10

Midstream – Earnings Performance First Quarter Ended March 31 PennEast Pipeline – Proposed Route Millions Per Diluted Share Economic Earnings 2018 2017 +/- 2018 2017 +/- South Jersey Gas $66.7 $46.5 $20.3 $0.84 $0.58 $0.25 Midstream 0.3 2.0 (1.7) 0.00 0.03 (0.02) Energy Group 35.9 9.8 26.1 0.45 0.12 0.33 Energy Services (2.7) (2.4) (0.3) (0.03) (0.03) (0.00) Other 0.2 1.7 (1.6) 0.00 0.02 (0.02) $100.4 $57.6 $42.8 $1.26 $0.72 $0.54 • Overview: Our Midstream segment includes our 20% equity investment in the PennEast Pipeline project (PennEast). PennEast is a planned $1B+, 1 Bcf, 120-mile interstate pipeline running from the Marcellus region of Pennsylvania into New Jersey. • Economic Earnings: Quarterly comparisons are skewed, reflecting strong results in first quarter 2017 tied to a catch-up of Allowance for Funds Used During Construction (AFUDC) related to prior periods that had not been deemed appropriate to record until original receipt of Federal Energy Regulatory Commission (FERC) approval. • Project Status: In January, PennEast received its Certificate of Public Convenience and Necessity from FERC. With FERC approval, we are moving to the next phase to obtain survey access and submit completed applications for water permits in New Jersey and with the Delaware River Basin Commission (DRBC). Construction is expected to begin upon receipt of approvals from these entities, with in-service expected in late 2019. 11

Energy Group – Earnings Performance First Quarter Ended March 31 Fuel Management Contracts Millions Per Diluted Share Economic Earnings 2018 2017 +/- 2018 2017 +/- South Jersey Gas $66.7 $46.5 $20.3 $0.84 $0.58 $0.25 Midstream 0.3 2.0 (1.7) 0.00 0.03 (0.02) Energy Group 35.9 9.8 26.1 0.45 0.12 0.33 Wholesale Marketing 33.3 7.6 25.6 0.42 0.10 0.32 Fuel Management 2.8 1.4 1.4 0.03 0.02 0.02 Retail Marketing (0.1) 0.6 (0.7) (0.00) 0.01 (0.01) Exploration 0.0 0.1 (0.1) 0.00 0.00 (0.00) Energy Services (2.7) (2.4) (0.3) (0.03) (0.03) (0.00) Other 0.2 1.7 (1.6) 0.00 0.02 (0.02) $100.4 $57.6 $42.8 $1.26 $0.72 $0.54 Note: sub-segment earnings and per share data may not add up due to rounding error. • Overview: Our Energy Group segment includes our non-regulated operations engaged in fuel supply management services and wholesale and retail gas and electric commodity marketing. • Economic Earnings: Quarterly improvement primarily reflects wholesale portfolio optimization during cold weather in January compared with extremely warm weather in Q1’17, and the impact of federal tax reform. Results were also boosted by a larger portfolio of fuel management contracts (six) compared with last year (five). These gains were partially offset by weaker retail marketing results reflecting a continuation of increased competition and tighter margins in this business. • Outlook: We expect an additional three fuel supply management contracts will come on-line in 2018 and two more by the end of 2020, providing low-risk segment growth. 12

Energy Services – Earnings Performance First Quarter Ended March 31 Solar Renewable Energy Credits (SRECs) Millions Per Diluted Share Economic Earnings 2018 2017 +/- 2018 2017 +/- South Jersey Gas $66.7 $46.5 $20.3 $0.84 $0.58 $0.25 Midstream 0.3 2.0 (1.7) 0.00 0.03 (0.02) Energy Group 35.9 9.8 26.1 0.45 0.12 0.33 Energy Services (2.7) (2.4) (0.3) (0.03) (0.03) (0.00) CHP 0.1 0.3 (0.2) 0.00 0.00 (0.00) Solar (2.4) (2.1) (0.3) (0.03) (0.03) (0.00) Landfills (0.9) (0.7) (0.2) (0.01) (0.01) (0.00) Other 0.5 0.1 0.4 0.01 0.00 0.01 Other 0.2 1.7 (1.6) 0.00 0.02 (0.02) $100.4 $57.6 $42.8 $1.26 $0.72 $0.54 Note: sub-segment earnings and per share data may not add up due to rounding error. • Overview: Our Energy Services segment largely consists of our energy production portfolio including solar, combined heat and power (CHP) and landfill gas-to-electric assets. • Economic Earnings: Quarterly decline reflects modest improvement from our account services businesses and favorable SREC prices that was more than offset by a decline in results from CHP, solar and landfill activities driven by increased costs, higher interest expense and a one percent decline in solar production. • No ITCs: Consistent with our strategic plan, there were no investment tax credits (ITCs) related to renewable project development in first quarter 2018 results or the year ago period. 13

Guidance Reaffirmed 2018 EXPECTED CONTRIBUTION TO SEGMENT 2018 ECONOMIC EARNINGS • Reaffirming 2018 economic earnings per share guidance of $1.57 to $1.65 REGULATED Gas Utility 63% - 67% • Guidance excludes impact from pending acquisitions of Midstream 2% - 5% Elizabethtown Gas (ETG) and Elkton Gas (Elkton) NON-REGULATED • Guidance includes impacts of federal tax reform and positive Energy Group 28% - 33% impact of cold weather in January Energy Services (1)% - 3% Longer-Term Tax Reform Impacts • Reaffirming SJI standalone economic earnings target of $160 million in 2020 • In February, raised guidance from $150 million to $160 million tied to impact of federal tax reform • Reaffirming guidance for EPS accretion from our acquisitions of ETG and Elkton beginning in 2020 • We expect to update longer-term guidance upon receipt of final regulatory approvals and closing of the acquisitions 14

Appendix 15

Organizational Structure South Jersey Industries Regulated Non-Utility 2017 Economic Earnings = $77.2 million (1) 2017 Economic Earnings = $18.5 million (1) South Jersey Energy South Jersey Gas SJI Midstream Solutions Regulated Natural FERC-Regulated SJ Energy SJ Energy Gas Distribution Gas Pipelines/Projects Services Group Company • Energy production • Fuel supply portfolio (solar, CHP, management services landfill gas to electric) • Wholesale and retail natural gas and electric commodity marketing (1) 2017 reported results, excluding corporate segment results. SJI uses the non-GAAP measure of Economic Earnings. EE eliminates all unrealized gains and losses on commodity and on the ineffective portion of interest rate derivative transactions; adjusts for realized gains and losses attributed to hedges on inventory transactions and for the impact of transactions or contractual arrangements where the true economic impact will be realized in a future period. A full explanation and reconciliation of this non-GAAP measure is provided in our Form 10K on file with the SEC. 16

GAAP Reconciliation to Economic Earnings – 1Q’18 17

South Jersey Gas – Q1’18 Earnings Performance Detail In millions¹ Q1 Performance Notes 2017 Net Income $46.5 Customer Growth $1.0 1.6% YOY customer growth Accelerated Infrastructure Investments $2.3 AIRP and SHARP investments Rate Case investments roll-in to base rates Rate Case Investments $13.0 November 1, 2017 Resource investments supporting future O&M Expenses² ($1.2) growth Depreciation³ ($0.4) Additional assets placed in service Increased levels of debt and higher Interest Charges – Net of Capitalized³ ($0.5) interest rates Reduction in Tax Expense $5.6 Other $0.4 2018 Net Income $66.7 ¹ Slide depicts changes to period over period net income, it is not intended to be a substitute for financial statements ² Excludes expenses where there is a corresponding credit in operating revenues (i.e., no impact on our financial results) ³ Expenses associated with accelerated infrastructure investments are reflected within that line item 18

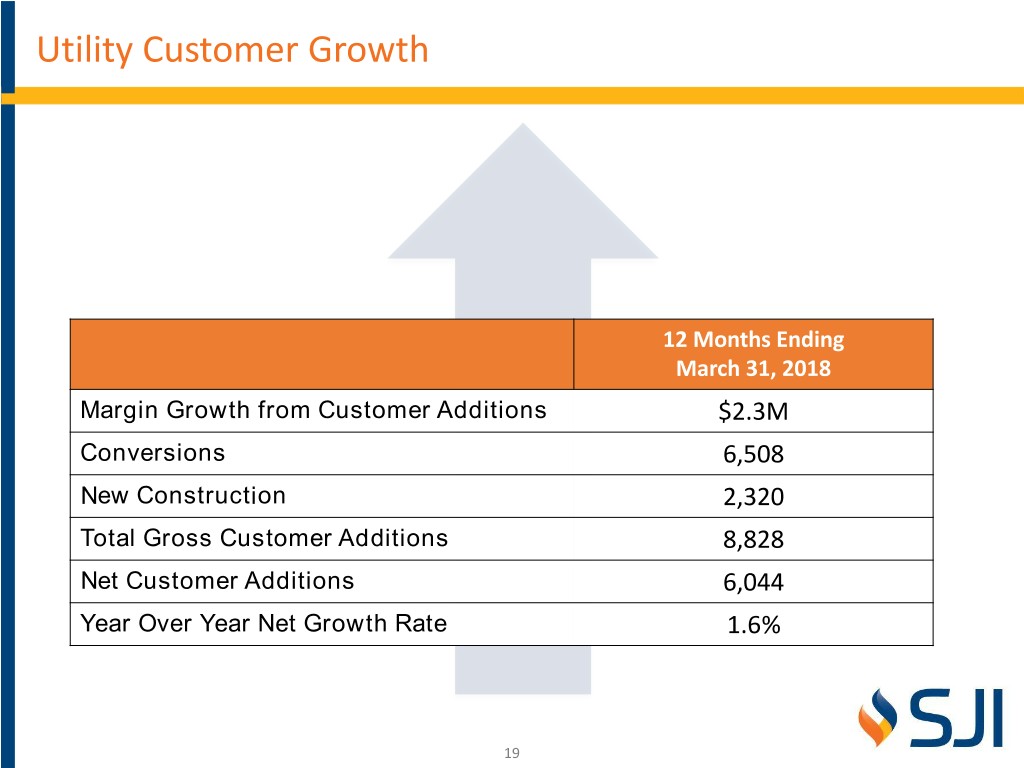
Utility Customer Growth 12 Months Ending March 31, 2018 Margin Growth from Customer Additions $2.3M Conversions 6,508 New Construction 2,320 Total Gross Customer Additions 8,828 Net Customer Additions 6,044 Year Over Year Net Growth Rate 1.6% 19

SJG Customer Trends and Drivers Strong customer growth Competitive economics of gas vs. other fuels % net (1) +1.7% +1.4% +1.3% +1.7% +1.2% +1.6% growth $2,189 8,751 8,393 8,636 $1,506 7,484 7,431 7,163 6,060 $1,144 $830 2011 2012 2013 2014 2015 2016 2017 Natural Gas Electricity Heating Oil Propane Gross Customer Additions Annual Commodity Cost for a Typical Residential Customer(2) Conversions: Commercial Conversions: Residential New construction: Commercial New construction: Residential (1) Reflects year-over-year net growth (2) Based on EIA expected winter 17/18 expenditures 20
