Attached files
| file | filename |
|---|---|
| EX-99.1 - EXHIBIT 99.1 EARNINGS RELEASE - Novelis Inc. | novelisq4fy18results.htm |
| 8-K - 8-K EARNINGS - Novelis Inc. | nvl-form8xkq4fy18.htm |

Exhibit 99.2 NOVELIS Q4 & FY FISCAL 2018 EARNINGS CONFERENCE CALL May 8, 2018 Steve Fisher President and Chief Executive Officer Devinder Ahuja Senior Vice President and Chief Financial Officer © 2018 Novelis

SAFE HARBOR STATEMENT Forward-looking statements Statements made in this presentation which describe Novelis' intentions, expectations, beliefs or predictions may be forward- looking statements within the meaning of securities laws. Forward-looking statements include statements preceded by, followed by, or including the words "believes," "expects," "anticipates," "plans," "estimates," "projects," "forecasts," or similar expressions. Examples of forward-looking statements in this presentation including statements that core end market growth remains strong. Novelis cautions that, by their nature, forward-looking statements involve risk and uncertainty and that Novelis' actual results could differ materially from those expressed or implied in such statements. We do not intend, and we disclaim, any obligation to update any forward-looking statements, whether as a result of new information, future events or otherwise. Factors that could cause actual results or outcomes to differ from the results expressed or implied by forward-looking statements include, among other things: changes in the prices and availability of aluminum (or premiums associated with such prices) or other materials and raw materials we use; the capacity and effectiveness of our hedging activities; relationships with, and financial and operating conditions of, our customers, suppliers and other stakeholders; fluctuations in the supply of, and prices for, energy in the areas in which we maintain production facilities; our ability to access financing for future capital requirements; changes in the relative values of various currencies and the effectiveness of our currency hedging activities; factors affecting our operations, such as litigation, environmental remediation and clean-up costs, labor relations and negotiations, breakdown of equipment and other events; the impact of restructuring efforts in the future; economic, regulatory and political factors within the countries in which we operate or sell our products, including changes in duties or tariffs; competition from other aluminum rolled products producers as well as from substitute materials such as steel, glass, plastic and composite materials; changes in general economic conditions including deterioration in the global economy, particularly sectors in which our customers operate; changes in government regulations, particularly those affecting taxes, environmental, health or safety compliance; changes in interest rates that have the effect of increasing the amounts we pay under our credit facilities and other financing agreements; the effect of taxes and changes in tax rates; and our ability to generate cash. The above list of factors is not exhaustive. Other important risk factors are included under the caption "Risk Factors" in our upcoming Annual Report on Form 10-K for the fiscal year ended March 31, 2018. © 2018 Novelis 2
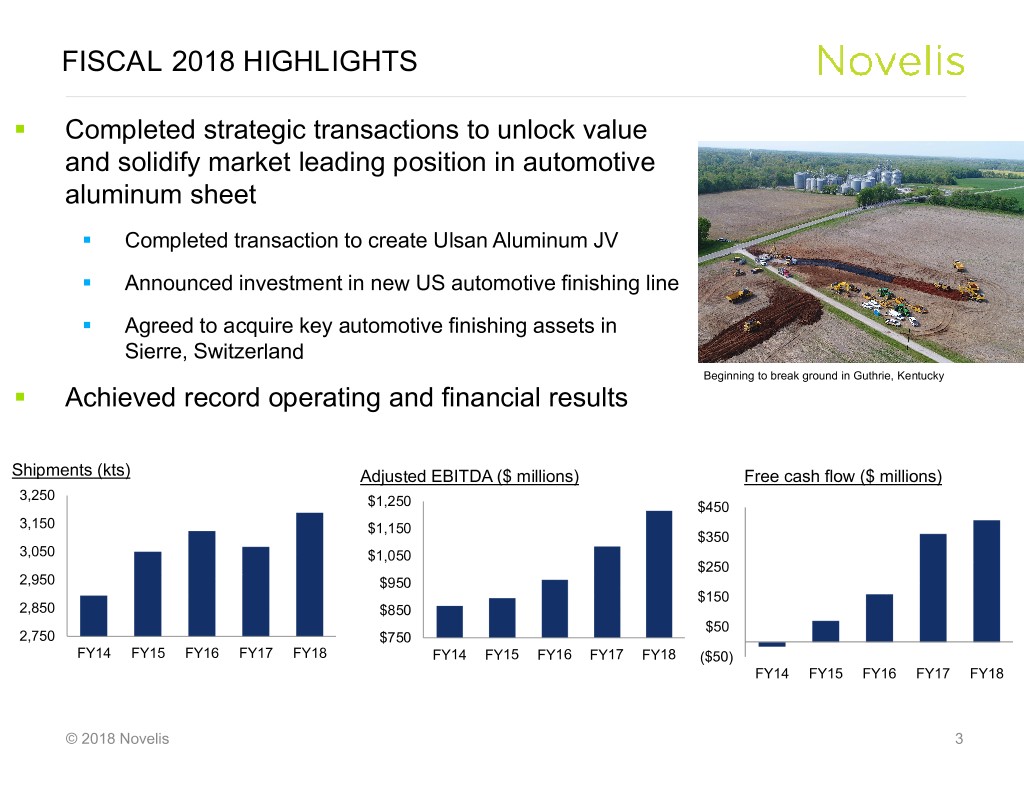
FISCAL 2018 HIGHLIGHTS ° Completed strategic transactions to unlock value and solidify market leading position in automotive aluminum sheet ° Completed transaction to create Ulsan Aluminum JV ° Announced investment in new US automotive finishing line ° Agreed to acquire key automotive finishing assets in Sierre, Switzerland Beginning to break ground in Guthrie, Kentucky ° Achieved record operating and financial results Shipments (kts) Adjusted EBITDA ($ millions) Free cash flow ($ millions) 3,250 $1,250 $450 3,150 $1,150 $350 3,050 $1,050 $250 2,950 $950 $150 2,850 $850 $50 2,750 $750 FY14 FY15 FY16 FY17 FY18 FY14 FY15 FY16 FY17 FY18 ($50) FY14 FY15 FY16 FY17 FY18 © 2018 Novelis 3

A RESULT OF OUR RECENT STRATEGIC FOCUS ° Operational excellence ° Market-leader in automotive ° Safety rates at industry- aluminum sheet leading low levels ° Strategically investing in automotive ° Improved end-to-end assets to grow with our customers recovery leading to increased and advance the continued asset utilization and uptime penetration of aluminum sheet in the automotive market ° Reduced customer reject rate by half in past two years ° Increased overall customer satisfaction scores by 33% since FY16 “Aluminum remains the fastest growing automotive material over competing materials and is entering its most unprecedented growth phase since we’ve been tracking the shifting mix of automotive © 2018 Novelis materials.” - Ducker Worldwide 4
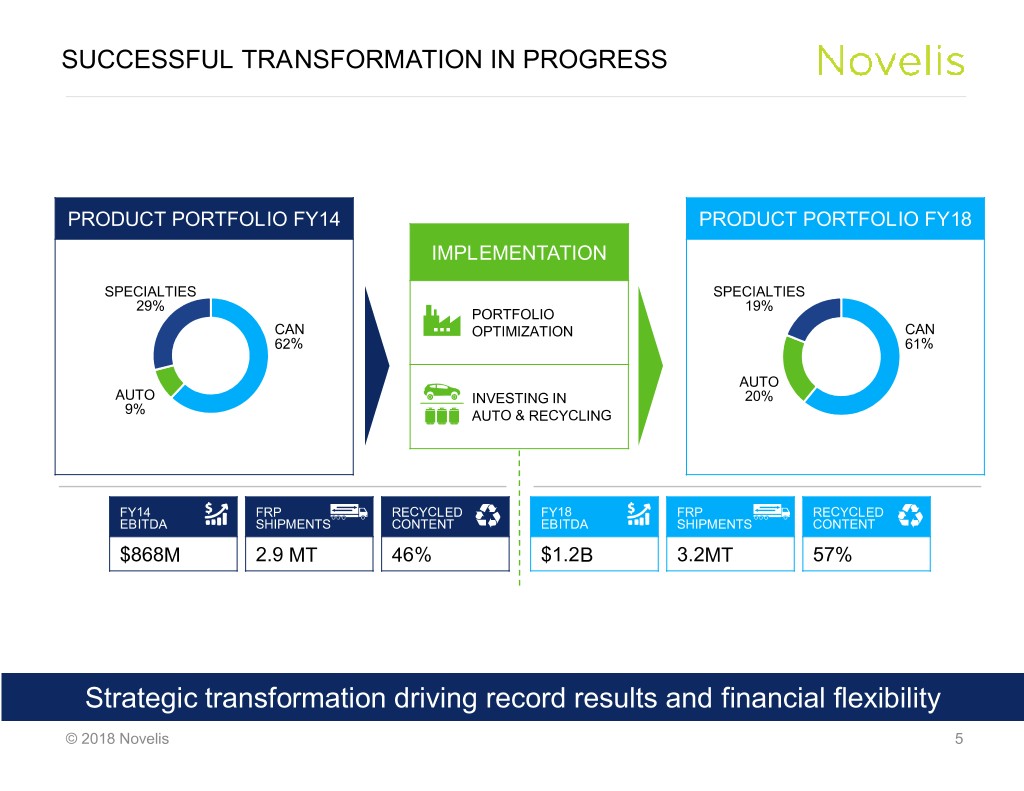
SUCCESSFUL TRANSFORMATION IN PROGRESS PRODUCT PORTFOLIO FY14 PRODUCT PORTFOLIO FY18 IMPLEMENTATION SPECIALTIES SPECIALTIES 29% 19% PORTFOLIO CAN OPTIMIZATION CAN 62% 61% AUTO AUTO INVESTING IN 20% 9% AUTO & RECYCLING FY14 FRP RECYCLED FY18 FRP RECYCLED EBITDA SHIPMENTS CONTENT EBITDA SHIPMENTS CONTENT $868M 2.9 MT 46% $1.2B 3.2MT 57% Strategic transformation driving record results and financial flexibility © 2018 Novelis 5

FINANCIAL HIGHLIGHTS © 2018 Novelis

Q4 FISCAL 2018 FINANCIAL HIGHLIGHTS Q4FY18 vs Q4FY17 ° Net income attributable to our common Quarterly Adjusted EBITDA ($M) shareholder $106 million 325 319 ° Net income excluding tax-effected special 300 292 items* increased 38% to $101 million 275 ° Adjusted EBITDA up 9% from $292 million to record $319 million 250 ° Third consecutive quarterly record result ° Total FRP Shipments up 2% to 805 kilotonnes Adjusted EBITDA/ton ($) 396 ° Adjusted EBITDA per ton increased to 400 record $396 per ton 375 370 ° Net sales up 17% to $3.1 billion 350 325 300 © 2018 Novelis 7 *Tax-effected special items may include restructuring & impairment, metal price lag, gain/loss on assets held for sale, loss on extinguishment of debt, loss/gain on sale of business

Q4 ADJUSTED EBITDA BRIDGE $ Millions ° Operational efficiencies and ° Strong demand & production favorable metal costs led to increase in beverage can and automotive volumes 4 26 319 22 (8) 292 (17) ° Lower beverage can pricing partially offset by favorable product mix Q4FY17 Volume Price/Mix Operating Cost FX SG&A and Other Q4FY18 Third consecutive quarter of record quarterly Adjusted EBITDA © 2018 Novelis 8
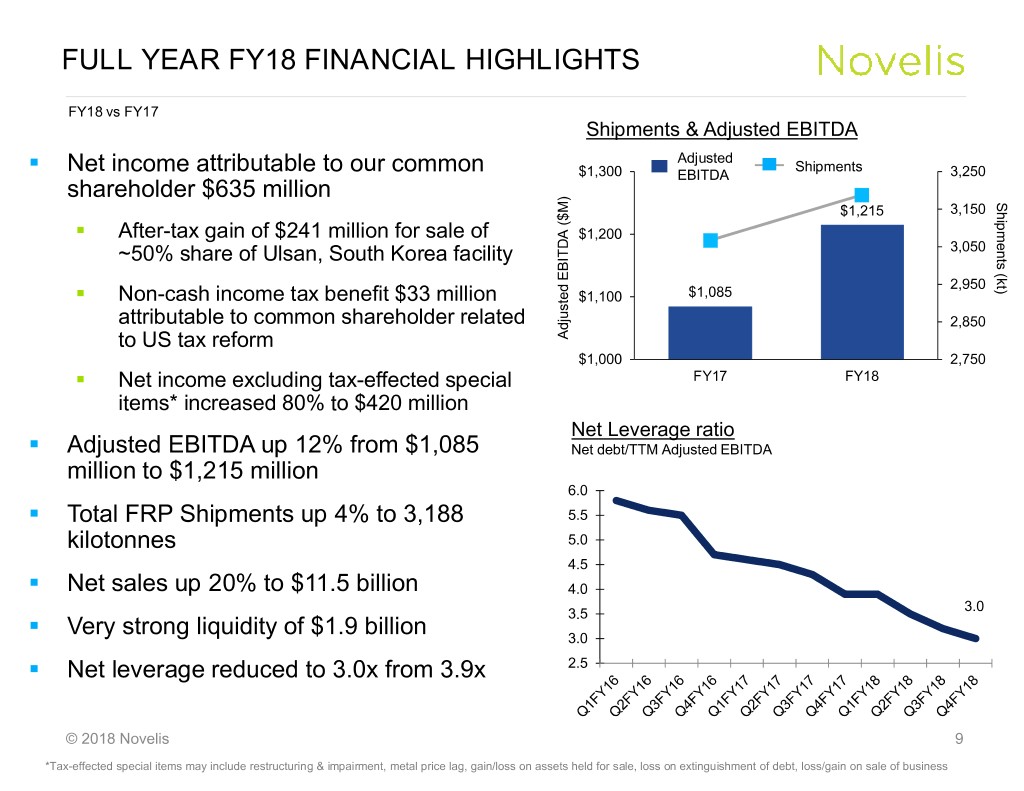
FULL YEAR FY18 FINANCIAL HIGHLIGHTS FY18 vs FY17 Shipments & Adjusted EBITDA Adjusted Shipments ° Net income attributable to our common $1,300 EBITDA 3,250 shareholder $635 million Shipments (kt) $1,215 3,150 ° After-tax gain of $241 million for sale of $1,200 ~50% share of Ulsan, South Korea facility 3,050 2,950 ° Non-cash income tax benefit $33 million $1,100 $1,085 attributable to common shareholder related 2,850 to US tax reform ($M) EBITDA Adjusted $1,000 2,750 ° Net income excluding tax-effected special FY17 FY18 items* increased 80% to $420 million Net Leverage ratio ° Adjusted EBITDA up 12% from $1,085 Net debt/TTM Adjusted EBITDA million to $1,215 million 6.0 ° Total FRP Shipments up 4% to 3,188 5.5 kilotonnes 5.0 4.5 ° Net sales up 20% to $11.5 billion 4.0 3.0 3.5 ° Very strong liquidity of $1.9 billion 3.0 ° Net leverage reduced to 3.0x from 3.9x 2.5 © 2018 Novelis 9 *Tax-effected special items may include restructuring & impairment, metal price lag, gain/loss on assets held for sale, loss on extinguishment of debt, loss/gain on sale of business

FULL YEAR ADJUSTED EBITDA BRIDGE $ Millions Ongoing efficiencies and productivity, including favorable 4% increase in total metal shipments 15 65 139 1,215 (50) (39) Higher employment 1,085 cost, professional fees and factoring FY17 Volume Price/Mix Operating Cost FX SG&A and Other FY18 Increased shipments, portfolio shift and operational efficiencies © 2018 Novelis 10
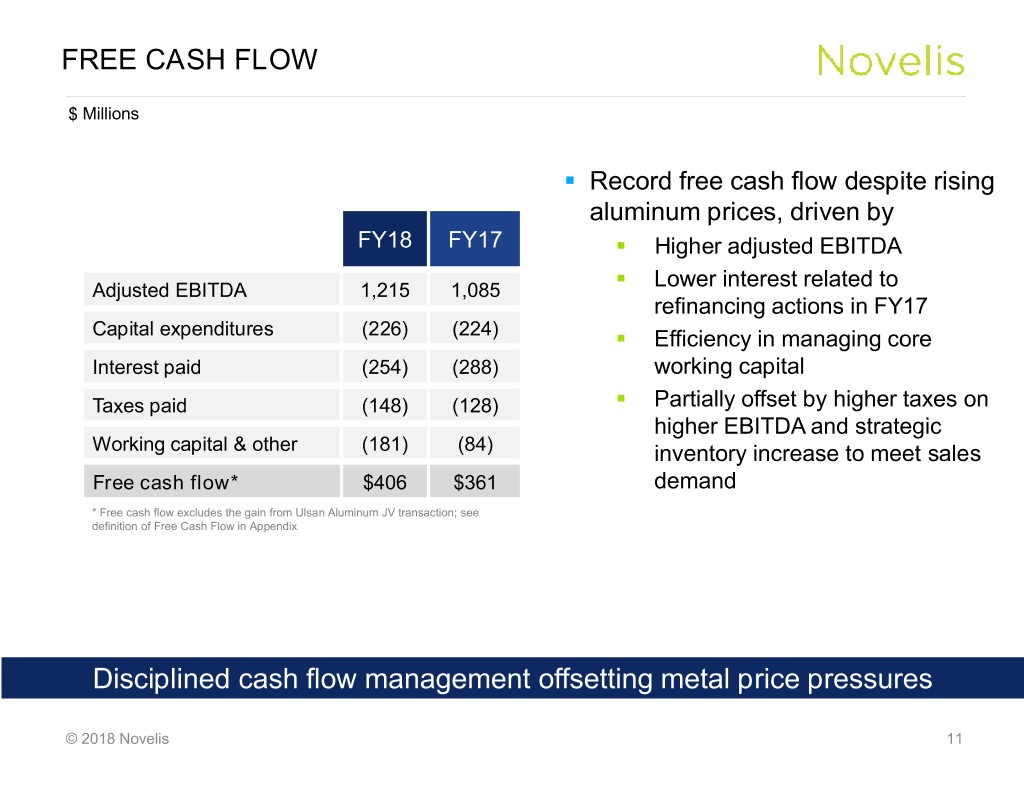
FREE CASH FLOW $ Millions ° Record free cash flow despite rising aluminum prices, driven by FY18 FY17 ° Higher adjusted EBITDA Lower interest related to Adjusted EBITDA 1,215 1,085 ° refinancing actions in FY17 Capital expenditures (226) (224) ° Efficiency in managing core Interest paid (254) (288) working capital Taxes paid (148) (128) ° Partially offset by higher taxes on higher EBITDA and strategic Working capital & other (181) (84) inventory increase to meet sales Free cash flow* $406 $361 demand * Free cash flow excludes the gain from Ulsan Aluminum JV transaction; see definition of Free Cash Flow in Appendix Disciplined cash flow management offsetting metal price pressures © 2018 Novelis 11

STRATEGY & OUTLOOK © 2018 Novelis

SHARPENING OUR FOCUS Lead the aluminum industry as the partner of choice for innovative solutions Strengthen our Invest in Growth Defend the Core Product Portfolio Opportunities ° Protect market leading ° Broaden customer base ° Bold yet balanced position in can & ° Grow in higher margin approach automotive specialties markets ° Pursue opportunities for ° Continue driving ° Explore new verticals growth customer centricity and markets ° Maintain low-cost position through recycling & productivity © 2018 Novelis 13
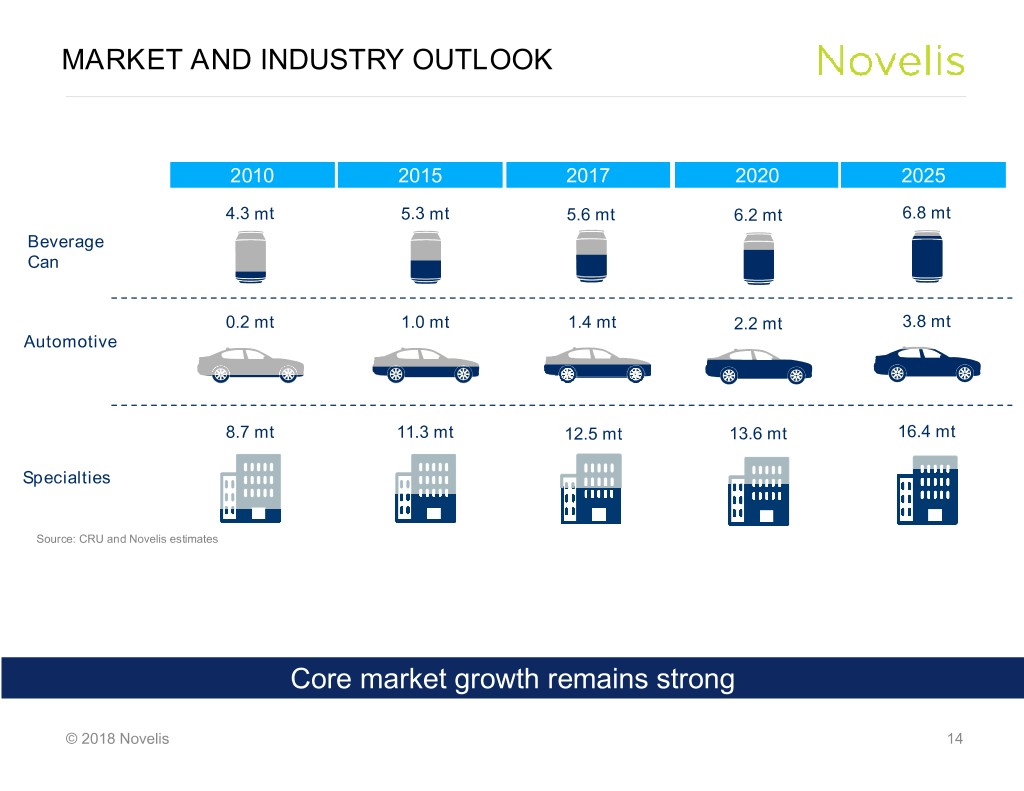
MARKET AND INDUSTRY OUTLOOK 2010 2015 2017 2020 2025 4.3 mt 5.3 mt 5.6 mt 6.2 mt 6.8 mt Beverage Can 0.2 mt 1.0 mt 1.4 mt 2.2 mt 3.8 mt Automotive 8.7 mt 11.3 mt 12.5 mt 13.6 mt 16.4 mt Specialties Source: CRU and Novelis estimates Core market growth remains strong © 2018 Novelis 14

SUMMARY AND FY19 OUTLOOK ° Transformational strategy and strong operating performance driving record financial results ° Demand for aluminum flat rolled products remains high ° Strategically investing in automotive assets to grow with our customers and advance the continued penetration of aluminum sheet in the automotive market ° Increase FY19 capital expenditures to ~$450 million ° Continue to evaluate further opportunities to capture growth © 2018 Novelis 15

THANK YOU AND QUESTIONS THANK YOU QUESTIONS? © 2018 Novelis
APPENDIX © 2018 Novelis

NET INCOME RECONCILIATION TO ADJUSTED EBITDA (in $ m) Q1 Q2 Q3 Q4 FY17 Q1 Q2 Q3 Q4 FY18 Net income (loss) attributable to our common shareholder 24 (89) 63 47 45 101 307 121 106 635 - Noncontrolling interests - - 1 - 1 - - (16) 3 (13) - Interest, net 80 79 65 59 283 62 62 62 60 246 - Income tax provision 36 27 47 41 151 43 116 20 54 233 - Depreciation and amortization 89 90 88 93 360 90 91 86 87 354 EBITDA 229 107 264 240 840 296 576 273 310 1,455 - Unrealized loss (gain) on derivatives 7 (4) (21) 13 (5) (16) 18 (15) (7) (20) - Realized (loss) gain on derivative instruments not included in segment (1) - (1) (3) (5) (1) - 1 - - income - Proportional consolidation 8 8 4 8 28 8 8 17 18 51 - Loss on extinguishment of debt - 112 - 22 134 - - - - - - Restructuring and impairment, net 2 1 1 6 10 1 7 25 1 34 - Loss (gain) on sale of business - 27 - - 27 - (318) - - (318) - Loss (gain) on sale of fixed assets 4 2 (2) 2 6 1 1 2 3 7 - Gain on assets held for sale, net (1) (1) - - (2) - - - - - - Metal price lag (A) 13 14 4 - 31 1 5 (1) (9) (4) - Others costs (income), net 7 4 6 4 21 (1) 5 3 3 10 Adjusted EBITDA $268 $270 $255 $292 $1,085 $289 $302 $305 $319 $1,215 (A) Effective in the first quarter of fiscal 2018, management removed the impact of metal price lag from Adjusted EBITDA (segment income) in order to enhance the visibility of the underlying operating performance of the Company. On certain sales contracts, we experience timing differences on the pass through of changing aluminum prices from our suppliers to our customers. Additional timing differences occur in the flow of metal costs through moving average inventory cost values and cost of goods sold. This timing difference is referred to as metal price lag. The impact of metal price lag is now reported as a separate line item in this reconciliation. Adjusted EBITDA for all prior periods presented has been updated to reflect this change. © 2018 Novelis 18
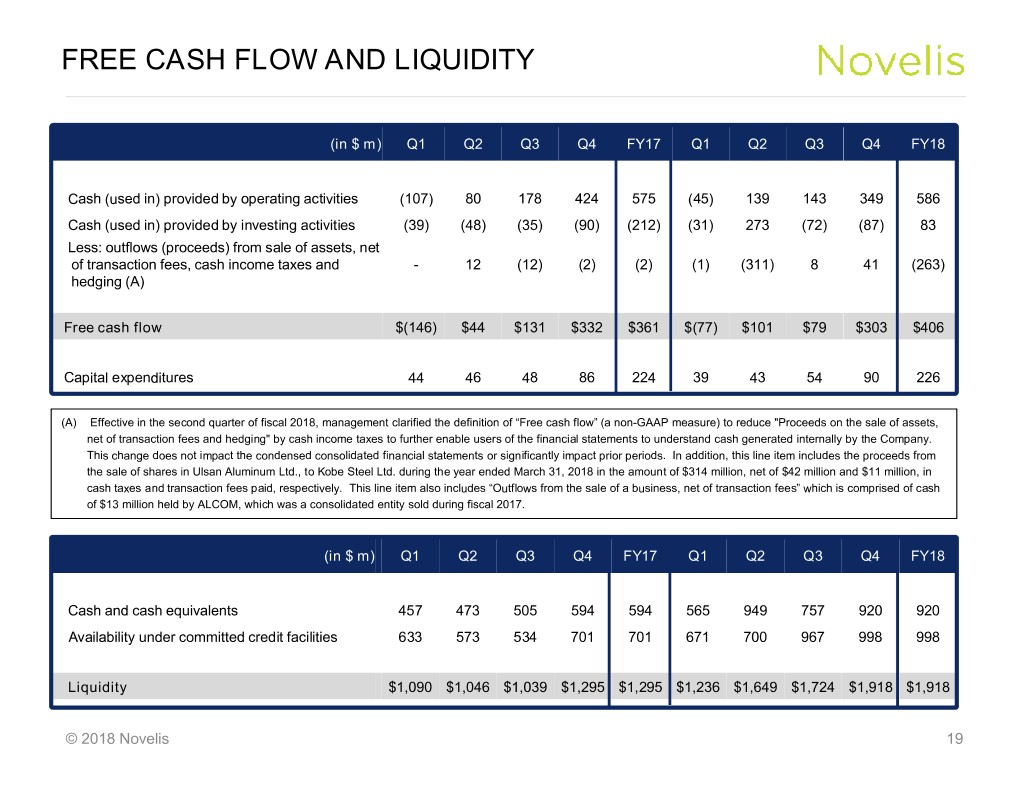
FREE CASH FLOW AND LIQUIDITY (in $ m ) Q1 Q2 Q3 Q4 FY17 Q1 Q2 Q3 Q4 FY18 Cash (used in) provided by operating activities (107) 80 178 424 575 (45) 139 143 349 586 Cash (used in) provided by investing activities (39) (48) (35) (90) (212) (31) 273 (72) (87) 83 Less: outflows (proceeds) from sale of assets, net of transaction fees, cash income taxes and - 12 (12) (2) (2) (1) (311) 8 41 (263) hedging (A) Free cash flow $(146) $44 $131 $332 $361 $(77) $101 $79 $303 $406 Capital expenditures 44 46 48 86 224 39 43 54 90 226 (A) Effective in the second quarter of fiscal 2018, management clarified the definition of “Free cash flow” (a non-GAAP measure) to reduce "Proceeds on the sale of assets, net of transaction fees and hedging" by cash income taxes to further enable users of the financial statements to understand cash generated internally by the Company. This change does not impact the condensed consolidated financial statements or significantly impact prior periods. In addition, this line item includes the proceeds from the sale of shares in Ulsan Aluminum Ltd., to Kobe Steel Ltd. during the year ended March 31, 2018 in the amount of $314 million, net of $42 million and $11 million, in cash taxes and transaction fees paid, respectively. This line item also includes “Outflows from the sale of a business, net of transaction fees” which is comprised of cash of $13 million held by ALCOM, which was a consolidated entity sold during fiscal 2017. (in $ m ) Q1 Q2 Q3 Q4 FY17 Q1 Q2 Q3 Q4 FY18 Cash and cash equivalents 457 473 505 594 594 565 949 757 920 920 Availability under committed credit facilities 633 573 534 701 701 671 700 967 998 998 Liquidity $1,090 $1,046 $1,039 $1,295 $1,295 $1,236 $1,649 $1,724 $1,918 $1,918 © 2018 Novelis 19
