Attached files
| file | filename |
|---|---|
| EX-99.1 - EX-99.1 - Natera, Inc. | a18-13081_1ex99d1.htm |
| 8-K - 8-K - Natera, Inc. | a18-13081_18k.htm |

Safe Harbor This presentation contains forward-looking statements. All statements other than statements of historical facts contained in this presentation, including statements regarding the market opportunity, products, commercial partners, user experience, clinical trials, financial performance, strategies, anticipated future performance and general business conditions of Natera, Inc. (“Natera”, the “Company”, “we” or “us”), are forward-looking statements. These forward-looking statements are subject to known and unknown risks and uncertainties that may cause actual results to differ materially, including: we face numerous uncertainties and challenges in achieving the financial guidance provided; we may be unable to further increase the use and adoption of Panorama, through our direct sales efforts or through our laboratory partners, or to develop and successfully commercialize new products, including our cancer products; we have incurred losses since our inception and we anticipate that we will continue to incur losses for the foreseeable future; our quarterly results may fluctuate significantly; our estimates of market opportunity and forecasts of market growth may prove to be inaccurate, and even if the market in which we compete achieves the forecasted growth, our business could fail to grow at similar rates; we may be unable to compete successfully with either existing or future prenatal testing or oncology diagnostic products or other test methods; we may not be successful in commercializing our cloud-based distribution model; our products may not perform as expected; the results of our clinical studies may not support the use of our tests, particularly in the average-risk pregnancy population or for microdeletions screening, or may not be able to be replicated in later studies required for regulatory approvals or clearances; if our sole CLIA-certified laboratory facility becomes inoperable, we will be unable to perform our tests and our business will be harmed; we rely on a limited number of suppliers or, in some cases, single suppliers, for some of our laboratory instruments and materials and may not be able to find replacements or immediately transition to alternative suppliers; if we are unable to successfully scale our operations, our business could suffer; our cord blood and tissue banking activities are subject to regulations that may impose significant costs and restrictions on us; the marketing, sale, and use of Panorama and our other products could result in substantial damages arising from product liability or professional liability claims that exceed our resources; we may be unable to expand third-party payer coverage and reimbursement for Panorama and our other tests, and we may be required to refund reimbursements already received; third-party payers may withdraw coverage or provide lower levels of reimbursement due to changing policies, billing complexities or other factors, such as the increased focus by third-party payers on requiring that prior authorization be obtained prior to conducting a test; if the FDA were to begin actively regulating our tests, we could incur substantial costs and delays associated with trying to obtain premarket clearance or approval and incur costs associated with complying with post-market controls; we could be subject to third party claims of intellectual property infringement, which could result in litigation or other proceedings and could limit our ability to commercialize our products or services; and any failure to obtain, maintain, and enforce our intellectual property rights could impair our ability to protect our proprietary technology and our brand. We discuss these and other risks and uncertainties in greater detail in the sections entitled “Risk Factors” and "Management's Discussion and Analysis of Financial Condition and Results of Operations" in our Form 10-Q for the quarter ended March 31, 2018. Further information on potential risks that could affect actual results will be included in other filings we make with the SEC from time to time. Given these uncertainties, you should not place undue reliance on the forward-looking statements. Moreover, we operate in a very competitive and rapidly changing environment. New risks emerge from time to time. It is not possible for our management to predict all risks, nor can we assess the impact of all factors on its business or the extent to which any factor, or combination of factors, may cause actual results to differ materially from those contained in any forward-looking statement. In light of these risks, uncertainties and assumptions, the forward-looking events and circumstances discussed in this presentation may not occur and actual results could differ materially and adversely from those anticipated or implied. Except as required by law, neither we nor any other person assumes responsibility for the accuracy and completeness of the forward-looking statements. We undertake no obligation to update publicly any forward-looking statements for any reason after the date of this presentation to conform these statements to actual results or to changes in our expectations. We file reports, proxy statements, and other information with the SEC. Such reports, proxy statements, and other information concerning us can be read and copied at the SEC’s Public Reference Room at 100 F Street, N.E., Room 1580, Washington, D.C. 20549 or on the Internet at http://www.sec.gov. Please call the SEC at 1-800-SEC-0330 for further information on the Public Reference Room. Our common stock is listed on the NASDAQ Global Select Market, and these reports, proxy statements and other information are also available for inspection at the offices of the NASDAQ Stock Market, Inc. located at 1735 K Street, NW, Washington, D.C. 20006. We will provide without charge upon written or oral request a copy of any or all of the documents that are incorporated by reference into this prospectus, other than exhibits which are specifically incorporated by reference into such documents. Requests should be directed to our Investor Relations department at Natera, Inc., 201 Industrial Road, Suite 410, San Carlos, California 94070. Our telephone number is (650) 249-9090. 1
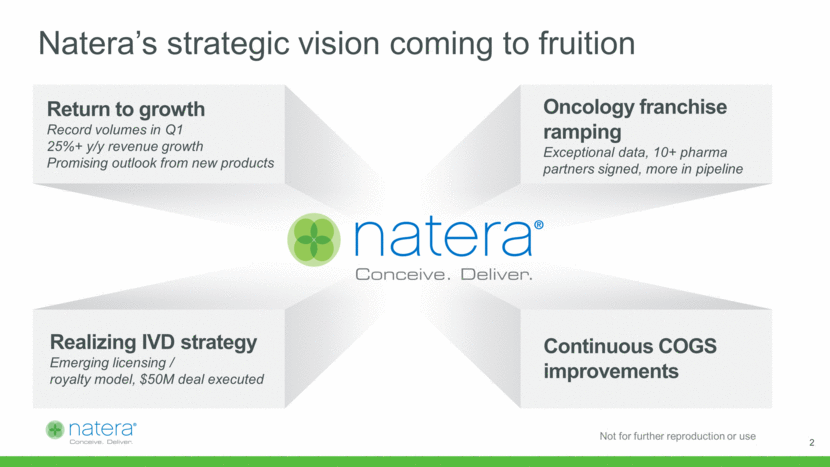
Natera’s strategic vision coming to fruition Return to growth Record volumes in Q1 25%+ y/y revenue growth Promising outlook from new products Oncology franchise ramping Exceptional data, 10+ pharma partners signed, more in pipeline Realizing IVD strategy Emerging licensing / royalty model, $50M deal executed Continuous COGS Improvements 2
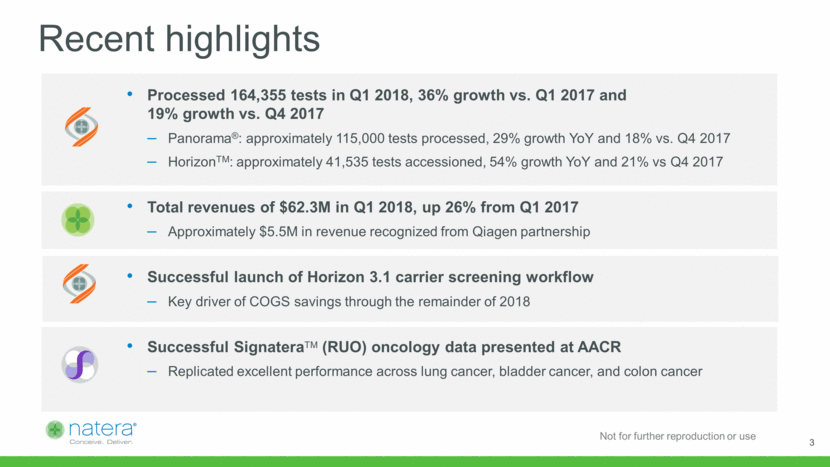
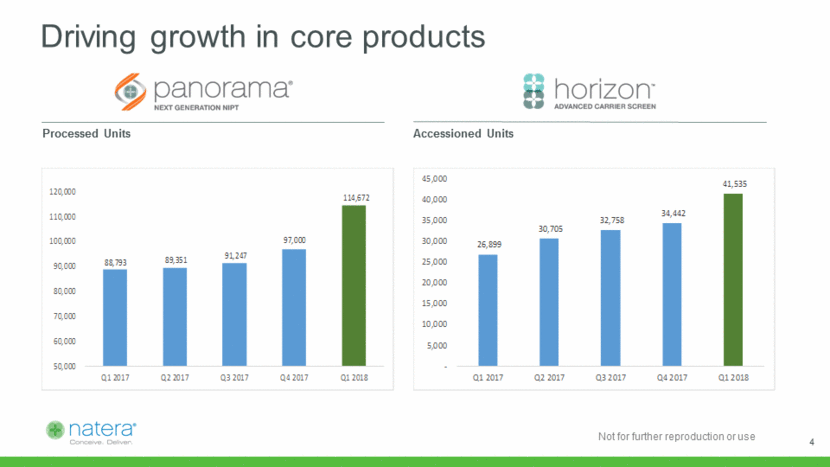
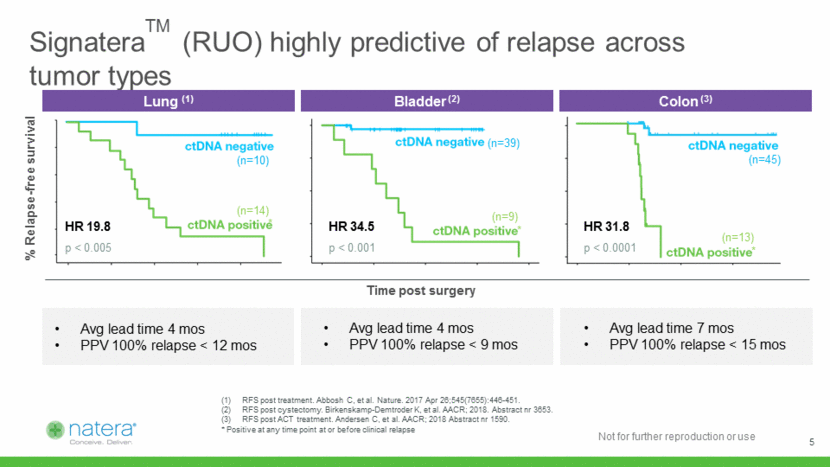
Recent highlights Processed 164,355 tests in Q1 2018, 36% growth vs. Q1 2017 and 19% growth vs. Q4 2017 Panorama®: approximately 115,000 tests processed, 29% growth YoY and 18% vs. Q4 2017 HorizonTM: approximately 41,535 tests accessioned, 54% growth YoY and 21% vs Q4 2017 Total revenues of $62.3M in Q1 2018, up 26% from Q1 2017 Approximately $5.5M in revenue recognized from Qiagen partnership Successful Launch of Horizon 3.1 Carrier Screening workflow Key driver of COGS savings through the remainder of 2018 Successful SignateraTM (RUO) oncology data presented at AACR Replicated excellent performance across lung cancer, bladder cancer, and colon cancer 3
Driving growth in core products Processed Units Accessioned Units 4 88,793 89,351 91,247 97,000 114,672 50,000 60,000 70,000 80,000 90,000 100,000 110,000 120,000 Q1 2017 Q2 2017 Q3 2017 Q4 2017 Q1 2018 26,899 30,705 32,758 34,442 41,535 - 5,000 10,000 15,000 20,000 25,000 30,000 35,000 40,000 45,000 Q1 2017 Q2 2017 Q3 2017 Q4 2017 Q1 2018
% Relapse-free survival SignateraTM (RUO) highly predictive of relapse across tumor types Time post surgery (n=10) (n=39) (n=14) (n=9) (n=45) (n=13) HR 19.8 p < 0.005 HR 34.5 p < 0.001 HR 31.8 p < 0.0001 RFS post treatment. Abbosh C, et al. Nature. 2017 Apr 26;545(7655):446-451. RFS post cystectomy. Birkenskamp-Demtroder K, et al. AACR; 2018. Abstract nr 3653. RFS post ACT treatment. Andersen C, et al. AACR; 2018 Abstract nr 1590. * Positive at any time point at or before clinical relapse Lung (1) Bladder (2) Colon (3) Avg lead time 4 mos PPV 100% relapse < 12 mos Avg lead time 4 mos PPV 100% relapse < 9 mos Avg lead time 7 mos PPV 100% relapse < 15 mos * * * 5
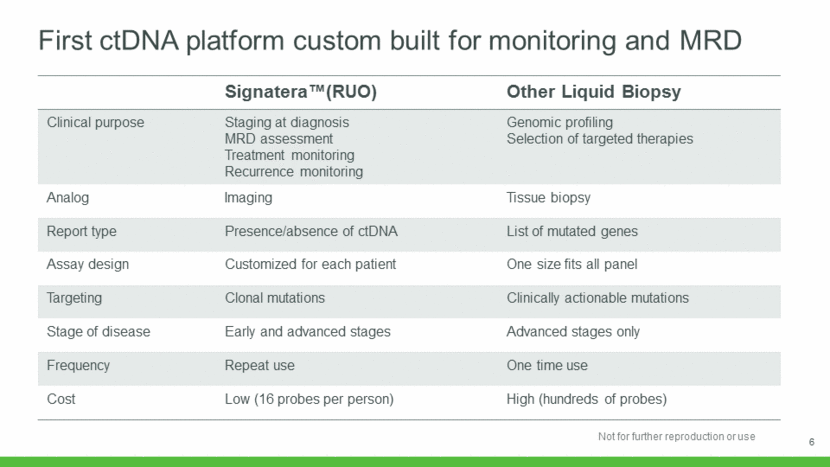
First ctDNA platform custom built for monitoring and MRD Signatera™(RUO) Other Liquid Biopsy Clinical purpose Staging at diagnosis MRD assessment Treatment monitoring Recurrence monitoring Genomic profiling Selection of targeted therapies Analog Imaging Tissue biopsy Report type Presence/absence of ctDNA List of mutated genes Assay design Customized for each patient One size fits all panel Targeting Clonal mutations Clinically actionable mutations Stage of disease Early and advanced stages Advanced stages only Frequency Repeat use One time use Cost Low (16 probes per person) High (hundreds of probes) 6
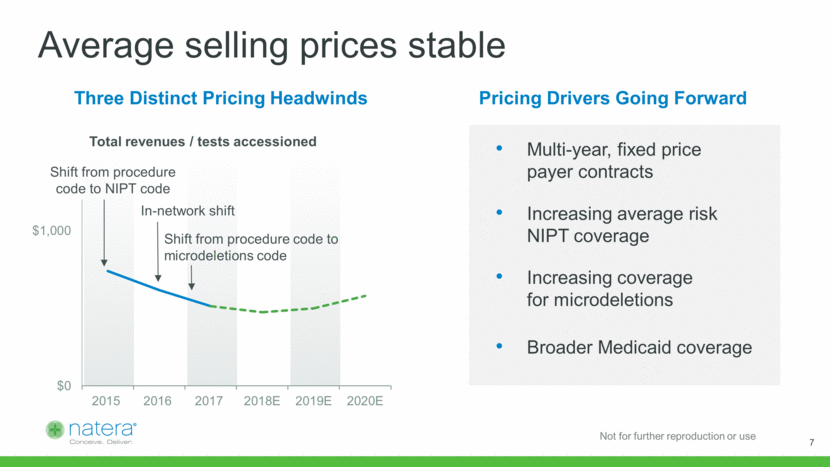
Average selling prices stable Multi-year, fixed price payer contracts Increasing average risk NIPT coverage Increasing coverage for microdeletions Broader Medicaid coverage Shift from procedure code to NIPT Code In-Network shift Shift from procedure code to Microdeletions code Total revenues / tests accessioned Three Distinct Pricing Headwinds Pricing Drivers Going Forward 7 $0 $1,000 2015 2016 2017 2018E 2019E 2020E
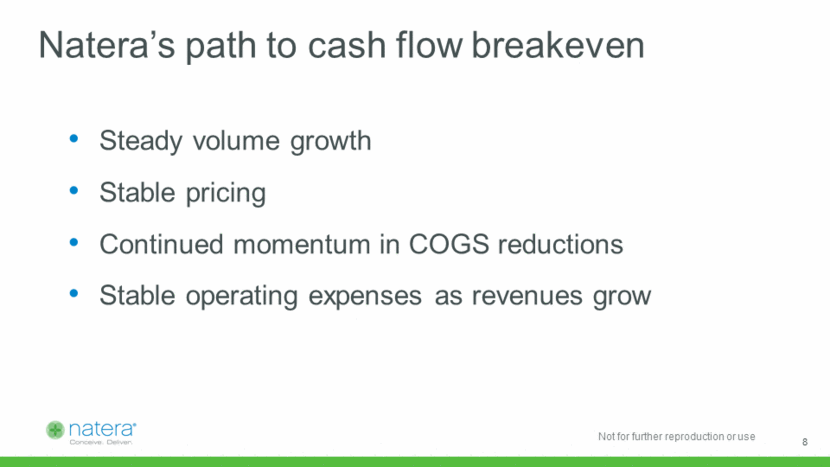
Natera’s path to cash flow breakeven Steady volume growth Stable pricing Continued momentum in COGS reductions Stable operating expenses as revenues grow 8
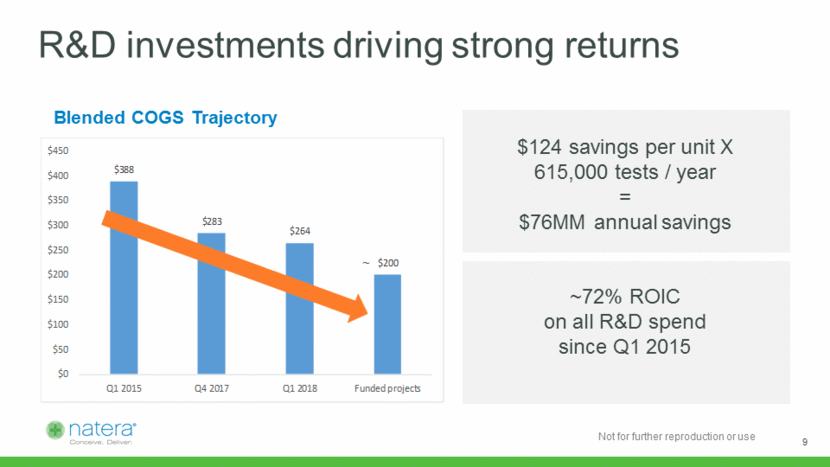
R&D investments driving strong returns Blended COGS Trajectory $124 savings per unit X 615,000 tests / year = $76MM annual savings ~72% ROIC on all R&D spend since Q1 2015 ~ 9 $388 $283 $264 $200 $0 $50 $100 $150 $200 $250 $300 $350 $400 $450 Q1 2015 Q4 2017 Q1 2018 Funded projects
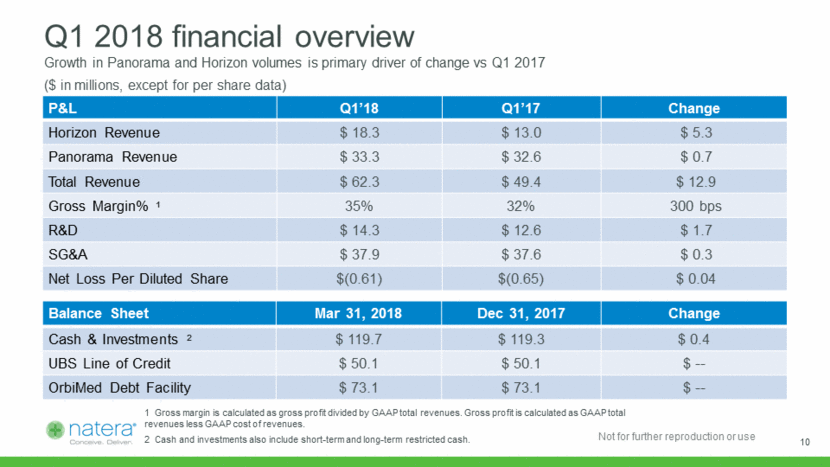
Q1 2018 financial overview Growth in Panorama and Horizon volumes is primary driver of change vs Q1 2017 P&L Q1’18 Q1’17 Change Horizon Revenue $ 18.3 $ 13.0 $ 5.3 Panorama Revenue $ 33.3 $ 32.6 $ 0.7 Total Revenue $ 62.3 $ 49.4 $ 12.9 Gross Margin% 1 35% 32% 300 bps R&D $ 14.3 $ 12.6 $ 1.7 SG&A $ 37.9 $ 37.6 $ 0.3 Net Loss Per Diluted Share $(0.61) $(0.65) $ 0.04 Balance Sheet Mar 31, 2018 Dec 31, 2017 Change Cash & Investments 2 $ 119.7 $ 119.3 $ 0.4 UBS Line of Credit $ 50.1 $ 50.1 $ -- OrbiMed Debt Facility $ 73.1 $ 73.1 $ -- ($ in millions, except for per share data) 1 Gross margin is calculated as gross profit divided by GAAP total revenues. Gross profit is calculated as GAAP total revenues less GAAP cost of revenues. 2 Cash and investments also include short-term and long-term restricted cash. 10
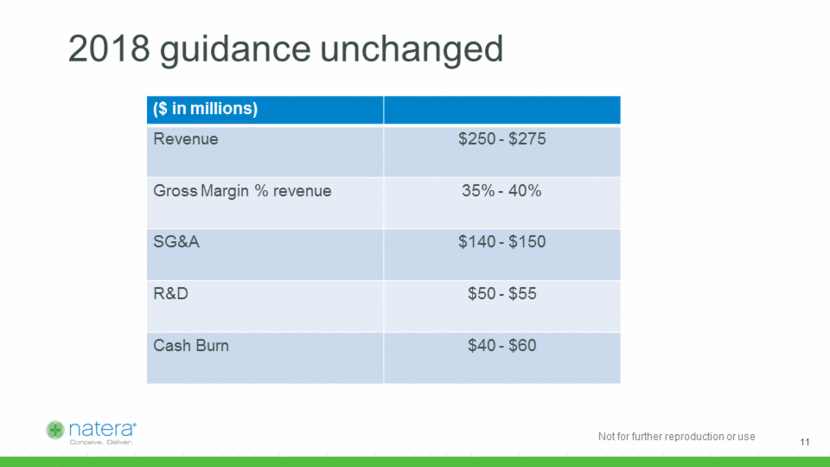
2018 guidance unchanged ($ in millions) Revenue $250 - $275 Gross Margin % revenue 35% - 40% SG&A $140 - $150 R&D $50 - $55 Cash Burn $40 - $60 11
[LOGO]