Attached files
| file | filename |
|---|---|
| EX-99.1 - EXHIBIT 99.1 - CALIX, INC | ex991pressrelease18q1.htm |
| 8-K - 8-K - CALIX, INC | form8-kearningsrelease18q1.htm |
Exhibit 99.2

May 8, 2018
Fellow Calix stockholders:
Our mission is to connect everyone and everything. Calix platforms empower our customers to build new business models, rapidly deploy new services and make the promise of the smart home and business a reality. Despite the continued headwinds impacting Q1 2018 revenue, we made steady progress on our mission. We expanded our addressable market, added 37 new customers, honed our service offerings, extended our core technology and expanded our platform ecosystem all while dramatically reducing our operating expenses on a quarter over quarter and year over year basis.
The End of One Era and the Beginning of Another
We have discussed the transformation of Calix from a legacy wireline access systems company to a communications cloud and software platform, systems and services business. With the announcement of EXOS at our 2017 flagship conference, ConneXions, we signaled a significant step in our transformation. Going forward our focus will be on our platforms; Calix Cloud, EXOS and AXOS. Our platforms provide our customers with the ability to transform their networks and their business models. We benefit from this transformation as well, as we expect that our platforms will expand our total addressable market dramatically, drive higher overall margins, and enable us to reduce our operating expenses. Furthermore, this focus will afford us opportunities to streamline our business. During the quarter, we took a step in this direction when we sold our outdoor cabinet product line to Clearfield.
Examples of progress made in the quarter were:
• | Successful achievement of production status in Verizon’s Intelligent Edge Network with our AXOS E9-2 and NGPON2; |
• | Deliberate diversification of our customer base resulting in our highest rate of new customer acquisition in 5 years, highlighted by our expanded presence in the Cable/MSO, municipality, cooperative and hospitality markets; |
• | Calix Cloud continuing to show tremendous traction with customers as bookings have increased at triple-digit rates each quarter since launch; |
• | Our mesh-enhanced carrier class Wi-Fi solutions delivering record sales of our GigaFamily systems; and |
• | AXOS surpassing the 200-customer mark for production network deployments along with the introduction of AXOS for the industry leading E7-2 GPON system. |
The Effects of Disruption and the Opportunity and Challenge Ahead
The ongoing wave of disruption sweeping across the communications space is unprecedented in our experience. We see traditional business models being completely disrupted as service providers of all types learn to adapt to the needs of the device-enabled subscriber. Our vision is focused on providing the platforms, services and products that enable innovative service providers to create services at a DevOps pace and provide their subscribers with an exceptional experience. Service providers achieve this objective by building their infrastructure and service offerings on platforms. We believe with Calix Cloud, EXOS and AXOS, we are positioned to win by providing the industry with the only solutions that enable innovative service providers to create services at a DevOps pace.
This industry disruption, however, has created challenges for predictability in customer spending patterns. For example, during the quarter, our largest customer continued to work through a significant acquisition, with new strategies and processes that in turn are disrupting their spending patterns. While we believe we are well placed to win in the long term, these challenges impacted our financial results this quarter and continue to limit our visibility for near-term revenue forecasting.
Q1 2018 Financial Results
1
Actual GAAP | Actual Non-GAAP | Guidance Non-GAAP | |
Revenue | $99.4M | $99.4M | $102 - $108M |
Gross margin | 42.3% | 42.5%(1) | 39.0 – 41.0%(1) |
Operating expenses | $53.2M | $52.0M(1) | $49.5 - $51.5M(1) |
Net loss per share | ($0.23) | ($0.20)(1) | ($0.20) – ($0.16)(1) |
Operating cash flow | ($5.8M) | Negative | Positive |
(1) Excludes the impact from non-GAAP items including stock-based compensation, restructuring charges and/or the gain on the sale of assets. See reconciliations to GAAP below.
Overall results in the quarter were mixed relative to expectations as revenue was impacted by slower spending in the quarter by several customers partially offset by a strong quarter with our smaller, regional customers. New product and regional mix helped drive overall gross margins above expectations, while operating expenses were higher than expected due to the timing of certain restructuring actions, on both a GAAP and non-GAAP basis. This led to a net loss at the low end of expectations.
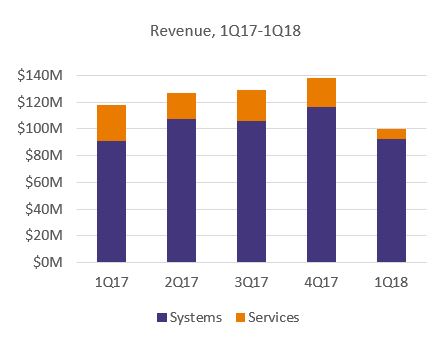
Systems revenue increased 2% compared to the year ago period. We saw continued traction with our AXOS and Calix Cloud platforms overcoming declines in traditional systems. In addition, we faced a challenging comparison with the year ago quarter as we substantially completed a major turnkey network improvement project in the first quarter last year. Services revenue was down more than 70% from the year ago period.
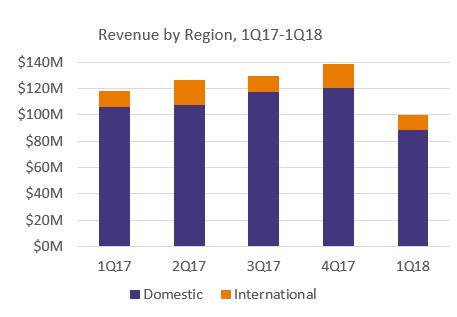
Domestic revenue for the quarter declined by 16% compared to the year ago period due to the just noted challenging comparison when the team completed a major turnkey network improvement project with a large customer. Revenue from large customers also decreased significantly compared to the year ago period due to the near completion of a major network improvement project at one customer in the year ago quarter and a slow-down in merger-related capital spending by another
2
major customer in the current period. In the year ago quarter, two customers contributed a significant portion of revenue as compared to only one of these customers in the current year quarter and at a much smaller percentage of revenue. Revenue from medium-sized customers declined significantly compared to the year ago quarter owing to the previously noted challenging comparison in the year ago quarter. Revenue from small and regional operators increased significantly compared to the year ago quarter led by strength in Calix Cloud and AXOS. International revenue declined by 9% year over year as the team continues to focus on profitable growth led to a decline in our traditional products partially offset by success with AXOS, Calix Cloud and our new products. We continue to diversify our revenue base across customers of different types and sizes. This is enabled by an all-platform business model as it allows us to expand our TAM while concentrating our R&D investments. In short, this is the result of a deliberate effort on our part.
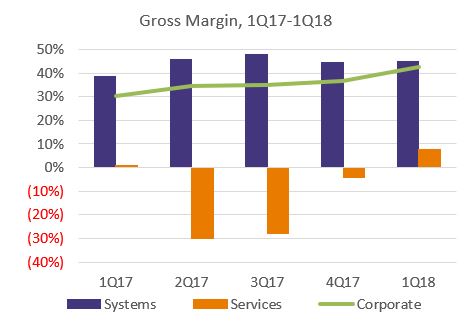
Overall gross margin in the quarter marked a six-quarter high and was higher than expected on improved regional and new product mix as well as benefits from better operating performance in services. Systems gross margin was up both compared to the prior quarter and to the year ago quarter on both a GAAP and non-GAAP basis. The principal drivers of the improved gross margin both year-over-year and sequentially were regional and new product mix. Services gross margin on both a GAAP and non-GAAP basis moved to a solidly positive level this quarter as the team executed well despite an uncertain demand environment. This quarter also benefited from process improvements implemented over the past year. As the team continues to implement these process improvements and focuses on delivering services with enhanced value for our customers, we expect our services business will move forward at positive gross margin.
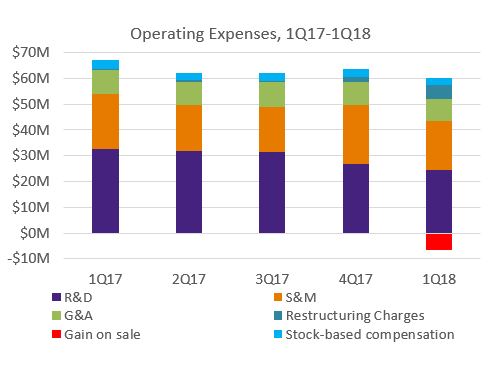
Operating expenses for the quarter were above our expectations on both a GAAP and non-GAAP basis largely associated with timing of actions related to our previously announced restructuring plan. Compared to the year ago quarter, both GAAP and non-GAAP operating expenses decreased by more than 10% and decreased by more than 5% and more than 10%, respectively, compared to the prior quarter excluding the gain on sale. These annual and sequential decreases primarily reflect the leverage
3
of our software platforms, which enables a lower level of incremental R&D investment while driving a higher level of platform enhancements that allow us to introduce new products at a DevOps pace. In addition, this quarter saw a benefit from our 2017 restructuring plan. Importantly, this quarter marks the first quarter since our IPO where Research & Development, Sales & Marketing and General & Administrative expenses declined on a year-over-year basis. With our platform model, we expect to continue to improve leverage from our operating expense investment while maintaining an accelerated pace of innovation.
Balance Sheet and Cash Flows
We ended the quarter with cash and investments of $42.6 million, which increased by $2.9 million compared to the prior quarter. During the quarter, we received proceeds from the sale of our outdoor cabinet product line of $10.3 million, which was partially offset by cash used in operating activities of $5.8 million and the purchase of equipment of $1.9 million. Compared to the year ago quarter, our cash balance declined due to negative operating cash flow reported over the past twelve months offset by the proceeds from the sale of our outdoor cabinet product line during the quarter as well as borrowings on our credit line.
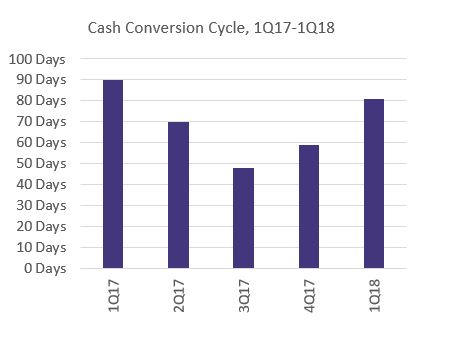
Our team’s performance has been excellent in managing our balance sheet metrics, while continuing to meet customer requested delivery dates. Accounts receivable days sales outstanding at quarter end decreased 2 days compared to the prior quarter and increased 1 day compared to the prior year. Inventory turns were 6.6 at quarter end, compared to 9 in the prior quarter and just over 6 in the year ago quarter. Accounts payable days at quarter end decreased 8 days from the prior quarter and increased 9 days from the prior year.
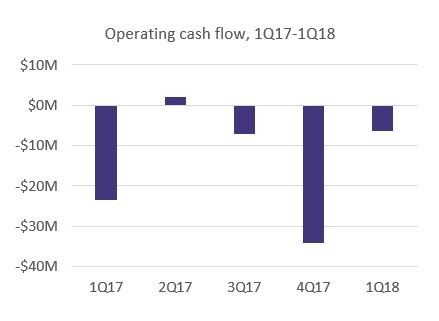
Operating cash flow in the quarter was negative due to our operating loss and reduction in accounts payable partially offset by a decline in accounts receivable as we previously disclosed the receipt from a key customer that delayed payment from the end of last year until early this quarter.
4
Q2 2018 Guidance
Guidance Non-GAAP | Reconciliation of Guidance to GAAP | |
Revenue | $110 - $115M | $110 - $115M |
Gross margin | 43.0 – 45.0%(1) | 42.8 – 44.8% |
Operating expenses | $50.0 - $52.0M(1) | $52.6 - $54.6M |
Net loss per share(2) | ($0.05) – $0.00(1) | ($0.10) – ($0.05) |
Cash flow | Positive | Positive |
(1) | Excludes the impact from non-GAAP items such as stock-based compensation. |
(2) | Based on 52.1 million weighted-average shares outstanding. |
Our guidance for Q2 2018 reflects our expectations as of the date of this letter. We expect to see positive benefits next quarter from the continued ramp of new, innovative products into the marketplace such as our mesh and carrier-class Wi-Fi systems, Calix Cloud subscriptions and continued shipments of the AXOS E9-2. Offsetting this expected growth will be a challenging comparison with the year ago quarter as the prior year’s quarter included the ramp of a major CAF2 project for a key customer. The work on this project peaked in the second half of 2017 and was substantially completed at the end of 2017. We expect the amount of new CAF2 work for this customer in 2018 to be significantly reduced as compared to 2017. As such, we expect that this trend will negatively impact our year-over-year revenue comparisons for the remainder of 2018.
Our non-GAAP gross margin guidance for next quarter reflects improved product mix compared to the prior quarter.
Our non-GAAP operating expense guidance for next quarter reflects the continued leverage our platforms provide, which results in significantly reduced costs to develop incremental functionality, while, more importantly, accelerating our time to market for new products.
Finally, with the team’s continued focus on improving balance sheet metrics and reducing our net loss, we anticipate generating positive operating cash flow and increasing our overall cash balance next quarter relative to the just reported quarter.
Importantly, we remain committed to our long-term financial model. As a reminder, our long-term model drives to a 10% or better operating margin as annual revenue exceeds $600 million.
Leadership and Governance
During the quarter, we added J. Daniel Plants to our Board of Directors. Dan is an experienced advisor to corporations, a Board member at other public companies and an investor in Calix. We believe he brings strong financial and corporate governance experience to our Board.
Summary
We made steady progress towards our mission in the quarter, while the quarter was another example of the effects caused by the entire industry responding to device-enabled subscribers connecting to the cloud. Innovative service providers are looking to Calix to provide the platforms, solutions and service to enable them to improve their subscribers’ experience - driving higher revenue, lower churn and increased ROI. As such, we believe we are well placed to return to profitability as we continue to drive towards our long-term financial model. We strongly believe we are in front of the largest disruption our industry has experienced, and our platform model uniquely positions us to capitalize on that disruption. We remain committed to our vision and we sincerely thank our employees, customers and stockholders for their continued support as we capitalize on this disruption.
Sincerely,
 Carl Russo President & CEO |  Cory Sindelar CFO |
5
Conference Call
In conjunction with this announcement, Calix will host a conference call at 2:00 p.m. Pacific Time (5:00 p.m. Eastern Time) today to answer questions regarding Q1 2018 financial results. A live audio webcast and replay of the call will be available in the Investor Relations section of the Calix website at http://investor-relations.calix.com.
Live call access information: Dial-in number: (877) 407-4019 (U.S.) or (201) 689-8337 (outside the U.S.)
The conference call and webcast will include forward-looking information.
Investor Inquiries
Thomas J. Dinges, CFA
Director of Investor Relations
408-474-0080
Tom.Dinges@calix.com
About Calix
Calix, Inc. (NYSE: CALX) - Innovative communications service providers rely on Calix platforms to help them master and monetize the complex infrastructure between their subscribers and the cloud. Calix is the leading global provider of the cloud and software platforms, systems and services required to deliver the unified access network and smart premises of tomorrow. Our platforms and services help our customers build next generation networks by embracing a DevOps operating model, optimize the subscriber experience by leveraging big data analytics and turn the complexity of the smart home and business into new revenue streams.
Forward-Looking Statements
Statements made in this stockholder letter and the earnings call referencing the stockholder letter that are not statements of historical fact are forward-looking statements. Forward-looking statements are subject to the “safe harbor" provisions of the Private Securities Litigation Reform Act of 1995. Forward-looking statements relate to, but are not limited to, statements about potential customer or market opportunities, opportunities with existing and prospective customers, estimates and planned cost savings related to restructuring plans and future financial performance (including the outlook for second quarter of fiscal 2018). Forward-looking statements are subject to risks and uncertainties that could cause actual results to differ materially from expectations, including but not limited to fluctuations in the Company’s financial and operating results, the capital spending decisions of its customers, changes and disruptions in the market and industry, changes in regulations and/or government sponsored programs, competition, its ability to achieve market acceptance of new products and solutions, its ability to grow its customer base, fluctuations in costs associated with its products and services including higher costs due to project delays and changes, cost overruns and other unanticipated factors, as well as the risks and uncertainties described in its annual reports on Form 10-K and its quarterly reports on Form 10-Q, each as filed with the SEC and available at www.sec.gov, particularly in the sections titled “Risk Factors.” Forward-looking statements speak only as of the date the statements are made and are based on information available to the Company at the time those statements are made and/or management’s good faith belief as of that time with respect to future events. Calix assumes no obligation to update forward-looking statements to reflect actual performance or results, changes in assumptions or changes in other factors affecting forward-looking information, except to the extent required by applicable securities laws. Accordingly, investors should not place undue reliance on any forward-looking statements.
Use of Non-GAAP Financial Information
The Company uses certain non-GAAP financial measures in this stockholder letter to supplement its consolidated financial statements, which are presented in accordance with GAAP. These non-GAAP measures include non-GAAP gross margin, non-GAAP operating expenses, non-GAAP diluted loss per share. These non-GAAP measures are provided to enhance the reader’s understanding of the Company’s operating performance as they primarily exclude certain non-cash charges for stock-based compensation, gain on sale of product line and restructuring charges, which the Company believes are not indicative of its core operating results. Management believes that the non-GAAP measures used in this stockholder letter provide investors with important perspectives into the Company’s ongoing business performance and management uses these non-GAAP measures to evaluate financial results and to establish operational goals. The presentation of these non-GAAP measures is not meant to be a substitute for results presented in accordance with GAAP, but rather should be evaluated in conjunction with those GAAP results. A reconciliation of the non-GAAP results to the most directly comparable GAAP results is provided in this stockholder
6
letter. The non-GAAP financial measures used by the Company may be calculated differently from, and therefore may not be comparable to, similarly titled measures used by other companies.
7
Calix, Inc. | |||||||||||
Condensed Consolidated Statements of Operations | |||||||||||
(Unaudited, in thousands, except per share data) | |||||||||||
Three Months Ended | |||||||||||
March 31, | April 1, | ||||||||||
2018 | 2017 | ||||||||||
Revenue: | |||||||||||
Systems | $ | 93,291 | $ | 91,605 | |||||||
Services | 6,112 | 25,913 | |||||||||
Total revenue | 99,403 | 117,518 | |||||||||
Cost of revenue: | |||||||||||
Systems (1) | 51,633 | 57,373 | |||||||||
Services (1) | 5,711 | 25,768 | |||||||||
Total cost of revenue | 57,344 | 83,141 | |||||||||
Gross profit | 42,059 | 34,377 | |||||||||
Operating expenses: | |||||||||||
Research and development (1) | 25,536 | 33,808 | |||||||||
Sales and marketing (1) | 19,901 | 22,429 | |||||||||
General and administrative (1) | 9,095 | 10,257 | |||||||||
Gain on sale of product line | (6,704 | ) | — | ||||||||
Restructuring charges | 5,340 | 699 | |||||||||
Total operating expenses | 53,168 | 67,193 | |||||||||
Loss from operations | (11,109 | ) | (32,816 | ) | |||||||
Interest and other income (expense), net: | |||||||||||
Interest income (expense), net | (223 | ) | 44 | ||||||||
Other income (expense), net | (294 | ) | 120 | ||||||||
Total interest and other income (expense), net | (517 | ) | 164 | ||||||||
Loss before provision for income taxes | (11,626 | ) | (32,652 | ) | |||||||
Provision for income taxes | 110 | 673 | |||||||||
Net loss | $ | (11,736 | ) | $ | (33,325 | ) | |||||
Net loss per common share: | |||||||||||
Basic and diluted | $ | (0.23 | ) | $ | (0.67 | ) | |||||
Weighted average number of shares used to compute | |||||||||||
net loss per common share: | |||||||||||
Basic and diluted | 51,611 | 49,525 | |||||||||
(1) | Includes stock-based compensation as follows: | ||||||||||
Cost of revenue: | |||||||||||
Systems | $ | 112 | $ | 116 | |||||||
Services | 77 | 56 | |||||||||
Research and development | 983 | 1,326 | |||||||||
Sales and marketing | 850 | 1,111 | |||||||||
General and administrative | 735 | 931 | |||||||||
8
Calix, Inc. | ||||||||
Condensed Consolidated Balance Sheets | ||||||||
(Unaudited, in thousands) | ||||||||
March 31, | December 31, | |||||||
2018 | 2017 | |||||||
ASSETS | ||||||||
Current assets: | ||||||||
Cash and cash equivalents | $ | 42,628 | $ | 39,775 | ||||
Accounts receivable, net | 55,746 | 80,392 | ||||||
Inventory | 27,061 | 31,529 | ||||||
Prepaid expenses and other current assets | 12,551 | 10,759 | ||||||
Total current assets | 137,986 | 162,455 | ||||||
Property and equipment, net | 14,808 | 15,681 | ||||||
Goodwill | 116,175 | 116,175 | ||||||
Other assets | 1,943 | 759 | ||||||
$ | 270,912 | $ | 295,070 | |||||
LIABILITIES AND STOCKHOLDERS’ EQUITY | ||||||||
Current liabilities: | ||||||||
Accounts payable | $ | 17,836 | $ | 35,977 | ||||
Accrued liabilities | 48,783 | 49,279 | ||||||
Deferred revenue | 14,676 | 13,076 | ||||||
Line of credit | 30,000 | 30,000 | ||||||
Total current liabilities | 111,295 | 128,332 | ||||||
Long-term portion of deferred revenue | 20,712 | 20,645 | ||||||
Other long-term liabilities | 866 | 1,130 | ||||||
Total liabilities | 132,873 | 150,107 | ||||||
Stockholders’ equity: | ||||||||
Common stock | 1,426 | 1,421 | ||||||
Additional paid-in capital | 853,809 | 851,054 | ||||||
Accumulated other comprehensive income (loss) | 110 | (169 | ) | |||||
Accumulated deficit | (677,320 | ) | (667,357 | ) | ||||
Treasury stock | (39,986 | ) | (39,986 | ) | ||||
Total stockholders’ equity | 138,039 | 144,963 | ||||||
$ | 270,912 | $ | 295,070 | |||||
9
Calix, Inc. | ||||||||
Condensed Consolidated Statements of Cash Flows | ||||||||
(Unaudited, in thousands) | ||||||||
Three Months Ended | ||||||||
March 31, | April 1, | |||||||
2018 | 2017 | |||||||
Operating activities: | ||||||||
Net loss | $ | (11,736 | ) | $ | (33,325 | ) | ||
Adjustments to reconcile net loss to net cash used in operating activities: | ||||||||
Stock-based compensation | 2,757 | 3,540 | ||||||
Depreciation and amortization | 2,623 | 2,463 | ||||||
Amortization of intangible assets | — | 813 | ||||||
Loss on retirement of property and equipment | 244 | 80 | ||||||
Gain on sale of product line | (6,704 | ) | — | |||||
Amortization of discount relating to available-for-sale securities | — | (5 | ) | |||||
Changes in operating assets and liabilities: | ||||||||
Accounts receivable, net | 25,137 | (12,852 | ) | |||||
Inventory | 2,451 | (1,993 | ) | |||||
Prepaid expenses and other assets | (2,521 | ) | (6,659 | ) | ||||
Accounts payable | (17,871 | ) | 276 | |||||
Accrued liabilities | (805 | ) | 7,110 | |||||
Deferred revenue | 866 | 17,201 | ||||||
Other long-term liabilities | (264 | ) | (103 | ) | ||||
Net cash used in operating activities | (5,823 | ) | (23,454 | ) | ||||
Investing activities: | ||||||||
Purchases of property and equipment | (1,875 | ) | (2,106 | ) | ||||
Purchases of marketable securities | — | (8,732 | ) | |||||
Maturities of marketable securities | — | 11,266 | ||||||
Proceeds from sale of product line | 10,350 | — | ||||||
Net cash provided by investing activities | 8,475 | 428 | ||||||
Financing activities: | ||||||||
Proceeds from exercise of stock options | 8 | 13 | ||||||
Taxes paid for awards vested under equity incentive plan | (5 | ) | (1,093 | ) | ||||
Proceeds from line of credit | 163,238 | — | ||||||
Repayment of line of credit | (163,238 | ) | — | |||||
Net cash provided by (used in) financing activities | 3 | (1,080 | ) | |||||
Effect of exchange rate changes on cash and cash equivalents | 198 | 65 | ||||||
Net increase (decrease) in cash and cash equivalents | 2,853 | (24,041 | ) | |||||
Cash and cash equivalents at beginning of period | 39,775 | 50,359 | ||||||
Cash and cash equivalents at end of period | $ | 42,628 | $ | 26,318 | ||||
10
Calix, Inc. | ||||||||||||
Reconciliation of GAAP to Non-GAAP Results | ||||||||||||
(Unaudited, in thousands, except per share data) | ||||||||||||
Three Months Ended March 31, 2018 | ||||||||||||
Gross Margin % | Operating Expenses | Net Loss Per Diluted Share | ||||||||||
GAAP amount | 42.3 | % | $ | 53,168 | $ | (0.23 | ) | |||||
Adjustments to GAAP amounts: | ||||||||||||
Stock-based compensation | 0.2 | % | (2,568 | ) | 0.05 | |||||||
Gain on sale of product line | — | 6,704 | (0.12 | ) | ||||||||
Restructuring charges | — | (5,340 | ) | 0.10 | ||||||||
Non-GAAP amount | 42.5 | % | $ | 51,964 | $ | (0.20 | ) | |||||
Calix, Inc. | ||||||
Reconciliation of GAAP to Non-GAAP Outlook | ||||||
(Unaudited, in thousands, except per share data) | ||||||
Three Months Ending June 30, 2018 | ||||||
Outlook | GAAP | Stock-Based Compensation | Non-GAAP | |||
Gross margin | 42.8% - 44.8% | 0.2% | 43.0% - 45.0% | |||
Operating expenses | $ 52,600 - $ 54,600 | $ (2,600) | $ 50,000 - $ 52,000 | |||
Net loss per diluted share(1) | $ (0.10) - $ (0.05) | $ 0.05 | $ (0.05) - $ 0.00 | |||
(1) Based on 52.1 million weighted average shares outstanding
11