Attached files
| file | filename |
|---|---|
| EX-32.2 - EXHIBIT 32.2 - BAR HARBOR BANKSHARES | exhibit322033118.htm |
| EX-32.1 - EXHIBIT 32.1 - BAR HARBOR BANKSHARES | exhibit321033118.htm |
| EX-31.2 - EXHIBIT 31.2 - BAR HARBOR BANKSHARES | exhibit312033118.htm |
| EX-31.1 - EXHIBIT 31.1 - BAR HARBOR BANKSHARES | exhibit311033118.htm |
UNITED STATES
SECURITIES AND EXCHANGE COMMISSION
WASHINGTON, D.C. 20549
FORM 10-Q
ý | QUARTERLY REPORT PURSUANT TO SECTION 13 OR 15(d) OF THE SECURITIES EXCHANGE ACT OF 1934 |
For the quarterly period ended: March 31, 2018
o | TRANSITION REPORT PURSUANT TO SECTION 13 OR 15(d) OF THE SECURITIES EXCHANGE ACT OF 1934 |
For the transition period from to
Commission File Number: 001-13349

BAR HARBOR BANKSHARES
(Exact name of registrant as specified in its charter)
Maine | 01-0393663 | |
(State or other jurisdiction of incorporation or organization) | (I.R.S. Employer Identification No.) | |
PO Box 400 | ||
82 Main Street, Bar Harbor, ME | 04609-0400 | |
(Address of principal executive offices) | (Zip Code) | |
Registrant’s telephone number, including area code: (207) 288-3314
Indicate by check mark whether the registrant (1) has filed all reports required to be filed by Section 13 or 15(d) of the Securities Exchange Act of 1934 during the preceding 12 months (or for such shorter period that the registrant was required to file such reports), and (2) has been subject to such filing requirements for the past 90 days. Yes ý No
Indicate by check mark whether the registrant has submitted electronically and posted on its corporate Web site, if any, every Interactive Data File required to be submitted and posted pursuant to Rule 405 of Regulation S-T (§232.405 of this chapter) during the preceding 12 months (or for such shorter period that the registrant was required to submit and post such files). Yes ý No o
Indicate by check mark whether the registrant is a large accelerated filer, an accelerated filer, a non-accelerated filer, a smaller reporting company or an emerging growth company. See the definition of “large accelerated filer,” “accelerated filer”, “smaller reporting company”, or "emerging growth company" in Rule 12b-2 of the Exchange Act. (Check one)
Large Accelerated Filer o Accelerated Filer ý Non-Accelerated Filer o Smaller Reporting Company o Emerging growth company o
If an emerging growth company, indicate by check mark if the registrant has elected not to use the extended transition period for complying with any new or revised financial accounting standards provided pursuant to Section 13(a) of the Exchange Act. o
Indicate by check mark whether the registrant is a shell company (as defined in Rule 12b-2 of the Exchange Act) Yes o No ý
The Registrant had 15,486,087 shares of common stock, par value $2.00 per share, outstanding as of May 4, 2018.
BAR HARBOR BANKSHARES AND SUBSIDIARIES
FORM 10-Q
INDEX
Page | ||||
2
3
PART I
ITEM 1. CONSOLIDATED FINANCIAL STATEMENTS (UNAUDITED)
BAR HARBOR BANKSHARES AND SUBSIDIARIES
CONSOLIDATED BALANCE SHEET
(in thousands, except share data) | March 31, 2018 | December 31, 2017 | |||||||
Assets | |||||||||
Cash and due from banks | $ | 35,088 | $ | 34,262 | |||||
Interest-bearing deposit with the Federal Reserve Bank | 12,725 | 56,423 | |||||||
Total cash and cash equivalents | 47,813 | 90,685 | |||||||
Securities available for sale, at fair value | 718,559 | 717,242 | |||||||
Federal Home Loan Bank stock | 38,105 | 38,105 | |||||||
Total securities | 756,664 | 755,347 | |||||||
Commercial real estate | 824,721 | 826,746 | |||||||
Commercial and industrial | 387,205 | 379,423 | |||||||
Residential real estate | 1,132,977 | 1,155,682 | |||||||
Consumer | 119,516 | 123,762 | |||||||
Total loans | 2,464,419 | 2,485,613 | |||||||
Less: Allowance for loan losses | (12,679 | ) | (12,325 | ) | |||||
Net loans | 2,451,740 | 2,473,288 | |||||||
Premises and equipment, net | 48,464 | 47,708 | |||||||
Other real estate owned | 216 | 122 | |||||||
Goodwill | 100,085 | 100,085 | |||||||
Other intangible assets | 8,152 | 8,383 | |||||||
Cash surrender value of bank-owned life insurance | 58,433 | 57,997 | |||||||
Deferred tax assets, net | 9,627 | 7,180 | |||||||
Other assets | 29,793 | 24,389 | |||||||
Total assets | $ | 3,510,987 | $ | 3,565,184 | |||||
Liabilities | |||||||||
Demand and other non-interest bearing deposits | $ | 342,192 | $ | 349,055 | |||||
NOW deposits | 448,992 | 466,610 | |||||||
Savings deposits | 361,591 | 364,799 | |||||||
Money market deposits | 303,777 | 305,275 | |||||||
Time deposits | 884,848 | 866,346 | |||||||
Total deposits | 2,341,400 | 2,352,085 | |||||||
Senior borrowings | 742,198 | 786,688 | |||||||
Subordinated borrowings | 43,018 | 43,033 | |||||||
Total borrowings | 785,216 | 829,721 | |||||||
Other liabilities | 32,214 | 28,737 | |||||||
Total liabilities | 3,158,830 | 3,210,543 | |||||||
(continued) | |||||||||
Shareholders’ equity | |||||||||
Capital stock, par value $2.00; authorized 20,000,000 shares; issued 16,428,388 and 16,428,388 shares at March 31, 2018 and December 31, 2017, respectively | 32,857 | 32,857 | |||||||
Additional paid-in capital | 186,969 | 186,702 | |||||||
Retained earnings | 150,701 | 144,977 | |||||||
Accumulated other comprehensive loss | (13,156 | ) | (4,554 | ) | |||||
Less: cost of 969,352 and 985,532 shares of treasury stock at March 31, 2018 and December 31, 2017, respectively | (5,214 | ) | (5,341 | ) | |||||
Total shareholders’ equity | 352,157 | 354,641 | |||||||
Total liabilities and shareholders’ equity | $ | 3,510,987 | $ | 3,565,184 | |||||
The accompanying notes are an integral part of these consolidated financial statements.
4
BAR HARBOR BANKSHARES AND SUBSIDIARIES
CONSOLIDATED STATEMENTS OF INCOME
Three Months Ended March 31, | ||||||||
(in thousands, except per share data) | 2018 | 2017 | ||||||
Interest and dividend income | ||||||||
Loans | $ | 25,126 | $ | 21,194 | ||||
Securities and other | 5,651 | 4,991 | ||||||
Total interest and dividend income | 30,777 | 26,185 | ||||||
Interest expense | ||||||||
Deposits | 3,985 | 2,210 | ||||||
Borrowings | 3,634 | 2,603 | ||||||
Total interest expense | 7,619 | 4,813 | ||||||
Net interest income | 23,158 | 21,372 | ||||||
Provision for loan losses | 795 | 795 | ||||||
Net interest income after provision for loan losses | 22,363 | 20,577 | ||||||
Non-interest income | ||||||||
Trust and investment management fee income | 2,962 | 2,864 | ||||||
Insurance brokerage service income | — | 364 | ||||||
Customer service fees | 2,224 | 1,773 | ||||||
Bank-owned life insurance income | 446 | 399 | ||||||
Other income | 606 | 546 | ||||||
Total non-interest income | 6,238 | 5,946 | ||||||
Non-interest expense | ||||||||
Salaries and employee benefits | 10,989 | 10,321 | ||||||
Occupancy and equipment | 3,073 | 2,666 | ||||||
Loss on premises and equipment, net | — | 95 | ||||||
Outside services | 560 | 597 | ||||||
Professional services | 433 | 440 | ||||||
Communication | 180 | 368 | ||||||
Amortization of intangible assets | 207 | 180 | ||||||
Acquisition, conversion and other expenses | 335 | 3,112 | ||||||
Other expenses | 3,075 | 3,052 | ||||||
Total non-interest expense | 18,852 | 20,831 | ||||||
Income before income taxes | 9,749 | 5,692 | ||||||
Income tax expense | 1,937 | 1,481 | ||||||
Net income | $ | 7,812 | $ | 4,211 | ||||
Earnings per share: | ||||||||
Basic | $ | 0.51 | $ | 0.29 | ||||
Diluted | $ | 0.50 | $ | 0.29 | ||||
Weighted average common shares outstanding: | ||||||||
Basic | 15,448 | 14,471 | ||||||
Diluted | 15,553 | 14,591 | ||||||
The accompanying notes are an integral part of these consolidated financial statements.
5
BAR HARBOR BANKSHARES AND SUBSIDIARIES
CONSOLIDATED STATEMENTS OF COMPREHENSIVE INCOME
Three Months Ended March 31, | ||||||||
(in thousands) | 2018 | 2017 | ||||||
Net income | $ | 7,812 | $ | 4,211 | ||||
Other comprehensive income (loss), before tax: | ||||||||
Changes in unrealized loss on securities available-for-sale | (10,702 | ) | 1,095 | |||||
Changes in unrealized loss on derivative hedges | 654 | (338 | ) | |||||
Changes in unrealized loss on pension | 41 | 34 | ||||||
Income taxes related to other comprehensive income (loss): | ||||||||
Changes in unrealized loss on securities available-for-sale | 2,550 | (327 | ) | |||||
Changes in unrealized loss on derivative hedges | (155 | ) | 198 | |||||
Changes in unrealized loss on pension | (10 | ) | 2 | |||||
Total other comprehensive (loss) income | (7,622 | ) | 664 | |||||
Total comprehensive income | $ | 190 | $ | 4,875 | ||||
The accompanying notes are an integral part of these consolidated financial statements.
6
BAR HARBOR BANKSHARES AND SUBSIDIARIES
CONSOLIDATED STATEMENTS OF CHANGES IN SHAREHOLDERS’ EQUITY
(in thousands) | Common stock amount | Additional paid-in capital | Retained earnings | Accumulated other comprehensive income | Treasury stock | Total | ||||||||||||||||||
Balance at December 31, 2016 | $ | 13,577 | $ | 23,027 | $ | 130,489 | $ | (4,326 | ) | $ | (6,027 | ) | $ | 156,740 | ||||||||||
Comprehensive income: | ||||||||||||||||||||||||
Net income | — | — | 4,211 | — | — | 4,211 | ||||||||||||||||||
Other comprehensive loss | — | — | — | 664 | — | 664 | ||||||||||||||||||
Total comprehensive income | — | — | 4,211 | 664 | — | 4,875 | ||||||||||||||||||
Cash dividends declared ($0.19 per share) | — | — | (2,870 | ) | — | — | (2,870 | ) | ||||||||||||||||
Acquisition of Lake Sunapee Bank Group | 8,328 | 173,591 | — | — | — | 181,919 | ||||||||||||||||||
Net issuance (23,288) to employee stock plans, including related tax effects | — | 130 | — | — | 199 | 329 | ||||||||||||||||||
Three-for-two stock split | 10,952 | (10,952 | ) | (16 | ) | — | — | (16 | ) | |||||||||||||||
Recognition of stock based compensation | — | 71 | — | — | — | 71 | ||||||||||||||||||
Balance at March 31, 2017 | $ | 32,857 | $ | 185,867 | $ | 131,814 | $ | (3,662 | ) | $ | (5,828 | ) | $ | 341,048 | ||||||||||
Balance at December 31, 2017 | $ | 32,857 | $ | 186,702 | $ | 144,977 | $ | (4,554 | ) | $ | (5,341 | ) | $ | 354,641 | ||||||||||
Comprehensive income: | ||||||||||||||||||||||||
Net income | — | — | 7,812 | — | — | 7,812 | ||||||||||||||||||
Other comprehensive loss | — | — | — | (7,622 | ) | — | (7,622 | ) | ||||||||||||||||
Total comprehensive income | — | — | 7,812 | (7,622 | ) | — | 190 | |||||||||||||||||
Cash dividends declared ($0.56 per share) | — | — | (2,884 | ) | — | — | (2,884 | ) | ||||||||||||||||
Net issuance (16,180 shares) to employee stock plans, including related tax effects | — | (112 | ) | — | — | 127 | 15 | |||||||||||||||||
Modified retrospective basis adoption of Revenue Recognition Accounting Codification Standard 606 | — | — | (184 | ) | — | — | (184 | ) | ||||||||||||||||
Reclassification of the income tax effects of the Tax Cuts and Jobs Act from accumulated other comprehensive income for adoption of ASU 2018-02 | — | — | 980 | (980 | ) | — | — | |||||||||||||||||
Recognition of stock based compensation | — | 379 | — | — | — | 379 | ||||||||||||||||||
Balance at March 31, 2018 | $ | 32,857 | $ | 186,969 | $ | 150,701 | $ | (13,156 | ) | $ | (5,214 | ) | $ | 352,157 | ||||||||||
The accompanying notes are an integral part of these consolidated financial statements.
7
BAR HARBOR BANKSHARES AND SUBSIDIARIES
CONSOLIDATED STATEMENTS OF CASH FLOWS
Three Months Ended March 31, | ||||||||
(in thousands) | 2018 | 2017 | ||||||
Cash flows from operating activities: | ||||||||
Net income | $ | 7,812 | $ | 4,211 | ||||
Adjustments to reconcile net income to net cash provided by operating activities: | ||||||||
Provision for loan losses | 795 | 795 | ||||||
Net amortization of securities | 1,059 | 1,235 | ||||||
Deferred tax benefit | — | (237 | ) | |||||
Change in unamortized net loan costs and premiums | 368 | (29 | ) | |||||
Premises and equipment depreciation and amortization expense | 841 | 838 | ||||||
Stock-based compensation expense | 379 | 71 | ||||||
Accretion of purchase accounting entries, net | (704 | ) | (606 | ) | ||||
Amortization of other intangibles | 207 | 180 | ||||||
Income from cash surrender value of bank-owned life insurance policies | (446 | ) | (399 | ) | ||||
Loss on premises and equipment, net | — | 95 | ||||||
Net change in other | (1,444 | ) | (5,152 | ) | ||||
Net cash provided by operating activities | 8,867 | 1,002 | ||||||
Cash flows from investing activities: | ||||||||
Proceeds from maturities, calls and prepayments of securities available for sale | 23,350 | 30,208 | ||||||
Purchases of securities available for sale | (36,428 | ) | (81,574 | ) | ||||
Net change in loans | 21,033 | (16,388 | ) | |||||
Purchase of loans | — | (18,621 | ) | |||||
Purchase of Federal Home Loan Bank stock | — | (5,624 | ) | |||||
Purchase of premises and equipment, net | (1,595 | ) | (1,652 | ) | ||||
Acquisitions, net of cash (paid) acquired | — | 39,537 | ||||||
Proceeds from sale of other real estate | — | 81 | ||||||
Net cash provided by/(used in) investing activities | 6,360 | (54,033 | ) | |||||
Cash flows from financing activities: | ||||||||
Net decrease in deposits | (10,740 | ) | (26,495 | ) | ||||
Net change in short-term advances from the Federal Home Loan Bank | (50,511 | ) | 141,555 | |||||
Net change in long term advances from the Federal Home Loan Bank | 6,021 | (18,513 | ) | |||||
Net change in securities sold repurchase agreements | — | (7,372 | ) | |||||
Exercise of stock options | 15 | 313 | ||||||
Common stock cash dividends paid | (2,884 | ) | (2,870 | ) | ||||
Net cash (used in)/provided by financing activities | (58,099 | ) | 86,618 | |||||
Net change in cash and cash equivalents | (42,872 | ) | 33,587 | |||||
Cash and cash equivalents at beginning of year | 90,685 | 8,439 | ||||||
Cash and cash equivalents at end of year | $ | 47,813 | $ | 42,026 | ||||
Three Months Ended March 31, | ||||||||
(in thousands) | 2018 | 2017 | ||||||
Supplemental cash flow information: | ||||||||
Interest paid | $ | 7,740 | $ | 4,795 | ||||
Income taxes paid, net | 45 | 296 | ||||||
Acquisition of non-cash assets and liabilities: | ||||||||
Assets acquired | — | 1,454,076 | ||||||
Liabilities assumed | — | 1,406,672 | ||||||
Other non-cash changes: | ||||||||
Real estate owned acquired in settlement of loans | 94 | 32 | ||||||
The accompanying notes are an integral part of these consolidated financial statements.
8
BAR HARBOR BANKSHARES AND SUBSIDIARIES
NOTES TO UNAUDITED CONSOLIDATED INTERIM FINANCIAL STATEMENTS
NOTE 1. BASIS OF PRESENTATION
The consolidated financial statements (the “financial statements”) of Bar Harbor Bankshares and its subsidiaries (the “Company” or “Bar Harbor”) have been prepared in conformity with accounting principles generally accepted in the United States of America (“GAAP”). Bar Harbor Bankshares is a Maine Financial Institution Holding Company for the purposes of the laws of the state of Maine, and as such is subject to the jurisdiction of the Superintendent of the Maine Bureau of Financial Institutions. These financial statements include the accounts of the Company, its wholly-owned subsidiary Bar Harbor Bank & Trust (the "Bank") and the Bank’s consolidated subsidiaries. The results of operations of companies or assets acquired are included only from the dates of acquisition. All material wholly-owned and majority-owned subsidiaries are consolidated unless GAAP requires otherwise.
In addition, these interim financial statements have been prepared in accordance with the instructions to Form 10-Q and Article 10 of Regulation S-X, and accordingly, certain information and footnote disclosures normally included in financial statements prepared according to GAAP have been omitted.
The results for any interim period are not necessarily indicative of results for the full year. These consolidated financial statements should be read in conjunction with the audited financial statements and note disclosures for the Company's Annual Report on Form 10-K for the year ended December 31, 2017 previously filed with the Securities and Exchange Commission (the "SEC"). In management's opinion, all adjustments necessary for a fair statement are reflected in the interim periods presented.
Reclassifications: Whenever necessary, amounts in the prior years’ financial statements are reclassified to conform to current presentation. The reclassifications had no impact on net income in the Company’s consolidated income statement.
Tax Cuts and Jobs Act
Public law No. 115-97, known as the Tax Cuts and Jobs Act (the "Tax Act"), enacted on December 22, 2017, reduced the U.S. federal corporate tax rate from 35% to 21% effective January 1, 2018. Also on December 22, 2017, the Securities and Exchange Commission issued Staff Accounting Bulletin No. 118 ("SAB 118"), which provides guidance on accounting for tax effects of the Tax Act. SAB 118 provides a measurement period of up to one year from the enactment date to complete the accounting. Any adjustments during this measurement period will be included in net earnings from continuing operations as an adjustment to income tax expense in the reporting period when such adjustments are determined. Based on the information available and current interpretation of the rules, the Company estimated the impact of the reduction in the corporate tax rate and remeasurement of certain deferred tax assets and liabilities. The provisional amount recorded in the fourth quarter of 2017 related to the remeasurement of the Company's deferred tax balance resulted in additional income tax expense of $4.0 million. The final impact of the Tax Act may differ from these estimates as a result of changes in management's interpretations and assumptions, as well as new guidance issued by the Internal Revenue Service.
9
Recent Accounting Pronouncements
The following table provides a brief description of recent accounting standards updates (ASU") that could have a material impact to the Company’s consolidated financial statements upon adoption:
Standard | Description | Required Date of Adoption | Effect on financial statements |
Standards Adopted in 2018 | |||
ASU 2014-09, Revenue from Contracts with Customers | This ASU supersedes the revenue recognition requirements in ASC Topic 605, Revenue Recognition, and most industry-specific guidance throughout the Industry topics of the Codification. The core principle of the ASU is an entity should recognize revenue to depict the transfer of promised goods or services to customers in an amount that reflects the consideration to which the entity expects to be entitled in exchange for those goods or services. The ASU may be adopted either retrospectively or on a modified retrospective basis. | January 1, 2018 | The Company adopted this ASU as of January 1, 2018, upon completion of an analysis to identify all revenue streams within the scope of this accounting guidance. After reviewing the related contracts as prescribed by the five steps within this ASU, one contract resulted in recognition of a $241,000 liability with a $184,000 impact to retained earnings net of tax. The remaining changes had no material impact on the consolidated financial statements. See below for more detail and transitional disclosures. |
ASU 2015-14, Deferral of the Effective Date | |||
ASU 2016-08, Principal versus Agent Considerations | |||
ASU 2016-10, Identifying Performance Obligations and Licensing | |||
ASU 2016-12, Narrow-Scope Improvements and Practical Expedience | |||
ASU 2016-20, Technical Corrections and Improvements to Topic 606, Revenue from Contracts with Customers | |||
ASU 2016-01, Recognition and Measurement of Financial Assets and Liabilities | This ASU amends ASC Topic 825, Financial Instruments-Overall, and addresses certain aspects of recognition, measurement, presentation, and disclosure of financial instruments. Among other minor amendments applicable to the Company, the main provisions require investments in equity securities to be measured at fair value with changes in fair value recognized through net income unless they qualify for a practicability exception (excludes investments accounted for under the equity method of accounting or those that result in consolidation of the investee). Except for disclosure requirements that will be adopted prospectively, the ASU must be adopted on a modified retrospective basis. | January 1, 2018 | The Company adopted this ASU as of January 1, 2018, although it did not have any equity securities that would be in scope of this ASU. However, the Company is subject to the exit notion pricing required in fair value disclosures and after calculating the fair value, the Company had no material impact to its consolidated financial statements. |
ASU-2018-03, Technical Corrections and Improvements to Financial Instruments | |||
ASU 2016-15, Classification of Certain Cash Receipts and Cash Payments | This ASU amends Topic 230, Statement of Cash Flows, and provides clarification with respect to classification within the statement of cash flows where current guidance is unclear or silent. The ASU should be adopted retrospectively. If it is impractical to apply the guidance retrospectively for an issue, the amendments related to the issue would be applied prospectively. | January 1, 2018 | The adoption of this ASU did not have a material impact on the Company's consolidated financial statements. |
ASU 2017-07, Compensation- Retirement Benefits | This ASU amends Topic 715, Retirement Benefits, and provides more prescriptive guidance around the presentation of net period pension and postretirement benefit cost in the income statement. The amendment requires the service cost component be disaggregated from other components of net periodic benefit cost in the income statement. | January 1, 2018 | The adoption of this ASU did not have a material impact on the Company's consolidated financial statements. |
Early adoption is permitted. | |||
10
Standard | Description | Required Date of Adoption | Effect on financial statements |
Standards Adopted in 2018 (continued) | |||
ASU 2017-09, Stock Compensation: Scope of Modification Accounting | This ASU amends Topic 718, Compensation- Stock Compensation, and clarifies when modification accounting should be applied to changes in terms or conditions of share-based payment awards. The amendments narrow the scope of modification accounting by clarifying that modification accounting should be applied to awards if the change affects the fair value, vesting conditions, or classification of the award. The amendments do not impact current disclosure requirements for modifications, regardless of whether modification accounting is required under the new guidance. | January 1, 2018 | The adoption of this ASU did not have a material impact on the Company's consolidated financial statements. |
ASU 2018-02, Reclassification of Certain Tax Effects from Accumulated Other Comprehensive Income | The ASU amends Topic 220, Income Statement-Reporting Comprehensive Income, and is intended to help organizations reclassify certain stranded income tax effects in accumulated other comprehensive income resulting from the recently enacted Tax Reform. The guidance allows entities to reclassify stranded tax effects in accumulated other comprehensive income to retained earnings. | January 1, 2019 | The Company adopted this ASU as of March 31, 2018. The effect of the reclassification resulted in an increase to retained earnings and a decrease to accumulated other comprehensive income of $980,000 with zero net effect on total stockholders' equity. |
ASU 2018-05, Income Taxes (Topic 740) SEC Amendments | Early adoption is permitted. | ||
Standard | Description | Required Date of Adoption | Effect on financial statements |
Standards Not Yet Adopted | |||
ASU 2016-02, Leases | This ASU creates ASU Topic 842, Leases, and supersedes Topic 840, Leases. The new guidance requires lessees to record a right-of-use asset and a corresponding liability equal to the present value of future rental payments on their balance sheets for all leases with a term greater than one year. There are not significant changes to lessor accounting; however, there are certain improvements made to align lessor accounting with the lessee accounting model and Topic 606, Revenue from Contracts with Customers. This guidance expands both quantitative and qualitative required disclosures. This ASU should be adopted on a modified retrospective basis. | January 1, 2019 | The Company is currently evaluating its operating lease arrangement under this ASU. Early indications suggest the Company will need to recognize right-of-use assets and lease liabilities for most of its operating lease commitments. |
ASU 2018-01, Leases (Topic 842) Land Easement Practical Expedient for Transition to Topic 842 | |||
11
Standard | Description | Required Date of Adoption | Effect on financial statements |
Standards Not Yet Adopted (continued) | |||
ASU 2016-13, Measurement of Credit Losses on Financial Instruments | This ASU amends Topic 326, Financial Instruments- Credit Losses to replace the current incurred loss accounting model with a current expected credit loss approach (CECL) for financial instruments measured at amortized cost and other commitments to extend credit. The amendments require entities to consider all available relevant information when estimating current expected credit losses, including details about past events, current conditions, and reasonable and supportable forecasts. The resulting allowance for credit losses is to reflect the portion of the amortized cost basis that the entity does not expect to collect. The amendments also eliminate the current accounting model for purchased credit impaired loans and debt securities. Additional quantitative and qualitative disclosures are required upon adoption. | January 1, 2020 | Adoption of this ASU is expected to primarily change how the Company estimates credit losses with the application of the expected credit loss model. In addition, the Company expects the ASU to change the presentation of credit losses for AFS debt securities through an allowance method rather than as a direct write-off. The Company is in the process of evaluating loan loss estimation models to comply with the guidance under this ASU, which may result in a higher credit loss estimate. |
While the CECL model does not apply to available for sale debt securities, the ASU does require entities to record an allowance when recognizing credit losses for AFS securities, rather than reduce the amortized cost of the securities by direct write-offs. | |||
The ASU should be adopted on a modified retrospective basis. Entities that have loans accounted for under ASC 310-30 at the time of adoption should prospectively apply the guidance in this amendment for purchase credit deteriorated assets. | |||
ASU 2017-04, Simplifying the Test for Goodwill Impairment | This ASU amends Topic 350, Intangibles-Goodwill and Other, and eliminates Step 2 from the goodwill impairment test. | January 1, 2020 | Adoption of this ASU is not expected to have a material impact on the Company's consolidated financial statements. |
Early adoption is permitted. | |||
ASU 2017-12, Targeted Improvements to Accounting for Hedging Activities | This ASU amends ASC 815, Derivatives and Hedging to (1) improve the transparency and understandability of information conveyed to financial statement users about an entity's risk management activities by better aligning the entity's financial reporting for hedging relationships with those risk management activities and (2) reduce the complexity of and simplify the application of hedge accounting by preparers. | January 1, 2019 | Adoption of this ASU is not expected to have a material impact on the Company's consolidated financial statements. |
TRANSITIONAL DISCLOSURES FOR RECENTLY ADOPTED ACCOUNTING PROUNOUNCEMENTS
Adoption of "ASC 606", Revenue from Contracts with Customers
The Company completed its overall assessment of revenue streams and review of related contracts potentially affected by the adoption, including trust and investment management fees, financial services fees, interchange fees, customer deposit fees, and other customer service fees. Based on this assessment, the Company concluded that Accounting Standards Codification ("ASC") 606 did not materially change the method in which the Company currently recognizes revenue for these revenue streams. The Company also completed its evaluation of certain costs related to these revenue streams to determine whether such costs should be presented as expenses or contra-revenue (i.e., gross vs. net). Based on its evaluation, the Company determined the classification of certain debit and credit card related costs should change (i.e., costs previously recorded as expense is now recorded as contra-revenue, and vice versa). These classification changes resulted in immaterial changes to both revenue and expense. These changes did not have a material effect to non-interest income or expense. Additionally, the Company reviewed deferred revenue from benefits received under various incentive contracts. The Company noted one contract was significantly impacted by the adoption, which the related financial impact and details are reflected in the tables below.
12
The Company adopted ASC 606 on January 1, 2018, using the modified retrospective method for all contracts not completed as of the date of adoption. For contracts that were modified before the effective date, the Company reflected the aggregate effect of all modifications when identifying performance obligations and allocating transaction price in accordance with practical expedient in paragraph ASC 606-10-65-1-(f)-(3), which did not have a material effect on the cumulative impact of adopting ASC 606. The reported results for 2018 reflect the application of ASC 606 guidance while the reported results for 2017 were prepared under the guidance of ASC 605, Revenue Recognition (ASC 605).
The adoption effected the Company's accounting for deferred revenue related to an upfront incentive received in connection with a co-branding agreement. The incentive, which was previously amortized over the life of the contract is now constrained by a termination penalty based on future customer transaction volume. As a result, the remaining deferred liability was re-established to its original value, which increased deferred tax assets by $57 thousand and reduced retained earnings by $184 thousand. Operating results during the first quarter were not effected.
Financial Statement Impact
The cumulative effect of the changes made to our consolidated January 1, 2018 balance sheet for the adoption were as follows:
(in thousands) | Balance at December 31, 2017 | Adjustments due to Topic 606 | Balance at January 1, 2018 | |||||||||
Balance Sheet | ||||||||||||
Other Assets | $ | 24,389 | $ | 57 | $ | 24,446 | ||||||
Other Liabilities | 28,737 | 241 | 28,978 | |||||||||
Retained Earnings | 144,977 | (184 | ) | 144,793 | ||||||||
The impact of the adoption on our consolidated March 31, 2018 balance sheet was as follows:
(in thousands) | As Reported | Balances Without Adoption of ASC 606 | Effect of Change Higher / (Lower) | |||||||||
Balance Sheet | ||||||||||||
Other Assets | $ | 29,793 | $ | 29,736 | $ | 57 | ||||||
Other Liabilities | 32,214 | 28,694 | 254 | |||||||||
Retained Earnings | 150,701 | 150,885 | (184 | ) | ||||||||
Disaggregation of Revenue
The following table disaggregates the Company’s revenue by major business line and timing of transfer of products or services:
Three Months Ended March 31, | ||||
(in thousands) | 2018 | |||
Major Products/Service Lines | ||||
Trust management fees | $ | 2,741 | ||
Financial services fees | 221 | |||
Interchange fees | 1,024 | |||
Customer deposit fees | 979 | |||
Other customer service fees | 221 | |||
Total | $ | 5,186 | ||
13
Three Months Ended March 31, | ||||
(in thousands) | 2018 | |||
Timing of Revenue Recognition | ||||
Products and services transferred at a point in time | $ | 2,351 | ||
Products and services transferred over time | 2,835 | |||
Total | $ | 5,186 | ||
Trust Management Fees
The trust management business generates revenue through a range of fiduciary services including trust and estate administration, wealth advisory, and investment management to individuals, businesses, not-for-profit organizations, and municipalities. Revenue from these services are generally recognized over time and is typically based on a time elapsed measure of progress. Certain fees, such as bill paying fees, distribution fees, real estate sale fees, and supplemental tax service fees, are recorded as revenue at a point in time upon the completion of the service.
Financial Services Fees
Bar Harbor Financial Services is a branch office of Infinex, an independent registered broker dealer offering securities and insurance products not affiliated with the Company or its subsidiaries. The Company has a revenue sharing agreement with Infinex for any financial service fee income generated. Financial services fees are recognized at a point in time upon the completion of monthly service requirements.
Interchange Fees
The Company earns interchange fees from transaction fees that merchants pay whenever a customer uses a debit card to make a purchase from their store. The fees are paid to the card-issuing bank to cover handling costs, fraud, bad debt costs and the risk involved in approving the payment. Interchange fees are generally recognized as revenue at a point in time upon the completion of a debit card transaction.
Customer Deposit Fees
The Customer Deposit business offers a variety of deposit accounts with a range of interest rates, fee schedules and other terms, which are designed to meet the customer's financial needs. Additional depositor related services provided to customers include ATM, bank-by-phone, internet banking, internet bill pay, mobile banking, and other cash management services which include remote deposit capture, ACH origination, and wire transfers. These customer deposit fees are generally recognized by the Company at a point in time upon the completion of the service.
Other Customer Service Fees
The Company has certain incentive and referral fee arrangements with independent third parties in which fees are earned for new account activity, product sales, or transaction volume generated for the respective third parties. The Company also earns a percentage of the fees generated from third party credit card plans promoted through the Bank. Revenue from these incentive and referral fee arrangements are recognized over time using the right to invoice measure of progress.
Transaction Price Allocated to Future Performance Obligations
ASC 606 requires the Company to disclose the aggregate amount of transaction price allocated to performance obligations that have not yet been satisfied as of March 31, 2018. The guidance provides certain practical expedients which limit this requirement and, therefore, the Company does not disclose the value of unsatisfied performance obligations for: (1) contracts with an original expected length of one year or less, (2) contracts for which revenue is recognized at the amount to which the Company has the right to invoice for services performed or (3) variable consideration allocated entirely to a wholly unsatisfied performance obligation for which consideration is allocated in accordance with paragraph 606-10-32-40. All revenue accounted for under the scope of ASC 606 meets one of these three criteria.
14
Contract Balances from Contracts with Customers
The following table provides information about receivables, contract assets, and contract liabilities from contracts with customers.
(in thousands) | Balance at March 31, 2018 | Balance at December 31, 2017 | ||||||
Balances from contracts with customers only: | ||||||||
Other Assets | $ | 4,175 | $ | 972 | ||||
Other Liabilities | 3,774 | 342 | ||||||
The timing of revenue recognition, billings and cash collections results in receivables, contract assets and contract liabilities on the consolidated balance sheets. For most customer contracts, fees are deducted directly from customer accounts and, therefore, there is no associated impact on the accounts receivable balance. For certain types of service contracts, the Company has an unconditional right to consideration under the service contract and an accounts receivable balance is recorded for services completed. When consideration is received, or such consideration is unconditionally due, from a customer prior to transferring goods or services to the customer under the terms of a contract, a contract liability is recorded. Contract liabilities are recognized as revenue after control of the products or services is transferred to the customer and all revenue recognition criteria have been met.
Costs to Obtain and Fulfill a Contract
The Company currently expenses contract costs for processing and administrative fees for debit card transactions. The Company also expenses custody fees and transactional costs associated with securities transactions as well as third party tax preparation fees. Due to the period being less than one year, the Company will apply the practical expedient in paragraph 340-40-25-4, whereby the Company recognizes the incremental costs of obtaining contracts as an expense when incurred if the amortization period of the assets the Company otherwise would have recognized is one year or less.
15
NOTE 2. SECURITIES AVAILABLE FOR SALE
The following is a summary of securities available for sale:
(in thousands) | Amortized Cost | Gross Unrealized Gains | Gross Unrealized Losses | Fair Value | ||||||||||||
March 31, 2018 | ||||||||||||||||
Securities available for sale | ||||||||||||||||
Debt securities: | ||||||||||||||||
Obligations of US Government sponsored enterprises | $ | 6,982 | $ | 1 | $ | 6 | $ | 6,977 | ||||||||
Mortgage-backed securities: | ||||||||||||||||
US Government-sponsored enterprises | 459,601 | 838 | 11,264 | 449,175 | ||||||||||||
US Government agency | 92,286 | 275 | 2,165 | 90,396 | ||||||||||||
Private label | 484 | 137 | 5 | 616 | ||||||||||||
Obligations of states and political subdivisions thereof | 136,244 | 1,079 | 2,046 | 135,277 | ||||||||||||
Corporate bonds | 36,405 | 161 | 448 | 36,118 | ||||||||||||
Total securities available for sale | $ | 732,002 | $ | 2,491 | $ | 15,934 | $ | 718,559 | ||||||||
December 31, 2017 | ||||||||||||||||
Securities available for sale | ||||||||||||||||
Debt securities: | ||||||||||||||||
Obligations of US Government sponsored enterprises | $ | 6,967 | $ | 5 | $ | — | $ | 6,972 | ||||||||
Mortgage-backed securities: | ||||||||||||||||
US Government-sponsored enterprises | 447,081 | 1,738 | 5,816 | 443,003 | ||||||||||||
US Government agency | 96,357 | 413 | 1,174 | 95,596 | ||||||||||||
Private label | 529 | 150 | 5 | 674 | ||||||||||||
Obligations of states and political subdivisions thereof | 138,522 | 2,407 | 729 | 140,200 | ||||||||||||
Corporate bonds | 30,527 | 323 | 53 | 30,797 | ||||||||||||
Total securities available for sale | $ | 719,983 | $ | 5,036 | $ | 7,777 | $ | 717,242 | ||||||||
The amortized cost and estimated fair value of available for sale (“AFS”) securities segregated by contractual maturity at March 31, 2018 are presented below. Expected maturities may differ from contractual maturities because issuers may have the right to call or prepay obligations. Mortgage-backed securities are shown in total, as their maturities are highly variable.
Available for sale | ||||||||
(in thousands) | Amortized Cost | Fair Value | ||||||
Within 1 year | $ | 7,012 | $ | 7,007 | ||||
Over 1 year to 5 years | 15,718 | 15,521 | ||||||
Over 5 years to 10 years | 46,614 | 46,574 | ||||||
Over 10 years | 110,287 | 109,270 | ||||||
Total bonds and obligations | 179,631 | 178,372 | ||||||
Mortgage-backed securities | 552,371 | 540,187 | ||||||
Total securities available for sale | $ | 732,002 | $ | 718,559 | ||||
16
Securities with unrealized losses, segregated by the duration of their continuous unrealized loss positions, are summarized as follows:
Less Than Twelve Months | Over Twelve Months | Total | ||||||||||||||||||||||
(In thousands) | Gross Unrealized Losses | Fair Value | Gross Unrealized Losses | Fair Value | Gross Unrealized Losses | Fair Value | ||||||||||||||||||
March 31, 2018 | ||||||||||||||||||||||||
Securities available for sale | ||||||||||||||||||||||||
Debt securities: | ||||||||||||||||||||||||
Obligations of US Government sponsored enterprises | $ | 6 | $ | 3,978 | $ | — | $ | — | $ | 6 | $ | 3,978 | ||||||||||||
Mortgage-backed securities: | ||||||||||||||||||||||||
US Government-sponsored enterprises | 5,388 | 267,678 | 5,876 | 117,825 | 11,264 | 385,503 | ||||||||||||||||||
US Government agency | 1,168 | 49,816 | 997 | 28,727 | 2,165 | 78,543 | ||||||||||||||||||
Private label | — | 1 | 5 | 56 | 5 | 57 | ||||||||||||||||||
Obligations of states and political subdivisions thereof | 475 | 39,618 | 1,571 | 26,759 | 2,046 | 66,377 | ||||||||||||||||||
Corporate bonds | 448 | 25,549 | — | — | 448 | 25,549 | ||||||||||||||||||
Total securities available for sale | $ | 7,485 | $ | 386,640 | $ | 8,449 | $ | 173,367 | $ | 15,934 | $ | 560,007 | ||||||||||||
December 31, 2017 | ||||||||||||||||||||||||
Securities available for sale | ||||||||||||||||||||||||
Debt securities: | ||||||||||||||||||||||||
Mortgage-backed securities: | ||||||||||||||||||||||||
US Government-sponsored enterprises | $ | 1,895 | $ | 189,486 | $ | 3,921 | $ | 117,156 | $ | 5,816 | $ | 306,642 | ||||||||||||
US Government agency | 559 | 45,221 | 615 | 30,155 | 1,174 | 75,376 | ||||||||||||||||||
Private label | — | 8 | 5 | 130 | 5 | 138 | ||||||||||||||||||
Obligations of states and political subdivisions thereof | 58 | 8,298 | 671 | 27,727 | 729 | 36,025 | ||||||||||||||||||
Corporate bonds | 53 | 8,943 | — | — | 53 | 8,943 | ||||||||||||||||||
Total securities available for sale | $ | 2,565 | $ | 251,956 | $ | 5,212 | $ | 175,168 | $ | 7,777 | $ | 427,124 | ||||||||||||
Securities Impairment: As a part of the Company’s ongoing security monitoring process, the Company identifies securities in an unrealized loss position that could potentially be other-than-temporarily impaired. For the three months ended March 31, 2018 and 2017 the Company did not record any other-than-temporary impairment (“OTTI”) losses.
Three Months Ended March 31, | |||||||
2018 | 2017 | ||||||
Estimated credit losses as of prior year end | $ | 1,697 | $ | 1,697 | |||
Reductions for securities paid off during the period | — | — | |||||
Estimated credit losses at end of the period | $ | 1,697 | $ | 1,697 | |||
For securities with unrealized losses, the following information was considered in determining that the impairments were not other-than-temporary:
The Company expects to recover its amortized cost basis on all debt securities in its AFS portfolio. Furthermore, the Company does not intend to sell nor does it anticipate that it will be required to sell any of its securities in an unrealized loss position as of March 31, 2018, prior to this recovery. The Company’s ability and intent to hold these securities until recovery is supported by the Company’s strong capital and liquidity positions as well as its historically low portfolio turnover.
17
The following summarizes, by investment security type, the basis for the conclusion for the debt securities in an unrealized loss position within the Company’s AFS were not other-than-temporarily impaired at March 31, 2018:
Obligations of US Government-sponsored enterprises
At March 31, 2018, 1 out of the total 2 securities in the Company’s portfolios of AFS US Government sponsored enterprises were in unrealized loss positions. Aggregate unrealized losses represented 0.1% of the amortized cost of securities in unrealized loss positions.The Federal National Mortgage Association (“FNMA”) and Federal Home Loan Mortgage Corporation (“FHLMC”) guarantee the contractual cash flows of all of the Company’s US government-sponsored enterprises. The securities are investment grade rated and there were no material underlying credit downgrades during the quarter. All securities are performing.
US Government-sponsored enterprises
At March 31, 2018, 455 out of the total 781 securities in the Company’s portfolios of AFS US Government sponsored enterprises were in unrealized loss positions. Aggregate unrealized losses represented 2.8% of the amortized cost of securities in unrealized loss positions.The FNMA and FHLMC guarantee the contractual cash flows of all of the Company’s US government-sponsored enterprises. The securities are investment grade rated and there were no material underlying credit downgrades during the quarter. All securities are performing.
US Government agency
At March 31, 2018, 117 out of the total 203 securities in the Company’s portfolios of AFS US Government agency securities were in unrealized loss positions. Aggregate unrealized losses represented 2.7% of the amortized cost of securities in unrealized loss positions. The Government National Mortgage Association (“GNMA”) guarantees the contractual cash flows of all of the Company’s US Government agency securities. The securities are investment grade rated and there were no material underlying credit downgrades during the quarter. All securities are performing.
Private label
At March 31, 2018, 6 of the total 26 securities in the Company’s portfolio of AFS private-label mortgage-backed securities were in unrealized loss positions. Aggregate unrealized losses represented 7.9% of the amortized cost of securities in unrealized loss positions. Based upon the foregoing considerations, and the expectation that the Company will receive all of the future contractual cash flows related to the amortized cost on these securities, the Company does not consider there to be any additional other-than-temporary impairment with respect to these securities.
Obligations of states and political subdivisions thereof
At March 31, 2018, 122 of the total 262 securities in the Company’s portfolio of AFS municipal bonds and obligations were in unrealized loss positions. Aggregate unrealized losses represented 3.0% of the amortized cost of securities in unrealized loss positions. The Company continually monitors the municipal bond sector of the market carefully and periodically evaluates the appropriate level of exposure to the market. At this time, the Company feels the bonds in this portfolio carry minimal risk of default and the Company is appropriately compensated for the risk. There were no material underlying credit downgrades during the quarter. All securities are performing.
Corporate bonds
At March 31, 2018, 9 out of the total 16 securities in the Company’s portfolio of AFS corporate bonds were in an unrealized loss position. The aggregate unrealized loss represents 1.7% of the amortized cost of bonds in unrealized loss positions. The Company reviews the financial strength of all of these bonds and has concluded that the amortized cost remains supported by the expected future cash flows of these securities.
18
Visa Class B Common Shares
The Company was a member of the Visa USA payment network and was issued Class B shares in connection with the Visa Reorganization and the Visa Inc. initial public offering in March 2008. The Visa Class B shares are transferable only under limited circumstances until they can be converted into shares of the publicly traded class of Visa stock. This conversion cannot happen until the settlement of certain litigation, which is indemnified by Visa members. Since its initial public offering, Visa has funded a litigation reserve based upon a change in the conversion ratio of Visa Class B shares into Visa Class A shares. At its discretion, Visa may continue to increase the conversion rate in connection with any settlements in excess of amounts then in escrow for that purpose and reduce the conversion rate to the extent it adds any funds to the escrow in the future. Based on the existing transfer restriction and the uncertainty of the litigation, the Company has recorded its Visa Class B shares on its statements of condition at zero value for all reporting periods since 2008. At March 31, 2018, the Company owned 11,623 of Visa Class B shares with a then current conversion ratio to Visa Class A shares of 1.648 (or 19,158 Visa Class A shares). Upon termination of the existing transfer restriction and settlement of the litigation, and to the extent the Company continues to own such Visa Class B shares in the future, the Company expects to record its Visa Class B shares at fair value.
19
NOTE 3. LOANS
The Company’s loan portfolio is comprised of the following segments: commercial real estate, commercial and industrial, residential real estate, and consumer loans. Commercial real estate loans includes commercial construction and land development and other commercial real estate loans. Commercial and industrial loans includes loans to commercial businesses, agricultural, and tax exempt loans. Residential real estate loans consists of mortgages for 1-4 family housing. Consumer loans include home equity loans and other installment lending.
The Company’s lending activities are principally conducted in Maine, New Hampshire, and Vermont.
Total loans include business activity loans and acquired loans. Acquired loans are those loans acquired from Lake Sunapee Bank Group. The following is a summary of total loans:
March 31, 2018 | December 31, 2017 | |||||||||||||||||||||||
(in thousands) | Business Activities Loans | Acquired Loans | Total | Business Activities Loans | Acquired Loans | Total | ||||||||||||||||||
Commercial Real Estate: | ||||||||||||||||||||||||
Construction and land development | $ | 31,073 | $ | 14,800 | $ | 45,873 | $ | 28,892 | $ | 16,781 | $ | 45,673 | ||||||||||||
Other commercial real estate | 512,093 | 266,755 | 778,848 | 505,119 | 275,954 | 781,073 | ||||||||||||||||||
Total Commercial Real Estate | 543,166 | 281,555 | 824,721 | 534,011 | 292,735 | 826,746 | ||||||||||||||||||
Commercial and Industrial: | ||||||||||||||||||||||||
Other Commercial | 210,304 | 65,198 | 275,502 | 198,051 | 68,069 | 266,120 | ||||||||||||||||||
Agricultural | 26,309 | — | 26,309 | 27,588 | — | 27,588 | ||||||||||||||||||
Tax exempt | 43,092 | 42,302 | 85,394 | 42,365 | 43,350 | 85,715 | ||||||||||||||||||
Total Commercial and Industrial | 279,705 | 107,500 | 387,205 | 268,004 | 111,419 | 379,423 | ||||||||||||||||||
Total Commercial Loans | 822,871 | 389,055 | 1,211,926 | 802,015 | 404,154 | 1,206,169 | ||||||||||||||||||
Residential Real Estate: | ||||||||||||||||||||||||
Residential mortgages | 588,465 | 544,512 | 1,132,977 | 591,411 | 564,271 | 1,155,682 | ||||||||||||||||||
Total Residential Real Estate | 588,465 | 544,512 | 1,132,977 | 591,411 | 564,271 | 1,155,682 | ||||||||||||||||||
Consumer: | ||||||||||||||||||||||||
Home equity | 52,100 | 57,766 | 109,866 | 51,376 | 62,217 | 113,593 | ||||||||||||||||||
Other consumer | 7,580 | 2,070 | 9,650 | 7,828 | 2,341 | 10,169 | ||||||||||||||||||
Total Consumer | 59,680 | 59,836 | 119,516 | 59,204 | 64,558 | 123,762 | ||||||||||||||||||
Total Loans | $ | 1,471,016 | $ | 993,403 | $ | 2,464,419 | $ | 1,452,630 | $ | 1,032,983 | $ | 2,485,613 | ||||||||||||
The carrying amount of the acquired loans at March 31, 2018 totaled $993.4 million. A subset of these loans was determined to have evidence of credit deterioration at acquisition date, which is accounted for in accordance with ASC 310-30. These purchased credit-impaired loans presently maintain a carrying value of $12.1 million (and a note balance of $16.6 million). These loans are evaluated for impairment through the periodic reforecasting of expected cash flows. Acquired loans considered not impaired at acquisition date had a carrying amount of $981.3 million as of March 31, 2018.
20
The following table summarizes activity in the accretable yield for the acquired loan portfolio that falls under the purview of ASC 310-30, Accounting for Certain Loans or Debt Securities Acquired in a Transfer:
Three Months Ended March 31, | ||||||||
(in thousands) | 2018 | 2017 | ||||||
Balance at beginning of period | $ | 3,509 | $ | — | ||||
Acquisitions | — | 3,398 | ||||||
Reclassification from nonaccretable difference for loans with improved cash flows | 199 | — | ||||||
Changes in expected cash flows that do not affect the nonaccretable difference | — | — | ||||||
Reclassification to troubled debt restructurings | — | — | ||||||
Accretion | (361 | ) | (204 | ) | ||||
Balance at end of period | $ | 3,347 | $ | 3,194 | ||||
The following is a summary of past due loans at March 31, 2018 and December 31, 2017:
Business Activities Loans
(in thousands) | 30-59 Days Past Due | 60-89 Days Past Due | 90 Days or Greater Past Due | Total Past Due | Current | Total Loans | Past Due > 90 days and Accruing | |||||||||||||||||||||
March 31, 2018 | ||||||||||||||||||||||||||||
Commercial Real Estate: | ||||||||||||||||||||||||||||
Construction and land development | $ | — | $ | 2 | $ | 566 | $ | 568 | $ | 30,505 | $ | 31,073 | $ | — | ||||||||||||||
Other commercial real estate | 1,008 | 158 | 6,656 | 7,822 | 504,271 | 512,093 | — | |||||||||||||||||||||
Total Commercial Real Estate | 1,008 | 160 | 7,222 | 8,390 | 534,776 | 543,166 | — | |||||||||||||||||||||
Commercial and Industrial: | ||||||||||||||||||||||||||||
Other Commercial | 829 | 12 | 506 | 1,347 | 208,957 | 210,304 | — | |||||||||||||||||||||
Agricultural | 39 | 88 | 101 | 228 | 26,081 | 26,309 | 2 | |||||||||||||||||||||
Tax exempt | — | — | — | — | 43,092 | 43,092 | — | |||||||||||||||||||||
Total Commercial and Industrial | 868 | 100 | 607 | 1,575 | 278,130 | 279,705 | 2 | |||||||||||||||||||||
Total Commercial Loans | 1,876 | 260 | 7,829 | 9,965 | 812,906 | 822,871 | 2 | |||||||||||||||||||||
Residential Real Estate: | ||||||||||||||||||||||||||||
Residential mortgages | 624 | 810 | 3,772 | 5,206 | 583,259 | 588,465 | — | |||||||||||||||||||||
Total Residential Real Estate | 624 | 810 | 3,772 | 5,206 | 583,259 | 588,465 | — | |||||||||||||||||||||
Consumer: | ||||||||||||||||||||||||||||
Home equity | 174 | 28 | 349 | 551 | 51,549 | 52,100 | — | |||||||||||||||||||||
Other consumer | 132 | 2 | — | 134 | 7,446 | 7,580 | — | |||||||||||||||||||||
Total Consumer | 306 | 30 | 349 | 685 | 58,995 | 59,680 | — | |||||||||||||||||||||
Total Loans | $ | 2,806 | $ | 1,100 | $ | 11,950 | $ | 15,856 | $ | 1,455,160 | $ | 1,471,016 | $ | 2 | ||||||||||||||
21
Business Activities Loans
(in thousands) | 30-59 Days Past Due | 60-89 Days Past Due | 90 Days or Greater Past Due | Total Past Due | Current | Total Loans | Past Due > 90 days and Accruing | |||||||||||||||||||||
December 31, 2017 | ||||||||||||||||||||||||||||
Commercial Real Estate: | ||||||||||||||||||||||||||||
Construction and land development | $ | — | $ | — | $ | 637 | $ | 637 | $ | 28,255 | $ | 28,892 | $ | — | ||||||||||||||
Other commercial real estate | 965 | 1,659 | 5,065 | 7,689 | 497,430 | 505,119 | 119 | |||||||||||||||||||||
Total Commercial Real Estate | 965 | 1,659 | 5,702 | 8,326 | 525,685 | 534,011 | 119 | |||||||||||||||||||||
Commercial and Industrial: | ||||||||||||||||||||||||||||
Other Commercial | 186 | 329 | 702 | 1,217 | 196,834 | 198,051 | 21 | |||||||||||||||||||||
Agricultural | 42 | 159 | 198 | 399 | 27,189 | 27,588 | 155 | |||||||||||||||||||||
Tax exempt | — | — | — | — | 42,365 | 42,365 | — | |||||||||||||||||||||
Total Commercial and Industrial | 228 | 488 | 900 | 1,616 | 266,388 | 268,004 | 176 | |||||||||||||||||||||
Total Commercial Loans | 1,193 | 2,147 | 6,602 | 9,942 | 792,073 | 802,015 | 295 | |||||||||||||||||||||
Residential Real Estate: | ||||||||||||||||||||||||||||
Residential mortgages | 3,096 | 711 | 975 | 4,782 | 586,629 | 591,411 | — | |||||||||||||||||||||
Total Residential Real Estate | 3,096 | 711 | 975 | 4,782 | 586,629 | 591,411 | — | |||||||||||||||||||||
Consumer: | ||||||||||||||||||||||||||||
Home equity | 515 | — | 199 | 714 | 50,662 | 51,376 | 199 | |||||||||||||||||||||
Other consumer | 36 | 24 | — | 60 | 7,768 | 7,828 | — | |||||||||||||||||||||
Total Consumer | 551 | 24 | 199 | 774 | 58,430 | 59,204 | 199 | |||||||||||||||||||||
Total Loans | $ | 4,840 | $ | 2,882 | $ | 7,776 | $ | 15,498 | $ | 1,437,132 | $ | 1,452,630 | $ | 494 | ||||||||||||||
22
Acquired Loans
(in thousands) | 30-59 Days Past Due | 60-89 Days Past Due | 90 Days or Greater Past Due | Total Past Due | Acquired Credit Impaired | Total Loans | Past Due > 90 days and Accruing | |||||||||||||||||||||
March 31, 2018 | ||||||||||||||||||||||||||||
Commercial Real Estate: | ||||||||||||||||||||||||||||
Construction and land development | $ | — | $ | — | $ | — | $ | — | $ | 260 | $ | 14,800 | $ | — | ||||||||||||||
Other commercial real estate | 411 | — | 305 | 716 | 8,350 | 266,755 | — | |||||||||||||||||||||
Total Commercial Real Estate | 411 | — | 305 | 716 | 8,610 | 281,555 | — | |||||||||||||||||||||
Commercial and Industrial: | ||||||||||||||||||||||||||||
Other Commercial | 208 | 97 | 148 | 453 | 459 | 65,198 | — | |||||||||||||||||||||
Agricultural | — | — | — | — | — | — | — | |||||||||||||||||||||
Tax exempt | — | — | — | — | — | 42,302 | — | |||||||||||||||||||||
Total Commercial and Industrial | 208 | 97 | 148 | 453 | 459 | 107,500 | — | |||||||||||||||||||||
Total Commercial Loans | 619 | 97 | 453 | 1,169 | 9,069 | 389,055 | — | |||||||||||||||||||||
Residential Real Estate: | ||||||||||||||||||||||||||||
Residential mortgages | 1,376 | 204 | 771 | 2,351 | 3,168 | 544,512 | — | |||||||||||||||||||||
Total Residential Real Estate | 1,376 | 204 | 771 | 2,351 | 3,168 | 544,512 | — | |||||||||||||||||||||
Consumer: | ||||||||||||||||||||||||||||
Home equity | 292 | 46 | 80 | 418 | 25 | 57,766 | — | |||||||||||||||||||||
Other consumer | 3 | — | — | 3 | 3 | 2,070 | — | |||||||||||||||||||||
Total Consumer | 295 | 46 | 80 | 421 | 28 | 59,836 | — | |||||||||||||||||||||
Total Loans | $ | 2,290 | $ | 347 | $ | 1,304 | $ | 3,941 | $ | 12,265 | $ | 993,403 | $ | — | ||||||||||||||
23
Acquired Loans
(in thousands) | 30-59 Days Past Due | 60-89 Days Past Due | 90 Days or Greater Past Due | Total Past Due | Acquired Credit Impaired | Total Loans | Past Due > 90 days and Accruing | |||||||||||||||||||||
December 31, 2017 | ||||||||||||||||||||||||||||
Commercial Real Estate: | ||||||||||||||||||||||||||||
Construction and land development | $ | 124 | $ | 9 | $ | — | $ | 133 | $ | 258 | $ | 16,781 | $ | — | ||||||||||||||
Other commercial real estate | 278 | — | 411 | 689 | 8,397 | 275,954 | — | |||||||||||||||||||||
Total Commercial Real Estate | 402 | 9 | 411 | 822 | 8,655 | 292,735 | — | |||||||||||||||||||||
Commercial and Industrial: | ||||||||||||||||||||||||||||
Other Commercial | 125 | 14 | 49 | 188 | 632 | 68,069 | — | |||||||||||||||||||||
Agricultural | — | — | — | — | — | — | — | |||||||||||||||||||||
Tax exempt | — | — | — | — | — | 43,350 | — | |||||||||||||||||||||
Total Commercial and Industrial | 125 | 14 | 49 | 188 | 632 | 111,419 | — | |||||||||||||||||||||
Total Commercial Loans | 527 | 23 | 460 | 1,010 | 9,287 | 404,154 | — | |||||||||||||||||||||
Residential Real Estate: | ||||||||||||||||||||||||||||
Residential mortgages | 752 | 388 | 614 | 1,754 | 3,259 | 564,271 | — | |||||||||||||||||||||
Total Residential Real Estate | 752 | 388 | 614 | 1,754 | 3,259 | 564,271 | — | |||||||||||||||||||||
Consumer: | ||||||||||||||||||||||||||||
Home equity | 125 | 117 | 80 | 322 | 38 | 62,217 | 16 | |||||||||||||||||||||
Other consumer | 2 | — | — | 2 | 3 | 2,341 | — | |||||||||||||||||||||
Total Consumer | 127 | 117 | 80 | 324 | 41 | 64,558 | 16 | |||||||||||||||||||||
Total Loans | $ | 1,406 | $ | 528 | $ | 1,154 | $ | 3,088 | $ | 12,587 | $ | 1,032,983 | $ | 16 | ||||||||||||||
24
Non-Accrual Loans
The following is summary information pertaining to non-accrual loans at March 31, 2018 and December 31, 2017:
March 31, 2018 | December 31, 2017 | |||||||||||||||||||||||
(in thousands) | Business Activities Loans | Acquired Loans | Total | Business Activities Loans | Acquired Loans | Total | ||||||||||||||||||
Commercial Real Estate: | ||||||||||||||||||||||||
Construction and land development | $ | 566 | $ | — | $ | 566 | $ | 637 | $ | — | $ | 637 | ||||||||||||
Other commercial real estate | 7,401 | 455 | 7,856 | 7,146 | 560 | 7,706 | ||||||||||||||||||
Total Commercial Real Estate | 7,967 | 455 | 8,422 | 7,783 | 560 | 8,343 | ||||||||||||||||||
Commercial and Industrial: | ||||||||||||||||||||||||
Other Commercial | 1,532 | 528 | 2,060 | 703 | 463 | 1,166 | ||||||||||||||||||
Agricultural | 244 | — | 244 | 43 | — | 43 | ||||||||||||||||||
Tax exempt | — | — | — | — | — | — | ||||||||||||||||||
Total Commercial and Industrial | 1,776 | 528 | 2,304 | 746 | 463 | 1,209 | ||||||||||||||||||
Total Commercial Loans | 9,743 | 983 | 10,726 | 8,529 | 1,023 | 9,552 | ||||||||||||||||||
Residential Real Estate: | ||||||||||||||||||||||||
Residential mortgages | 6,527 | 2,021 | 8,548 | 3,408 | 858 | 4,266 | ||||||||||||||||||
Total Residential Real Estate | 6,527 | 2,021 | 8,548 | 3,408 | 858 | 4,266 | ||||||||||||||||||
Consumer: | ||||||||||||||||||||||||
Home equity | 624 | 277 | 901 | 130 | 217 | 347 | ||||||||||||||||||
Other consumer | 109 | 55 | 164 | 95 | 58 | 153 | ||||||||||||||||||
Total Consumer | 733 | 332 | 1,065 | 225 | 275 | 500 | ||||||||||||||||||
Total Loans | $ | 17,003 | $ | 3,336 | $ | 20,339 | $ | 12,162 | $ | 2,156 | $ | 14,318 | ||||||||||||
25
Loans evaluated for impairment as of March 31, 2018 and December 31, 2017 were as follows:
Business Activities Loans
(in thousands) | Commercial real estate | Commercial and industrial | Residential real estate | Consumer | Total | |||||||||||||||
March 31, 2018 | ||||||||||||||||||||
Loans receivable: | ||||||||||||||||||||
Balance at end of period | ||||||||||||||||||||
Individually evaluated for impairment | $ | 7,641 | $ | 1,504 | $ | 4,386 | $ | 362 | $ | 13,893 | ||||||||||
Collectively evaluated | 535,525 | 278,201 | 584,079 | 59,318 | 1,457,123 | |||||||||||||||
Total | $ | 543,166 | $ | 279,705 | $ | 588,465 | $ | 59,680 | $ | 1,471,016 | ||||||||||
Business Activities Loans
(in thousands) | Commercial real estate | Commercial and industrial | Residential real estate | Consumer | Total | |||||||||||||||
December 31, 2017 | ||||||||||||||||||||
Loans receivable: | ||||||||||||||||||||
Balance at end of period | ||||||||||||||||||||
Individually evaluated for impairment | $ | 7,604 | $ | 626 | $ | 1,404 | $ | 13 | $ | 9,647 | ||||||||||
Collectively evaluated | 526,407 | 267,378 | 590,007 | 59,191 | 1,442,983 | |||||||||||||||
Total | $ | 534,011 | $ | 268,004 | $ | 591,411 | $ | 59,204 | $ | 1,452,630 | ||||||||||
Acquired Loans
(in thousands) | Commercial real estate | Commercial and industrial | Residential real estate | Consumer | Total | |||||||||||||||
March 31, 2018 | ||||||||||||||||||||
Loans receivable: | ||||||||||||||||||||
Balance at end of period | ||||||||||||||||||||
Individually evaluated for impairment | $ | 133 | $ | 598 | $ | 503 | $ | — | $ | 1,234 | ||||||||||
Purchased Credit Impaired | 8,610 | 459 | 3,168 | 28 | 12,265 | |||||||||||||||
Collectively evaluated | 272,812 | 106,443 | 540,841 | 59,808 | 979,904 | |||||||||||||||
Total | $ | 281,555 | $ | 107,500 | $ | 544,512 | $ | 59,836 | $ | 993,403 | ||||||||||
Acquired Loans
(in thousands) | Commercial real estate | Commercial and industrial | Residential real estate | Consumer | Total | |||||||||||||||
December 31, 2017 | ||||||||||||||||||||
Loans receivable: | ||||||||||||||||||||
Balance at end of period | ||||||||||||||||||||
Individually evaluated for impairment | $ | 241 | $ | 571 | $ | 271 | $ | 63 | $ | 1,146 | ||||||||||
Purchased Credit Impaired | 8,655 | 632 | 3,259 | 41 | 12,587 | |||||||||||||||
Collectively evaluated | 283,839 | 110,216 | 560,741 | 64,454 | 1,019,250 | |||||||||||||||
Total | $ | 292,735 | $ | 111,419 | $ | 564,271 | $ | 64,558 | $ | 1,032,983 | ||||||||||
26
The following is a summary of impaired loans at March 31, 2018 and December 31, 2017:
Business Activities Loans
March 31, 2018 | ||||||||||||
(in thousands) | Recorded Investment | Unpaid Principal Balance | Related Allowance | |||||||||
With no related allowance: | ||||||||||||
Construction and land development | $ | 566 | $ | 2,491 | $ | — | ||||||
Commercial real estate other | 5,933 | 5,944 | — | |||||||||
Commercial other | 962 | 966 | — | |||||||||
Agricultural | — | — | — | |||||||||
Tax exempt loans | — | — | — | |||||||||
Residential real estate | 3,586 | 3,603 | — | |||||||||
Home equity | 362 | 463 | — | |||||||||
Consumer other | — | — | — | |||||||||
With an allowance recorded: | ||||||||||||
Construction and land development | $ | — | $ | — | $ | — | ||||||
Commercial real estate other | 1,142 | 1,204 | 433 | |||||||||
Commercial other | 542 | 544 | 132 | |||||||||
Agricultural | — | — | — | |||||||||
Tax exempt loans | — | — | — | |||||||||
Residential real estate | 800 | 801 | 84 | |||||||||
Home equity | — | — | — | |||||||||
Consumer other | — | — | — | |||||||||
Total | ||||||||||||
Commercial real estate | $ | 7,641 | $ | 9,639 | $ | 433 | ||||||
Commercial and industrial | 1,504 | 1,510 | 132 | |||||||||
Residential real estate | 4,386 | 4,404 | 84 | |||||||||
Consumer | 362 | 463 | — | |||||||||
Total impaired loans | $ | 13,893 | $ | 16,016 | $ | 649 | ||||||
27
Acquired Loans
March 31, 2018 | ||||||||||||
(in thousands) | Recorded Investment | Unpaid Principal Balance | Related Allowance | |||||||||
With no related allowance: | ||||||||||||
Construction and land development | $ | — | $ | — | $ | — | ||||||
Commercial real estate other | 133 | 245 | — | |||||||||
Commercial other | 176 | 175 | — | |||||||||
Agricultural | — | — | — | |||||||||
Tax exempt loans | — | — | — | |||||||||
Residential real estate | 503 | 507 | — | |||||||||
Home equity | — | — | — | |||||||||
Consumer other | — | — | — | |||||||||
With an allowance recorded: | ||||||||||||
Construction and land development | $ | — | $ | — | $ | — | ||||||
Commercial real estate other | — | — | — | |||||||||
Commercial other | 422 | 436 | 121 | |||||||||
Agricultural | — | — | — | |||||||||
Tax exempt loans | — | — | — | |||||||||
Residential real estate | — | — | — | |||||||||
Home equity | — | — | — | |||||||||
Consumer other | — | — | — | |||||||||
Total | ||||||||||||
Commercial real estate | $ | 133 | $ | 245 | $ | — | ||||||
Commercial and industrial | 598 | 611 | 121 | |||||||||
Residential real estate | 503 | 507 | — | |||||||||
Consumer | — | — | — | |||||||||
Total impaired loans | $ | 1,234 | $ | 1,363 | $ | 121 | ||||||
28
Business Activities Loans
December 31, 2017 | ||||||||||||
(in thousands) | Recorded Investment | Unpaid Principal Balance | Related Allowance | |||||||||
With no related allowance: | ||||||||||||
Construction and land development | $ | — | $ | — | $ | — | ||||||
Commercial real estate other | 5,896 | 5,903 | — | |||||||||
Commercial other | 218 | 217 | — | |||||||||
Agricultural | — | — | — | |||||||||
Tax exempt loans | — | — | — | |||||||||
Residential real estate | 1,247 | 1,260 | — | |||||||||
Home equity | 13 | 13 | — | |||||||||
Consumer other | — | — | — | |||||||||
With an allowance recorded: | ||||||||||||
Construction and land development | $ | 637 | $ | 2,563 | $ | 59 | ||||||
Commercial real estate other | 1,071 | 1,132 | 388 | |||||||||
Commercial other | 408 | 408 | 3 | |||||||||
Agricultural | — | — | — | |||||||||
Tax exempt loans | — | — | — | |||||||||
Residential real estate | 157 | 157 | 9 | |||||||||
Home equity | — | — | — | |||||||||
Consumer other | — | — | — | |||||||||
Total | ||||||||||||
Commercial real estate | $ | 7,604 | $ | 9,598 | $ | 447 | ||||||
Commercial and industrial | 626 | 625 | 3 | |||||||||
Residential real estate | 1,404 | 1,417 | 9 | |||||||||
Consumer | 13 | 13 | — | |||||||||
Total impaired loans | $ | 9,647 | $ | 11,653 | $ | 459 | ||||||
29
Acquired Loans
December 31, 2017 | ||||||||||||
(in thousands) | Recorded Investment | Unpaid Principal Balance | Related Allowance | |||||||||
With no related allowance: | ||||||||||||
Construction and land development | $ | — | $ | — | $ | — | ||||||
Other commercial real estate | 241 | 352 | — | |||||||||
Other commercial | 571 | 584 | — | |||||||||
Agricultural | — | — | — | |||||||||
Tax exempt | — | — | — | |||||||||
Residential mortgages | 271 | 278 | — | |||||||||
Home equity | 63 | 156 | — | |||||||||
Other consumer | — | — | — | |||||||||
With an allowance recorded: | ||||||||||||
Construction and land development | $ | — | $ | — | $ | — | ||||||
Other commercial real estate | — | — | — | |||||||||
Other commercial | — | — | — | |||||||||
Agricultural | — | — | — | |||||||||
Tax exempt | — | — | — | |||||||||
Residential mortgages | — | — | — | |||||||||
Home equity | — | — | — | |||||||||
Other consumer | — | — | — | |||||||||
Total | ||||||||||||
Commercial real estate | $ | 241 | $ | 352 | $ | — | ||||||
Commercial and industrial | 571 | 584 | — | |||||||||
Residential real estate | 271 | 278 | — | |||||||||
Consumer | 63 | 156 | — | |||||||||
Total impaired loans | $ | 1,146 | $ | 1,370 | $ | — | ||||||
30
The following is a summary of the average recorded investment and interest income recognized on impaired loans as of March 31, 2018 and 2017:
Business Activities Loans
Three Months Ended March 31, 2018 | Three Months Ended March 31, 2017 | |||||||||||||||
(in thousands) | Average Recorded Investment | Cash Basis Interest Income Recognized | Average Recorded Investment | Cash Basis Interest Income Recognized | ||||||||||||
With no related allowance: | ||||||||||||||||
Construction and land development | $ | 589 | $ | — | $ | — | $ | — | ||||||||
Commercial real estate other | 5,937 | — | 2,592 | 34 | ||||||||||||
Commercial other | 1,334 | — | 226 | 3 | ||||||||||||
Agricultural | — | — | 192 | 2 | ||||||||||||
Tax exempt loans | — | — | — | — | ||||||||||||
Residential real estate | 3,591 | — | 1,500 | 22 | ||||||||||||
Home equity | 444 | — | 590 | — | ||||||||||||
Consumer other | — | — | 44 | 1 | ||||||||||||
With an allowance recorded: | ||||||||||||||||
Construction and land development | $ | — | $ | — | $ | — | $ | — | ||||||||
Commercial real estate other | 1,144 | — | 1,723 | — | ||||||||||||
Commercial other | 187 | — | 216 | — | ||||||||||||
Agricultural | — | — | — | — | ||||||||||||
Tax exempt loans | — | — | — | — | ||||||||||||
Residential real estate | 802 | — | 321 | — | ||||||||||||
Home equity | — | — | — | — | ||||||||||||
Consumer other | — | — | 9 | — | ||||||||||||
Total | ||||||||||||||||
Commercial real estate | $ | 7,670 | $ | — | $ | 4,315 | $ | 34 | ||||||||
Commercial and industrial | 1,521 | — | 634 | 5 | ||||||||||||
Residential real estate | 4,393 | — | 1,821 | 22 | ||||||||||||
Consumer | 444 | — | 643 | 1 | ||||||||||||
Total impaired loans | $ | 14,028 | $ | — | $ | 7,413 | $ | 62 | ||||||||
31
Acquired Loans
Three Months Ended March 31, 2018 | Three Months Ended March 31, 2017 | |||||||||||||||
(in thousands) | Average Recorded Investment | Cash Basis Interest Income Recognized | Average Recorded Investment | Cash Basis Interest Income Recognized | ||||||||||||
With no related allowance: | ||||||||||||||||
Construction and land development | $ | — | $ | — | $ | — | $ | — | ||||||||
Commercial real estate other | 133 | — | — | — | ||||||||||||
Commercial other | 161 | 1 | — | — | ||||||||||||
Agricultural | — | — | — | — | ||||||||||||
Tax exempt loans | — | — | — | — | ||||||||||||
Residential real estate | 508 | — | — | — | ||||||||||||
Home equity | — | — | — | — | ||||||||||||
Consumer other | — | — | — | — | ||||||||||||
With an allowance recorded: | ||||||||||||||||
Construction and land development | $ | — | $ | — | $ | — | $ | — | ||||||||
Commercial real estate other | — | — | — | — | ||||||||||||
Commercial other | 434 | — | — | — | ||||||||||||
Agricultural | — | — | — | — | ||||||||||||
Tax exempt loans | — | — | — | — | ||||||||||||
Residential real estate | — | — | — | — | ||||||||||||
Home equity | — | — | — | — | ||||||||||||
Consumer other | — | — | — | — | ||||||||||||
Total | ||||||||||||||||
Commercial real estate | $ | 133 | $ | — | $ | — | $ | — | ||||||||
Commercial and industrial | 595 | 1 | — | — | ||||||||||||
Residential real estate | 508 | — | — | — | ||||||||||||
Consumer | — | — | — | — | ||||||||||||
Total impaired loans | $ | 1,236 | $ | 1 | $ | — | $ | — | ||||||||
Troubled Debt Restructuring Loans
The Company’s loan portfolio also includes certain loans that have been modified in a Troubled Debt Restructuring ("TDR"), where economic concessions have been granted to borrowers who have experienced or are expected to experience financial difficulties. These concessions typically result from the Company’s loss mitigation activities and could include reductions in the interest rate, payment extensions, forgiveness of principal, forbearance, or other actions. Certain TDRs are classified as nonperforming at the time of restructure and may only be returned to performing status after considering the borrower’s sustained repayment performance for a reasonable period, generally six months. TDRs are evaluated individually for impairment and may result in a specific allowance amount allocated to an individual loan.
32
The following tables include the recorded investment and number of modifications identified during the three months ended March 31, 2018 and for the three months ended March 31, 2017, respectively. The table includes the recorded investment in the loans prior to a modification and also the recorded investment in the loans after the loans were restructured. The modifications for the three months ended March 31, 2018 were attributable to interest rate concessions, maturity date extensions, reamortization or a combination of two concessions. The modifications for the three months ending March 31, 2017 were attributable to interest rate concessions, maturity date extensions, or a combination of both.
Three Months Ended March 31, 2018 | |||||||||||
(Dollars in thousands) | Number of Modifications | Pre-Modification Outstanding Recorded Investment | Post-Modification Outstanding Recorded Investment | ||||||||
Troubled Debt Restructurings | |||||||||||
Commercial installment | 2 | $ | 452 | $ | 448 | ||||||
Agricultural | 1 | 2 | 2 | ||||||||
Commercial real estate | 1 | 167 | — | ||||||||
Residential real estate | 5 | 1,105 | 1,099 | ||||||||
Consumer other | 1 | 1 | 1 | ||||||||
Total | 10 | $ | 1,727 | $ | 1,550 | ||||||
Three Months Ended March 31, 2017 | |||||||||||
(Dollars in thousands) | Number of Modifications | Pre-Modification Outstanding Recorded Investment | Post-Modification Outstanding Recorded Investment | ||||||||
Troubled Debt Restructurings | |||||||||||
Commercial installment | 1 | $ | 80 | $ | 80 | ||||||
Residential real estate | 2 | 575 | 574 | ||||||||
Consumer other | 1 | 38 | 37 | ||||||||
Total | 4 | $ | 693 | $ | 691 | ||||||
For the three months ended March 31, 2018, there were no loans restructured that had subsequently defaulted during the period.
The evaluation of certain loans individually for specific impairment includes loans that were previously classified as TDRs or continue to be classified as TDRs.
Foreclosure
As of March 31, 2018, the Company maintained foreclosed residential real estate property with a fair value of $216 thousand. Additionally, residential mortgage loans collateralized by real estate property that are in the process of foreclosure as of March 31, 2018 and December 31, 2017 totaled $1.6 million and $843 thousand, respectively. As of December 31, 2017, foreclosed residential real estate property totaled $122 thousand.
Mortgage Banking
Total residential loans included held for sale loans of $4.8 million and $13.4 million at March 31, 2018 and December 31, 2017, respectively.
33
NOTE 4. LOAN LOSS ALLOWANCE
The allowance for loan losses is maintained at a level considered adequate to provide for our estimate of probable credit losses inherent in the loan portfolio. The allowance is increased by provisions charged to operating expense and reduced by net charge-offs. Loans are charged against the allowance for loan losses when we believe that collectability is unlikely. While we use the best information available to make our evaluation, future adjustments may be necessary if there are significant changes in conditions.
The allowance is comprised of four distinct reserve components: (1) specific reserves related to loans individually evaluated, (2) quantitative reserves related to loans collectively evaluated (3) qualitative reserves related to loans collectively evaluated and (4) a temporal estimate is made for incurred loss emergence period for each loan category within the collectively evaluated pools.
A summary of the methodology we employ on a quarterly basis with respect to each of these components in order to evaluate the overall adequacy of our allowance for loan losses is as follows:
Specific Reserve for Loans Individually Evaluated
First, we identify loan relationships having aggregate balances in excess of $150 thousand and that may also have credit weaknesses. Such loan relationships are identified primarily through our analysis of internal loan evaluations, past due loan reports and loans adversely classified internally or by regulatory authorities. Each loan so identified is then individually evaluated for impairment. Loans are considered impaired when, based on current information and events, it is probable that the Bank will be unable to collect all amounts due according to the contractual terms of the original loan agreement. Substantially all of our impaired loans have historically been collateral dependent, meaning repayment of the loan is expected or is considered to be provided solely from the sale of the loan's underlying collateral. For such loans, we measure impairment based on the fair value of the loan's collateral, which is generally determined utilizing current appraisals. A specific reserve is established in an amount equal to the excess, if any, of the recorded investment in each impaired loan over the fair value of its underlying collateral, less estimated costs to sell. Our policy is to re-evaluate the fair value of collateral dependent loans at least every twelve months unless there is a known deterioration in the collateral's value, in which case a new appraisal is obtained.
Purchase credit impaired (“PCI”) loans are collectively evaluated, but are not included in the general reserve as described below. The evaluation of the PCI loans requires continued quarterly assessment of key assumptions and estimates similar to the initial fair value estimate, including changes in the severity of loss, timing and speed of payments, collateral value changes, expected cash flows and other relevant factors. The quarterly assessment is compared to the initial fair value estimate and a determination is made if an adjustment to the allowance for loan loss is deemed necessary.
Quantitative Reserve for Loans Collectively Evaluated
Second, we stratify the loan portfolio into two general business loan pools: substandard (7 risk rated) and pass-rated (0 to 6 rated) by loan type. Substandard rated loans are subject to higher credit loss rates in the allowance for loan loss calculation. The Company utilizes historical loss rates for commercial real estate and commercial and industrial loans assessed by internal risk rating. Historical loss rates on residential real estate and consumer loans are not risk graded. Residential real estate and consumer loans are considered as part of the pass-rated portfolio unless removed due to specific reserve evaluation based on past due status and/or other indications of credit deterioration. Quantitative reserves relative to each loan pool are established as follows: for all loan segments an allocation equaling 100% of the respective pool's average 3-year historical net loan charge-off rate (determined based upon the most recent 12 quarters) is applied to the aggregate recorded investment in the pool of loans. Purchased performing loans are collectively evaluated as their own separate category within each loan pool.
34
Qualitative Reserve for Loans Collectively Evaluated
Third, we consider the necessity to adjust our average historical net loan charge-off rates relative to each of the above two loan pools for potential risks factors that could result in actual losses deviating from prior loss experience. Such qualitative risk factors considered are: (1) lending policies and procedures, (2) business conditions, (3) volume and nature of the loan portfolio, (4) experience, ability and depth of lending management, (5) problem loan trends, (6) quality of the Bank’s loan review system, (7) concentrations in the portfolio, (8) competition, legal, and regulatory environment and (9) collateral coverage and loan-to-value.
Loss Emergence Period for Loans Collectively Evaluated
Fourth, the general allowance related to loans collectively evaluated includes an estimate of incurred losses over an estimated loss emergence period ("LEP"). The LEP was generated utilizing a charge-off look-back analysis, which studied the time from the first indication of elevated risk of repayment (or other early event indicating a problem) to eventual charge-off to support the LEP considered in the allowance calculation. This reserving methodology established the approximate number of months of LEP that represents incurred losses for each loan portfolio within each portfolio segment in addition to the qualitative reserves.
Activity in the allowance for loan losses for the three months ended March 31, 2018 and 2017 was as follows:
Business Activities Loans | At or for the Three Months Ended March 31, 2018 | |||||||||||||||||||
(in thousands) | Commercial real estate | Commercial and industrial | Residential real estate | Consumer | Total | |||||||||||||||
Balance at beginning of period | $ | 6,037 | $ | 2,373 | $ | 3,357 | $ | 386 | $ | 12,153 | ||||||||||
Charged-off loans | — | (84 | ) | — | (170 | ) | (254 | ) | ||||||||||||
Recoveries on charged-off loans | 15 | 2 | 1 | 2 | 20 | |||||||||||||||
Provision/(releases) for loan losses | (54 | ) | 321 | (54 | ) | 282 | 495 | |||||||||||||
Balance at end of period | $ | 5,998 | $ | 2,612 | $ | 3,304 | $ | 500 | $ | 12,414 | ||||||||||
Individually evaluated for impairment | 433 | 132 | 84 | — | 649 | |||||||||||||||
Collectively evaluated | 5,565 | 2,480 | 3,220 | 500 | 11,765 | |||||||||||||||
Total | $ | 5,998 | $ | 2,612 | $ | 3,304 | $ | 500 | $ | 12,414 | ||||||||||
Business Activities Loans | At or for the Three Months Ended March 31, 2017 | |||||||||||||||||||
(in thousands) | Commercial real estate | Commercial and industrial | Residential real estate | Consumer | Total | |||||||||||||||
Balance at beginning of period | $ | 5,145 | $ | 1,952 | $ | 2,721 | $ | 601 | $ | 10,419 | ||||||||||
Charged-off loans | (107 | ) | (17 | ) | (199 | ) | (21 | ) | (344 | ) | ||||||||||
Recoveries on charged-off loans | 4 | — | 1 | 9 | 14 | |||||||||||||||
Provision/(releases) for loan losses | 265 | 208 | 283 | 39 | 795 | |||||||||||||||
Balance at end of period | $ | 5,307 | $ | 2,143 | $ | 2,806 | $ | 628 | $ | 10,884 | ||||||||||
Individually evaluated for impairment | 302 | 172 | 45 | 8 | 527 | |||||||||||||||
Collectively evaluated | 5,005 | 1,971 | 2,761 | 620 | 10,357 | |||||||||||||||
Total | $ | 5,307 | $ | 2,143 | $ | 2,806 | $ | 628 | $ | 10,884 | ||||||||||
35
Acquired Loans | At or for the Three Months Ended March 31, 2018 | |||||||||||||||||||
(in thousands) | Commercial real estate | Commercial and industrial | Residential real estate | Consumer | Total | |||||||||||||||
Balance at beginning of period | $ | 97 | $ | 16 | $ | 59 | $ | — | $ | 172 | ||||||||||
Charged-off loans | (106 | ) | (58 | ) | — | (43 | ) | (207 | ) | |||||||||||
Recoveries on charged-off loans | — | — | — | — | — | |||||||||||||||
Provision/(releases) for loan losses | 92 | 166 | (1 | ) | 43 | 300 | ||||||||||||||
Balance at end of period | $ | 83 | $ | 124 | $ | 58 | $ | — | $ | 265 | ||||||||||
Individually evaluated for impairment | — | 121 | — | — | 121 | |||||||||||||||
Collectively evaluated | 83 | 3 | 58 | — | 144 | |||||||||||||||
Total | $ | 83 | $ | 124 | $ | 58 | $ | — | $ | 265 | ||||||||||
There was no allowance for loans meeting the definition of acquired for the three month period ending March 31, 2017.
Loan Origination/Risk Management: The Bank has certain lending policies and procedures in place are designed to maximize loan income within an acceptable level of risk. The Bank’s Board of Directors reviews and approves these policies and procedures on a regular basis. A reporting system supplements the review process by providing management and the Bank's Board of Directors with frequent reports related to loan production, loan quality, concentrations of credit, loan delinquencies and non-performing loans and potential problem loans. The Bank seeks to diversify the loan portfolio as a means of managing risk associated with fluctuations in economic conditions.
Credit Quality Indicators/Classified Loans: In monitoring the credit quality of the portfolio, management applies a credit quality indicator and uses an internal risk rating system to categorize commercial loans. These credit quality indicators range from one through nine, with a higher number correlating to increasing risk of loss. These ratings are used as inputs to the calculation of the allowance for loan losses. Consistent with regulatory guidelines, the Bank provides for the classification of loans which are considered to be of lesser quality as special mention, substandard, doubtful, or loss (i.e. risk rated 6, 7, 8 and 9, respectively).
The following are the definitions of the Bank’s credit quality indicators:
Pass: Loans within all classes of commercial portfolio segments that are not adversely rated, are contractually current as to principal and interest, and are otherwise in compliance with the contractual terms of the loan agreement. Management believes there is a low risk of loss related to these loans considered pass rated.
Special mention: Loans that do not expose the Bank to risk sufficient to warrant classification in one of the subsequent categories, but which possess some weaknesses, are designated as special mention. A special mention loan has potential weaknesses that deserve management’s close attention. If left uncorrected, these potential weaknesses may result in deterioration of the repayment prospects for the asset or in the institution’s credit position at some future date. This might include loans which the lending officer may be unable to supervise properly because of: (i) lack of expertise, inadequate loan agreement; (ii) the poor condition of or lack of control over collateral; or (iii) failure to obtain proper documentation or any other deviations from prudent lending practices. Economic or market conditions which may, in the future, affect the obligor may warrant special mention of the asset. Loans for which an adverse trend in the borrower's operations or an imbalanced position in the balance sheet which has not reached a point where the liquidation is jeopardized may be included in this classification. Special mention loans are not adversely classified and do not expose the Bank to sufficient risks to warrant classification.
Substandard: The Bank considers a loan substandard if it is inadequately protected by the current net worth and paying capacity of the borrower or of the collateral pledged, if any. Substandard loans have a well-defined weakness that jeopardizes liquidation of the debt. Substandard loans include those loans where there is the distinct possibility of some loss of principal, if the deficiencies are not corrected.
36
Doubtful: Loans the Bank classifies as doubtful have all of the weaknesses inherent in those loans that are classified as substandard.These loans have the added characteristic of the weaknesses present make collection or liquidation in full, on the basis of currently existing facts, conditions, and values, highly questionable and improbable. The possibility of loss is high but because of certain important and reasonably specific pending factors which may work to the advantage and strengthening of the loan, its classification as loss is deferred until its more exact status is determined. Pending factors include proposed merger, acquisition, or liquidation procedures, capital injection, perfecting liens on additional collateral and refinancing plans. The entire amount of the loan might not be classified as doubtful when collection of a specific portion appears highly probable. Loans are generally not classified doubtful for an extended period of time (i.e., over a year).
Loss: Loans the Bank classifies as losses are those considered uncollectible and of such little value that their continuance as an asset is not warranted and the uncollectible amounts are charged-off. This classification does not mean the asset has absolutely no recovery or salvage value, but rather it is not practical or desirable to defer writing off this worthless asset even though partial recovery may be affected in the future. Losses are taken in the period in which they are determined to be uncollectible.
The following tables present the Company’s loans by risk rating at March 31, 2018 and December 31, 2017:
Business Activities Loans
Commercial Real Estate
Credit Risk Profile by Creditworthiness Category
Construction and land development | Commercial real estate other | Total commercial real estate | ||||||||||||||||||||||
(in thousands) | Mar 31, 2018 | Dec 31, 2017 | Mar 31, 2018 | Dec 31, 2017 | Mar 31, 2018 | Dec 31, 2017 | ||||||||||||||||||
Grade: | ||||||||||||||||||||||||
Pass | $ | 30,433 | $ | 28,180 | $ | 489,702 | $ | 483,711 | $ | 520,135 | $ | 511,891 | ||||||||||||
Special mention | 73 | 73 | 7,740 | 5,706 | 7,813 | 5,779 | ||||||||||||||||||
Substandard | 567 | 639 | 14,651 | 15,702 | 15,218 | 16,341 | ||||||||||||||||||
Total | $ | 31,073 | $ | 28,892 | $ | 512,093 | $ | 505,119 | $ | 543,166 | $ | 534,011 | ||||||||||||
Commercial and Industrial
Credit Risk Profile by Creditworthiness Category
Commercial other | Agricultural | Tax exempt loans | Total commercial and industrial | |||||||||||||||||||||||||||||
(in thousands) | Mar 31, 2018 | Dec 31, 2017 | Mar 31, 2018 | Dec 31, 2017 | Mar 31, 2018 | Dec 31, 2017 | Mar 31, 2018 | Dec 31, 2017 | ||||||||||||||||||||||||
Grade: | ||||||||||||||||||||||||||||||||
Pass | $ | 206,217 | $ | 194,147 | $ | 25,700 | $ | 27,046 | $ | 42,935 | $ | 42,208 | $ | 274,852 | $ | 263,401 | ||||||||||||||||
Special mention | 2,115 | 1,933 | 68 | 63 | 157 | 157 | 2,340 | 2,153 | ||||||||||||||||||||||||
Substandard | 1,972 | 1,971 | 541 | 479 | — | — | 2,513 | 2,450 | ||||||||||||||||||||||||
Total | $ | 210,304 | $ | 198,051 | $ | 26,309 | $ | 27,588 | $ | 43,092 | $ | 42,365 | $ | 279,705 | $ | 268,004 | ||||||||||||||||
Residential Real Estate and Consumer Loans
Credit Risk Profile Based on Payment Activity
Residential real estate | Home equity | Other consumer | Total Residential real estate and consumer | |||||||||||||||||||||||||||||
(in thousands) | Mar 31, 2018 | Dec 31, 2017 | Mar 31, 2018 | Dec 31, 2017 | Mar 31, 2018 | Dec 31, 2017 | Mar 31, 2018 | Dec 31, 2017 | ||||||||||||||||||||||||
Performing | $ | 581,938 | $ | 588,003 | $ | 51,476 | $ | 51,246 | $ | 7,471 | $ | 7,733 | $ | 640,885 | $ | 646,982 | ||||||||||||||||
Nonperforming | 6,527 | 3,408 | 624 | 130 | 109 | 95 | 7,260 | 3,633 | ||||||||||||||||||||||||
Total | $ | 588,465 | $ | 591,411 | $ | 52,100 | $ | 51,376 | $ | 7,580 | $ | 7,828 | $ | 648,145 | $ | 650,615 | ||||||||||||||||
37
Acquired Loans
Commercial Real Estate
Credit Risk Profile by Creditworthiness Category
Commercial construction and land development | Commercial real estate other | Total commercial real estate | ||||||||||||||||||||||
(in thousands) | Mar 31, 2018 | Dec 31, 2017 | Mar 31, 2018 | Dec 31, 2017 | Mar 31, 2018 | Dec 31, 2017 | ||||||||||||||||||
Grade: | ||||||||||||||||||||||||
Pass | $ | 14,436 | $ | 16,523 | $ | 256,806 | $ | 266,477 | $ | 271,242 | $ | 283,000 | ||||||||||||
Special mention | 81 | 235 | 2,543 | 2,440 | 2,624 | 2,675 | ||||||||||||||||||
Substandard | 283 | 23 | 7,406 | 7,037 | 7,689 | 7,060 | ||||||||||||||||||
Total | $ | 14,800 | $ | 16,781 | $ | 266,755 | $ | 275,954 | $ | 281,555 | $ | 292,735 | ||||||||||||
Commercial and Industrial
Credit Risk Profile by Creditworthiness Category
Commercial other | Agricultural | Tax exempt loans | Total commercial and industrial | |||||||||||||||||||||||||||||
(in thousands) | Mar 31, 2018 | Dec 31, 2017 | Mar 31, 2018 | Dec 31, 2017 | Mar 31, 2018 | Dec 31, 2017 | Mar 31, 2018 | Dec 31, 2017 | ||||||||||||||||||||||||
Grade: | ||||||||||||||||||||||||||||||||
Pass | $ | 58,199 | $ | 60,300 | $ | — | $ | — | $ | 42,302 | $ | 43,350 | $ | 100,501 | $ | 103,650 | ||||||||||||||||
Special mention | 5,003 | 5,753 | — | — | — | — | 5,003 | 5,753 | ||||||||||||||||||||||||
Substandard | 1,996 | 2,016 | — | — | — | — | 1,996 | 2,016 | ||||||||||||||||||||||||
Total | $ | 65,198 | $ | 68,069 | $ | — | $ | — | $ | 42,302 | $ | 43,350 | $ | 107,500 | $ | 111,419 | ||||||||||||||||
Residential Real Estate and Consumer Loans
Credit Risk Profile Based on Payment Activity
Residential real estate | Home equity | Other consumer | Total Residential real estate and consumer | |||||||||||||||||||||||||||||
(in thousands) | Mar 31, 2018 | Dec 31, 2017 | Mar 31, 2018 | Dec 31, 2017 | Mar 31, 2018 | Dec 31, 2017 | Mar 31, 2018 | Dec 31, 2017 | ||||||||||||||||||||||||
Performing | $ | 541,464 | $ | 562,516 | $ | 57,490 | $ | 62,000 | $ | 2,015 | $ | 2,283 | $ | 600,969 | $ | 626,799 | ||||||||||||||||
Nonperforming | 3,049 | 1,755 | 277 | 217 | 55 | 58 | 3,381 | 2,030 | ||||||||||||||||||||||||
Total | $ | 544,513 | $ | 564,271 | $ | 57,767 | $ | 62,217 | $ | 2,070 | $ | 2,341 | $ | 604,350 | $ | 628,829 | ||||||||||||||||
The following table summarizes information about total classified and criticized loans loans as of March 31, 2018 and December 31, 2017:
March 31, 2018 | December 31, 2017 | |||||||||||||||||||||||
(in thousands) | Business Activities Loans | Acquired Loans | Total | Business Activities Loans | Acquired Loans | Total | ||||||||||||||||||
Non-accrual | $ | 17,003 | $ | 3,336 | $ | 20,339 | $ | 12,140 | $ | 2,156 | $ | 14,296 | ||||||||||||
Substandard accruing | 7,988 | 6,145 | 14,133 | 10,284 | 7,833 | 18,117 | ||||||||||||||||||
Total classified | 24,991 | 9,481 | 34,472 | 22,424 | 9,989 | 32,413 | ||||||||||||||||||
Special mention | 10,153 | 7,627 | 17,780 | 7,932 | 8,428 | 16,360 | ||||||||||||||||||
Total Criticized | $ | 35,144 | $ | 17,108 | $ | 52,252 | $ | 30,356 | $ | 18,417 | $ | 48,773 | ||||||||||||
38
NOTE 5. BORROWED FUNDS
Borrowed funds at March 31, 2018 and December 31, 2017 are summarized, as follows:
March 31, 2018 | December 31, 2017 | |||||||||||||
(dollars in thousands) | Carrying Value | Weighted Average Rate | Carrying Value | Weighted Average Rate | ||||||||||
Short-term borrowings | ||||||||||||||
Advances from the FHLB | $ | 567,372 | 1.80 | % | $ | 608,792 | 1.49 | % | ||||||
Other borrowings | 31,615 | 0.89 | 40,706 | 0.59 | ||||||||||
Total short-term borrowings | 598,987 | 1.75 | 649,498 | 1.43 | ||||||||||
Long-term borrowings | ||||||||||||||
Advances from the FHLB | 143,211 | 1.83 | 137,190 | 1.72 | ||||||||||
Subordinated borrowings | 38,018 | 5.36 | 38,033 | 4.88 | ||||||||||
Junior subordinated borrowings | 5,000 | 5.41 | 5,000 | 4.89 | ||||||||||
Total long-term borrowings | 186,229 | 2.65 | 180,223 | 2.47 | ||||||||||
Total | $ | 785,216 | 1.96 | % | $ | 829,721 | 1.66 | % | ||||||
Short term debt includes Federal Home Loan Bank of Boston (“FHLB”) advances with an original maturity of less than one year. The Bank also maintains a $1.0 million secured line of credit with the FHLB that bears a daily adjustable rate calculated by the FHLB. There was no outstanding balance on the FHLB line of credit for the periods ended March 31, 2018 and December 31, 2017.
The Bank also had capacity to borrow funds on a secured basis utilizing the Borrower in Custody program and the Discount Window at the Federal Reserve Bank of Boston (the “FRB”). At March 31, 2018, the Bank’s available secured line of credit at the FRB was $118.0 million. The Bank has pledged certain loans and securities to the FRB to support this arrangement. There were no borrowings with the FRB for the periods ended March 31, 2018 and December 31, 2017.
Long-term FHLB advances consist of advances with a maturity of more than one year. The advances outstanding at March 31, 2018 include callable advances totaling $25.0 million, and amortizing advances totaling $676 thousand. The advances outstanding at December 31, 2017 include callable advances totaling $27.0 million, and $683 thousand amortizing advances. All FHLB borrowings, including the line of credit, are secured by a blanket security agreement on certain qualified collateral, principally all residential first mortgage loans and certain securities.
A summary of maturities of FHLB advances as of March 31, 2018 is as follows:
March 31, 2018 | |||||||
(in thousands, except rates) | Carrying Value | Weighted Average Rate | |||||
Fixed rate advances maturing: | |||||||
2018 | $ | 531,680 | 1.78 | % | |||
2019 | 146,661 | 1.88 | |||||
2020 | 29,929 | 1.88 | |||||
2021 | 1,637 | 2.35 | |||||
2022 | — | — | |||||
2023 and thereafter | 676 | 2.87 | |||||
Total FHLB advances | $ | 710,583 | 1.81 | % | |||
In April 2008, the Bank issued fifteen year junior subordinated notes in the amount of $5.0 million. These debt securities qualify as Tier 2 capital for the Company and the Bank. The subordinated debt securities are callable by the Bank after five years without penalty. The interest rate is three-month LIBOR plus 3.45%. At March 31, 2018 and December 31, 2017 the interest rate was 5.57% and 5.04%, respectively.
39
The Company has $17.0 million of subordinated debt issued on October 29, 2014, in connection with the execution of a Subordinated Note Purchase Agreement with an aggregate of $17.0 million of subordinated notes (the “Notes”) to the accredited investors. The Notes have a maturity date of November 1, 2024, and will bear interest at a fixed rate of 6.75% per annum. The Company may, at its option, beginning with the interest payment date of November 1, 2019, and on any interest payment date thereafter, redeem the Notes, in whole or in part, at par plus accrued and unpaid interest to the date of redemption. Any partial redemption will be made pro rata among all of the noteholders. The Notes are not subject to repayment at the option of the noteholders. The Notes are unsecured, subordinated obligations of the Company and rank junior in right of payment to the Company’s senior indebtedness and to the Company’s obligations to its general creditors.
The Company also has $20.6 million in floating Junior Subordinated Deferrable Interest Debentures ("Debentures") issued by NHTB Capital Trust II ("Trust II") and NHTB Capital Trust III ("Trust III"), which are both Connecticut statutory trusts. The Debentures were issued on March 30, 2014, carry a variable interest rate of 3-month LIBOR plus 2.79%, and mature in 2034. The debt is callable by the Company at the time when any interest payment is made. Trust II and Trust III are considered variable interest entities for which the Company is not the primary beneficiary. Accordingly, Trust II and Trust III are not consolidated into the Company’s financial statements.
40
NOTE 6. DEPOSITS
A summary of time deposits is as follows:
(in thousands) | March 31, 2018 | December 31, 2017 | ||||||
Time less than $100,000 | $ | 587,046 | $ | 579,856 | ||||
Time $100,000 or more | 297,802 | 286,490 | ||||||
Total time deposits | $ | 884,848 | $ | 866,346 | ||||
At March 31, 2018 and December 31, 2017, the scheduled maturities by year for time deposits were as follows:
(in thousands) | March 31, 2018 | December 31, 2017 | ||||||
Within 1 year | $ | 474,956 | $ | 406,295 | ||||
Over 1 year to 2 years | 274,329 | 305,895 | ||||||
Over 2 years to 3 years | 102,272 | 115,878 | ||||||
Over 3 years to 4 years | 13,647 | 24,459 | ||||||
Over 4 years to 5 years | 19,617 | 13,685 | ||||||
Over 5 years | 27 | 134 | ||||||
Total | $ | 884,848 | $ | 866,346 | ||||
Included in time deposits are brokered deposits of $450.4 million and $428.3 million at March 31, 2018 and December 31, 2017, respectively. Included in the deposit balances contained on the balance sheet are reciprocal deposits of $35.5 million and $49.7 million at March 31, 2018 and December 31, 2017, respectively.
41
NOTE 7. CAPITAL RATIOS AND SHAREHOLDERS’ EQUITY
The actual and required capital ratios were as follows:
March 31, 2018 | Regulatory Minimum to be "Well Capitalized" | December 31, 2017 | Regulatory Minimum to be "Well Capitalized" | |||||||||
Company (consolidated) | ||||||||||||
Total capital to risk weighted assets | 13.9 | % | 10.5 | % | 13.7 | % | 10.5 | % | ||||
Common equity tier 1 capital to risk weighted assets | 11.4 | 6.5 | 11.3 | 6.5 | ||||||||
Tier 1 capital to risk weighted assets | 12.3 | 8.0 | 12.2 | 8.0 | ||||||||
Tier 1 capital to average assets | 8.2 | 5.0 | 8.1 | 5.0 | ||||||||
Bank | ||||||||||||
Total capital to risk weighted assets | 13.7 | % | 10.5 | % | 13.7 | % | 10.5 | % | ||||
Common equity tier 1 capital to risk weighted assets | 12.9 | 6.5 | 12.9 | 6.5 | ||||||||
Tier 1 capital to risk weighted assets | 12.9 | 8.0 | 12.9 | 8.0 | ||||||||
Tier 1 capital to average assets | 8.6 | 5.0 | 8.6 | 5.0 | ||||||||
At each date shown, the Company and the Bank met the conditions to be classified as “well capitalized” under the relevant regulatory framework. To be categorized as "well capitalized," an institution must maintain minimum total risk-based, Tier 1 risk-based, and Tier 1 leverage ratios as set forth in the table above.
Effective January 1, 2015, the Company and the Bank became subject to the Basel III rule that requires the Company and the Bank to assess their Common equity tier 1 capital to risk weighted assets and the Company and the Bank each exceed the minimum to be "well capitalized." In addition, the final capital rules added a requirement to maintain a minimum conservation buffer, composed of common equity tier 1 capital, of 2.5% of risk-weighted assets, to be phased in over three years and applied to the common equity tier 1 risk-based capital ratio, the Tier 1 risk-based capital ratio and the Total risk-based capital ratio. Accordingly, banking organizations, on a fully phased in basis no later than January 1, 2019, must maintain a minimum Common equity tier 1 risk-based capital ratio of 7.0%, a minimum Tier 1 risk-based capital ratio of 8.5% and a minimum Total risk-based capital ratio of 10.5%.
The required minimum conservation buffer began to be phased in incrementally, starting at 0.625% on January 1, 2016 and increasing to 1.25% on January 1, 2017. The buffer increased to 1.875% on January 1, 2018 and will increase to 2.5% on January 1, 2019. The final capital rules impose restrictions on capital distributions and certain discretionary cash bonus payments if the minimum capital conservation buffer is not met.
At March 31, 2018, the capital levels of both the Company and the Bank exceeded all regulatory capital requirements and their regulatory capital ratios were above the minimum levels required to be considered "well capitalized" for regulatory purposes. The capital levels of both the Company and the Bank at March 31, 2018 also exceeded the minimum capital requirements including the currently applicable capital conservation buffer of 1.875%.
42
Accumulated other comprehensive loss
Components of accumulated other comprehensive income is as follows:
(in thousands) | March 31, 2018 | December 31, 2017 | ||||||
Other accumulated comprehensive income (loss), before tax: | ||||||||
Net unrealized loss on AFS securities | $ | (13,443 | ) | $ | (2,741 | ) | ||
Net unrealized loss on effective cash flow hedging derivatives | (2,934 | ) | (3,588 | ) | ||||
Net unrealized loss on post-retirement plans | (905 | ) | (946 | ) | ||||
Income taxes related to items of accumulated other comprehensive loss: | ||||||||
Net unrealized loss on AFS securities | 3,211 | 1,030 | ||||||
Net unrealized loss on effective cash flow hedging derivatives | 698 | 1,338 | ||||||
Net unrealized loss on post-retirement plans | 217 | 353 | ||||||
Accumulated other comprehensive loss | $ | (13,156 | ) | $ | (4,554 | ) | ||
43
The following table presents the components of other comprehensive income (loss) for the three months ended March 31, 2018 and 2017:
(in thousands) | Before Tax | Tax Effect | Net of Tax | |||||||||
Three Months Ended March 31, 2018 | ||||||||||||
Net unrealized gain on AFS securities: | ||||||||||||
Net unrealized gain arising during the period | $ | (10,702 | ) | $ | 2,550 | $ | (8,152 | ) | ||||
Less: reclassification adjustment for gains (losses) realized in net income | — | — | — | |||||||||
Net unrealized gain on AFS securities | (10,702 | ) | 2,550 | (8,152 | ) | |||||||
Net unrealized loss on derivative hedges: | ||||||||||||
Net unrealized loss arising during the period | 654 | (155 | ) | 499 | ||||||||
Less: reclassification adjustment for gains (losses) realized in net income | — | — | — | |||||||||
Net unrealized loss on derivative hedges | 654 | (155 | ) | 499 | ||||||||
Net unrealized loss on post-retirement plans: | ||||||||||||
Net unrealized loss arising during the period | 41 | (10 | ) | 31 | ||||||||
Less: reclassification adjustment for gains (losses) realized in net income | — | — | — | |||||||||
Net unrealized loss on post-retirement plans | 41 | (10 | ) | 31 | ||||||||
Other comprehensive loss | $ | (10,007 | ) | $ | 2,385 | $ | (7,622 | ) | ||||
Three Months Ended March 31, 2017 | ||||||||||||
Net unrealized gain on AFS securities: | ||||||||||||
Net unrealized gain arising during the period | $ | 1,116 | $ | (348 | ) | $ | 768 | |||||
Less: reclassification adjustment for gains (losses) realized in net income | — | — | — | |||||||||
Net unrealized gain on AFS securities | 1,116 | (348 | ) | 768 | ||||||||
Net unrealized loss on derivative hedges: | ||||||||||||
Net unrealized loss arising during the period | (223 | ) | 83 | (140 | ) | |||||||
Less: reclassification adjustment for gains (losses) realized in net income | — | — | — | |||||||||
Net unrealized loss on derivative hedges | (223 | ) | 83 | (140 | ) | |||||||
Net unrealized loss on post-retirement plans: | ||||||||||||
Net unrealized loss arising during the period | 57 | (21 | ) | 36 | ||||||||
Less: reclassification adjustment for gains (losses) realized in net income | — | — | — | |||||||||
Net unrealized loss on post-retirement plans | 57 | (21 | ) | 36 | ||||||||
Other comprehensive income (loss) | $ | 950 | $ | (286 | ) | $ | 664 | |||||
44
The following table presents the changes in each component of accumulated other comprehensive income (loss), for the three months ended March 31, 2018 and 2017:
(in thousands) | Net unrealized holding gain on AFS Securities | Net loss on effective cash flow hedging derivatives | Net unrealized holding loss on pension plans | Total | ||||||||||||
Three Months Ended March 31, 2018 | ||||||||||||||||
Balance at beginning of period | $ | (1,713 | ) | $ | (2,250 | ) | $ | (591 | ) | $ | (4,554 | ) | ||||
Other comprehensive gain/(loss) before reclassifications | (8,152 | ) | 499 | 31 | (7,622 | ) | ||||||||||
Less: amounts reclassified from accumulated other comprehensive income for ASU 2018-02 | (367 | ) | (485 | ) | (128 | ) | (980 | ) | ||||||||
Total other comprehensive loss | (8,519 | ) | 14 | (97 | ) | (8,602 | ) | |||||||||
Balance at end of period | $ | (10,232 | ) | $ | (2,236 | ) | $ | (688 | ) | $ | (13,156 | ) | ||||
Three Months Ended March 31, 2017 | ||||||||||||||||
Balance at beginning of period | $ | (2,125 | ) | $ | (1,798 | ) | $ | (403 | ) | $ | (4,326 | ) | ||||
Other comprehensive gain/(loss) before reclassifications | 768 | (140 | ) | 36 | 664 | |||||||||||
Less: amounts reclassified from accumulated other comprehensive income | — | — | — | — | ||||||||||||
Total other comprehensive loss | 768 | (140 | ) | 36 | 664 | |||||||||||
Balance at end of period | $ | (1,357 | ) | $ | (1,938 | ) | $ | (367 | ) | $ | (3,662 | ) | ||||
The Company did not have any reclassifications from any component of accumulated other comprehensive income (loss) for the three months ended March 31, 2018 and 2017.
45
NOTE 8. EARNINGS PER SHARE
Earnings per share have been computed based on the following (average diluted shares outstanding are calculated using the treasury stock method):
Three Months Ended March 31, | ||||||||
(in thousands, except per share and share data) | 2018 | 2017 | ||||||
Net income | $ | 7,812 | $ | 4,211 | ||||
Average number of basic common shares outstanding | 15,448,338 | 14,471,147 | ||||||
Plus: dilutive effect of stock options and awards outstanding | 104,631 | 120,126 | ||||||
Average number of diluted common shares outstanding | 15,552,969 | 14,591,273 | ||||||
Anti-dilutive options excluded from earnings calculation | 1,230 | — | ||||||
Earnings per share: | ||||||||
Basic | $ | 0.51 | $ | 0.29 | ||||
Diluted | $ | 0.50 | $ | 0.29 | ||||
46
NOTE 9. DERIVATIVE FINANCIAL INSTRUMENTS AND HEDGING ACTIVITIES
As part of its overall asset and liability management strategy, the Bank periodically uses derivative instruments to minimize significant unplanned fluctuations in earnings and cash flows caused by interest rate volatility. The Bank’s interest rate risk management strategy involves modifying the re-pricing characteristics of certain assets or liabilities so the changes in interest rates do not have a significant effect on net interest income.
The Company recognizes its derivative instruments on the consolidated balance sheet at fair value. On the date the derivative instrument is entered into, the Bank designates whether the derivative is part of a hedging relationship (i.e., cash flow or fair value hedge). The Bank formally documents relationships between hedging instruments and hedged items, as well as its risk management objective and strategy for undertaking hedge transactions. The Bank also assesses, both at the hedge’s inception and on an ongoing basis, whether the derivatives used in hedging transactions are highly effective in offsetting the changes in cash flows or fair values of hedged items.
Changes in fair value of derivative instruments that are highly effective and qualify as cash flow hedges are recorded in other comprehensive income or loss. Any ineffective portion is recorded in earnings. The Bank discontinues hedge accounting when it is determined the derivative is no longer effective in offsetting changes of the hedged risk on the hedged item, or management determines the designation of the derivative as a hedging instrument is no longer appropriate.
Information about derivative assets and liabilities at March 31, 2018 and December 31, 2017, was as follows:
March 31, 2018 | ||||||||||
Notional Amount | Weighted Average Maturity | Estimated Fair Value Asset (Liability) | ||||||||
(in thousands) | (in years) | (in thousands) | ||||||||
Cash flow hedges: | ||||||||||
Interest rate caps agreements | $ | 90,000 | 4.9 | $ | 1,215 | |||||
Total cash flow hedges | 90,000 | 4.9 | 1,215 | |||||||
Economic hedges: | ||||||||||
Forward sale commitments | 5,658 | 0.2 | (51 | ) | ||||||
Total economic hedges | 5,658 | 0.2 | (51 | ) | ||||||
Non-hedging derivatives: | ||||||||||
Interest rate lock commitments | 4,375 | 0.2 | 7 | |||||||
Total non-hedging derivatives | 4,375 | 0.2 | 7 | |||||||
Total | $ | 100,033 | $ | 1,171 | ||||||
47
December 31, 2017 | ||||||||||
Notional Amount | Weighted Average Maturity | Estimated Fair Value Asset (Liability) | ||||||||
(in thousands) | (in years) | (in thousands) | ||||||||
Cash flow hedges: | ||||||||||
Interest rate caps agreements | $ | 90,000 | 5.1 | $ | 669 | |||||
Total cash flow hedges | 90,000 | 5.1 | 669 | |||||||
Economic hedges: | ||||||||||
Forward sale commitments | 20,352 | 0.2 | (221 | ) | ||||||
Total economic hedges | 20,352 | 0.2 | (221 | ) | ||||||
Non-hedging derivatives: | ||||||||||
Interest rate lock commitments | 19,853 | 0.2 | (1 | ) | ||||||
Total non-hedging derivatives | 19,853 | 0.2 | (1 | ) | ||||||
Total | $ | 130,205 | $ | 447 | ||||||
Information about derivative assets and liabilities for the three months ended March 31, 2018 and 2017, was as follows:
Three Months Ended March 31, | ||||||||
(in thousands) | 2018 | 2017 | ||||||
Cash flow hedges: | ||||||||
Interest rate cap agreements | ||||||||
Realized (loss) in interest expense | $ | (108 | ) | $ | (39 | ) | ||
Economic hedges: | ||||||||
Forward commitments | ||||||||
Realized gain/(loss) in other non-interest income | 170 | (78 | ) | |||||
Non-hedging derivatives: | ||||||||
Interest rate lock commitments | ||||||||
Realized gain in other non-interest income | 8 | 2 | ||||||
Cash flow hedges
In 2014, interest rate cap agreements were purchased to limit the Bank’s exposure to rising interest rates on four rolling, three-month borrowings indexed to three-month LIBOR. Under the terms of the agreements, the Bank paid total premiums of $4.6 million for the right to receive cash flow payments if 3-month LIBOR rises above the caps of 3.00%, thus effectively ensuring interest expense on the borrowings at maximum rates of 3.00% for the duration of the agreements. The interest rate cap agreements were designated as cash flow hedges. The fair values of the interest rate cap agreements are included in other assets on the Company’s consolidated balance sheets. Changes in the fair value, representing unrealized gains or losses, are recorded in accumulated other comprehensive income, net of tax. The premiums paid on the interest rate cap agreements are being recognized as increases in interest expense over the duration of the agreements using the caplet method.
48
Economic hedges
The Company utilizes forward sale commitments to hedge interest rate risk and the associated effects on the fair value of interest rate lock commitments and loans originated for sale. The forward sale commitments are accounted for as derivatives with changes in fair value recorded in current period earnings. The Company typically uses mandatory delivery contracts, which are loan sale agreements where the Company commits to deliver a certain principal amount of mortgage loans to an investor at a specified price on or before a specified date. Generally, the Company may enter into mandatory delivery contracts shortly after the loan closes with a customer.
Non-hedging derivatives
The Company enters into interest rate lock commitments (“IRLCs”) for residential mortgage loans, which commit the Company to lend funds to a potential borrower at a specific interest rate and within a specified period of time. IRLCs relate to the origination of mortgage loans will be held for sale are considered derivative financial instruments under applicable accounting guidance. Outstanding IRLCs expose the Company to the risk that the price of the mortgage loans underlying the commitments may decline due to increases in mortgage interest rates from inception of the rate lock to the funding of the loan. The IRLCs are free-standing derivatives which are carried at fair value with changes recorded in non-interest income in the Company’s consolidated statements of income. Changes in the fair value of IRLCs subsequent to inception are based on changes in the fair value of the underlying loan resulting from the fulfillment of the commitment and changes in the probability when the loan will fund within the terms of the commitment, which is affected primarily by changes in interest rates and the passage of time.
49
NOTE 10. FAIR VALUE MEASUREMENTS
A description of the valuation methodologies used for assets and liabilities measured at fair value, as well as the general classification of such instruments pursuant to the valuation hierarchy, is set forth below. These valuation methodologies were applied to all of the Company’s financial assets and financial liabilities that are carried at fair value.
Recurring Fair Value Measurements
The following table summarizes financial assets and financial liabilities measured at fair value on a recurring basis as of March 31, 2018 and December 31, 2017, segregated by the level of the valuation inputs within the fair value hierarchy utilized to measure fair value.
March 31, 2018 | ||||||||||||||||
Level 1 | Level 2 | Level 3 | Total | |||||||||||||
(in thousands) | Inputs | Inputs | Inputs | Fair Value | ||||||||||||
Available for sale securities: | ||||||||||||||||
Obligations of US Government sponsored enterprises | $ | — | $ | 6,977 | $ | — | $ | 6,977 | ||||||||
Mortgage-backed securities: | ||||||||||||||||
US Government-sponsored enterprises | — | 449,175 | — | 449,175 | ||||||||||||
US Government agency | — | 90,396 | — | 90,396 | ||||||||||||
Private label | — | 616 | — | 616 | ||||||||||||
Obligations of states and political subdivisions thereof | — | 135,277 | — | 135,277 | ||||||||||||
Corporate bonds | — | 36,118 | — | 36,118 | ||||||||||||
Derivative assets | — | 1,215 | 7 | 1,222 | ||||||||||||
Derivative liabilities | — | — | (51 | ) | (51 | ) | ||||||||||
December 31, 2017 | ||||||||||||||||
Level 1 | Level 2 | Level 3 | Total | |||||||||||||
(in thousands) | Inputs | Inputs | Inputs | Fair Value | ||||||||||||
Available for sale securities: | ||||||||||||||||
Obligations of US Government sponsored enterprises | $ | — | $ | 6,972 | $ | — | $ | 6,972 | ||||||||
Mortgage-backed securities: | ||||||||||||||||
US Government-sponsored enterprises | — | 443,003 | — | 443,003 | ||||||||||||
US Government agency | — | 95,596 | — | 95,596 | ||||||||||||
Private label | — | 674 | — | 674 | ||||||||||||
Obligations of states and political subdivisions thereof | — | 140,200 | — | 140,200 | ||||||||||||
Corporate bonds | — | 30,797 | — | 30,797 | ||||||||||||
Derivative assets | — | 669 | — | 669 | ||||||||||||
Derivative liabilities | (222 | ) | (222 | ) | ||||||||||||
Securities Available for Sale: All securities and major categories of securities classified as available for sale are reported at fair value utilizing Level 2 inputs. For these securities, the Company obtains fair value measurements from independent pricing providers. The fair value measurements used by the pricing providers consider observable data may include dealer quotes, market maker quotes and live trading systems. If quoted prices are not readily available, fair values are determined using matrix pricing models, or other model-based valuation techniques requiring observable inputs other than quoted prices such as market pricing spreads, credit information, callable features, cash flows, the U.S. Treasury yield curve, trade execution data, market consensus prepayment speeds, default rates, and the securities’ terms and conditions, among other things.
50
Derivative Assets and Liabilities
Interest Rate Lock Commitments. The Company enters into IRLCs for residential mortgage loans, which commit the Company to lend funds to a potential borrower at a specific interest rate and within a specified period of time. The estimated fair value of commitments to originate residential mortgage loans for sale is based on quoted prices for similar loans in active markets. However, this value is adjusted by a factor which considers the likelihood of a loan in a lock position will ultimately close. The closing ratio is derived from the Bank’s internal data and is adjusted using significant management judgment. As such, IRLCs are classified as Level 3 measurements.
Forward Sale Commitments. The Company utilizes forward sale commitments as economic hedges against potential changes in the values of the IRLCs and loans originated for sale. The fair values of the Company’s mandatory delivery loan sale commitments are determined similarly to the IRLCs using quoted prices in the market place that are observable. However, closing ratios included in the calculation are internally generated and are based on management’s judgment and prior experience, which are not considered observable factors. As such, mandatory delivery forward commitments are classified as Level 3 measurements.
The table below presents the changes in Level 3 assets and liabilities that were measured at fair value on a recurring basis for the three months ended March 31, 2018.
Assets (Liabilities) | ||||||||
Interest Rate Lock | Forward | |||||||
(in thousands) | Commitments | Commitments | ||||||
Three Months Ended March 31, 2018 | ||||||||
December 31, 2017 | $ | (1 | ) | $ | (221 | ) | ||
Realized gain recognized in non-interest income | 8 | 170 | ||||||
March 31, 2018 | $ | 7 | $ | (51 | ) | |||
Quantitative information about the significant unobservable inputs within Level 3 recurring assets and liabilities is as follows:
(in thousands, except ratios) | Fair Value March 31, 2018 | Valuation Techniques | Unobservable Inputs | Significant Unobservable Input Value | ||||||||
Assets (Liabilities) | ||||||||||||
Interest Rate Lock Commitment | $ | 7 | Historical trend | Closing Ratio | 90 | % | ||||||
Pricing Model | Origination Costs, per loan | $ | 1.7 | |||||||||
Forward Commitments | (51 | ) | Quoted prices for similar loans in active markets. | Freddie Mac pricing system | Pair-off contract price | |||||||
Total | $ | (44 | ) | |||||||||
51
Non-Recurring Fair Value Measurements
The Company is required, on a non-recurring basis, to adjust the carrying value or provide valuation allowances for certain assets using fair value measurements in accordance with GAAP. The following is a summary of applicable non-recurring fair value measurements. There are no liabilities measured at fair value on a non-recurring basis.
March 31, 2018 | December 31, 2017 | Three Months Ended March 31, 2018 | Fair Value Measurement Date as of March 31, 2018 | |||||||||||
(in thousands) | Level 3 Inputs | Level 3 Inputs | Total Gains (Losses) | Level 3 Inputs | ||||||||||
Assets | ||||||||||||||
Impaired loans | $ | 15,127 | $ | 10,793 | $ | (4,334 | ) | March 2018 | ||||||
Capitalized servicing rights | 4,695 | 4,158 | March 2018 | |||||||||||
Other real estate owned | 216 | 122 | Jan 2017 - March 2018 | |||||||||||
Total | $ | 20,038 | $ | 15,073 | (4,334 | ) | ||||||||
Quantitative information about the significant unobservable inputs within Level 3 non-recurring assets is as follows:
Fair Value | Range (Weighted Average)(a) | |||||||||||
(in thousands, except ratios) | March 31, 2018 | Valuation Techniques | Unobservable Inputs | |||||||||
Assets | ||||||||||||
Impaired loans | $ | 13,364 | Fair value of collateral -appraised value | Loss severity | 0% to 54% | |||||||
Appraised value | $100 to $6,915 | |||||||||||
Impaired loans | 1,763 | Discount cash flow | Discount rate | 2.88% to 9.5% | ||||||||
Cash flows | $26 to $570 | |||||||||||
Capitalized servicing rights | 4,695 | Discounted cash flow | Constant prepayment rate (CPR) | 9.22 | % | |||||||
Discount rate | 10.10 | % | ||||||||||
Other real estate owned | 216 | Fair value of collateral | Appraised value | $216 | ||||||||
Total | $ | 20,038 | ||||||||||
(a) | Where dollar amounts are disclosed, the amounts represent the lowest and highest fair value of the respective assets in the population except for adjustments for market/property conditions, which represents the range of adjustments to individuals properties. |
52
Fair Value | Range | ||||||||||
(in thousands, except ratios) | December 31, 2017 | Valuation Techniques | Unobservable Inputs | (Weighted Average)(a) | |||||||
Assets | |||||||||||
Impaired loans | $ | 8,586 | Fair value of collateral -appraised value | Loss severity | 15.7% to 45.28% | ||||||
Appraised value | $100 to $7,545 | ||||||||||
Impaired loans | 2,207 | Discount cash flow | Discount rate | 2.63% to 9.50% | |||||||
Cash flows | $6 to $320 | ||||||||||
Capitalized servicing rights | 4,158 | Discounted cash flow | Constant prepayment rate (CPR) | 10.97 | % | ||||||
Discount rate | 10.10 | % | |||||||||
Other real estate owned | 122 | Fair value of collateral | Appraised value | 122 | |||||||
Total | $ | 15,073 | |||||||||
(a) | Where dollar amounts are disclosed, the amounts represent the lowest and highest fair value of the respective assets in the population except for adjustments for market/property conditions, which represents the range of adjustments to individuals properties. |
There were no Level 1 or Level 2 non-recurring fair value measurements for the periods ended March 31, 2018 and December 31, 2017.
Impaired Loans. Loans are generally not recorded at fair value on a recurring basis. Periodically, the Company records non-recurring adjustments to the carrying value of loans based on fair value measurements for partial charge-offs of the uncollectible portions of those loans. Non-recurring adjustments can also include certain impairment amounts for collateral-dependent loans calculated when establishing the allowance for credit losses. Such amounts are generally based on the fair value of the underlying collateral supporting the loan and, as a result, the carrying value of the loan less the calculated valuation amount does not necessarily represent the fair value of the loan. Real estate collateral is typically valued using appraisals or other indications of value based on recent comparable sales of similar properties or assumptions generally observable in the marketplace. However, the choice of observable data is subject to significant judgment, and there are often adjustments based on judgment in order to make observable data comparable and to consider the impact of time, the condition of properties, interest rates, and other market factors on current values. Additionally, commercial real estate appraisals frequently involve discounting of projected cash flows, which relies inherently on unobservable data. Therefore, non-recurring fair value measurement adjustments relating to real estate collateral have generally been classified as Level 3. Estimates of fair value for other collateral supporting commercial loans are generally based on assumptions not observable in the marketplace and therefore such valuations have been classified as Level 3.
Capitalized loan servicing rights. A loan servicing right asset represents the amount by which the present value of the estimated future net cash flows to be received from servicing loans exceed adequate compensation for performing the servicing. The fair value of servicing rights is estimated using a present value cash flow model. The most important assumptions used in the valuation model are the anticipated rate of the loan prepayments and discount rates. Adjustments are only recorded when the discounted cash flows derived from the valuation model are less than the carrying value of the asset. Although some assumptions in determining fair value are based on standards used by market participants, some are based on unobservable inputs and therefore are classified in Level 3 of the valuation hierarchy.
Other real estate owned (“OREO”). OREO results from the foreclosure process on residential or commercial loans issued by the Bank. Upon assuming the real estate, the Company records the property at the fair value of the asset less the estimated sales costs. Thereafter, OREO properties are recorded at the lower of cost or fair value less the estimated sales costs. OREO fair values are primarily determined based on Level 3 data including sales comparables and appraisals.
53
Summary of Estimated Fair Values of Financial Instruments. The estimated fair values, and related carrying amounts, of the Company’s financial instruments follow. Certain financial instruments and all non-financial instruments are excluded from disclosure requirements. Accordingly, the aggregate fair value amounts presented herein may not necessarily represent the underlying fair value of the Company.
March 31, 2018 | ||||||||||||||||||||
(in thousands) | Carrying Amount | Fair Value | Level 1 | Level 2 | Level 3 | |||||||||||||||
Financial Assets | ||||||||||||||||||||
Cash and cash equivalents | $ | 47,813 | $ | 47,813 | $ | 47,813 | $ | — | $ | — | ||||||||||
Securities available for sale | 718,559 | 718,559 | — | 718,559 | — | |||||||||||||||
FHLB bank stock | 38,105 | 38,105 | — | 38,105 | — | |||||||||||||||
Net loans | 2,451,740 | 2,408,902 | — | — | 2,408,902 | |||||||||||||||
Accrued interest receivable | 3,243 | 3,243 | — | 3,243 | — | |||||||||||||||
Cash surrender value of bank-owned life insurance policies | 58,433 | 58,433 | — | 58,433 | — | |||||||||||||||
Derivative assets | 1,222 | 1,222 | — | 1,215 | 7 | |||||||||||||||
Financial Liabilities | ||||||||||||||||||||
Total deposits | $ | 2,341,400 | $ | 2,260,874 | $ | — | $ | 2,260,874 | $ | — | ||||||||||
Securities sold under agreements to repurchase | 31,615 | 31,589 | — | 31,589 | — | |||||||||||||||
Federal Home Loan Bank advances | 710,583 | 707,998 | — | 707,998 | — | |||||||||||||||
Subordinated borrowings | 38,018 | 38,018 | — | 38,018 | — | |||||||||||||||
Junior subordinated borrowings | 5,000 | 3,809 | — | 3,809 | — | |||||||||||||||
Derivative liabilities | (51 | ) | (51 | ) | — | — | (51 | ) | ||||||||||||
December 31, 2017 | ||||||||||||||||||||
(in thousands) | Carrying Amount | Fair Value | Level 1 | Level 2 | Level 3 | |||||||||||||||
Financial Assets | ||||||||||||||||||||
Cash and cash equivalents | $ | 90,685 | $ | 90,685 | $ | 90,685 | $ | — | $ | — | ||||||||||
Securities available for sale | 717,242 | 717,242 | — | 717,242 | — | |||||||||||||||
FHLB bank stock | 38,105 | 38,105 | — | 38,105 | — | |||||||||||||||
Net loans | 2,473,288 | 2,433,557 | — | — | 2,433,557 | |||||||||||||||
Accrued interest receivable | 3,347 | 3,347 | — | 3,347 | — | |||||||||||||||
Cash surrender value of bank-owned life insurance policies | 57,997 | 57,997 | — | 57,997 | — | |||||||||||||||
Derivative assets | 669 | 669 | — | 669 | — | |||||||||||||||
Financial Liabilities | ||||||||||||||||||||
Total deposits | $ | 2,352,085 | $ | 2,348,574 | $ | — | $ | 2,348,574 | $ | — | ||||||||||
Securities sold under agreements to repurchase | 40,706 | 40,680 | — | 40,680 | — | |||||||||||||||
Federal Home Loan Bank advances | 745,982 | 744,006 | — | 744,006 | — | |||||||||||||||
Subordinated borrowings | 38,033 | 38,033 | — | 38,033 | — | |||||||||||||||
Junior subordinated borrowings | 5,000 | 3,782 | — | 3,782 | — | |||||||||||||||
Derivative liabilities | (222 | ) | (222 | ) | — | — | (222 | ) | ||||||||||||
Other than as discussed above, the following methods and assumptions were used by management to estimate the fair value of significant classes of financial instruments for which it is practicable to estimate that value.
Cash and cash equivalents. Carrying value is assumed to represent fair value for cash and cash equivalents that have original maturities of 90 days or less.
54
FHLB bank stock and restricted securities. Carrying value approximates fair value based on the redemption provisions of the issuers.
Cash surrender value of life insurance policies. Carrying value approximates fair value.
Loans, net. As of March 31, 2018, the fair value of loans were calculated on an individual basis with consideration given to the loans' underlying characteristics, including account types, remaining terms, annual interest rates or coupons, interest types, timing of principal and interest payments, current market rates, risk ratings, credit ratings and remaining balances. A discounted cash flow model is used to estimate the fair value of the loans using assumptions for the coupon rates, remaining maturities, prepayment speeds, liquidity premiums, projected default probabilities, losses given defaults, and estimates of prevailing discount rates. As of December 31, 2017, the fair value of loans was estimated by discounting future cash flows using the current interest rates at which similar loans with similar terms would be made to borrowers of similar credit quality.
Accrued interest receivable. Carrying value approximates fair value.
Deposits. The fair value of demand, non-interest bearing checking, savings and money market deposits is determined as the amount payable on demand at the reporting date. The fair value of time deposits is estimated by discounting the estimated future cash flows using market rates offered for deposits of similar remaining maturities.
Borrowed funds. The fair value of borrowed funds is estimated by discounting the future cash flows using market rates for similar borrowings. Such funds include all categories of debt and debentures in the table above.
Subordinated borrowings. The Company utilizes a pricing service along with internal models to estimate the valuation of its junior subordinated debentures. The junior subordinated debentures re-price every 90 days.
Off-balance-sheet financial instruments. Off-balance-sheet financial instruments include standby letters of credit and other financial guarantees and commitments are considered immaterial to the Company’s financial statements.
55
NOTE 11. SUBSEQUENT EVENTS
There were no significant subsequent events between March 31, 2018 and through the date the financial statements are available to be issued.
56
ITEM 2. MANAGEMENT’S DISCUSSION AND ANALYSIS OF FINANCIAL CONDITION AND RESULTS OF OPERATIONS
GENERAL
Management’s discussion and analysis of financial condition and results of operations is intended to assist in understanding the financial condition and results of operations of the Company. The following discussion and analysis should be read in conjunction with the Company’s consolidated financial statements and the notes thereto appearing in Part I, Item 1 of this document and with the Company’s consolidated financial statements and the notes thereto and Management’s Discussion and Analysis of Financial Condition and Results of Operations included in the Company's 2017 Annual Report on Form 10-K. In the following discussion, income statement comparisons are against the same period of the previous year and balance sheet comparisons are against the previous fiscal year-end, unless otherwise noted. Operating results discussed herein are not necessarily indicative of the results for the full year 2018 or any future period. In management’s discussion and analysis of financial condition and results of operations, certain reclassifications have been made to make prior periods comparable.
Bar Harbor Bankshares (“the Company”, “we”, “our”, or “us”) is the parent of Bar Harbor Bank & Trust (“the Bank”), a true community bank in New England with branches in Maine, New Hampshire and Vermont. As a true community bank, the Company recognizes, appreciates, and supports the unique people and cultures in the places we call home.
The Company’s corporate goal is to be among the most profitable banks in New England, and its business model is centered on the following:
• | Employee and customer experience is the foundation of superior performance, which leads to significant financial benefit to shareholders |
• | Geography, heritage and performance are key while remaining true to a community culture |
• | Strong commitment to risk management while balancing growth and earnings |
• | Service and sales driven culture with a focus on core business growth |
• | Investment in processes, products, technology, training, leadership and infrastructure |
• | Expansion of the Company’s brand and business to deepen market presence |
• | Opportunity and growth for existing employees while adding catalyst recruits across all levels of the Company |
Shown below is a profile of the Company as of March 31, 2018:
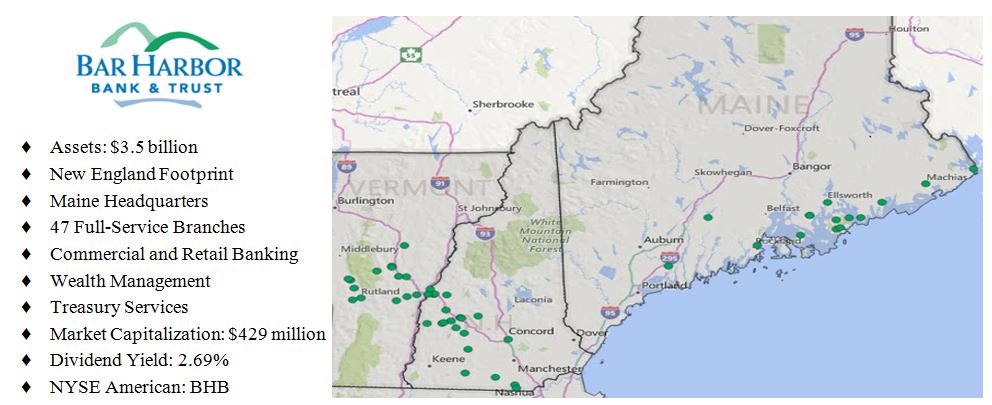
57
FORWARD-LOOKING STATEMENTS
Certain statements contained in this document that are not historical facts may constitute forward-looking statements within the meaning of Section 27A of the Securities Act of 1933, as amended ("Securities Act"), and Section 21E of the Securities Exchange Act of 1934, as amended ("Exchange Act"), and are intended to be covered by the safe harbor provisions of the Private Securities Litigation Reform Act of 1995. When used in this Form 10-Q the words "may," "will," "should," "could," "would," "plan," "potential," "estimate," "project," "believe," "intend," "anticipate," "expect," "target" and similar expressions are intended to identify forward-looking statements, but these terms are not the exclusive means of identifying forward-looking statements. These forward-looking statements are subject to significant risks, assumptions and uncertainties, including among other things, changes in general economic and business conditions, increased competitive pressures, changes in the interest rate environment, legislative and regulatory change, changes in the financial markets, and other risks and uncertainties disclosed from time to time in documents that the Company files with the Securities and Exchange Commission, including but not limited to those discussed in the section titled "Risk Factors" in the Company's Annual Report on Form 10-K for the fiscal year ended December 31, 2017. Because of these and other uncertainties, the Company’s actual results, performance or achievements, or industry results, may be materially different from the results indicated by these forward-looking statements. In addition, the Company’s past results of operations do not necessarily indicate future results. You should not place undue reliance on any of the forward-looking statements, which speak only as of the dates on which they were made. The Company is not undertaking an obligation to update forward-looking statements, even though its situation may change in the future, except as required under federal securities law. The Company qualifies all of its forward-looking statements by these cautionary statements.
58
SELECTED FINANCIAL DATA
The following summary data is based in part on the consolidated financial statements and accompanying notes and other information appearing elsewhere in this or prior Forms 10-Q.
Three Months Ended March 31, | ||||||||
2018 | 2017 | |||||||
PER SHARE DATA | ||||||||
Net earnings, diluted | $ | 0.50 | $ | 0.29 | ||||
Adjusted earnings, diluted (1) (2) | 0.52 | 0.43 | ||||||
Total book value | 22.78 | 22.17 | ||||||
Tangible book value (2) | 15.78 | 15.07 | ||||||
Market price at period end | 27.72 | 33.08 | ||||||
Dividends | 0.19 | 0.19 | ||||||
PERFORMANCE RATIOS (3) | ||||||||
Return on assets | 0.90 | % | 0.50 | % | ||||
Adjusted return on assets (1) (2) | 0.93 | 0.74 | ||||||
Return on equity | 9.01 | 5.34 | ||||||
Adjusted return on equity (1) (2) | 9.31 | 7.88 | ||||||
Adjusted return on tangible equity (1) (2) | 13.72 | 12.27 | ||||||
Net interest margin, fully taxable equivalent (FTE) (2)(4) | 2.97 | 3.11 | ||||||
Net interest margin (FTE), excluding purchased loan accretion (2)(4) | 2.85 | 3.01 | ||||||
Efficiency ratio (2) | 60.44 | 61.21 | ||||||
GROWTH (Year-to-date) | ||||||||
Total commercial loans, (organic annualized) (2) | 2.2 | % | 20.0 | % | ||||
Total loans, (organic annualized) (2) | (3.4 | ) | 13.3 | |||||
Total deposits, (organic annualized) (2) | (1.8 | ) | (10.2 | ) | ||||
FINANCIAL DATA (In millions) | ||||||||
Total assets | $ | 3,511 | $ | 3,427 | ||||
Total earning assets | 3,221 | 3,139 | ||||||
Total investments | 757 | 767 | ||||||
Total loans | 2,464 | 2,372 | ||||||
Allowance for loan losses | 13 | 11 | ||||||
Total goodwill and intangible assets | 108 | 109 | ||||||
Total deposits | 2,341 | 2,174 | ||||||
Total shareholders' equity | 352 | 341 | ||||||
Net income | 8 | 4 | ||||||
Adjusted income (2) | 8 | 6 | ||||||
ASSET QUALITY AND CONDITION RATIOS | ||||||||
Net charge-offs (current quarter annualized)/average loans | 0.07 | % | 0.06 | % | ||||
Allowance for loan losses/total loans | 0.51 | 0.46 | ||||||
Loans/deposits | 105 | 109 | ||||||
Shareholders' equity to total assets | 10.03 | 9.95 | ||||||
Tangible shareholders' equity to tangible assets (2) | 7.17 | 6.99 | ||||||
59
_____________________________________
(1) | Adjusted measurements are non-GAAP financial measures that are adjusted to exclude net non-operating charges primarily related to acquisitions, and gain on sale of securities. Refer to the Reconciliation of Non-GAAP Financial Measures section of Management's Discussion and Analysis for additional information. |
(2) | Non-GAAP financial measure. |
(3) | All performance ratios are annualized and are based on average balance sheet amounts, where applicable. |
(4) | Fully taxable equivalent considers the impact of tax advantaged investment securities and loans. |
60
BAR HARBOR BANKSHARES | |||||||||||||||||||||||
CONSOLIDATED LOAN & DEPOSIT ANALYSIS - UNAUDITED | |||||||||||||||||||||||
LOAN ANALYSIS | |||||||||||||||||||||||
Annualized Growth % | |||||||||||||||||||||||
(in thousands) | March 31, 2018 | December 31, 2017 | September 30, 2017 | June 30, 2017 | March 31, 2017 | March 31, 2018 | |||||||||||||||||
Commercial real estate | $ | 824,721 | $ | 826,746 | $ | 793,572 | $ | 738,584 | $ | 779,635 | (1.0 | )% | |||||||||||
Commercial and industrial | 301,811 | 293,707 | 270,759 | 269,960 | 236,526 | 11.0 | |||||||||||||||||
Total commercial loans | 1,126,532 | 1,120,453 | 1,064,331 | 1,008,544 | 1,016,161 | 2.2 | |||||||||||||||||
Residential real estate | 1,132,977 | 1,155,682 | 1,152,628 | 1,160,832 | 1,155,436 | (7.9 | ) | ||||||||||||||||
Consumer | 119,516 | 123,762 | 125,590 | 127,229 | 127,370 | (13.7 | ) | ||||||||||||||||
Tax exempt and other | 85,394 | 85,716 | 86,313 | 80,042 | 73,469 | (1.5 | ) | ||||||||||||||||
Total loans | $ | 2,464,419 | $ | 2,485,613 | $ | 2,428,862 | $ | 2,376,647 | $ | 2,372,436 | (3.4 | )% | |||||||||||
DEPOSIT ANALYSIS | |||||||||||||||||||||||
Annualized Growth % | |||||||||||||||||||||||
(in thousands) | March 31, 2018 | December 31, 2017 | September 30, 2017 | June 30, 2017 | March 31, 2017 | March 31, 2018 | |||||||||||||||||
Demand | $ | 342,192 | $ | 349,055 | $ | 357,398 | $ | 332,339 | $ | 349,896 | (7.9 | )% | |||||||||||
NOW | 448,992 | 466,610 | 442,085 | 451,171 | 242,876 | (15.1 | ) | ||||||||||||||||
Savings | 361,591 | 364,799 | 373,118 | 360,306 | 511,091 | (3.5 | ) | ||||||||||||||||
Money Market | 303,777 | 305,275 | 300,398 | 285,312 | 349,491 | (2.0 | ) | ||||||||||||||||
Total non-maturity deposits | 1,456,552 | 1,485,739 | 1,472,999 | 1,429,128 | 1,453,354 | (7.9 | ) | ||||||||||||||||
Total time deposits | 884,848 | 866,346 | 802,110 | 783,876 | 720,899 | 8.5 | |||||||||||||||||
Total deposits | $ | 2,341,400 | $ | 2,352,085 | $ | 2,275,109 | $ | 2,213,004 | $ | 2,174,253 | (1.8 | )% | |||||||||||
61
AVERAGE BALANCES AND AVERAGE YIELDS/RATES
The following table presents average balances and an analysis of average rates and yields on an annualized fully taxable equivalent basis for the periods included:
Three Months Ended March 31, | ||||||||||||||
2018 | 2017 | |||||||||||||
(in thousands) | Average Balance | Yield/Rate (FTE basis) (3) | Average Balance | Yield/Rate (FTE basis) (3) | ||||||||||
Assets | ||||||||||||||
Commercial real estate | $ | 819,531 | 4.41 | % | $ | 762,676 | 4.24 | % | ||||||
Commercial and industrial | 380,029 | 4.41 | 293,903 | 4.73 | ||||||||||
Residential | 1,147,010 | 3.87 | 1,161,911 | 3.74 | ||||||||||
Consumer | 121,467 | 4.47 | 127,850 | 4.16 | ||||||||||
Total loans (1) | 2,468,037 | 4.16 | 2,346,340 | 4.00 | ||||||||||
Securities and other (2) | 765,328 | 3.16 | 746,653 | 3.01 | ||||||||||
Total earning assets | 3,233,365 | 3.92 | % | 3,092,993 | 3.76 | % | ||||||||
Other non-earning assets | 278,436 | 246,629 | ||||||||||||
Total assets | $ | 3,511,801 | $ | 3,339,622 | ||||||||||
Liabilities | ||||||||||||||
NOW | $ | 447,026 | 0.34 | % | $ | 456,967 | 0.14 | % | ||||||
Savings | 362,508 | 0.18 | 340,555 | 0.14 | ||||||||||
Money market | 305,105 | 0.68 | 334,225 | 0.40 | ||||||||||
Time deposits | 857,796 | 1.39 | 666,267 | 0.98 | ||||||||||
Total interest bearing deposits | 1,972,435 | 0.82 | 1,798,014 | 0.52 | ||||||||||
Borrowings | 819,576 | 1.80 | 856,328 | 1.25 | ||||||||||
Total interest-bearing liabilities | 2,792,011 | 1.11 | % | 2,654,342 | 0.76 | % | ||||||||
Non-interest-bearing demand deposits | 339,349 | 350,497 | ||||||||||||
Other non-earning liabilities | 29,000 | 19,334 | ||||||||||||
Total liabilities | 3,160,360 | 3,024,173 | ||||||||||||
Total shareholders' equity | 351,441 | 315,449 | ||||||||||||
Total liabilities and shareholders' equity | $ | 3,511,801 | $ | 3,339,622 | ||||||||||
Net interest spread | 2.81 | % | 3.00 | % | ||||||||||
Net interest margin | 2.97 | 3.11 | ||||||||||||
_____________________________________
(1) | The average balances of loans include nonaccrual loans and deferred fees and costs. |
(2) | The average balance for securities available for sale is based on amortized cost. The average balance of equity also reflects this adjustment. |
(3) | Fully taxable equivalent considers the impact of tax advantaged investment securities and loans. |
62
NON-GAAP FINANCIAL MEASURES
This document contains certain non-GAAP financial measures in addition to results presented in accordance with accounting principles generally accepted in the United States of America ("GAAP"). These non-GAAP measures are intended to provide the reader with additional supplemental perspectives on operating results, performance trends, and financial condition. Non-GAAP financial measures are not a substitute for GAAP measures; they should be read and used in conjunction with the Company's GAAP financial information. A reconciliation of non-GAAP financial measures to GAAP measures is provided below. In all cases, it should be understood that non-GAAP measures do not depict amounts that accrue directly to the benefit of shareholders. An item which management excludes when computing non-GAAP adjusted earnings can be of substantial importance to the Company's results for any particular quarter or year. The Company's non-GAAP adjusted earnings information set forth is not necessarily comparable to non- GAAP information which may be presented by other companies. Each non-GAAP measure used by the Company in this report as supplemental financial data should be considered in conjunction with the Company's GAAP financial information.
The Company utilizes the non-GAAP measure of adjusted earnings in evaluating operating trends, including components for adjusted revenue and expense. These measures exclude amounts which the Company views as unrelated to its normalized operations, including securities gains/losses, acquisition costs, restructuring costs, legal settlements, and systems conversion costs. Non-GAAP adjustments are presented net of an adjustment for income tax expense.
The Company also calculates adjusted earnings per share based on its measure of adjusted earnings. The Company views these amounts as important to understanding its operating trends, particularly due to the impact of accounting standards related to acquisition activity. Analysts also rely on these measures in estimating and evaluating the Company's performance. Management also believes that the computation of non-GAAP adjusted earnings and adjusted earnings per share may facilitate the comparison of the Company to other companies in the financial services industry. The Company also adjusts certain equity related measures to exclude intangible assets due to the importance of these measures to the investment community.
63
RECONCILIATION OF NON-GAAP FINANCIAL MEASURES
The following table summarizes the reconciliation of non-GAAP items recorded for the time periods and dates indicated:
Three Months Ended March 31, | |||||||||
(in thousands) | 2018 | 2017 | |||||||
Net income | $ | 7,812 | $ | 4,211 | |||||
Adj: Loss on sale of fixed assets, net | — | 95 | |||||||
Adj: Acquisition, conversion and other expenses | 335 | 3,112 | |||||||
Adj: Income taxes (1) | (81 | ) | (1,205 | ) | |||||
Adj: Tax reform charge | — | — | |||||||
Total adjusted income (2) | (A) | $ | 8,066 | $ | 6,213 | ||||
Net-interest income | (B) | $ | 23,158 | $ | 21,372 | ||||
Plus: Non-interest income | 6,238 | 5,946 | |||||||
Total Revenue | 29,396 | 27,318 | |||||||
Adj: Net security gains | — | — | |||||||
Total adjusted revenue (2) | (C) | $ | 29,396 | $ | 27,318 | ||||
Total non-interest expense | $ | 18,852 | $ | 20,831 | |||||
Less: Loss on sale of fixed assets, net | — | (95 | ) | ||||||
Less: Acquisition expense | (335 | ) | (3,112 | ) | |||||
Adjusted non-interest expense (2) | (D) | $ | 18,517 | $ | 17,624 | ||||
(in millions) | |||||||||
Total average earning assets | (E) | $ | 3,233 | $ | 3,093 | ||||
Total average assets | (F) | 3,512 | 3,340 | ||||||
Total average shareholders' equity | (G) | 351 | 315 | ||||||
Total average tangible shareholders' equity (2) (3) | (H) | 243 | 206 | ||||||
Total tangible shareholders' equity, period-end (2)(3) | (I) | 244 | 232 | ||||||
Total tangible assets, period-end (2) (3) | (J) | 3,403 | 3,318 | ||||||
(in thousands) | |||||||||
Total common shares outstanding, period-end | (K) | 15,459 | 15,385 | ||||||
Average diluted shares outstanding | (L) | 15,553 | 14,591 | ||||||
Adjusted earnings per share, diluted | (A/L) | $ | 0.52 | $ | 0.43 | ||||
Tangible book value per share, period-end (2) | (I/K) | 15.78 | 15.07 | ||||||
Securities adjustment, net of tax | (M) | (10,232 | ) | (1,357 | ) | ||||
Tangible book value per share, excluding securities adjustment | (I+M)/K | 16.44 | 15.16 | ||||||
Total tangible shareholders' equity/total tangible assets(2) | (H/J) | 7.17 | 6.99 | ||||||
64
Performance ratios | |||||||||
GAAP return on assets | 0.90 | % | 0.50 | % | |||||
Adjusted return on assets (2) | (A/F) | 0.93 | 0.74 | ||||||
GAAP return on equity | 9.01 | 5.34 | |||||||
Adjusted return on equity (2) | (A/G) | 9.31 | 7.88 | ||||||
Adjusted return on tangible equity (2) (4) | (A/I) | 13.72 | 12.27 | ||||||
Efficiency ratio (2)(5) | (D-O-Q)/(C+N) | 60.44 | 61.21 | ||||||
Net interest margin | (B+P)/E | 2.97 | 3.11 | ||||||
Supplementary data (in thousands) | |||||||||
Taxable equivalent adjustment for efficiency ratio | (N) | $ | 645 | $ | 977 | ||||
Franchise taxes included in non-interest expense | (O) | 152 | 126 | ||||||
Tax equivalent adjustment for net interest margin | (P) | 503 | 754 | ||||||
Intangible amortization | (Q) | 207 | 180 | ||||||
_____________________________________
(1) | Assumes a marginal tax rate of 24.15% in 2018 and 37.57% in 2017. |
(2) | Non-GAAP financial measure. |
(3) | Total tangible shareholders' equity is computed by taking total shareholders' equity less the intangible assets at period-end. Total tangible assets is computed by taking total assets less the intangible assets at period-end. |
(4) | Adjusted return on tangible equity are computed by dividing the total core income adjusted for the tax-effected amortization of intangible assets, assuming a marginal rate of 24.15% in 2018 and 37.57% in 2017, by tangible equity. |
(5) | Efficiency ratio is computed by dividing total core tangible non-interest expense by the sum of total net interest income on a fully taxable equivalent basis and total core non-interest income. The Company uses this non-GAAP measure to provide important information about its operating efficiency. |
65
FINANCIAL SUMMARY
The Company reported first quarter 2018 net income of $7.8 million, or 50 cents per diluted share, compared with $4.2 million, or 29 cents per diluted share in the same quarter of 2017. Adjusted earnings in the first quarter 2018 totaled $8.1 million, or 52 cents per share, up 21% from $6.2 million, or 43 cents in the first quarter of 2017. As discussed in an earlier section, the Company uses the non-GAAP measure of adjusted earnings, and related metrics, to evaluate the results of its operations.
First quarter financial highlights include the following (comparisons are to the first quarter 2017 unless otherwise stated):
• | $29.4 million vs. $27.3 million in total revenue (non-GAAP measure) |
• | 8% increase in net interest income |
• | 11% annualized commercial and industrial loan growth |
• | 0.93% adjusted return on assets (non-GAAP measure) |
• | 9.31% adjusted return on equity (non-GAAP measure) |
In the first quarter 2018, the Company achieved both revenue and net income expectations. Total revenue increased 8% and adjusted earnings per share were up 21% on a year-over-year basis as the Company expanded its market presence throughout Northern New England. The Company continued to deliver profitable growth during the first quarter through the use of various revenue streams coupled with disciplined expense management.
The Company’s management teams were active and performed very well in the first quarter. While some loan closings were delayed during the first quarter, our loan pipelines remain strong. The Bank opened over 3,200 new deposit accounts while branch colleagues came together under new leadership, and the Company’s wealth management team continued to drive significant fee income.
In the first quarter of 2018 many growth and strategic initiatives were launched throughout the Company including:
• | Expanded Treasury Management Services platform. |
• | Brand consolidation of Retail and Commercial business lines under the name Bar Harbor Bank and Trust and common leadership. |
• | Migration of the Company’s two trust services for Bar Harbor Trust and Charter Trust onto a common operating platform. |
The expansion of the Company’s Treasury Management Services platform is expected to be a significant contributor to fee revenue and deposit growth in 2018. While the Company has preserved its banking franchise and banking culture since the acquisition of Lake Sunapee Bank Group, the consolidation of the Company’s brand is expected to bring value from stream-lining businesses processes to delivering products more efficiently. Fee income remains a focus of the Company and wealth management is a strong source of these revenue streams. The combined platform is expected to improve operational efficiencies and deepen customer relationships, allowing for further market penetration and cross-sell opportunities which are central themes to our sales objectives.
66
COMPARISON OF OPERATING RESULTS FOR THE THREE MONTHS ENDED MARCH 31, 2018 AND 2017
Summary
Net income in the first quarter 2018 increased $3.6 million to $7.8 million from $4.2 million in the same quarter of 2017. Net income in 2017 was reduced by $2.4 million related to acquisition and conversion activities. Adjusted earnings in the first quarter 2018 increased to $8.1 million from $6.2 million in the same quarter of 2017 on an 8% increase in net interest and realized operational efficiencies.
The return on assets ratio during the first quarter 2018 was 0.90% compared to 0.50% in the prior year. The prior year ratio includes the impact of $3.1 million of acquisition costs. The Company’s adjusted return on assets ratio improved 19 basis points over the prior year to 0.93% and reflects higher net interest income, wealth management and customer service fee income. Return on equity in the first quarter 2018 was 9.01% compared to 5.34% in the prior year. Adjusted return on equity in the first quarter increased to 9.31% from 7.88% in the prior year due to higher net income and improved operational efficiencies. The increase in profitability reflects the Company’s focus and realization of the earn-back period of the acquisition made in 2017.
Net Interest Income
First quarter net interest income increased by $1.8 million to $23.2 million in 2018 compared with $21.4 million in 2017 despite higher funding costs. The 8% increase in 2018 is primarily due to higher total revenue driven by earning asset growth in average balances and related yields. Interest income from earnings assets increased to the Company’s highest quarter of $30.8 million with a yield of 3.92%.
Net interest margin for the first quarter of 2018 was 2.97%, compared with 3.11% in the first quarter of 2017.The ratio includes a 5 basis point reduction due to lower tax equivalency adjustments. Purchased loan accretion increased net interest margin by 12 basis points in the first quarter 2018 compared to 10 basis points in same period of 2017. The Company continues to address margin compression by organically shifting its liability sensitivity position by rebalancing deposits and alternative borrowings while originating variable rate loans. This strategy results in short-term incremental costs, but secures the Company’s longer term net interest margin goals and funding requirements.
Non-Interest Income
Non-interest income was $6.2 million in the first quarter of 2018 as compared to $5.9 million in the same quarter of 2017. The increase is principally due to higher customer service fees and trust and investment management fee income due to higher transaction volume.
Loan Loss Provision
The provision for loan losses was $795 thousand in the first quarter of 2018 and 2017. The amount of the provision exceeded net charge-offs in all periods since the first quarter of 2017 resulting from loan growth. The provision for loan losses is a charge to earnings in an amount sufficient to maintain the allowance for loan losses at a level deemed adequate by the Company. It is an estimate of the probable and estimable loan losses in the portfolio as of period-end.
Non-Interest Expense
Non-interest expense decreased to $18.9 million in the first quarter 2018 compared from $20.8 million in 2017. The decrease is principally due to lower acquisition, conversion and other expenses which totaled $335 thousand in 2018 compared to $3.1 million in 2017. These costs in 2018 are primarily from activities associated with the wealth management system conversion, while costs in 2017 are related to the acquisition. The efficiency ratio was 60% for the quarter compared to 61% in the first quarter of 2017. That improvement includes realized cost savings from the acquisition balanced with higher salary and benefit expense due to seasonally higher employer payroll taxes and recent strategic new hires.
67
Income Tax Expense
The effective tax was 20% in the first quarter of 2018 compared to 26% in the same quarter of 2017. The rate in 2018 benefited from the 14% reduction in the Federal tax rate due to the Tax Reform and Jobs Act of 2017. The rate in 2017 benefited from lower taxable income related to acquisition related expenses.
COMPARISON OF FINANCIAL CONDITION AT MARCH 31, 2018 AND DECEMBER 31, 2017
Summary
Total assets measured $3.5 billion at the end of first quarter 2018 compared with $3.6 billion at year end 2017. The decrease is primarily due to decreases in loan balances and excess cash used to pay-down borrowings. The loan to deposit ratio improved to 105% from 106% at year-end 2017 due to seasonally lower loan growth. Asset quality remains strong as the ratio of net charge-offs to total loans has been close to zero and the ratio of allowance for loan losses to total loans has been in the 50 basis point range over the past five quarters. Excluding security adjustments, the Company's tangible book value (non-GAAP measure) per share increased to $16.44 from $16.05 at the end of 2017 primarily due to strong first quarter earnings.
Securities
Total securities increased $1.3 million during the first quarter to $756.7 million, which includes purchases of $30.5 million of shorter duration mortgage-backed securities guaranteed by US Government-sponsored enterprises and $5.9 million of corporate bonds. That increase was offset by $24.4 million of maturities, calls and pay-downs of amortizing securities and $10.7 reduction in fair value. The reduction in fair value was largely due to a decline in bond prices tied to longer term interest rates during the first quarter 2018. The weighted average yield on the Company’s security portfolio at the end the first quarter 2018 was 3.16% compared to 3.06% at year-end 2017. At March 31, 2018, the securities held by the Company had an average life 5.8 years and a duration of 4.3 years compared to 5.2 years and 4.1 years at the end of 2017, respectively.
Loans
Total loans decreased $21.2 million during the first quarter 2018 compared to year-end 2017 as certain loan closings were delayed into the second quarter. While ending balance in the first quarter was down compared with year-end 2018, the quarterly average balance was up $34 million. Despite the overall decrease in loans, commercial and industrial loans grew 11% on annualized basis reflecting the Company’s commitment to generating higher yields. Growth in total loans is expected to improve in the second quarter due to a strong pipeline, particularly in the Company’s commercial product lines. The total yield from loans increased 16 basis points over the first quarter 2017, which included the benefit of higher short-term rates. Loan yields increased across all product lines with the exception of commercial and industrial loans, which declined 32 basis points due to a lower tax equivalency adjustment on tax exempt loans related to the new 2018 Federal tax rate.
Asset Quality
Asset quality metrics remained favorable during the first quarter 2018 with a ratio of net charge-offs to total loans of 0.07%. The ratio of non-accruing loans to total loans increased to 0.83% at the end of the first quarter 2018 from 0.58% at year-end 2017 primarily due to one large residential relationship. Based on an impairment analysis, the entire carrying value of that obligation is expected to be recovered upon settlement.
The allowance for loan losses increased to $12.7 million during the first quarter 2018 from $12.3 million at year-end 2017 due to higher specific reserves on impaired loans. While overall loan balances decreased during the first quarter, there was no related benefit to the allowance as the majority of the decrease was experienced the in acquired loan portfolios. Under accounting standards for business combinations, acquired loans are recorded at fair value with no allowance for loan losses on the date of acquisition. An allowance for loan losses is recorded by the Company for the emergence of new probable and estimable losses on acquired loans which were not impaired as of the acquisition date.
Deposits
Non-maturity (“Core”) deposits decreased $29.2 million to $1.457 billion from $1.486 billion at year-end 2017. The Bank's deposit market area has been seasonal with lower deposits in the winter and spring months and higher deposits in the summer and autumn months. Core deposits are still the primary funding source for loans, which declined during
68
the first quarter as described above. Time deposits increased $18.5 million during the first quarter, which reflected the Company’s strategy to target funding durations and support the capital leverage initiative. The yield from total deposits increased to 0.82% in the first quarter 2018 from 0.52% in the same period of 2017 reflecting the impact of several Federal Fund rate increases.
Borrowings
Total borrowings decreased by $44.5 million during the first quarter from $829.7 million at year-end as excess cash was used to pay-down mostly short term FHLB advances. Due to the same reason as core deposits, the yield on borrowings increased to 1.80% in the first quarter 2018 compared with the 1.25% for the same period of 2017.
Equity
Equity was $352.2 million at the end of the first quarter 2018 compared with $354.6 million at year-end 2017. Net after-tax fair value adjustments to securities reduced equity by $10.2 in the first quarter 2018 compared to $1.7 million at year-end 2017. Excluding fair value adjustments, tangible equity (non-GAAP measure) increased to $254.2 million in first quarter from $247.9 million at year-end 2017, or an increase of 10.1% an annualized basis. The Company evaluates changes in tangible book value, a non-GAAP financial measure, which is a commonly considered valuation metric used by the investment community and which parallels some regulatory capital measures. The Company and the Bank remained "well capitalized" under regulatory guidelines at period-end.
Liquidity and Cash Flows
Liquidity is measured by the Company’s ability to meet short-term cash needs at a reasonable cost or minimal loss. The Company seeks to obtain favorable sources of liabilities and to maintain prudent levels of liquid assets in order to satisfy varied liquidity demands. Besides serving as a funding source for maturing obligations, liquidity provides
flexibility in responding to customer initiated needs. Many factors affect the Company’s ability to meet liquidity needs, including variations in the markets served by its network of offices, its mix of assets and liabilities, reputation and credit standing in the marketplace, and general economic conditions.
The Bank actively manages its liquidity position through target ratios established under its Asset Liability Management Policy. Continual monitoring of these ratios, by using historical data and through forecasts under multiple rate and stress scenarios, allows the Bank to employ strategies necessary to maintain adequate liquidity. The Bank’s policy is to maintain a liquidity position of at least 4% of total assets. A portion of the Bank’s deposit base has been historically seasonal in nature, with balances typically declining in the winter months through late spring, during which period the Bank’s liquidity position tightens.
The Bank also had capacity to borrow funds on a secured basis utilizing the Borrower in Custody program and the Discount Window at the Federal Reserve Bank of Boston (the “FRB”). At March 31, 2018, the Bank’s available secured line of credit at the FRB stood at $118.0 million or 3.4% of the Bank’s total assets. The Bank also has access to the national brokered deposit market, and has used this funding source to bolster its on balance sheet liquidity position.
The Bank maintains a liquidity contingency plan approved by the Bank’s Board of Directors. This plan addresses the steps that would be taken in the event of a liquidity crisis, and identifies other sources of liquidity available to the Company. Company management believes the level of liquidity is sufficient to meet current and future funding requirements. However, changes in economic conditions, including consumer savings habits and availability or access to the brokered deposit market could potentially have a significant impact on the Company’s liquidity position.
Off-Balance Sheet Arrangements
The Company is, from time to time, a party to certain off-balance sheet arrangements that have or are reasonably likely to have a current or future effect on the Company's financial condition, changes in financial condition, revenues or expenses, results of operations, liquidity, capital expenditures or capital resources, that may be material to investors.
The Company’s off-balance sheet arrangements are limited to standby letters of credit whereby the Bank guarantees the obligations or performance of certain customers. These letters of credit are sometimes issued in support of third-party debt. The risk involved in issuing standby letters of credit is essentially the same as the credit risk involved in
69
extending loan facilities to customers, and they are subject to the same origination, portfolio maintenance and management procedures in effect to monitor other credit products. The amount of collateral obtained, if deemed necessary by the Bank upon issuance of a standby letter of credit, is based upon management's credit evaluation of the customer.
The Company’s off-balance sheet arrangements have not changed materially since previously reported in our Annual Report on Form 10-K for the year ended December 31, 2017.
70
APPLICATION OF CRITICAL ACCOUNTING POLICIES AND ACCOUNTING ESTIMATES, AND RECENT ACCOUNTING PRONOUNCEMENTS
The Company’s significant accounting policies are described in Note 1 to the consolidated financial statements in this Form 10-Q and in the most recent Form 10-K. Please see those policies in conjunction with this discussion. The accounting and reporting policies followed by the Company conform, in all material respects, to accounting principles generally accepted in the United States and to general practices within the financial services industry. The preparation of financial statements in conformity with GAAP requires management to make estimates and assumptions that affect the amounts reported in the financial statements and accompanying notes. While the Company bases estimates on historical experience, current information and other factors deemed to be relevant, actual results could differ from those estimates.
The SEC defines “critical accounting policies” as those that require application of management’s most difficult, subjective or complex judgments, often as a result of the need to make estimates about the effect of matters that are inherently uncertain and may change in future periods. Please see those policies in conjunction with this discussion. Management believes that the following policies would be considered critical under the SEC’s definition:
Allowance for Loan Losses: The allowance for loan losses represents probable credit losses that are inherent in the loan portfolio at the financial statement date and which may be estimated. Management uses historical information, as well as current economic data, to assess the adequacy of the allowance for loan losses as it is affected by changing economic conditions and various external factors, which may impact the portfolio in ways currently unforeseen. Although management believes that it uses appropriate available information to establish the allowance for loan losses, future additions to the allowance may be necessary if certain future events occur that cause actual results to differ from the assumptions used in making the evaluation. Conditions in the local economy and real estate values could require the Company to increase provisions for loan losses, which would negatively impact earnings.
Acquired Loans: Loans that the Company acquired in business combinations are initially recorded at fair value with no carryover of the related allowance for credit losses. Determining the fair value of the loans involves estimating the amount and timing of principal and interest cash flows initially expected to be collected on the loans and discounting those cash flows at an appropriate market rate of interest. Going forward, the Company continues to evaluate reasonableness of expectations for the timing and the amount of cash to be collected. Subsequent decreases in expected cash flows may result in changes in the amortization or accretion of fair market value adjustments, and in some cases may result in the loan being considered impaired. For collateral dependent loans with deteriorated credit quality, the Company estimates the fair value of the underlying collateral of the loans. These values are discounted using market derived rates of return, with consideration given to the period of time and costs associated with the foreclosure and disposition of the collateral.
Income Taxes: Significant management judgment is required in determining income tax expense and deferred tax assets and liabilities. The Company uses the asset and liability method of accounting for income taxes in which deferred tax assets and liabilities are established for the temporary differences between the financial reporting basis and the tax basis of the Company's assets and liabilities. The realization of the net deferred tax asset generally depends upon future levels of taxable ordinary income and taxable capital gain income. A valuation allowance would be established for deferred tax assets that management estimates are more likely than not to be unrealizable based on available evidence at the time the estimate is made.
Goodwill and Identifiable Intangible Assets: Goodwill and identifiable intangible assets are recorded as a result of business acquisitions and combinations. These assets are evaluated for impairment annually or whenever events or changes in circumstances indicate the carrying value of these assets may not be recoverable. When these assets are evaluated for impairment, if the carrying amount exceeds fair value, an impairment charge is recorded to income. The fair value is based on observable market prices, when practicable. Other valuation techniques may be used when market prices are unavailable, including estimated discounted cash flows and analysis of market pricing multiples. These types of analyses contain uncertainties because they require management to make assumptions and to apply judgment to estimate industry economic factors and the profitability of future business strategies. In the event of future changes in fair value, the Company may be exposed to an impairment charge that could be material.
71
Determination of Other-Than-Temporary Impairment of Securities: The Company evaluates debt and equity securities within the Company's available for sale for other-than-temporary impairment (OTTI), at least quarterly. If the fair value of a debt security is below the amortized cost basis of the security, OTTI is required to be recognized if any of the following are met: (1) the Company intends to sell the security; (2) it is more likely than not that the Company will be required to sell the security before recovery of its amortized cost basis; or (3) for debt securities, the present value of expected cash flows is not sufficient to recover the entire amortized cost basis. For all impaired debt securities that the Company intends to sell, or more likely than not will be required to sell, the full amount of the loss is recognized as OTTI through earnings. Credit-related OTTI for all other impaired debt securities is recognized through earnings. Noncredit related OTTI for such debt securities is recognized in other comprehensive income, net of applicable taxes. In evaluating its marketable equity securities portfolios for OTTI, the Company considers its intent and ability to hold an equity security to recovery of its cost basis in addition to various other factors, including the length of time and the extent to which the fair value has been less than cost and the financial condition and near term prospects of the issuer. Any OTTI on marketable equity securities is recognized immediately through earnings. Should actual factors and conditions differ materially from those expected by management, the actual realization of gains or losses on investment securities could differ materially from the amounts recorded in the financial statements.
Fair Value of Financial Instruments: The Company uses fair value measurements to record fair value adjustments to certain financial instruments and to determine fair value disclosures. Trading assets, securities available for sale, and derivative instruments are recorded at fair value on a recurring basis. Additionally, from time to time, the Company may be required to record at fair value other assets on a non-recurring basis, or to establish a loss allowance or write-down based on the fair value of impaired assets. Further, the notes to financial statements include information about the extent to which fair value is used to measure assets and liabilities, the valuation methodologies used and its impact to earnings. For financial instruments not recorded at fair value, the notes to financial statements disclose the estimate of their fair value. Due to the judgments and uncertainties involved in the estimation process, the estimates could result in materially different results under different assumptions and conditions.
72
ITEM 3. QUANTITATIVE AND QUALITATIVE DISCLOSURES ABOUT MARKET RISK
Market Risk
Market risk is the risk of loss in a financial instrument arising from adverse changes in market rates/prices, such as interest rates, foreign currency exchange rates, commodity prices and equity prices. Interest rate risk is the most significant market risk affecting the Company. Other types of market risk do not arise in the normal course of the Company’s business activities.
The responsibility for interest rate risk management oversight is the function of the Bank’s Asset and Liability Committee (“ALCO”), chaired by the Chief Financial Officer and composed of various members of senior management. ALCO meets regularly to review balance sheet structure, formulate strategies in light of current and expected economic conditions, adjust product prices as necessary, implement policy, monitor liquidity, and review performance against guidelines established to control exposure to the various types of inherent risk.
Interest Rate Risk: Interest rate risk can be defined as an exposure to movement in interest rates that could have an adverse impact on the Bank's net interest income. Interest rate risk arises from the imbalance in the re-pricing, maturity and or cash flow characteristics of assets and liabilities. Management's objectives are to measure, monitor and develop strategies in response to the interest rate risk profile inherent in the Bank's balance sheet. The objectives in managing the Bank's balance sheet are to preserve the sensitivity of net interest income to actual or potential changes in interest rates, and to enhance profitability through strategies that promote sufficient reward for understood and controlled risk.
The Bank's interest rate risk measurement and management techniques incorporate the re-pricing and cash flow attributes of balance sheet and off-balance sheet instruments as each relate to current and potential changes in interest rates. The level of interest rate risk, measured in terms of the potential future effect on net interest income, is determined through the use of modeling and other techniques under multiple interest rate scenarios. Interest rate risk is evaluated in depth on a quarterly basis and reviewed by ALCO and the Company’s Board of Directors.
The Bank's Asset Liability Management Policy, approved annually by the Bank’s Board of Directors, establishes interest rate risk limits in terms of variability of net interest income under rising, flat, and decreasing rate scenarios. It is the role of the ALCO to evaluate the overall risk profile and to determine actions to maintain and achieve a posture consistent with policy guidelines.
Interest Rate Sensitivity Modeling: The Bank utilizes an interest rate risk model widely recognized in the financial industry to monitor and measure interest rate risk. The model simulates the behavior of interest income and expense for all balance sheet and off-balance sheet instruments, under different interest rate scenarios together with a dynamic future balance sheet. Interest rate risk is measured in terms of potential changes in net interest income based upon shifts in the yield curve.
The interest rate risk sensitivity model requires that assets and liabilities be broken down into components as to fixed, variable, and adjustable interest rates, as well as other homogeneous groupings, which are segregated as to maturity and type of instrument. The model includes assumptions about how the balance sheet is likely to evolve through time and in different interest rate environments. The model uses contractual re-pricing dates for variable products, contractual maturities for fixed rate products, and product-specific assumptions for deposit accounts, such as money market accounts, that are subject to re-pricing based on current market conditions. Re-pricing margins are also determined for adjustable rate assets and incorporated in the model. Investment securities and borrowings with call provisions are examined on an individual basis in each rate environment to estimate the likelihood of a call. Prepayment assumptions for mortgage loans and mortgage-backed securities are developed from industry median estimates of prepayment speeds, based upon similar coupon ranges and degree of seasoning. Cash flows and maturities are then determined, and for certain assets, prepayment assumptions are estimated under different interest rate scenarios. Interest income and interest expense are then simulated under several hypothetical interest rate conditions including:
• | A flat interest rate scenario in which current prevailing rates are locked in and the only balance sheet fluctuations that occur are due to cash flows, maturities, new volumes, and re-pricing volumes consistent with this flat rate assumption; |
73
• | A 200 basis point rise or decline in interest rates applied against a parallel shift in the yield curve over a twelve-month horizon together with a dynamic balance sheet anticipated to be consistent with such interest rate changes; |
• | Various non-parallel shifts in the yield curve, including changes in either short-term or long-term rates over a twelve-month horizon, together with a dynamic balance sheet anticipated to be consistent with such interest rate changes; and |
• | An extension of the foregoing simulations to each of two, three, four and five year horizons to determine the interest rate risk with the level of interest rates stabilizing in years two through five. Even though rates remain stable during this two to five year time period, re-pricing opportunities driven by maturities, cash flow, and adjustable rate products will continue to change the balance sheet profile for each of the interest rate conditions. |
Changes in net interest income based upon the foregoing simulations are measured against the flat interest rate scenario and actions are taken to maintain the balance sheet interest rate risk within established policy guidelines.
As of March 31, 2018 interest rate sensitivity modeling results indicate that the Bank’s balance sheet was moderately liability sensitive over the one- and two-year horizons (i.e., moderately exposed to rising interest rates).
Assuming short-term and long-term interest rates decline 100 basis points from current levels (i.e., a parallel yield curve shift) and the Bank’s balance sheet structure and size remain at current levels, management believes net interest income will improve slightly over the one year horizon (+.3% versus the base case) while mildly deteriorating over the two-year horizon (-.7% versus the base case). Should the yield curve steepen as rates fall, the model suggests that accelerated earning asset prepayments will slow, resulting in a more stabilized level of net interest income. Management anticipates that moderate to strong earning asset growth will be needed to meaningfully increase the Bank’s current level of net interest income should both long-term and short-term interest rates decline in parallel.
Assuming the Bank’s balance sheet structure and size remain at current levels and the Federal Reserve increases short-term interest rates by 200 basis points with the balance of the yield curve shifting in parallel with these increases, management believes net interest income will decline moderately over the one and two-year horizons as increased funding costs outpace increases in earning asset yields. The interest rate sensitivity simulation model suggests that as interest rates rise, the Bank’s funding costs will initially re-price disproportionately with earning asset yields to a moderate degree. As funding costs begin to stabilize early in the third year of the simulation, the model suggests that the earning asset portfolios will continue to re-price at prevailing interest rate levels and cash flows from the Bank’s earning asset portfolios will be reinvested into higher yielding earning assets, resulting in a widening of spreads and a stabilization of net interest income over the three year horizon and beyond. Management believes moderate to strong earning asset growth will be necessary to meaningfully increase the current level of net interest income over the one-year and two-year horizons should short-term and long-term interest rates rise in parallel.
As compared to December 31, 2017, the year-one sensitivity in the down 100 basis points scenario increased for the quarter (+.1% prior, versus +.3% current). The year-two sensitivities in the down 100 basis points scenario changed going from +.3% to -.7%. In the year-one up 200 basis points scenario, results were unchanged from the prior quarter. Year-two, up 200 basis points shows a slightly more negative result (-8.1% prior, versus -9.2% current), although on balance, the current aggregate position is consistent with the prior quarter’s.
Despite six rate increases over the last 27 months, the Federal Reserve continues to maintain short-term interest rates at low levels, threatening net interest income. Net interest income exposure is also significantly affected by the shape and level of the U.S. Government securities and interest rate swap yield curve, and changes in the size and composition of the Bank’s loan, investment and deposit portfolios.
The preceding sensitivity analysis does not represent a Company forecast and should not be relied upon as being indicative of expected operating results. These hypothetical estimates are based upon numerous assumptions including: the nature and timing of interest rate levels and yield curve shape, prepayment speeds on loans and securities, deposit rates, pricing decisions on loans and deposits, reinvestment or replacement of asset and liability cash flows, and renegotiated loan terms with borrowers. While assumptions are developed based upon current economic and local
74
market conditions, the Company cannot make any assurances as to the predictive nature of these assumptions including how customer preferences or competitor influences might change.
As market conditions vary from those assumed in the sensitivity analysis, actual results may also differ due to: prepayment and refinancing levels deviating from those assumed; the impact of interest rate changes, caps or floors on adjustable rate assets; the potential effect of changing debt service levels on customers with adjustable rate loans; depositor early withdrawals and product preference changes; and other such variables. The sensitivity analysis also does not reflect additional actions that the Bank’s Senior Executive Team and Board of Directors might take in responding to or anticipating changes in interest rates, and the anticipated impact on the Bank’s net interest income.
The Bank engages an independent consultant to periodically review its interest rate risk position and the reasonableness of assumptions used, with periodic reports provided to the Bank’s Board of Directors. At March 31, 2018, there were no significant differences between the views of the independent consultant and management regarding the Bank’s interest rate risk exposure.
ITEM 4. CONTROLS AND PROCEDURES
a) | Disclosure controls and procedures. |
The principal executive officers, including the Chief Executive Officer and the Chief Financial Officer, based on their evaluation of disclosure controls and procedures (as defined in Exchange Act Rules 13a-15(e) and 15d-15(e)) as of the end of the period covered by this Quarterly Report on Form 10-Q, have concluded that the Company’s disclosure controls and procedures were effective as of March 31, 2018.
b) Changes in internal control over financial reporting.
There were no changes in the Company’s internal control over financial reporting that occurred during the last fiscal quarter that have materially affected, or are reasonably likely to materially affect, the Company’s internal control over financial reporting.
PART II
ITEM 1. LEGAL PROCEEDINGS
The Company and its subsidiaries are parties to certain ordinary routine litigation incidental to the normal conduct of their respective businesses, which in the opinion of management based upon currently available information will have no material effect on the Company's consolidated financial statements.
ITEM 1A. RISK FACTORS
In addition to the other information set forth in this report, you should carefully consider the factors discussed below and in Part I, “Item 1A. Risk Factors” in our Annual Report on Form 10-K for the year ended December 31, 2017, which could materially affect our business, financial condition or future results. The risks described in this form are not the only risks that we face. Additional risks and uncertainties not currently known to us or that we currently deem to be immaterial also may materially adversely affect our business, financial condition and/or operating results. There have been no material changes to the risk factors previously disclosed in our Annual Report of Form 10-K for the year ended December 31, 2017.
75
ITEM 2. UNREGISTERED SALES OF EQUITY SECURITIES AND USE OF PROCEEDS
(a) Not applicable.
(b) Not applicable.
(c) The following table provides certain information with regard to shares repurchased by the Company in the first quarter of 2018:
Period | Total number of shares purchased | Average price paid per share | Total number of shares purchased as a part of publicly announced plans or programs | Maximum number of shares that may yet be purchased under the plans or programs(1) | |||||||||
January 1-31, 2018 | — | $ | — | — | 404,706 | ||||||||
February 1-28, 2018 | — | — | — | 404,706 | |||||||||
March 1-31, 2018 | — | — | — | 404,706 | |||||||||
Total | — | $ | — | — | 404,706 | ||||||||
(1) In August 2008, the Company’s Board of Directors approved a twenty-four month program to repurchase up to 450,000 shares of the Company’s common stock, or approximately 10.2% of the shares then outstanding. The Company’s Board of Directors authorized the continuance of this program for additional twenty-four month periods in August 2010, 2012 and 2014. On August 16, 2016, Bar Harbor Bankshares issued a press release announcing the Company’s Board of Directors has approved the continuation of the Company’s existing stock repurchase plan through August 16, 2018. No other changes were made to the plan. Depending on market conditions and other factors, stock repurchases may be commenced or suspended at any time, or from time to time, without prior notice and may be made in the open market or through privately negotiated transactions. The Company records repurchased shares as treasury stock.
ITEM 3. DEFAULTS UPON SENIOR SECURITIES
None.
ITEM 4. MINE SAFETY DISCLOSURES
Not applicable.
ITEM 5. OTHER INFORMATION
None.
76
ITEM 6. EXHIBITS
3.1 | Articles of Incorporation, as amended to date | ||
3.2 | Bylaws, as amended to date | ||
4.1 | Certificate of Designations, Fixed Rate Cumulative Perpetual Preferred Stock, Series A | ||
4.2 | Form of Specimen Stock Certificate for Series A Preferred Sock | ||
4.3 | Debt Securities Purchase Agreement | ||
4.4 | Form of Subordinated Debt Security of Bar Harbor Bank & Trust | ||
4.5 | Description of Company Common Stock | ||
10.1 | Employment Agreement, dated as of February 22, 2018, between Bar Harbor Bankshares, Bar Harbor Bank & Trust and Curtis C. Simard | ||
31.1 | Certification of Chief Executive Officer under Rule 13a-14(a)/15d-14(a) | ||
31.2 | Certification of Chief Financial Officer under Rule 13a-14(a)/15d-14(a) | ||
32.1 | Certification of Chief Executive Officer under 18 U.S.C. Sec. 1350. | ||
32.2 | Certification of Chief Financial Officer under 18 U.S.C. Sec. 1350. | ||
101 | The following financial information from the Company’s Annual Report on Form 10-Q for the quarter ended March 31, 2018 is formatted in XBRL (eXtensible Business Reporting Language): (i) Consolidated Condensed Statements of Income, (ii) the Condensed Consolidated Balance Sheets, (iii) the Condensed Consolidated Statements of Changes in Shareholders’ Equity, (iv) Consolidated Statements of Cash Flows and (v) Notes to the Consolidated Condensed Financial Statements | ||
77
SIGNATURES
Pursuant to the requirements of the Securities Exchange Act of 1934, the registrant has duly caused this report to be signed on its behalf by the undersigned thereunto duly authorized.
BAR HARBOR BANKSHARES | ||
Dated: May 8, 2018 | By: | /s/ Curtis C. Simard |
Curtis C. Simard | ||
President & Chief Executive Officer | ||
Dated: May 8, 2018 | By: | /s/ Josephine Iannelli |
Josephine Iannelli | ||
Executive Vice President, Chief Financial Officer, & Principal Accounting Officer | ||
78