Attached files
| file | filename |
|---|---|
| EX-99.1 - EXHIBIT 99.1 - WILLIS TOWERS WATSON PLC | exh_991.htm |
| 8-K - FORM 8-K - WILLIS TOWERS WATSON PLC | f8k_050718.htm |
EXHIBIT 99.2

willistowerswatson.com Willis Towers Watson Supplemental Slides © 2018 Willis Towers Watson. All rights reserved. First Quarter 2018

willistowerswatson.com New Revenue Standard ASC 606 1 © 2018 Willis Towers Watson. All rights reserved. Proprietary and Confidential. For Willis Towers Watson and Willis Towers Wa tso n client use only. Impact of adoption on condensed consolidated statement of income

willistowerswatson.com New Revenue Standard ASC 606 2 © 2018 Willis Towers Watson. All rights reserved. Proprietary and Confidential. For Willis Towers Watson and Willis Towers Wa tso n client use only. Explanations of the impacts to first quarter 2018 condensed consolidated statement of income

willistowerswatson.com New Revenue Standard ASC 606 3 © 2018 Willis Towers Watson. All rights reserved. Proprietary and Confidential. For Willis Towers Watson and Willis Towers Wa tso n client use only. Impacts of adoption on condensed consolidated balance sheet and cash flows This change is a result of moving a portion of capitalized software related to client system implementations from Investing a cti vities to Operating activities within the Statement of Cash Flows.

willistowerswatson.com New Revenue Standard ASC 606 4 © 2018 Willis Towers Watson. All rights reserved. Proprietary and Confidential. For Willis Towers Watson and Willis Towers Wa tso n client use only. The cumulative effect of the changes made to our consolidated January 1, 2018 balance sheet for the adoption of ASC 606

willistowerswatson.com New Revenue Standard ASC 606 5 © 2018 Willis Towers Watson. All rights reserved. Proprietary and Confidential. For Willis Towers Watson and Willis Towers Wa tso n client use only. Explanations of the impacts to retained earnings as of adoption date
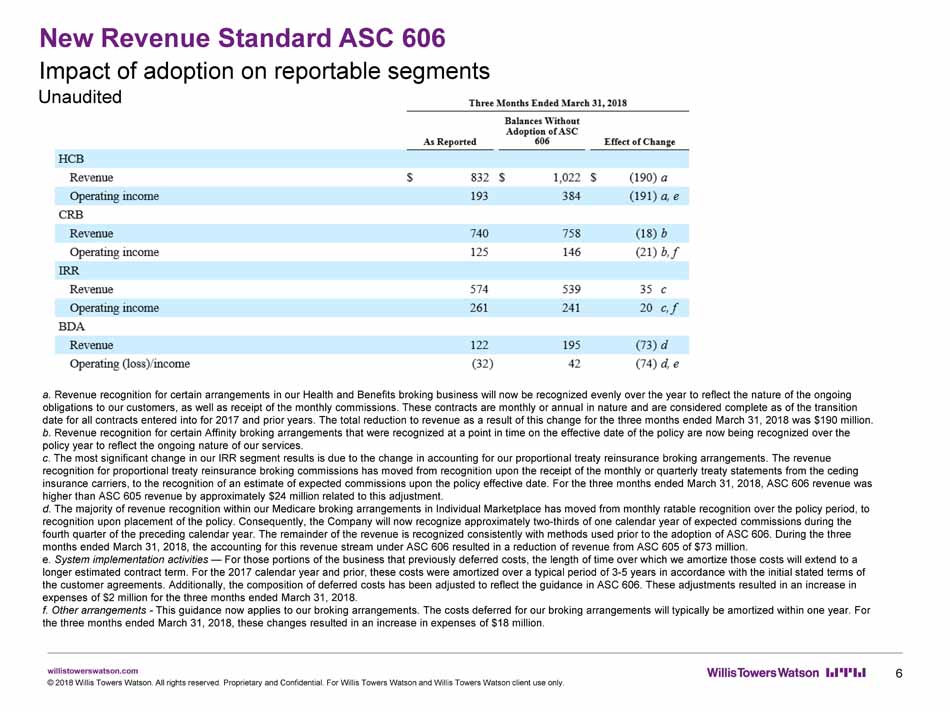
willistowerswatson.com New Revenue Standard ASC 606 6 © 2018 Willis Towers Watson. All rights reserved. Proprietary and Confidential. For Willis Towers Watson and Willis Towers Wa tso n client use only. Impact of adoption on reportable segments a. Revenue recognition for certain arrangements in our Health and Benefits broking business will now be recognized evenly over the year to reflect the nature of the ongoing obligations to our customers, as well as receipt of the monthly commissions. These contracts are monthly or annual in nature and are considered complete as of the transition date for all contracts entered into for 2017 and prior years. The total reduction to revenue as a result of this change for t he three months ended March 31, 2018 was $190 million. b . Revenue recognition for certain Affinity broking arrangements that were recognized at a point in time on the effective date of the po lic y are now being recognized over the policy year to reflect the ongoing nature of our services. c . The most significant change in our IRR segment results is due to the change in accounting for our proportional treaty reinsurance br oking arrangements. The revenue recognition for proportional treaty reinsurance broking commissions has moved from recognition upon the receipt of the monthl y o r quarterly treaty statements from the ceding insurance carriers, to the recognition of an estimate of expected commissions upon the policy effective date. For the three m ont hs ended March 31, 2018, ASC 606 revenue was higher than ASC 605 revenue by approximately $24 million related to this adjustment. d . The majority of revenue recognition within our Medicare broking arrangements in Individual Marketplace has moved from monthly rat abl e recognition over the policy period, to recognition upon placement of the policy. Consequently, the Company will now recognize approximately two - thirds of one calendar year of expected commissions during the fourth quarter of the preceding calendar year. The remainder of the revenue is recognized consistently with methods used prio r t o the adoption of ASC 606. During the three months ended March 31, 2018, the accounting for this revenue stream under ASC 606 resulted in a reduction of revenue from ASC 605 of $73 million. e . System implementation activities — For those portions of the business that previously deferred costs, the length of time over which we amortize those costs will extend to a longer estimated contract term. For the 2017 calendar year and prior, these costs were amortized over a typical period of 3 - 5 ye ars in accordance with the initial stated terms of the customer agreements. Additionally, the composition of deferred costs has been adjusted to reflect the guidance in ASC 606 . T hese adjustments resulted in an increase in expenses of $2 million for the three months ended March 31, 2018. f. Other arrangements - This guidance now applies to our broking arrangements. The costs deferred for our broking arrangements will typically be amor tiz ed within one year. For the three months ended March 31, 2018, these changes resulted in an increase in expenses of $18 million.

willistowerswatson.com New Revenue Standard ASC 606 7 © 2018 Willis Towers Watson. All rights reserved. Proprietary and Confidential. For Willis Towers Watson and Willis Towers Wa tso n client use only. Unaudited Pro forma* Seasonality Impact to 2017 Segments (1) HCB - Reflects effects of H&B Broking moving from point in time revenue recognition more heavily weighted to Q1, to a more ratable method throughout the year. Approximately $59 million of the H&B Broking revenue was excluded from the pro forma revenues due to the method of adoption the Company is undertaking. Also reflects lower cost deferrals, partially offset by longer amortization periods for implementation activities such as in PAG and Hosting. (2) CRB - Primarily reflects effects of the adjustment for the broking cost deferrals, in that the placement costs are expensed when the revenue is recognized at the inception of the policy periods, with the heaviest activity occurring in the first and fourth quarters. (3) IRR - Revenue reflects effects of the acceleration of proportional treaty reinsurance and software license sales. Operating expenses reflect the effects of the broking cost deferrals and the expensing at the policy inception dates . (4) BDA - Reflects adjustments for the acceleration of the Individual Marketplace ("IM") revenues and lower cost deferrals, partially offset by longer amortization periods related to Benefits Outsourcing. IM revenues reflect Q4 placement activity and only about a 30% allocation to the call center activity which is recognized evenly throughout the year . * Pro forma - as if the new revenue standard was applied to Willis Towers Watson’s 2017 recast results. The 2017 recast was a realignment of teams and a refinement of allocations which resulted in some movement of revenues and costs between Segments. **Non - GAAP measure. See first quarter 2018 press release for definition. For the Year Ended December 31, 2017 As Recast New Revenue Standard - Unaudited Pro forma* Q1 Q2 Q3 Q4 Total Q1 Q2 Q3 Q4 Total Human Capital & Benefits (1) Revenue $ 949 $ 726 $ 733 $ 768 $ 3,176 $ 778 $ 754 $ 767 $ 818 $ 3,117 Operating Expenses $ 604 $ 602 $ 589 $ 603 $ 2,398 $ 605 $ 603 $ 591 $ 605 $ 2,404 Operating Margin $ 345 $ 124 $ 144 $ 165 $ 778 $ 173 $ 151 $ 176 $ 213 $ 713 Operating Margin Percentage 36.3% 17.0% 19.7% 21.5% 24.5% 22.2% 19.9% 23.0% 26.1% 22.9% Corporate Risk & Broking (2) Revenue $ 672 $ 644 $ 600 $ 793 $ 2,709 $ 663 $ 647 $ 602 $ 797 $ 2,709 Operating Expenses $ 555 $ 540 $ 552 $ 579 $ 2,226 $ 560 $ 533 $ 546 $ 587 $ 2,226 Operating Margin $ 117 $ 104 $ 48 $ 214 $ 483 $ 103 $ 114 $ 56 $ 210 $ 483 Operating Margin Percentage 17.5% 16.1% 8.0% 27.0% 17.8% 15.6% 17.6% 9.3% 26.5% 17.8% Investment, Risk & Reinsurance (3) Revenue $ 491 $ 374 $ 321 $ 288 $ 1,474 $ 519 $ 379 $ 308 $ 268 $ 1,474 Operating Expenses $ 277 $ 285 $ 289 $ 294 $ 1,145 $ 295 $ 289 $ 292 $ 269 $ 1,145 Operating Margin $ 214 $ 89 $ 32 $ (6) $ 329 $ 224 $ 90 $ 16 $ (1) $ 329 Operating Margin Percentage 43.6% 23.7% 10.0% - 2.2% 22.3% 43.3% 23.7% 5.3% - 0.7% 22.3% Benefits Delivery & Adminstration (4) Revenue $ 181 $ 179 $ 180 $ 194 $ 734 $ 114 $ 106 $ 113 $ 405 $ 738 Operating Expenses $ 142 $ 144 $ 144 $ 150 $ 580 $ 144 $ 146 $ 149 $ 156 $ 595 Operating Margin $ 39 $ 35 $ 36 $ 44 $ 154 $ (30) $ (40) $ (36) $ 249 $ 143 Operating Margin Percentage 21.1% 19.3% 20.2% 22.5% 21.0% - 27.3% - 38.3% - 31.4% 61.4% 19.4% Total WTW Segments Revenue $ 2,293 $ 1,922 $ 1,834 $ 2,043 $ 8,093 $ 2,074 $ 1,885 $ 1,790 $ 2,288 $ 8,038 Move to non - reportable segment $ 3 $ 4 $ 1 $ 3 $ 11 $ 3 $ 4 $ 1 $ 3 $ 11 Total Recast Revenue $ 2,296 $ 1,926 $ 1,835 $ 2,046 $ 8,104 $ 2,078 $ 1,889 $ 1,791 $ 2,291 $ 8,049 Operating Expenses $ 1,578 $ 1,572 $ 1,574 $ 1,626 $ 6,350 $ 1,604 $ 1,572 $ 1,578 $ 1,616 $ 6,370 Move to non - reportable segment $ (13) 0 $ (5) $ (14) $ (32) $ (13) $ 0 $ (5) $ (14) $ (32) Total Recast Expenses $ 1,565 $ 1,572 $ 1,569 $ 1,612 $ 6,318 $ 1,591 $ 1,572 $ 1,573 $ 1,602 $ 6,338 Operating Margin $ 731 $ 354 $ 266 $ 434 $ 1,785 $ 487 $ 317 $ 218 $ 689 $ 1,711 Operating Margin Percentage 31.8% 18.4% 14.5% 21.2% 22.0% 23.4% 16.8% 12.2% 30.1% 21.3% Adjusted Tax Rate** 15.6% 29.1% 32.1% 20.6% 21.9% 19.0% 30.2% 39.9% 13.1% 20.9% US GAAP Tax Rate 11.5% 16.8% - 53.0% - 221.4% - 20.5% 13.0% 0.5% - 20.3% - 50.7% - 31.7%