Attached files
| file | filename |
|---|---|
| 8-K - 8-K - INVESTOR PRESENTATION - OCEANFIRST FINANCIAL CORP | ocfc8-kinvestorpresentatio.htm |

. . . OceanFirst Financial Corp. Investor Presentation May 2018

I N V E S T O R P R E S E N T A T I O N . . . Forward Looking Statements In addition to historical information, this presentation contains certain forward-looking statements within the meaning of the Private Securities Litigation Reform Act of 1995 which are based on certain assumptions and describe future plans, strategies and expectations of the Company. These forward-looking statements are generally identified by use of the words “believe,” “expect,” “intend,” “anticipate,” “estimate,” “project,” “will,” “should,” “may,” “view,” “opportunity,” “potential,” or similar expressions or expressions of confidence. The Company’s ability to predict results or the actual effect of future plans or strategies is inherently uncertain. Factors which could have a material adverse effect on the operations of the Company and its subsidiaries include, but are not limited to: changes in interest rates, general economic conditions, levels of unemployment in the Bank’s lending area, real estate market values in the Bank’s lending area, future natural disasters and increases to flood insurance premiums, the level of prepayments on loans and mortgage-backed securities, legislative/regulatory changes, monetary and fiscal policies of the U.S. Government including policies of the U.S. Treasury and the Board of Governors of the Federal Reserve System, the quality or composition of the loan or investment portfolios, demand for loan products, deposit flows, competition, demand for financial services in the Company’s market area, accounting principles and guidelines and the Bank’s ability to successfully integrate acquired operations. These risks and uncertainties are further discussed in the Company’s Annual Report on Form 10-K for the year ended December 31, 2017, under Item 1A - Risk Factors and elsewhere, and subsequent securities filings and should be considered in evaluating forward-looking statements and undue reliance should not be placed on such statements. The Company does not undertake, and specifically disclaims any obligation, to publicly release the result of any revisions which may be made to any forward-looking statements to reflect events or circumstances after the date of such statements or to reflect the occurrence of anticipated or unanticipated events. Annualized, pro forma, projected and estimated numbers are used for illustrative purpose only, are not forecasts and may not reflect actual results. 2

. . . About OceanFirst Financial Corp. 3

I N V E S T O R P R E S E N T A T I O N . . . OceanFirst Financial Corp. • NASDAQ: OCFC • Market Cap: $1.3 billion1 • Bank Holdings Company with National Bank Subsidiary • Founded in 1902 • Asset Value of $7.5 billion • 76 Branches in Central and Southern New Jersey Headquarters OceanFirst Bank Branches OceanFirst Bank Loan Offices 4 1 As of April 30, 2018

I N V E S T O R P R E S E N T A T I O N . . . Investment Thesis • Low-Cost and Durable Deposit Base • Cost of deposits is one of the lowest in the state of New Jersey at 33 basis points, increasing slowly in response to rising rate environment • Strength of Assets • Strong balance sheet underpins flexibility to grow and diversify the business • Digital Innovation • Continuous development and investment in direct banking and cyber security initiatives to stay current with leading industry practices • Disciplined and Strategic M&A • Acquired attractive and underappreciated assets in exurban markets at attractive prices • Bench Strength • Deep banking, regulatory, M&A, and integration experience • Conservative Risk Culture • Effective and efficient commitment to management of credit, interest rate and regulatory / compliance risk • Insider Ownership • Substantial insider ownership aligned with shareholder interest 5

I N V E S T O R P R E S E N T A T I O N . . . Commitment to Execution Our Recent Accomplishments... …Lead to Our Path Forward • Four Acquisitions in Two Years • Local to Regional Scale • Commercial Loan Growth in • Increased Investment in Direct Recent Years Banking & Digital Engagement • Increased Tangible Capital Ratio • Reimagining our Real Estate to 9.11% • Further Loan Portfolio • Building a “Digital Culture” Diversification: Sector, Industry, Throughout the Bank Geography and Vintage • Strong Total Shareholder Return 6

. . . Our Business 7

I N V E S T O R P R E S E N T A T I O N . . . First Quarter 2018 Highlights Financial Highlights Operational Highlights • Core Net Income of $20 million • Acquisition of Sun Bancorp, Inc. • Up 53% y/y completed on January 31, 2018 with • Core Diluted EPS of $0.45 full integration planned for Q2 2018 • Up 13% y/y • Branch consolidation • Net Interest Margin of 3.70% • 17 scheduled for Q2 2018 • Up 14 basis points y/y • Core deposits1 represent 84% of total • Core Efficiency Ratio of 59.6% deposits, an effective hedge against • Down from 61.6% y/y rising interest rates, with cost of • Quarterly Dividend $0.15 per share deposits rising 1 bps from Q4 2017 • 85th consecutive quarter • 33% payout on core earnings 8 1 All deposits except certificates of deposit

I N V E S T O R P R E S E N T A T I O N . . . Net Interest Margin Operational Highlights Net Interest Margin (1) 3.70 • Cost of deposits increased only 1 bp from 4Q17 to 1Q18 3.60 • Non-interest bearing deposits are 3.50 3.51 19% of total deposits 3.40 3.38 • Balanced interest rate risk position 3.30 Percentage 3.20 3.10 3.00 2013 2014 2015 2016 2017 Q1 Q2 Q3 Q4 Q1 Q2 Q3 Q4 Q1 Q2 Q3 Q4 Q1 Q2 Q3 Q4 Q1 Q2 Q3 Q4 OceanFirst Bank Peer Average 9 (1) Source: Bank Reg Data
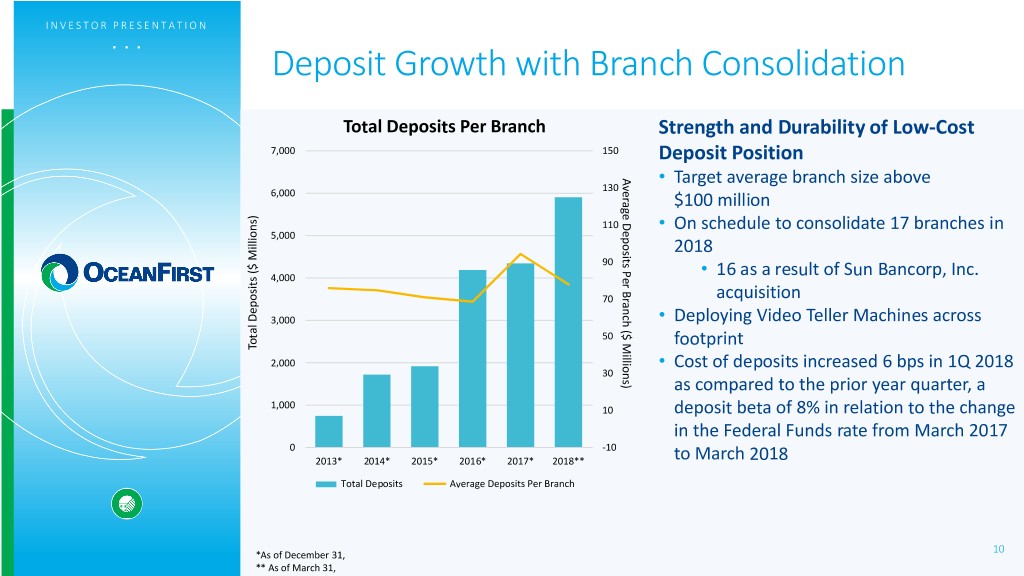
I N V E S T O R P R E S E N T A T I O N . . . Deposit Growth with Branch Consolidation Total Deposits Per Branch Strength and Durability of Low-Cost 7,000 150 Deposit Position Average Per Deposits Branch Millions) ($ • Target average branch size above 130 6,000 $100 million 110 • On schedule to consolidate 17 branches in 5,000 2018 90 4,000 • 16 as a result of Sun Bancorp, Inc. 70 acquisition 3,000 • Deploying Video Teller Machines across 50 footprint Total Deposits ($ Millions) Total 2,000 • Cost of deposits increased 6 bps in 1Q 2018 30 as compared to the prior year quarter, a 1,000 10 deposit beta of 8% in relation to the change in the Federal Funds rate from March 2017 0 -10 2013* 2014* 2015* 2016* 2017* 2018** to March 2018 Total Deposits Average Deposits Per Branch 10 *As of December 31, ** As of March 31,

I N V E S T O R P R E S E N T A T I O N . . . Loan Composition Emphasizes Commercial Total Loans Outstanding Loans by Customer Segment - 2018 2014* 2015* 42% 2016* 58% 2017* 2018** Commercial Consumer Consumer Commercial $0 $1,000 $2,000 $3,000 $4,000 $5,000 $6,000 (in millions) Residential Home Equity & Consumer Investor CRE Owner Occupied CRE C&I Loans 11 *As of December 31, ** As of March 31,

I N V E S T O R P R E S E N T A T I O N . . . Conservative CRE Portfolio Reflects Strategic Execution CRE to Total Risk Based Capital 0 100 200 300 400 500 600 700 800 900 1,000 Peer 1 Peer 2 Peer 3 Peer 4 Capacity to grow Investor Peer 5 CRE by $305 million while Peer 6 remaining under 300%. Peer 7 OceanFirst Peer 8 236 OceanFirst Actual Peer 9 Peer 10 Peer 11 Peer 12 Peer Group Peer 13 345 Peer Group Average Peer 14 Peer 15 Peer 16 Peer 17 Peer 18 Peer 19 Peer 20 Peer 21 Peer 22 Peer 23 Domestic CRE Loans (Construction, Multifamily & Other Nonfarm Non-residential) to Total Risk Based Capital. Supervisory guideline is 300% of TRBC. Peers include: BHLB, BMTC, CBU, CUBI, DCOM, EGBN, FCF, FFIC, INDB, LBAI, NBTB, NFBK, NWBI, ORIT, PGC, PFS, SASR, STBA, TMP, TOWN, UVSP, WSBC and WSFS. Source: BankRegData.com 12 As of December 31, 2017 and does not reflect Sun Bancorp acquisition
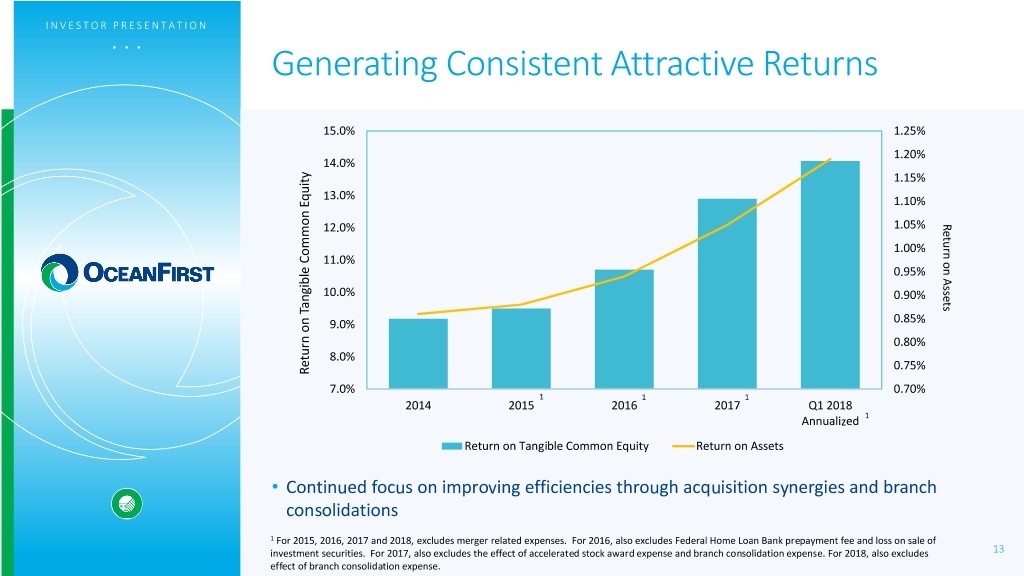
I N V E S T O R P R E S E N T A T I O N . . . Generating Consistent Attractive Returns 15.0% 1.25% 1.20% 14.0% 1.15% 13.0% 1.10% 12.0% 1.05% Return Assetson 1.00% 11.0% 0.95% 10.0% 0.90% 9.0% 0.85% 0.80% 8.0% 0.75% Return on Tangible Equity Common onTangible Return 7.0% 0.70% 1 1 1 2014 2015 2016 2017 Q1 2018 Annualized 1 Return on Tangible Common Equity Return on Assets • Continued focus on improving efficiencies through acquisition synergies and branch consolidations 1 For 2015, 2016, 2017 and 2018, excludes merger related expenses. For 2016, also excludes Federal Home Loan Bank prepayment fee and loss on sale of investment securities. For 2017, also excludes the effect of accelerated stock award expense and branch consolidation expense. For 2018, also excludes 13 effect of branch consolidation expense.

I N V E S T O R P R E S E N T A T I O N . . . Credit Metrics Reflect Conservative Culture Non-Performing Loans by Source (Percent of Loans Receivable) NET CHARGE-OFFS 0.15%(1) 0.07% 0.15% 0.10% 0.02% (Annualized) 1.20% 1.06% 1.00% 0.91% 0.80% 0.60% 0.52% 0.40% 0.35% 0.34% 0.20% Performing Loans as Percent of Total Loans Receivable Loans of Total Percent as Performing Loans - Non 0.00% 2014 2015 2016 2017 1Q 2018 Residential Consumer Commercial Real Estate Commercial & Industrial (1) Net charge-off ratio for 2014 excludes charge-off related to bulk sale of non-performing residential and consumer mortgage loans. Including this 14 charge-off, the ratio is 0.45%.
. . . Our Strategy 15

I N V E S T O R P R E S E N T A T I O N . . . Asset Growth Supplemented by Strategic M&A Opportunistic Acquisitions of Local Community Banks Target Closing Date Transaction Value Total Assets Colonial American Bank July 31, 2015 $ 12 million $ 142 million Cape Bancorp May 2, 2016 $196 million $1,518 million Ocean Shore Holding Co. November 30, 2016 $146 million $1,097 million Sun Bancorp, Inc. January 31, 2018 $475 million $2,045 million Weighted average(1): Price/Tangible Book Value 155%; Core Deposit Premium 9.2% 16 1 At time of announcement

I N V E S T O R P R E S E N T A T I O N . . . New Jersey Expansion Opportunities • New Jersey is a strong market (1) • Population of 8.9 million • Most densely populated state • 11th most populous state • Median household income of $72,000 • Significant opportunities for acquisitions to build customer base • Administrative offices established in Red Bank, NJ, while consolidating 19 operating facilities to two locations • Support expansion in Metropolitan Philadelphia Population of 4.3 million with deposits of $130 billion and Metropolitan New York Headquarters OceanFirst Bank Branches OceanFirst Bank Loan Offices 17 1 US Census Bureau

I N V E S T O R P R E S E N T A T I O N . . . Regional Opportunities for M&A Philadelphia Area New York City Metro Area • 8 Banks with Assets Between $400M and $1B • 9 Banks with Assets Between $400M and $1B • 13 Banks with Assets Between $1B and $10B • 12 Banks with Assets Between $1B and $10B New Jersey • 13 Banks with Assets Between $400M and $1B • 14 Banks with Assets Between $1B and $10B Headquarters OceanFirst Bank Branches OceanFirst Bank Loan Offices Regional banking data as of September 30, 2017 18 Source: FDIC

I N V E S T O R P R E S E N T A T I O N . . . Data Driven Digital Strategy Digital Offerings Mobile Deposits Mobile Activations • Online Banking Up 56% y/y Up 21% y/y • Mobile Banking Apps • Biometric ID Verification • Remote Check Deposit Retail Online • Bill Pay Banking 68,000+ Monthly • Pop Money P2P Registration up Bills Paid Digitally • Money Management 45% y/y • Online Account Opening • Apple Pay, Samsung Pay and Google Pay Certified Digital 154 Certified • Digital Loyalty Programs Banker Training Digital Bankers • Launched in 4Q17 CardValet Fraud Mitigation • Video Banking • Delivering results that are measurable, repeatable, and scalable, which: • Increase customer retention • Reduce cost to serve • Increase share of wallet • Anticipate and support evolving customer needs 19 As of March 31, 2018
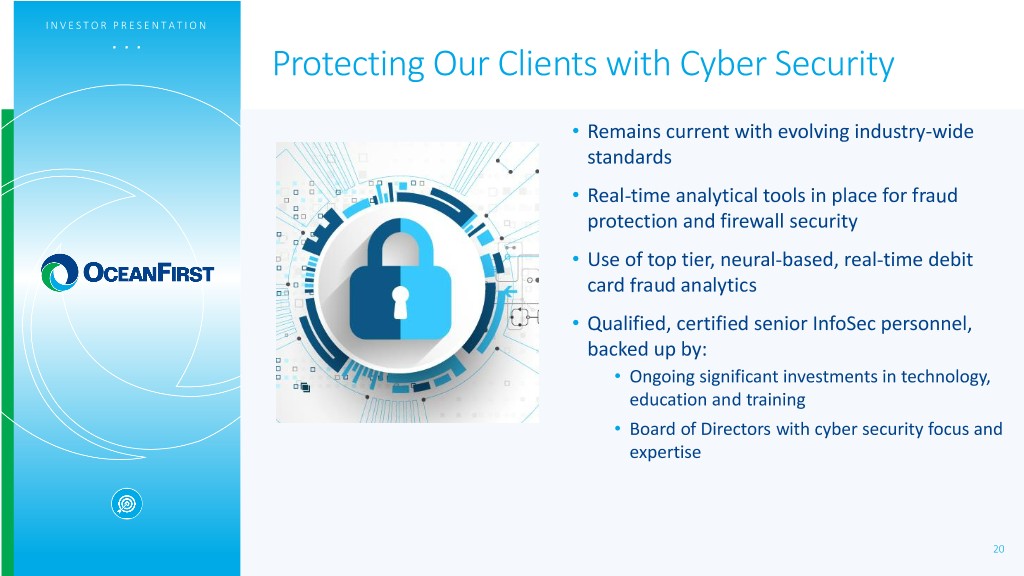
I N V E S T O R P R E S E N T A T I O N . . . Protecting Our Clients with Cyber Security • Remains current with evolving industry-wide standards • Real-time analytical tools in place for fraud protection and firewall security • Use of top tier, neural-based, real-time debit card fraud analytics • Qualified, certified senior InfoSec personnel, backed up by: • Ongoing significant investments in technology, education and training • Board of Directors with cyber security focus and expertise 20

I N V E S T O R P R E S E N T A T I O N . . . Strategic Capital Allocation Generates Shareholder Returns Returned Capital to Shareholders • Stable & competitive dividend $25.0 th • 85 consecutive quarter • Historical Payout Ratio of 30% to 40% $20.0 • 1.8 million shares available for $15.0 repurchase $10.0 • Strategic acquisitions in critical new markets Annual Return of Capital ($ ($ Millions) Capital of Return Annual $5.0 • Total Shareholder Return December 31, 2012 to March 31, 2018 $0.0 2013 2014 2015 2016 2017 1Q 2018 of 125%; CAGR 17% Cash Dividends Share Repurchases 21

I N V E S T O R P R E S E N T A T I O N . . . An Experienced Management Team Years at Executive Title Selected Experience OceanFirst Chairman, President, Patriot National Bancorp Christopher D. Maher 5 Chief Executive Officer Dime Community Bancshares Executive Vice President, Michael J. Fitzpatrick 25 KPMG Chief Financial Officer Executive Vice President, BISYS Banking Solutions Joseph R. Iantosca 14 Chief Administrative Officer Newtrend LLC Executive Vice President, Wachovia Bank N.A. Joseph J. Lebel III 12 Chief Banking Officer First Fidelity Executive Vice President, Thacher Proffit & Wood Steven J. Tsimbinos 7 General Counsel Lowenstein Sandler PC Executive Vice President, Office of the Comptroller of the Currency Grace M. Vallacchi <1 Chief Risk Officer First Union Executive Vice President, Patriot National Bancorp Gary S. Hett Chief Human Resources 4 Dime Community Bancshares Officer • Substantial insider ownership of 9.5%, including Directors and Executive Officers, ESOP and OceanFirst Foundation. 22

I N V E S T O R P R E S E N T A T I O N . . . OceanFirst Foundation: Serving Our Communities • Over $35.2 million has been granted to organizations serving OceanFirst’s market • Provided $500,000 in grants dedicated to assisting our neighbors after Superstorm Sandy hit the Jersey Shore in 2012 • First foundation established during a mutual conversion to IPO (July 1996) • Completed merger of Cape Foundation into OceanFirst Foundation in 2016 and merger of Ocean City Home Foundation in 2017 • OceanFirst Foundation has assets of $35.7 million 23
I N V E S T O R P R E S E N T A T I O N . . . Investment Thesis • Low-Cost and Durable Deposit Base • Cost of deposits is one of the lowest in the state of New Jersey at 33 basis points, increasing slowly in response to rising rate environment • Strength of Assets • Strong balance sheet underpins flexibility to grow and diversify the business • Digital Innovation • Continuous development and investment in direct banking and cyber security initiatives to stay current with leading industry practices • Disciplined and Strategic M&A • Acquired attractive and underappreciated assets in exurban markets at attractive prices • Bench Strength • Deep banking, regulatory, M&A, and integration experience • Conservative Risk Culture • Effective and efficient commitment to management of credit, interest rate and regulatory / compliance risk • Insider Ownership • Substantial insider ownership aligned with shareholder interest 24

. . . Investor Relations Inquiries Jill A. Hewitt Senior Vice President, Director of Investor Relations & Corporate Communications jhewitt@oceanfirst.com (732) 240-4500, ext. 7513 25

. . . Appendix 26
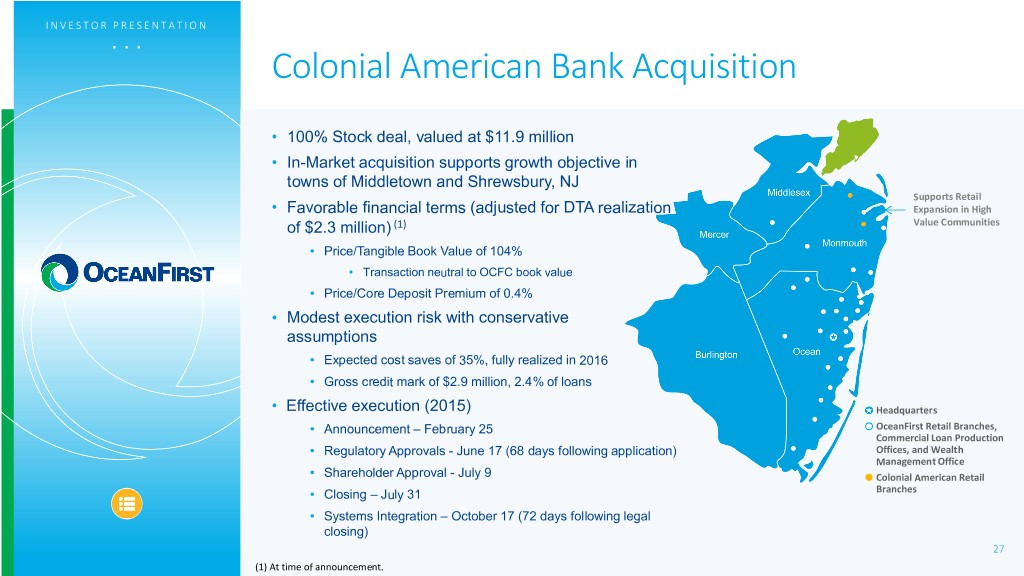
I N V E S T O R P R E S E N T A T I O N . . . Colonial American Bank Acquisition • 100% Stock deal, valued at $11.9 million • In-Market acquisition supports growth objective in towns of Middletown and Shrewsbury, NJ Supports Retail • Favorable financial terms (adjusted for DTA realization Expansion in High of $2.3 million) (1) Value Communities • Price/Tangible Book Value of 104% • Transaction neutral to OCFC book value • Price/Core Deposit Premium of 0.4% • Modest execution risk with conservative assumptions • Expected cost saves of 35%, fully realized in 2016 • Gross credit mark of $2.9 million, 2.4% of loans • Effective execution (2015) Headquarters • Announcement – February 25 OceanFirst Retail Branches, Commercial Loan Production • Regulatory Approvals - June 17 (68 days following application) Offices, and Wealth Management Office • Shareholder Approval - July 9 Colonial American Retail • Closing – July 31 Branches • Systems Integration – October 17 (72 days following legal closing) 27 (1) At time of announcement.

I N V E S T O R P R E S E N T A T I O N . . . Cape Bancorp Acquisition • 85% stock and 15% cash, valued at $196 million • Favorable financial terms (1) • Price/Tangible Book Value of 139% • Price/Core Deposit Premium of 4.4% • Expected accretion to GAAP EPS of 17% in 2017 • Expected tangible book value dilution of 7.2%, projected earnback of approximately 3.3 years using the cross-over method and 3.8 years on a simple tangible book value earnback calculation • Modest execution risk with conservative assumptions • Expected cost saves of 33%, fully realized by end of 2016 • Expected one-time, pre-tax transaction expenses of $15.5 million • Gross credit mark of $25.5 million, 2.3% of loans • Effective execution (2016) • Announcement – January 5 • Regulatory Approvals – March 28 (52 days following application) Headquarters OceanFirst Retail Branches, • Shareholder Approvals – April 25 Commercial Loan Production Offices, and Wealth • Closing – May 2 Management Office • Systems Integration – completed October 15 Cape Bank Retail Branches and Commercial Loan Offices 28 (1) At time of announcement.

I N V E S T O R P R E S E N T A T I O N . . . Ocean Shore Holding Co. Acquisition • Reinforces OceanFirst as the preeminent New Jersey based community banking franchise operating throughout central and southern New Jersey • 80% stock and 20% cash, valued at $181 million • Favorable financial terms(1) • Price/Tangible Book Value of 132% • Price/Core Deposit Premium of 4.9% • Expected accretion to GAAP EPS of over 5% in 2018 • Expected tangible book value dilution of 3.1%, projected earnback of approximately 3.7 years using the cross-over method and 4.1 years on a simple tangible book value earnback calculation • Modest execution risk with conservative assumptions • Expected cost saves of 53%, fully realized by end of 2017 • Expected one-time, pre-tax transaction expenses of $19 million • Gross credit mark of $10.0 million, 1.25% of loans • Effective execution (2016) OceanFirst Bank Branches • Announcement – July 13, 2016 Ocean City Home Bank • Regulatory Approvals – October 27, 2016 (72 days following application) Branches • Shareholder Approvals – November 22, 2016 • Closing – November 30, 2016 • Systems Integration – completed May 19, 2017 29 (1) At time of announcement.
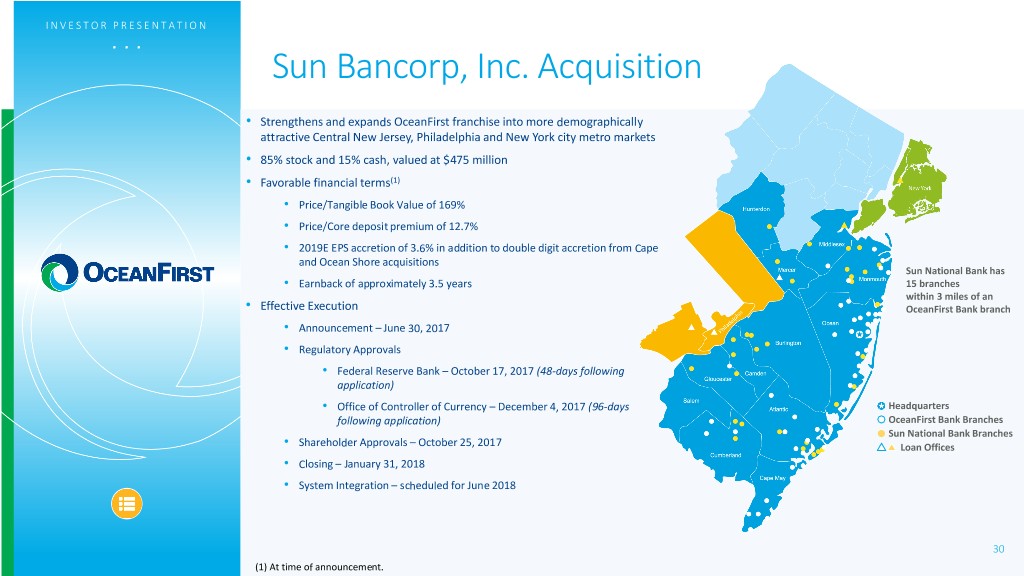
I N V E S T O R P R E S E N T A T I O N . . . Sun Bancorp, Inc. Acquisition • Strengthens and expands OceanFirst franchise into more demographically attractive Central New Jersey, Philadelphia and New York city metro markets • 85% stock and 15% cash, valued at $475 million • Favorable financial terms(1) • Price/Tangible Book Value of 169% • Price/Core deposit premium of 12.7% • 2019E EPS accretion of 3.6% in addition to double digit accretion from Cape and Ocean Shore acquisitions Sun National Bank has • Earnback of approximately 3.5 years 15 branches within 3 miles of an • Effective Execution OceanFirst Bank branch • Announcement – June 30, 2017 • Regulatory Approvals • Federal Reserve Bank – October 17, 2017 (48-days following application) • Office of Controller of Currency – December 4, 2017 (96-days Headquarters following application) OceanFirst Bank Branches Sun National Bank Branches • Shareholder Approvals – October 25, 2017 Loan Offices • Closing – January 31, 2018 • System Integration – scheduled for June 2018 30 (1) At time of announcement.

I N V E S T O R P R E S E N T A T I O N . . . State & Local Tax Sensitivity Direct Exposure • Home Equity Interest Deduction % of total loan portfolios (total loans of $3,976mm) Elimination; $281 million total 3% exposure 7% • Residential mortgage borrowers with property taxes in excess of $10,000 - $128 million total exposure • At our current weighted average 90% expected loss rate, losses on this exposure, if stressed, would total $2.9 million No Exposure Home Equity Residential Mortgage • OceanFirst’s exposure to tax law changes is de minimis to overall portfolio size and financial position • Impacted Loans 83% CLTV < 70% 31

I N V E S T O R P R E S E N T A T I O N . . . OceanFirst Milestones – 116 Years of Growth IPO to Mutual Depositors Created OceanFirst Colonial American Foundation Bank Acquired Established Commercial LPO Founded, Established Adopted National Trust and Asset Expansion into Point Pleasant, NJ Commercial Lending Commercial Bank Management Mercer County Charter 1902 1985 1996 1999 2000 2014 2015 2016 2017 2018 Branch Expansion Branch Expansion OceanFirst Foundation Sun Bancorp, Inc. Cape Bancorp into into Exceeds $25 Million in Acquisition Acquired Middlesex County Monmouth County Cumulative Grants January 31, 2018 Ocean Shore Holding Co. Acquired 32

I N V E S T O R P R E S E N T A T I O N . . . Favorable Competitive Position Mega Banks OceanFirst Bank Community Banks # of Branches Dep. In Mkt. # of Dep. In Mkt. Dep. In Mkt. Institution ($000) Institution # of Branches Branches ($000) ($000) 76 5,868,955 TD Bank (Canada) 127 19,832,103 Manasquan 9 1,037,767 PNC Bank (PA) 140 18,677,979 OceanFirst Kearny 21 1,007,482 Competitive Position Wells Fargo (CA) 140 15,484,506 Sturdy Savings 13 690,194 • Responsive Bank of America (NC) 122 15,058,444 1ST Constitution 15 662,526 • Flexible Santander Bank 80 6,421,883 Bank of Princeton 8 646,558 (Spain) • Capable • Lending Limit Two River 13 634,985 • Technology • Trust • Cash Management • Consumer & Commercial • Competing Favorably Against Banking Behemoths and Local Community Banks Source: FDIC Summary of Deposits, June 30, 2017 33 Note: Market area is defined as 11 counties in Central and Southern New Jersey

I N V E S T O R P R E S E N T A T I O N . . . Commercial Portfolio Segmentation Total Commercial Loan Exposure by Real Estate Investment by Property Industry Classification Classification Educational Services Public Administration Miscellaneous Miscellaneous 1.8% 4.8% 16.0% 1.3% Office Manufacturing Arts/Entertainment/ 31.2% 3.3% Recreation 2.5% Other Services 4.7% Multi-Family Accommodations/ 23.3% Food Services 7.1% Industrial/ Healthcare Warehouse 5.7% 2.7% Residential Wholesale Trade Development 4.2% Retail Store 2.5% Retail Trade 7.7% 1-4 Family Single Purpose 4.2% Real Estate Shopping Center 5.3% 4.3% Construction Investment 7.0% 3.2% 57.2% • Diversified portfolio provides protection against industry-specific credit events 34 As of March 31, 2018
