Attached files
| file | filename |
|---|---|
| EX-99.2 - EX-99.2 - Nationstar Mortgage Holdings Inc. | d582752dex992.htm |
| 8-K - FORM 8-K - Nationstar Mortgage Holdings Inc. | d582752d8k.htm |

FIRST QUARTER 2018 RESULTS MAY 3, 2018 INVESTOR SUPPLEMENT Exhibit 99.1
IMPORTANT INFORMATION This presentation contains summarized information concerning Nationstar Mortgage Holdings Inc. (the “Company”) and the Company’s business, operations, financial performance and trends. No representation is made that the information in this presentation is complete. For additional financial, statistical and business related information, as well as information regarding business and segment trends, see the Company’s most recent Annual Report on Form 10-K (“Form 10-K”) and Quarterly Reports on Form 10-Q filed with the U.S. Securities and Exchange Commission (the “SEC”), as well as the Company’s other reports filed with the SEC from time to time. Such reports are or will be available in the Investor Information section of the Company’s website (www.nationstarholdings.com) and the SEC’s website (www.sec.gov). FORWARD LOOKING STATEMENTS This communication contains forward-looking statements within the meaning of the Private Securities Litigation Reform Act of 1995 including, but not limited to, 2018 Goals and initiatives and WMIH’s and Nationstar’s expectations or predictions of future financial or business performance or conditions. All statements other than statements of historical or current fact included in this communication that address activities, events, conditions or developments that we expect, believe or anticipate will or may occur in the future are forward-looking statements. Forward-looking statements give our current expectations and projections relating to our financial condition, results of operations, plans, objectives, future performance and business and these statements are not guarantees of future performance. Forward-looking statements may include the words “anticipate,” “estimate,” “expect,” “project,” “intend,” “plan,” “believe,” “strategy,” “future,” “opportunity,” “may,” “should,” “will,” “would,” “will be,” “will continue,” “will likely result,” and similar expressions. Such forward-looking statements involve risks and uncertainties that may cause actual events, results or performance to differ materially from those indicated by such statements. Certain of these risks are identified and discussed in WMIH’s Form 10-K for the year ended December 31, 2017 under Risk Factors in Part I, Item 1A, Nationstar’s Form 10-K for the year ended December 31, 2017 under Risk Factors in Part I, Item 1A and the registration statement under Risk Factors. These risk factors will be important to consider in determining future results and should be reviewed in their entirety. These forward-looking statements are expressed in good faith, and WMIH and Nationstar believe there is a reasonable basis for them. However, there can be no assurance that the events, results or trends identified in these forward-looking statements will occur or be achieved. Forward-looking statements speak only as of the date they are made, and neither WMIH nor Nationstar is under any obligation, and expressly disclaim any obligation, to update, alter or otherwise revise any forward-looking statement, except as required by law. Readers should carefully review the statements set forth in the reports, which WMIH and Nationstar have filed or will file from time to time with the SEC. In addition to factors previously disclosed in WMIH’s and Nationstar’s reports filed with the SEC and those identified elsewhere in this communication, the following factors, among others, could cause actual results to differ materially from forward-looking statements or historical performance: ability to meet the closing conditions to the merger, including approval by shareholders of WMIH and Nationstar on the expected terms and schedule and the risk that regulatory approvals required for the merger are not obtained or are obtained subject to conditions that are not anticipated; delay in closing the merger; failure to realize the benefits expected from the proposed transaction; the effects of pending and future legislation; risks associated with investing in mortgage loans and mortgage servicing rights and changes in interest rates; risks related to disruption of management time from ongoing business operations due to the proposed transaction; business disruption following the transaction; macroeconomic factors beyond WMIH’s or Nationstar’s control; risks related to WMIH’s or Nationstar’s indebtedness and other consequences associated with mergers, acquisitions and divestitures and legislative and regulatory actions and reforms. Annualized, pro forma, projected and estimated numbers are used for illustrative purpose only, are not forecasts and may not reflect actual results. NON-GAAP MEASURES This presentation contains certain references to non-GAAP measures. Please refer to the Appendix and Notes for more information on non-GAAP measures.
This communication is being made in respect of the proposed merger transaction involving WMIH Corp. (“WMIH”) and Nationstar Mortgage Holdings Inc. (“Nationstar”). WMIH has filed a registration statement on Form S-4 with the SEC on March 22, 2018, which includes a preliminary joint proxy statement of WMIH and Nationstar and a preliminary prospectus of WMIH, and each party will file other documents regarding the proposed transaction with the SEC. The information in the preliminary joint proxy statement/prospectus is not complete and may be changed. The definitive joint proxy statement/prospectus will be sent to the stockholders of WMIH and Nationstar after the registration statement is declared effective by the SEC. This communication does not constitute an offer to sell or the solicitation of an offer to buy any securities or a solicitation of any vote or approval. Before making any voting or investment decision, investors and security holders of WMIH and Nationstar are urged to carefully read the entire registration statement and joint proxy statement/prospectus and any other relevant documents filed with the SEC, as well as any amendments or supplements to these documents, because they will contain important information about the proposed transaction. The documents filed by WMIH and Nationstar with the SEC may be obtained free of charge at the SEC’s website at www.sec.gov. In addition, the documents filed by WMIH may be obtained free of charge from WMIH at www.wmih-corp.com, and the documents filed by Nationstar may be obtained free of charge from Nationstar at www.nationstarholdings.com. Alternatively, these documents, when available, can be obtained free of charge from WMIH upon written request to WMIH Corp., 800 Fifth Avenue, Suite 4100, Seattle, Washington 98104, Attn: Secretary, or by calling (206) 922-2957, or from Nationstar upon written request to Nationstar Mortgage Holdings Inc., 8950 Cypress Waters Blvd, Dallas, TX 75019, Attention: Corporate Secretary, or by calling (469) 549-2000. WMIH and Nationstar and certain of their respective directors and executive officers may be deemed to be participants in the solicitation of proxies from the shareholders of WMIH and/or Nationstar, as applicable, in favor of the approval of the merger. Information regarding WMIH’s directors and executive officers is contained in WMIH’s Annual Report on Form 10-K for the year ended December 31, 2017, its Current Report on Form 8-K filed on March 9, 2018, and the joint proxy statement/prospectus, which are filed with the SEC. Information regarding Nationstar’s directors and executive officers is contained in Nationstar’s Proxy Statement on Schedule 14A, dated April 17, 2018, and its Annual Report on Form 10-K for the year ended December 31, 2017, which are filed with the SEC. Additional information regarding the interests of those participants and other persons who may be deemed participants in the transaction may be obtained by reading the registration statement and the joint proxy statement/prospectus and other relevant documents filed with the SEC when they become available. Free copies of these documents may be obtained as described in the preceding paragraph. . ADDITIONAL INFORMATION FOR STOCKHOLDERS
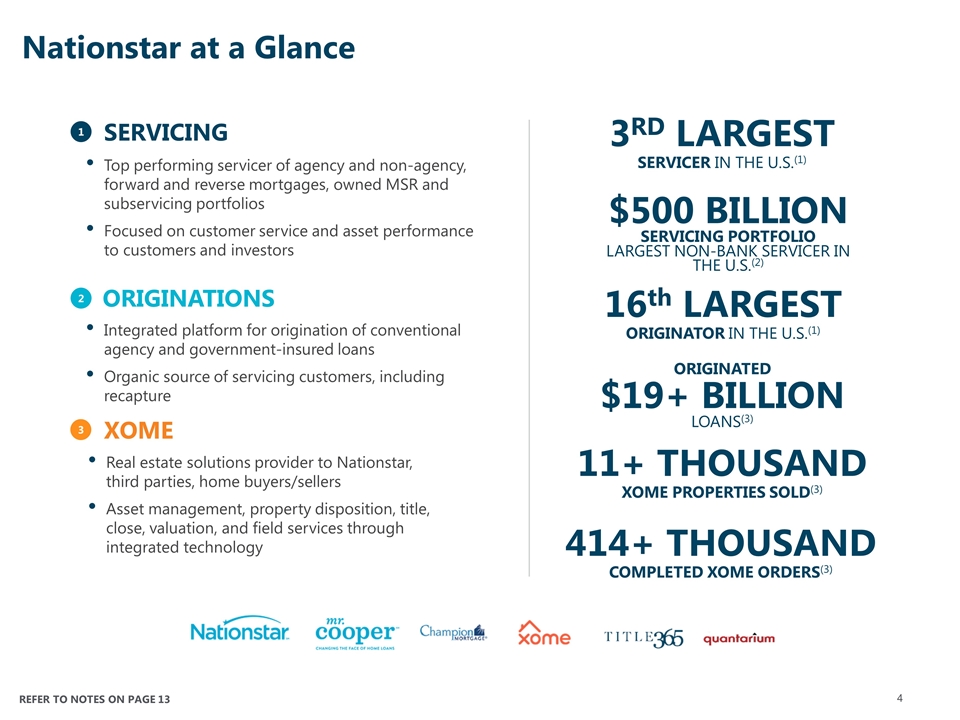
SERVICING ORIGINATIONS XOME Top performing servicer of agency and non-agency, forward and reverse mortgages, owned MSR and subservicing portfolios Focused on customer service and asset performance to customers and investors Integrated platform for origination of conventional agency and government-insured loans Organic source of servicing customers, including recapture Real estate solutions provider to Nationstar, third parties, home buyers/sellers Asset management, property disposition, title, close, valuation, and field services through integrated technology 1 2 3 $500 BILLION SERVICING PORTFOLIO LARGEST NON-BANK Servicer in the u.s.(2) Loans(3) $19+ BILLION Originated 16th LARGEST Originator in the u.s.(1) 3RD LARGEST servicer in the u.s.(1) 11+ THOUSAND XOME PROPERTIES SOLD(3) 414+ THOUSAND COMPLETED XOME ORDERS(3) Nationstar at a Glance REFER TO NOTES ON PAGE 13
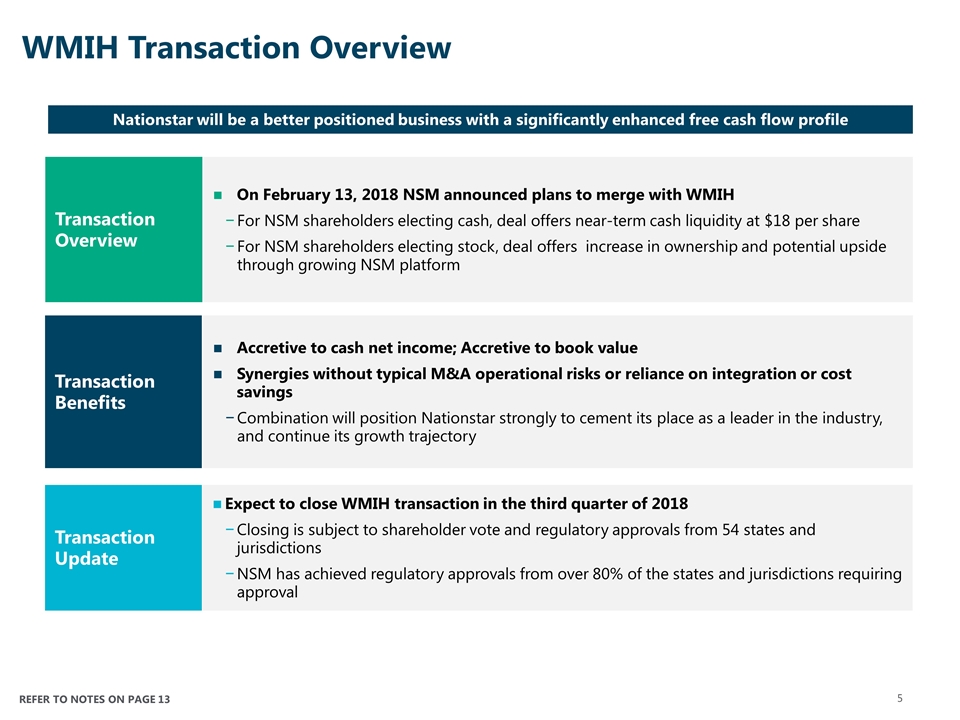
REFER TO NOTES ON PAGE 13 WMIH Transaction Overview Nationstar will be a better positioned business with a significantly enhanced free cash flow profile Transaction Benefits Accretive to cash net income; Accretive to book value Synergies without typical M&A operational risks or reliance on integration or cost savings Combination will position Nationstar strongly to cement its place as a leader in the industry, and continue its growth trajectory Transaction Update Expect to close WMIH transaction in the third quarter of 2018 Closing is subject to shareholder vote and regulatory approvals from 54 states and jurisdictions NSM has achieved regulatory approvals from over 80% of the states and jurisdictions requiring approval Transaction Overview On February 13, 2018 NSM announced plans to merge with WMIH For NSM shareholders electing cash, deal offers near-term cash liquidity at $18 per share For NSM shareholders electing stock, deal offers increase in ownership and potential upside through growing NSM platform
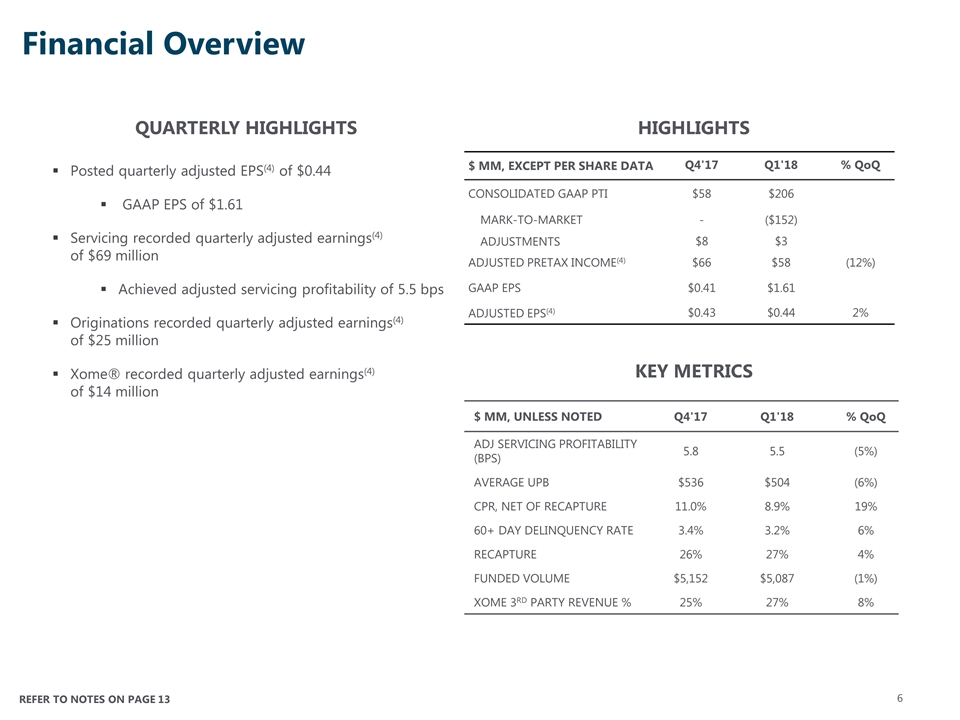
$ MM, EXCEPT PER SHARE DATA Q4'17 Q1'18 % QoQ CONSOLIDATED GAAP PTI $58 $206 MARK-TO-MARKET - ($152) ADJUSTMENTS $8 $3 ADJUSTED PRETAX INCOME(4) $66 $58 (12%) GAAP EPS $0.41 $1.61 ADJUSTED EPS(4) $0.43 $0.44 2% Posted quarterly adjusted EPS(4) of $0.44 GAAP EPS of $1.61 Servicing recorded quarterly adjusted earnings(4) of $69 million Achieved adjusted servicing profitability of 5.5 bps Originations recorded quarterly adjusted earnings(4) of $25 million Xome® recorded quarterly adjusted earnings(4) of $14 million HIGHLIGHTS Financial Overview QUARTERLY HIGHLIGHTS $ MM, UNLESS NOTED Q4'17 Q1'18 % QoQ ADJ SERVICING PROFITABILITY (BPS) 5.8 5.5 (5%) AVERAGE UPB $536 $504 (6%) CPR, NET OF RECAPTURE 11.0% 8.9% 19% 60+ DAY DELINQUENCY RATE 3.4% 3.2% 6% RECAPTURE 26% 27% 4% FUNDED VOLUME $5,152 $5,087 (1%) XOME 3RD PARTY REVENUE % 25% 27% 8% KEY METRICS REFER TO NOTES ON PAGE 13
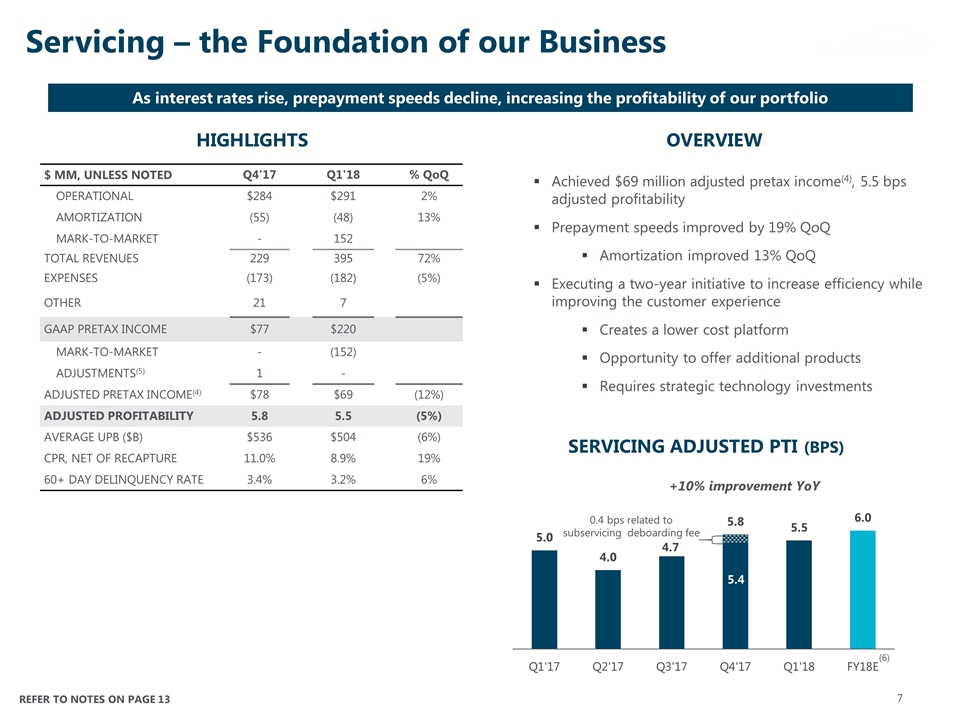
Servicing – the Foundation of our Business HIGHLIGHTS $ MM, UNLESS NOTED Q4'17 Q1'18 % QoQ OPERATIONAL $284 $291 2% AMORTIZATION (55) (48) 13% MARK-TO-MARKET - 152 TOTAL REVENUES 229 395 72% EXPENSES (173) (182) (5%) OTHER 21 7 GAAP PRETAX INCOME $77 $220 MARK-TO-MARKET - (152) ADJUSTMENTS(5) 1 - ADJUSTED PRETAX INCOME(4) $78 $69 (12%) ADJUSTED PROFITABILITY 5.8 5.5 (5%) AVERAGE UPB ($B) $536 $504 (6%) CPR, NET OF RECAPTURE 11.0% 8.9% 19% 60+ DAY DELINQUENCY RATE 3.4% 3.2% 6% OVERVIEW Achieved $69 million adjusted pretax income(4), 5.5 bps adjusted profitability Prepayment speeds improved by 19% QoQ Amortization improved 13% QoQ Executing a two-year initiative to increase efficiency while improving the customer experience Creates a lower cost platform Opportunity to offer additional products Requires strategic technology investments SERVICING ADJUSTED PTI (BPS) +10% improvement YoY 5.4 0.4 bps related to subservicing deboarding fee As interest rates rise, prepayment speeds decline, increasing the profitability of our portfolio REFER TO NOTES ON PAGE 13 (6)
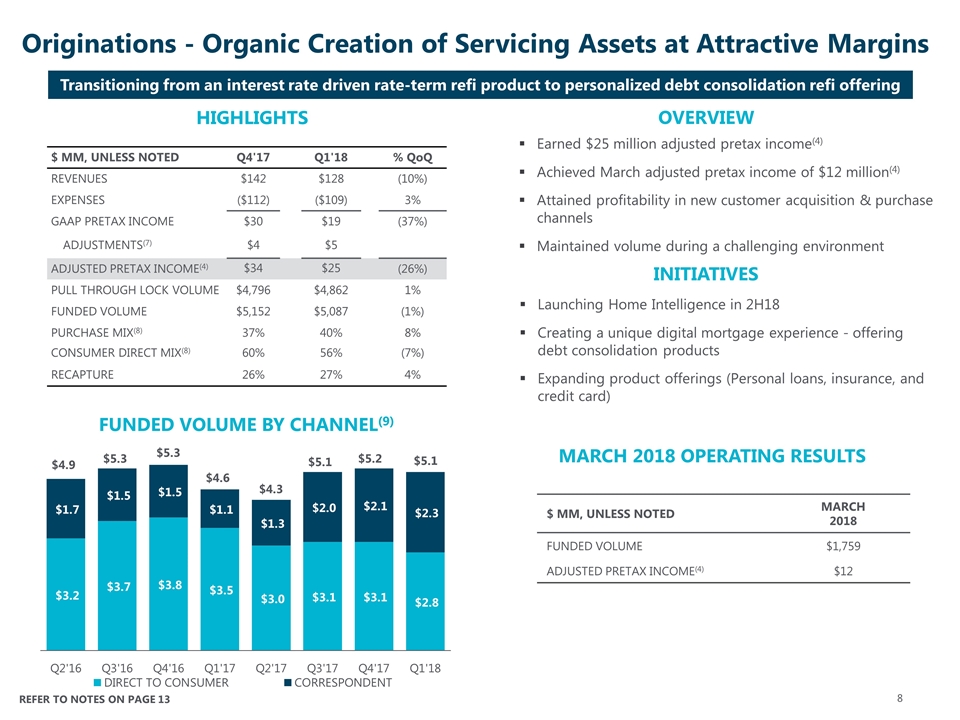
$ MM, UNLESS NOTED Q4'17 Q1'18 % QoQ REVENUES $142 $128 (10%) EXPENSES ($112) ($109) 3% GAAP PRETAX INCOME $30 $19 (37%) ADJUSTMENTS(7) $4 $5 ADJUSTED PRETAX INCOME(4) $34 $25 (26%) PULL THROUGH LOCK VOLUME $4,796 $4,862 1% FUNDED VOLUME $5,152 $5,087 (1%) PURCHASE MIX(8) 37% 40% 8% CONSUMER DIRECT MIX(8) 60% 56% (7%) RECAPTURE 26% 27% 4% Originations - Organic Creation of Servicing Assets at Attractive Margins OVERVIEW Earned $25 million adjusted pretax income(4) Achieved March adjusted pretax income of $12 million(4) Attained profitability in new customer acquisition & purchase channels Maintained volume during a challenging environment $4.9 $5.3 $5.3 $4.6 $4.3 $5.1 $5.2 FUNDED VOLUME BY CHANNEL(9) $5.1 HIGHLIGHTS $ MM, UNLESS NOTED MARCH 2018 FUNDED VOLUME $1,759 ADJUSTED PRETAX INCOME(4) $12 MARCH 2018 OPERATING RESULTS INITIATIVES Launching Home Intelligence in 2H18 Creating a unique digital mortgage experience - offering debt consolidation products Expanding product offerings (Personal loans, insurance, and credit card) REFER TO NOTES ON PAGE 13 Transitioning from an interest rate driven rate-term refi product to personalized debt consolidation refi offering
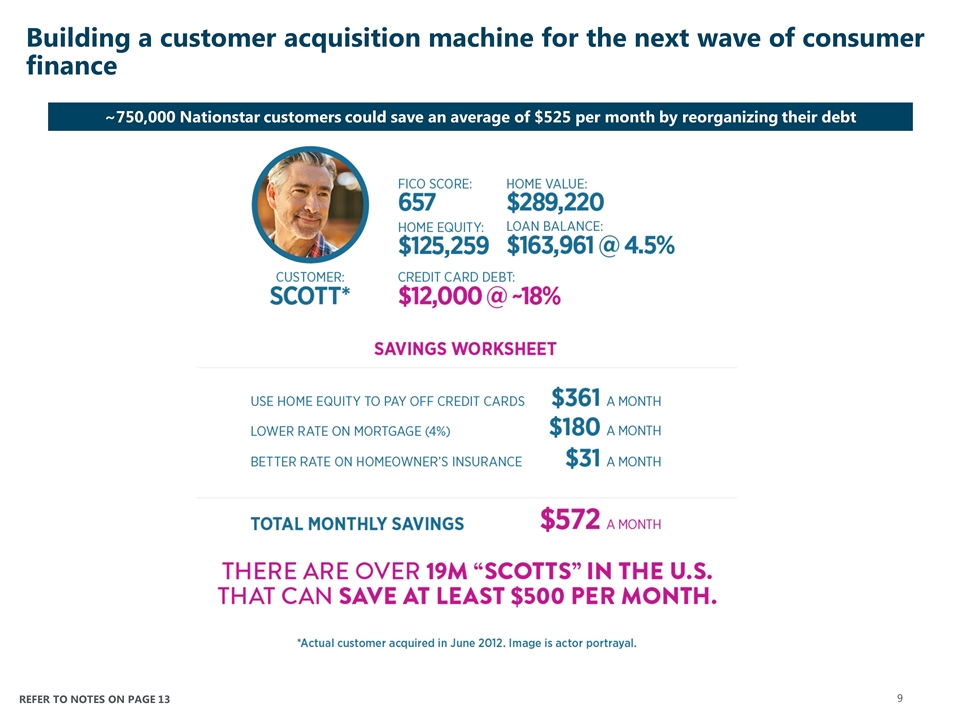
Building a customer acquisition machine for the next wave of consumer finance ~750,000 Nationstar customers could save an average of $525 per month by reorganizing their debt REFER TO NOTES ON PAGE 13
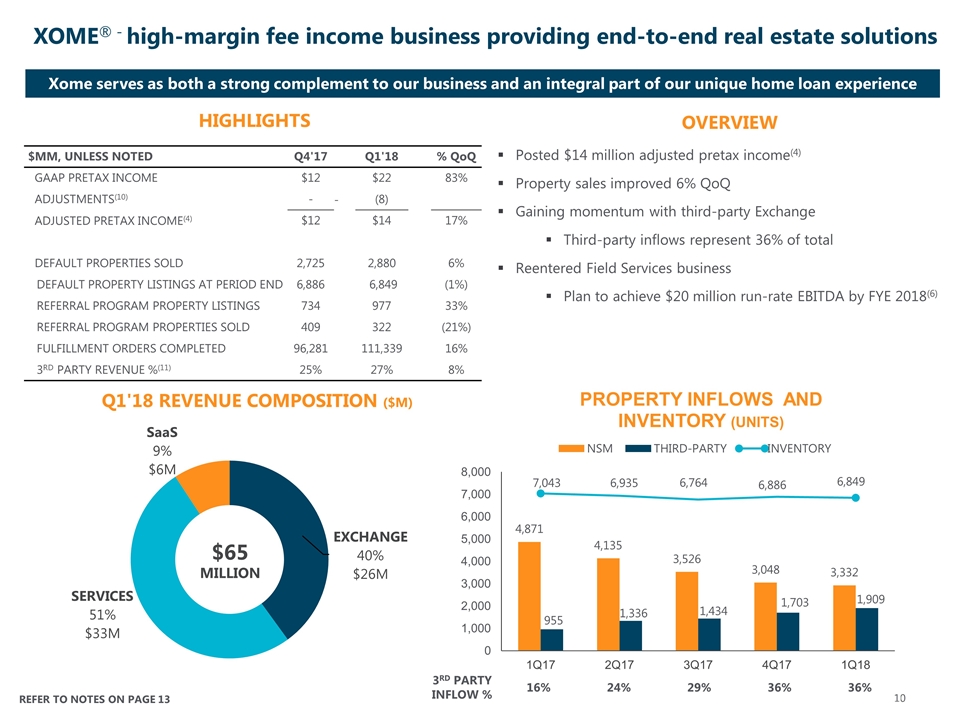
Posted $14 million adjusted pretax income(4) Property sales improved 6% QoQ Gaining momentum with third-party Exchange Third-party inflows represent 36% of total Reentered Field Services business Plan to achieve $20 million run-rate EBITDA by FYE 2018(6) OVERVIEW HIGHLIGHTS XOME® - high-margin fee income business providing end-to-end real estate solutions Q1'18 REVENUE COMPOSITION ($M) 3RD PARTY INFLOW % 16% 24% 29% 36% 36% $MM, UNLESS NOTED Q4'17 Q1'18 % QoQ GAAP PRETAX INCOME $12 $22 83% ADJUSTMENTS(10) - - (8) ADJUSTED PRETAX INCOME(4) $12 $14 17% DEFAULT PROPERTIES SOLD 2,725 2,880 6% DEFAULT PROPERTY LISTINGS AT PERIOD END 6,886 6,849 (1%) REFERRAL PROGRAM PROPERTY LISTINGS 734 977 33% REFERRAL PROGRAM PROPERTIES SOLD 409 322 (21%) FULFILLMENT ORDERS COMPLETED 96,281 111,339 16% 3RD PARTY REVENUE %(11) 25% 27% 8% REFER TO NOTES ON PAGE 13 Xome serves as both a strong complement to our business and an integral part of our unique home loan experience
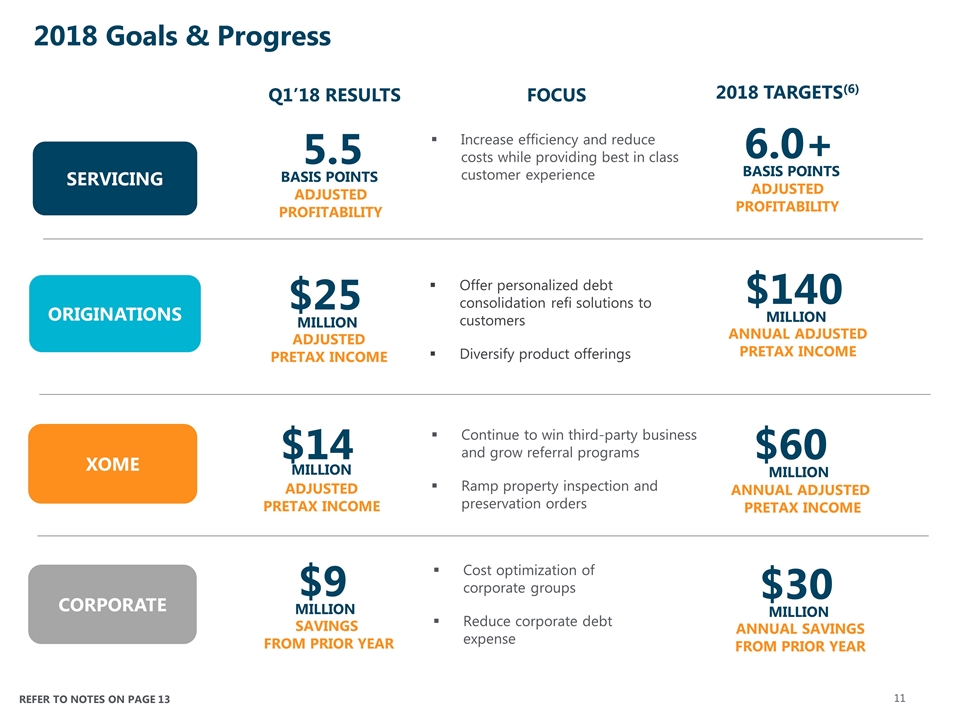
2018 Goals & Progress 2018 TARGETS(6) XOME ORIGINATIONS SERVICING 6.0+ ADJUSTED PROFITABILITY BASIS POINTS $140 ANNUAL ADJUSTED PRETAX INCOME MILLION $60 ANNUAL ADJUSTED PRETAX INCOME MILLION CORPORATE $30 ANNUAL SAVINGS FROM PRIOR YEAR MILLION 5.5 ADJUSTED PROFITABILITY BASIS POINTS $25 ADJUSTED PRETAX INCOME MILLION $14 ADJUSTED PRETAX INCOME MILLION $9 SAVINGS FROM PRIOR YEAR MILLION Q1’18 RESULTS FOCUS Increase efficiency and reduce costs while providing best in class customer experience Offer personalized debt consolidation refi solutions to customers Diversify product offerings Continue to win third-party business and grow referral programs Ramp property inspection and preservation orders Cost optimization of corporate groups Reduce corporate debt expense REFER TO NOTES ON PAGE 13
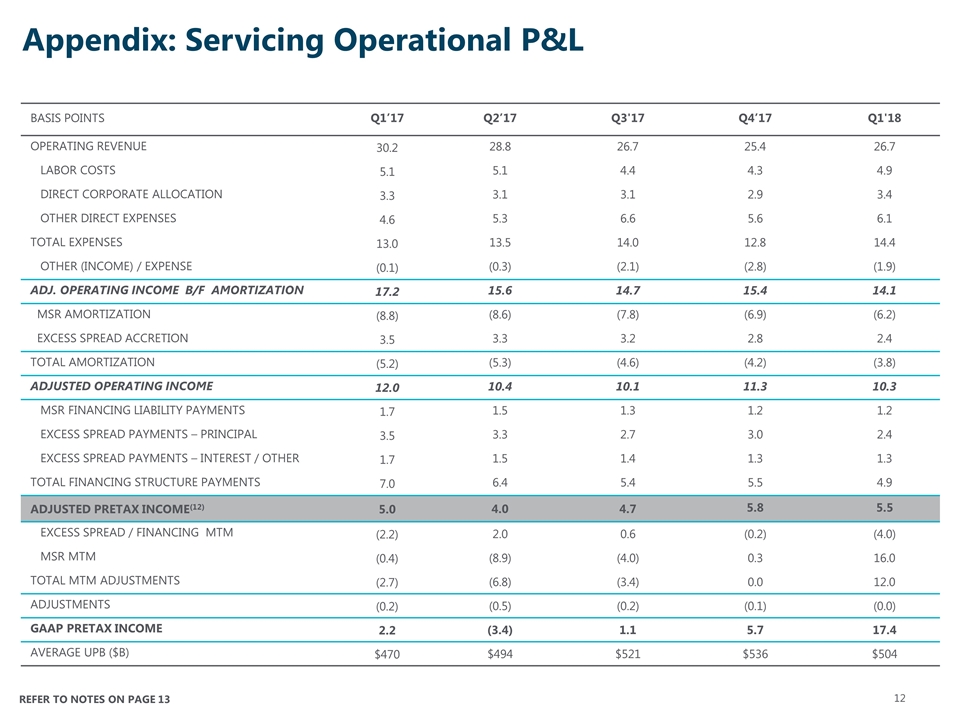
Basis points Q1’17 Q2’17 Q3'17 Q4’17 Q1'18 Operating Revenue 30.2 28.8 26.7 25.4 26.7 Labor costs 5.1 5.1 4.4 4.3 4.9 Direct corporate allocation 3.3 3.1 3.1 2.9 3.4 Other direct expenses 4.6 5.3 6.6 5.6 6.1 Total Expenses 13.0 13.5 14.0 12.8 14.4 Other (income) / expense (0.1) (0.3) (2.1) (2.8) (1.9) Adj. operating income b/f amortization 17.2 15.6 14.7 15.4 14.1 MSR amortization (8.8) (8.6) (7.8) (6.9) (6.2) Excess spread accretion 3.5 3.3 3.2 2.8 2.4 Total amortization (5.2) (5.3) (4.6) (4.2) (3.8) Adjusted operating income 12.0 10.4 10.1 11.3 10.3 MSR financing liability payments 1.7 1.5 1.3 1.2 1.2 Excess spread payments – principal 3.5 3.3 2.7 3.0 2.4 Excess spread payments – interest / other 1.7 1.5 1.4 1.3 1.3 Total financing structure payments 7.0 6.4 5.4 5.5 4.9 Adjusted Pretax income(12) 5.0 4.0 4.7 5.8 5.5 Excess Spread / Financing MTM (2.2) 2.0 0.6 (0.2) (4.0) MSR MTM (0.4) (8.9) (4.0) 0.3 16.0 Total MTM adjustments (2.7) (6.8) (3.4) 0.0 12.0 ADJUSTMENTS (0.2) (0.5) (0.2) (0.1) (0.0) GAAP Pretax Income 2.2 (3.4) 1.1 5.7 17.4 Average UPB ($B) $470 $494 $521 $536 $504 Appendix: Servicing Operational P&L REFER TO NOTES ON PAGE 13
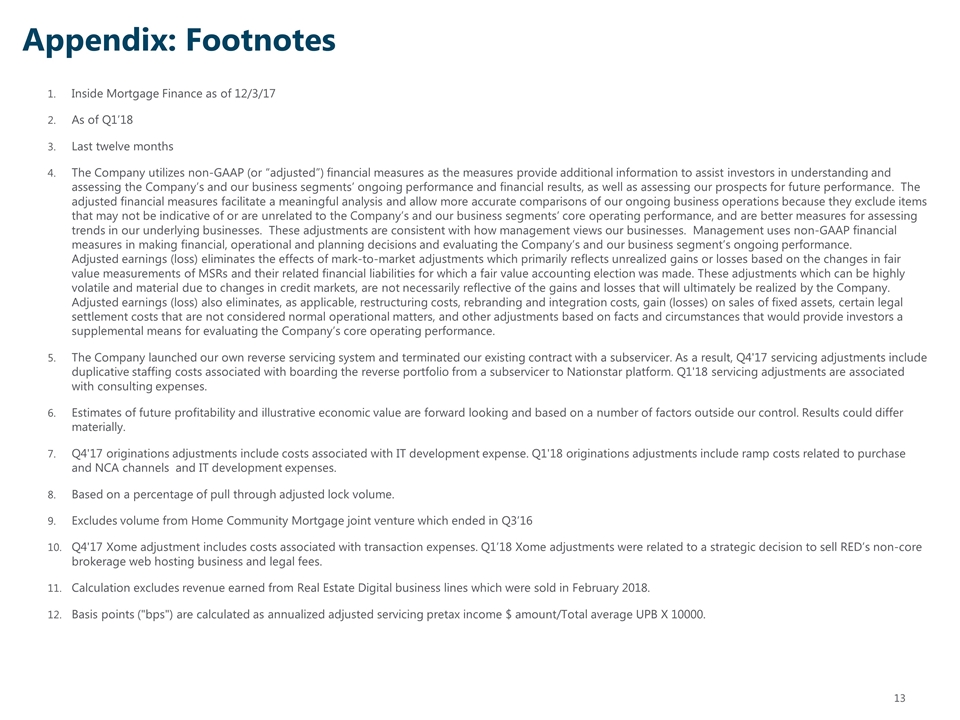
Appendix: Footnotes Inside Mortgage Finance as of 12/3/17 As of Q1’18 Last twelve months The Company utilizes non-GAAP (or “adjusted”) financial measures as the measures provide additional information to assist investors in understanding and assessing the Company’s and our business segments’ ongoing performance and financial results, as well as assessing our prospects for future performance. The adjusted financial measures facilitate a meaningful analysis and allow more accurate comparisons of our ongoing business operations because they exclude items that may not be indicative of or are unrelated to the Company’s and our business segments’ core operating performance, and are better measures for assessing trends in our underlying businesses. These adjustments are consistent with how management views our businesses. Management uses non-GAAP financial measures in making financial, operational and planning decisions and evaluating the Company’s and our business segment’s ongoing performance. Adjusted earnings (loss) eliminates the effects of mark-to-market adjustments which primarily reflects unrealized gains or losses based on the changes in fair value measurements of MSRs and their related financial liabilities for which a fair value accounting election was made. These adjustments which can be highly volatile and material due to changes in credit markets, are not necessarily reflective of the gains and losses that will ultimately be realized by the Company. Adjusted earnings (loss) also eliminates, as applicable, restructuring costs, rebranding and integration costs, gain (losses) on sales of fixed assets, certain legal settlement costs that are not considered normal operational matters, and other adjustments based on facts and circumstances that would provide investors a supplemental means for evaluating the Company’s core operating performance. The Company launched our own reverse servicing system and terminated our existing contract with a subservicer. As a result, Q4'17 servicing adjustments include duplicative staffing costs associated with boarding the reverse portfolio from a subservicer to Nationstar platform. Q1'18 servicing adjustments are associated with consulting expenses. Estimates of future profitability and illustrative economic value are forward looking and based on a number of factors outside our control. Results could differ materially. Q4'17 originations adjustments include costs associated with IT development expense. Q1'18 originations adjustments include ramp costs related to purchase and NCA channels and IT development expenses. Based on a percentage of pull through adjusted lock volume. Excludes volume from Home Community Mortgage joint venture which ended in Q3’16 Q4'17 Xome adjustment includes costs associated with transaction expenses. Q1’18 Xome adjustments were related to a strategic decision to sell RED’s non-core brokerage web hosting business and legal fees. Calculation excludes revenue earned from Real Estate Digital business lines which were sold in February 2018. Basis points ("bps") are calculated as annualized adjusted servicing pretax income $ amount/Total average UPB X 10000.
