Attached files
| file | filename |
|---|---|
| EX-99.1 - EXHIBIT 99.1 - TPI COMPOSITES, INC | exh_991.htm |
| 8-K - FORM 8-K - TPI COMPOSITES, INC | f8k_050318.htm |
Exhibit 99.2

Q1 2018 Earnings Call

Q1 2018 Earnings Call Legal Disclaimer This presentation contains forward - looking statements within the meaning of the federal securities laws. All statements other th an statements of historical facts contained in this presentation, including statements regarding our future results of operations and financial position, business strategy and p lan s and objectives of management for future operations, are forward - looking statements. In many cases, you can identify forward - looking statements by terms such as “may,” “ should,” “expects,” “plans,” “anticipates,” “could,” “intends,” “target,” “projects,” “contemplates,” “believes,” “estimates,” “predicts,” “potential” or “continue” or the negati ve of these terms or other similar words. Forward - looking statements contained in this presentation include, but are not limited to, statements about (i) growth of the wind energy mar ket and our addressable market; (ii) the potential impact of the increasing prevalence of auction - based tenders in the wind energy market and increased competition from solar energy on o ur gross margins and overall financial performance; (iii) our ability to successfully expand our transportation business and execute upon our strategy of entering n ew markets outside of wind energy; (iv) our future financial performance, including our net sales, cost of goods sold, gross profit or gross margin, operating expenses, ability to generate positive cash flow, and ability to achieve or maintain profitability; (v) the potential impact of GE’s acquisition of LM Wind Power upon our business; (vi) the sufficiency of our cash and cash equivalents to meet our liquidity needs; (vii) our ability to attract and retain customers for our products, and to optimize product pricing; (viii) our abilit y t o effectively manage our growth strategy and future expenses, including startup and transition costs; (ix) competition from other wind blade turbine manufacturers ; (x) the discovery of defects in our products; (xi) our ability to successfully expand in our existing wind energy markets and into new international wind energy markets; (xii) worldwide econo mic conditions and their impact on customer demand; (xiii) our ability to maintain, protect and enhance our intellectual property; (xiv) our ability to comply with exist ing , modified or new laws and regulations applying to our business, including the imposition of new taxes, duties or similar assessments on our products; (xv) the attraction and reten tio n of qualified employees and key personnel; and (xvi) changes in domestic or international government or regulatory policy, including without limitation, changes in trade policy These forward - looking statements are only predictions. These statements relate to future events or our future financial performa nce and involve known and unknown risks, uncertainties and other important factors that may cause our actual results, levels of activity, performance or achievements to materially differ from any future results, levels of activity, performance or achievements expressed or implied by these forward - looking statements. Because forward - looking statemen ts are inherently subject to risks and uncertainties, some of which cannot be predicted or quantified, you should not rely on these forward - looking statements as guara ntees of future events. Further information on the factors, risks and uncertainties that could affect our financial results and the forward - looking statements in this presentation are included in our filings with the Securities and Exchange Commission and will be included in subsequent periodic and current reports we make with the Securities and Exchange Com mission from time to time, including in our Annual Report on Form 10 - K for the year ended December 31, 2017. The forward - looking statements in this presentation represent our views as of the date of this presentation. We anticipate that subsequent events and developments will cause our views to change. However, while we may elect to update these forward - looking statements at some point in the future, we undertak e no obligation to update any forward - looking statement to reflect events or developments after the date on which the statement is made or to reflect the occurrence of una nti cipated events except to the extent required by applicable law. You should, therefore, not rely on these forward - looking statements as representing our views as of any date aft er the date of this presentation. Our forward - looking statements do not reflect the potential impact of any future acquisitions, mergers, dispositions, joint ventures, or investme nts we may make. This presentation includes unaudited non - GAAP financial measures including total billings, EBITDA, adjusted EBITDA, net cash (debt) and free cash flow. We define total billings as the total amounts we have invoiced our customers for products and services for which we are entitled to payment under the ter ms of our long - term supply agreements or other contractual agreements. We define EBITDA as net income (loss) attributable to the Company plus interest expense (including losses on the extinguishment of debt and net of interest income), income taxes and depreciation and amortization. We define Adjusted EBITDA as EBITDA plus any share - based compe nsation expense, plus or minus any gains or losses from foreign currency remeasurement. We define net cash (debt) as the total principal amount of debt outstanding le ss unrestricted cash and cash equivalents. We define free cash flow as net cash flow generated from operating activities less capital expenditures. We present non - GAAP measures when we believe that the additional information is useful and meaningful to investors. Non - GAAP financial measures do not have any standardized meaning and are therefore unlikely to be comparable to similar measures presented by other companies. The presentation of non - GAAP financial measures is not intended to be a substitute for, and should not be considered in isolation from, the financial measures reported in accordance with GAAP. See the appendix for the reconciliations of certain non - GAAP financial measures to th e comparable GAAP measures. This presentation also contains estimates and other information concerning our industry that are based on industry publicatio ns, surveys and forecasts. This information involves a number of assumptions and limitations, and we have not independently verified the accuracy or completeness of the information . 2 May 3, 2018

Q1 2018 Earnings Call Agenda • Q1 2018 Highlights • Industry Update • Q1 2018 Financial Highlights • Guidance for 2018 • Q&A • Appendix – Non - GAAP Information – Impact of ASC 606 on Q1 2017 3 May 3, 2018
Q1 2018 Highlights

Q1 2018 Earnings Call Q1 2018 Highlights 5 May 3, 2018 Q1 2018 Highlights and Recent Company News • Operating results and year - over - year increases compared to 201 7 • Net sales were up 21.7 % to $254.0 million for the quarter • Net income for the quarter improved to $ 8.6 million compared to $ 5.2 million in 2017 • Adjusted EBITDA for the quarter increased by 55.6% to $ 27.4 million • Adjusted EBITDA margin for the quarter was up 240 bps to 10.8 % • Signed a new multiyear supply agreement with Vestas for four lines in a new plant in Yangzhou, China and added a third line to our existing supply agreement in Turkey • Entered into an agreement with Navistar to design and develop a Class 8 truck comprised of a composite tractor and frame rails Net Sales and Adjusted EBITDA ($ in millions) $209 $254 $18 $27 $0 $200 $400 Q1 '17 Q1 '18 Q1 '17 Q1 '18 Sets invoiced 636 569 Est. MW 1,460 1,464 Dedicated lines (1) 44 46 Lines installed (2) 39 38 (1) Number of wind blade manufacturing lines dedicated to our customers under long - term supply agreement s. (2) Number of wind blade manufacturing lines installed that are either in operation, startup or transition 21.7% 55.6% Net Sales Adjusted EBITDA

Q1 2018 Earnings Call Existing Contracts Provide for ~$ 5.4 Billion in Potential Revenue through 2023 (1) 6 May 3, 2018 Long - term Supply Agreements (1) 2018 2019 2020 2021 2022 2023 U.S. Turkey Mexico China Long - term supply agreements provide for estimated minimum aggregate volume commitments from our customers of approximately $ 3.6 billion and encourage our customers to purchase additional volume up to, in the aggregate, an estimated total potential revenue of approximately $5.4 billion through the end of 2023 (1) Note: Our contracts with some of our customers are subject to termination or reduction on short notice, generally with substa nti al penalties, and contain liquidated damages provisions, which may require us to make unanticipated payments to our customers or our customers to make payments to us. (1) As of May 3, 2018. The chart depicts the term of the longest contract in each location .

Industry Update

Q1 2018 Earnings Call Onshore Global Market Growth 8 May 3, 2018 Annual I nstalled G lobal W ind C apacity (GW): 201 7 – 202 7 E 39.1 45.8 5.0 17.4 2017 2027E Developing wind markets Mature wind markets Source: MAKE Q 4 2017 Global Wind Power Market Outlook Update Note: Developing wind markets defined as fewer than 6 GW of 2016 installed capacity Annual installed wind capacity growth is propelled by an increase in developing wind markets, including Turkey and Mexico where TPI Composites is well positioned to succeed 44.1 CAGR 1.6 % CAGR 13.3 % Mature wind market share Developing market s market share 11.4 % 8 8.6 % 25.5 % 74.5 % 6 3 . 3

Q1 2018 Earnings Call U.S. Onshore Market Growth: 2011 – 2020E 9 May 3, 2018 The U.S. wind market is expected to experience consistent near - term growth in light of the PTC phase out Source: MAKE Q4 2017 Global Wind Power Market Outlook Update (GW) U.S. Onshore Wind Market Growth - Capacity (2011 – 2015) 6.2 12.5 1.1 4.8 8.6 0 3 6 9 12 15 2011 2012 2013 2014 2015 8.9 7.0 8.9 10.8 12.4 2016 2017E 2018E 2019E 2020E U.S. Onshore Wind Market Growth – Capacity (2016 – 2020E) Average annual installation: 10.7 GW (2018 – 2020) Total U.S. wind installations: 32.1 GW (2018 – 2020) Average annual installation: 6.6 GW Total U.S. wind installations: 33.2 GW
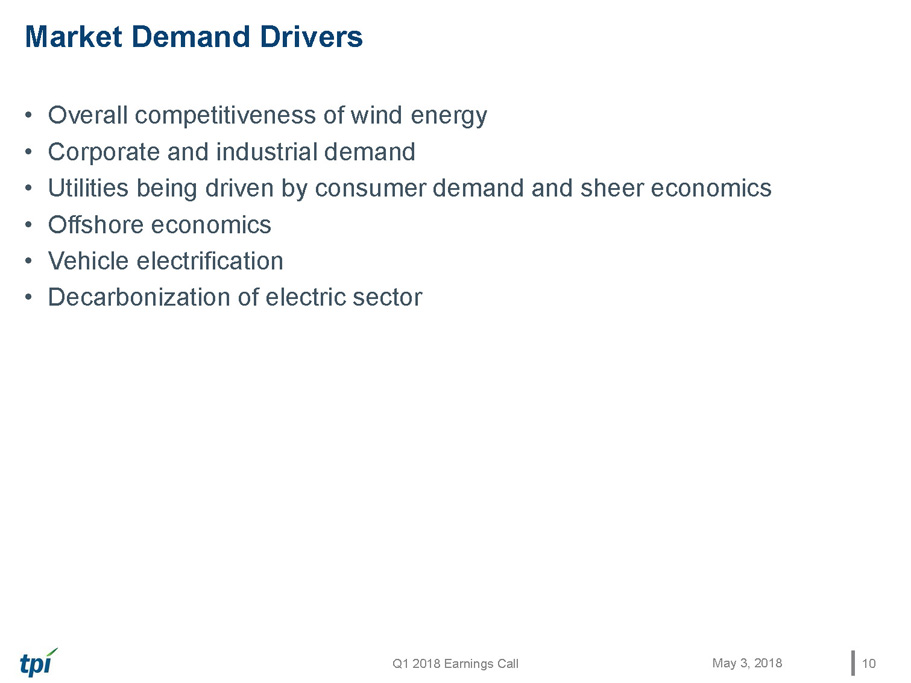
Q1 2018 Earnings Call Market Demand Drivers • Overall competitiveness of wind energy • Corporate and industrial demand • Utilities being driven by consumer demand and sheer economics • Offshore economics • Vehicle electrification • Decarbonization of electric sector 10 May 3, 2018

Q1 2018 Financial Highlights

Q1 2018 Earnings Call Q1 2018 Financial Highlights (unaudited) 12 May 3, 2018 (1) See pages 20 – 22 for reconciliations of non - GAAP financial data ($ in millions, except per share data and KPIs) Q1 ’18 Q1 ’17 ∆ Select Financial Data Net Sales $ 254.0 $ 208.6 21.7% Total Billings (1) $ 223.7 $ 211.4 5.8% Net Income $ 8.6 $ 5.2 65.9% Diluted Earnings Per Share $ 0.24 $ 0.15 $ 0.09 Adjusted EBITDA (1) $ 27.4 $ 17.6 55.6% Adjusted EBITDA Margin 10.8% 8.4% 240 bps Net Cash (Debt) (1) $ 11.1 $ (7.1) $ 18.2 Free Cash Flow (1) $ (14.7) $ (7.0) $ (7.8) Capital Expenditures $ 11.7 $ 16.9 $ (5.2) Key Performance Indicators (KPIs) Sets Invoiced 569 636 (67) Estimated Megawatts 1,464 1,460 4 Dedicated Wind Blade Manufacturing Lines 46 44 2 lines Wind Blade Manufacturing Lines Installed 38 39 1 line Wind Blade Manufacturing Lines in Startup 10 9 1 line Wind Blade Manufacturing Lines in Transition 4 — 4 lines

Q1 2018 Earnings Call Income Statement Summary (unaudited) 13 May 3, 2018 (1) See pages 20 – 22 for reconciliations of Non - GAAP financial data 2018 2017 $ % ($ in thousands, except per share amounts) Net sales 253,981$ 208,615$ 45,366$ 21.7% Cost of sales 210,988$ 182,538$ 28,450$ 15.6% Startup and transition costs 14,735$ 6,159$ 8,576$ 139.2% Total cost of goods sold 225,723$ 188,697$ 37,026$ 19.6% Cost of goods sold % 88.9% 90.5% -160 bps Gross profit 28,258$ 19,918$ 8,340$ 41.9% Gross profit % 11.1% 9.5% 160 bps General and administrative expenses 11,163$ 8,306$ 2,857$ 34.4% General and administrative expenses % 4.4% 4.0% 40 bps Income from operations 17,095$ 11,612$ 5,483$ 47.2% Income before income taxes 10,605$ 7,544$ 3,061$ 40.6% Net income 8,648$ 5,213$ 3,435$ 65.9% Weighted-average common shares outstanding: Basic 34,049 33,737 Diluted 35,479 33,827 Net income per common share: Basic 0.25$ 0.15$ 0.10$ Diluted 0.24$ 0.15$ 0.09$ Non-GAAP Metrics Total billings (1) 223,701$ 211,360$ 12,341$ 5.8% EBITDA (1) 20,974$ 14,502$ 6,472$ 44.6% EBITDA margin 8.3% 7.0% 130 bps Adjusted EBITDA (1) 27,373$ 17,590$ 9,783$ 55.6% Adjusted EBITDA margin 10.8% 8.4% 240 bps Three Months Ended March 31, Change
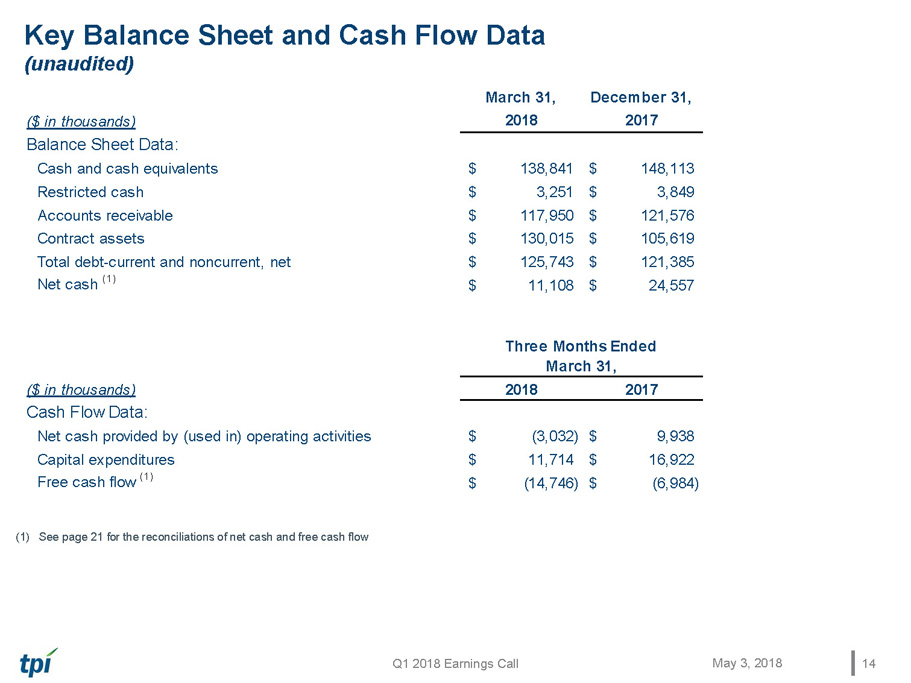
Q1 2018 Earnings Call Key Balance Sheet and Cash Flow Data (unaudited) 14 May 3, 2018 (1) See page 21 for the reconciliation s of net cash and free cash flow March 31, December 31, ($ in thousands) 2018 2017 Balance Sheet Data: Cash and cash equivalents 138,841$ 148,113$ Restricted cash 3,251$ 3,849$ Accounts receivable 117,950$ 121,576$ Contract assets 130,015$ 105,619$ Total debt-current and noncurrent, net 125,743$ 121,385$ Net cash (1) 11,108$ 24,557$ ($ in thousands) 2018 2017 Cash Flow Data: Net cash provided by (used in) operating activities (3,032)$ 9,938$ Capital expenditures 11,714$ 16,922$ Free cash flow (1) (14,746)$ (6,984)$ Three Months Ended March 31,

Guidance for 2018

Q1 2018 Earnings Call Key Guidance Metrics 16 May 3, 2018 Full Year 2018 Total Billings (1) $1.0B – $1.05B Net Sales $1.0B – $1.05B Adjusted EBITDA $75M – $80M Earnings per Share - FD $0.38 – $0.42 Sets 2,500 – 2,525 Average Selling Price per Blade $125K - – $130K Non - Blade Billings $75M – $80M G&A Costs as a % of Billings (incl. SBC) 4% – 5% Estimated MW 6,950 – 7,100 Dedicated Lines - EOY 51 – 55 Share - Based Compensation $10M - – $11M Depreciation & Amortization $30M – $35M Net Interest Expense $11.5M – $12.5M Capital Expenditures $85M – $90M Effective Tax Rate 40% – 42% Note: All reference to lines is to wind blade manufacturing lines (1) We have not reconciled our total expected billings for 2018 to expected net sales under GAAP because we have not yet finalize d c alculations necessary to provide the reconciliation and as such the reconciliation is not possible without unreasonable efforts.

Q1 2018 Earnings Call Sets and Startup & Transition Costs G uidance Metrics 17 May 3, 2018 2018 Q2 Q3 Q4 Full Year Lines Installed – end of period 40 47 47 47 Lines in Startup – during period 6 8 8 12 Lines in Transition – during period 10 10 5 14 Startup & Transition Costs $19M - $20M $15M - $16M $9M - $10M $58M - $61M Sets 585 - 590 650 - 660 695 - 705 2,500 – 2,525

Q&A

Appendix – Non - GAAP Information This presentation includes unaudited non - GAAP financial measures including total billings, EBITDA, adjusted EBITDA, net cash (de bt) and free cash flow. We define total billings as the total amounts we have invoiced our customers for products and services fo r w hich we are entitled to payment under the terms of our long - term supply agreements or other contractual agreements. We define EBITDA as net income (loss) attributable to the Company plus interest expense (including losses on the extinguishment of debt and net of in ter est income), income taxes, and depreciation and amortization. We define adjusted EBITDA as EBITDA plus any share - based compensation expense, plus or minus any gains or losses from foreign currency remeasurement. We define net cash (debt) as the to tal principal amount of debt outstanding less unrestricted cash and cash equivalents. We define free cash flow as net cash flow g ene rated from operating activities less capital expenditures. We present non - GAAP measures when we believe that the additional informatio n is useful and meaningful to investors. Non - GAAP financial measures do not have any standardized meaning and are therefore unlikely to be comparable to similar measures presented by other companies. The presentation of non - GAAP financial measures is not intended to be a substitute for, and should not be considered in isolation from, the financial measures reported in accordance with GA AP. See below for a reconciliation of certain non - GAAP financial measures to the comparable GAAP measures.
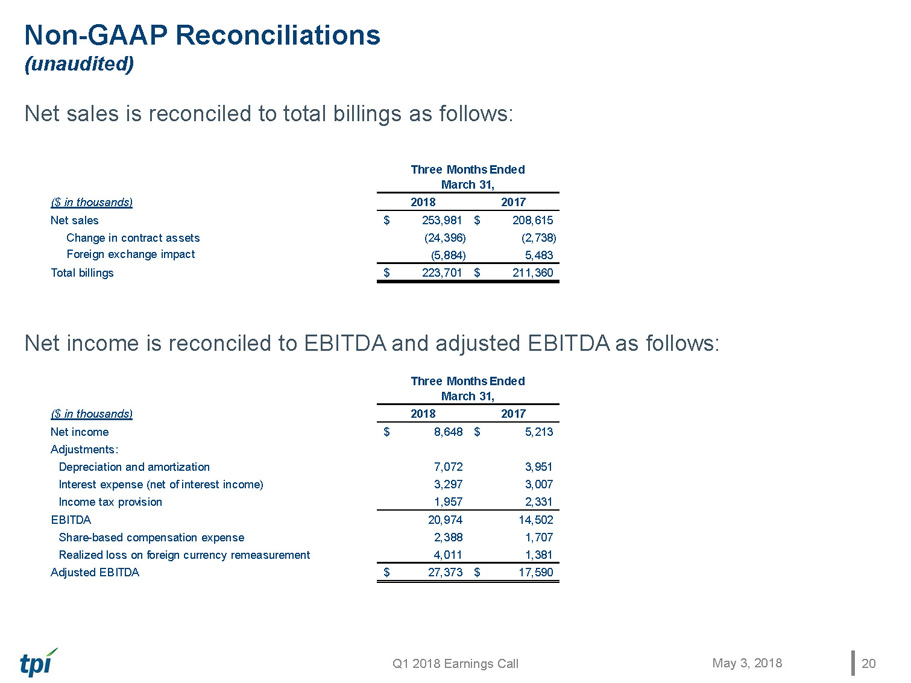
Q1 2018 Earnings Call Non - GAAP Reconciliations (unaudited) Net sales is reconciled to total billings as follows: Net income is reconciled to EBITDA and adjusted EBITDA as follows: 20 May 3, 2018 ($ in thousands) 2018 2017 Net income 8,648$ 5,213$ Adjustments: Depreciation and amortization 7,072 3,951 Interest expense (net of interest income) 3,297 3,007 Income tax provision 1,957 2,331 EBITDA 20,974 14,502 Share-based compensation expense 2,388 1,707 Realized loss on foreign currency remeasurement 4,011 1,381 Adjusted EBITDA 27,373$ 17,590$ Three Months Ended March 31, ($ in thousands) 2018 2017 Net sales 253,981$ 208,615$ Change in contract assets (24,396) (2,738) Foreign exchange impact (5,884) 5,483 Total billings 223,701$ 211,360$ Three Months Ended March 31,

Q1 2018 Earnings Call Non - GAAP Reconciliations (continued) (unaudited) Net cash (debt) is reconciled as follows: Free cash flow is reconciled as follows: 21 May 3, 2018 March 31, December 31, March 31, ($ in thousands) 2018 2017 2017 Total debt, net of debt issuance costs (125,743)$ (121,385)$ (120,489)$ Less debt issuance costs (1,990) (2,171) (2,147) Add cash and cash equivalents 138,841 148,113 115,541 Net cash (debt) 11,108$ 24,557$ (7,095)$ ($ in thousands) 2018 2017 Net cash provided by (used in) operating activities (3,032)$ 9,938$ Less capital expenditures (11,714) (16,922) Free cash flow (14,746)$ (6,984)$ Three Months Ended March 31,
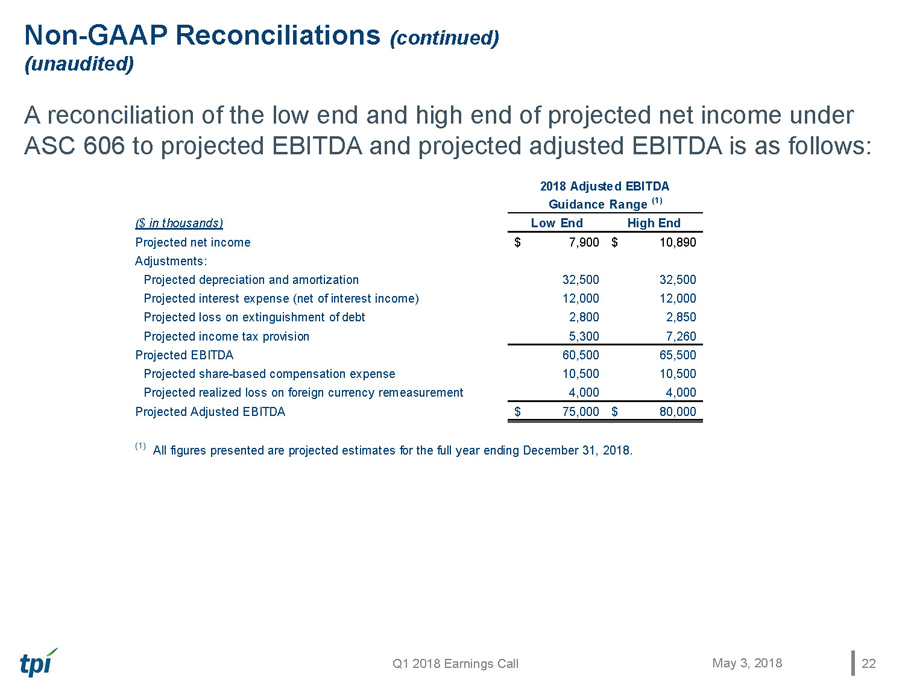
Q1 2018 Earnings Call Non - GAAP Reconciliations (continued) (unaudited) A reconciliation of the low end and high end of projected net income under ASC 606 to projected EBITDA and projected adjusted EBITDA is as follows: 22 May 3, 2018 ($ in thousands) Low End High End Projected net income 7,900$ 10,890$ Adjustments: Projected depreciation and amortization 32,500 32,500 Projected interest expense (net of interest income) 12,000 12,000 Projected loss on extinguishment of debt 2,800 2,850 Projected income tax provision 5,300 7,260 Projected EBITDA 60,500 65,500 Projected share-based compensation expense 10,500 10,500 Projected realized loss on foreign currency remeasurement 4,000 4,000 Projected Adjusted EBITDA 75,000$ 80,000$ (1) All figures presented are projected estimates for the full year ending December 31, 2018. 2018 Adjusted EBITDA Guidance Range (1)

Impact of ASC 606

Q1 2018 Earnings Call Impact of ASC 606 on Q1 2017 24 May 3, 2018 Three Months Ended March 31, 2017 As Reported Adoption of Topic 606 As Adjusted (Unaudited) Net sales $ 191,602 $ 17,013 $ 208,615 Cost of sales 167,423 15,115 182,538 Startup and transition costs 6,159 — 6,159 Total cost of goods sold 173,582 15,115 188,697 Gross profit 18,020 1,898 19,918 General and administrative expenses 8,306 — 8,306 Income from operations 9,714 1,898 11,612 Other income (expense): Interest income 19 — 19 Interest expense (3,026 ) — (3,026 ) Realized loss on foreign currency remeasurement (1,381 ) — (1,381 ) Miscellaneous income 320 — 320 Total other expense (4,068 ) — (4,068 ) Income before income taxes 5,646 1,898 7,544 Income tax provision (2,101 ) (230 ) (2,331 ) Net income $ 3,545 $ 1,668 $ 5,213 Weighted-average common shares outstanding: Basic 33,737 33,737 33,737 Diluted 33,827 33,827 33,827 Net income per common share: Basic $ 0.11 $ 0.05 $ 0.15 Diluted $ 0.10 $ 0.05 $ 0.15
