Attached files
| file | filename |
|---|---|
| 8-K - FORM 8-K - HomeStreet, Inc. | q12018investorslides.htm |

Nasdaq: HMST
1st Quarter
2018
as of May 3, 2018

Important Disclosures
Forward-Looking Statements
This presentation includes forward-looking statements, as that term is defined for purposes of applicable securities laws, about our industry, our
future financial performance and business plans and expectations. These statements are, in essence, attempts to anticipate or forecast future
events, and thus subject to many risks and uncertainties. These forward-looking statements are based on our management's current expectations,
beliefs, projections, future plans and strategies, anticipated events or trends, and similar expressions concerning matters that are not historical
facts, as well as a number of assumptions concerning future events. Forward-looking statements in this release include, among other matters,
statements regarding our business plans and strategies, general economic trends (particularly those that affect mortgage origination and refinance
activity) and growth scenarios and performance targets. Readers should note, however, that all statements in this presentation other than
assertions of historical fact are forward-looking in nature. These statements are subject to risks, uncertainties, assumptions and other important
factors set forth in our SEC filings, including but not limited to our annual report on Form 10-K for the year ended December 31, 2107. Many of
these factors and events that affect the volatility in our stock price and shareholders’ response to those events and factors are beyond our control.
Such factors could cause actual results to differ materially from the results discussed or implied in the forward-looking statements. These risks
include without limitation changes in general political and economic conditions that impact our markets and our business, actions by the Federal
Reserve Board and financial market conditions that affect monetary and fiscal policy, regulatory and legislative findings or actions that may
increase capital requirements or otherwise constrain our ability to do business, including restrictions that could be imposed by our regulators on
certain aspects of our operations or on our growth initiatives and acquisition activities, risks related to our ability to realize the expected cost
savings from our recent restructuring activities and cost containment measures, continue to expand our commercial and consumer banking
operations, grow our franchise and capitalize on market opportunities, cost-effectively manage our overall growth efforts to attain the desired
operational and financial outcomes, manage the losses inherent in our loan portfolio, make accurate estimates of the value of our non-cash assets
and liabilities, maintain electronic and physical security of customer data, respond to restrictive and complex regulatory environment, and attract
and retain key personnel. In addition, the volume of our mortgage banking business as well as the ratio of loan lock to closed loan volume may
fluctuate due to challenges our customers may face in meeting current underwriting standards, a change in interest rates, an increase in
competition for such loans, changes in general economic conditions, including housing prices and inventory levels, the job market, consumer
confidence and spending habits either nationally or in the regional and local market areas in which the Company does business, and legislative or
regulatory actions or reform that may affect our business or the banking or mortgage industries more generally. Actual results may fall materially
short of our expectations and projections, and we may change our plans or take additional actions that differ in material ways from our current
intentions. Accordingly, we can give no assurance of future performance, and you should not rely unduly on forward-looking statements. All
forward-looking statements are based on information available to the Company as of the date hereof, and we do not undertake to update or revise
any forward-looking statements, for any reason.
Basis of Presentation of Financial Data
Unless noted otherwise in this presentation, all reported financial data is being presented as of the period ending March 31, 2017, and is
unaudited, although certain information related to the year ended December 31, 2017, has been derived from our audited financial statements.
All financial data should be read in conjunction with the notes in our consolidated financial statements.
p. 1
Important Additional Information
Important Additional Information
HomeStreet, Inc. (“HMST” or the “Company”), its directors and certain of its executive officers are participants in the solicitation of proxies from
the Company’s shareholders in connection with the 2018 Annual Meeting. The Company has filed a definitive proxy statement and form of WHITE
proxy card with the SEC in connection with such solicitation of proxies from the Company’s shareholders (the “Definitive Proxy Statement”).
SHAREHOLDERS OF THE COMPANY ARE STRONGLY ENCOURAGED TO READ THE COMPANY’S DEFINITIVE PROXY STATEMENT AND ANY
SUPPLEMENTS THERETO, THE ACCOMPANYING WHITE PROXY CARD AND ALL OTHER DOCUMENTS FILED WITH THE SEC CAREFULLY AND
IN THEIR ENTIRETY WHEN THEY BECOME AVAILABLE AS THEY WILL CONTAIN IMPORTANT INFORMATION. The Definitive Proxy Statement
contains information regarding the direct and indirect interests, by security holdings or otherwise, of the Company’s directors and executive
officers in the Company’s securities. In the event that holdings of the Company’s securities change from the amounts disclosed in the Definitive
Proxy Statement, such changes will be set forth in SEC filings on Forms 3, 4 and 5, which can be found through the Company’s website at
www.homestreet.com in the section “Investor Relations” or through the SEC’s website at www.sec.gov. Shareholders will be able to obtain the
Definitive Proxy Statement, any amendments or supplements to the Definitive Proxy Statement and other documents filed by the Company with
the SEC at no charge at the SEC’s website at www.sec.gov. Copies will also be available at no charge at the Company’s website at
www.homestreet.com in the section “Investor Relations.”
Non-GAAP Financial Measures and Targets
Information on any non-GAAP financial measures such as core measures or tangible measures referenced in this presentation, including a
reconciliation of those measures to GAAP measures, may also be found in the appendix, our SEC filings, and in the earnings release available on
our web site.
This presentation refers to long-term targets. Because targets are forward-looking and not based on historical performance, it is not possible to
provide a reconciliation without undertaking unreasonable efforts. A GAAP reconciliation would require estimates of such excluded items, and it
is not possible to estimate such excluded items at this time.
p. 2
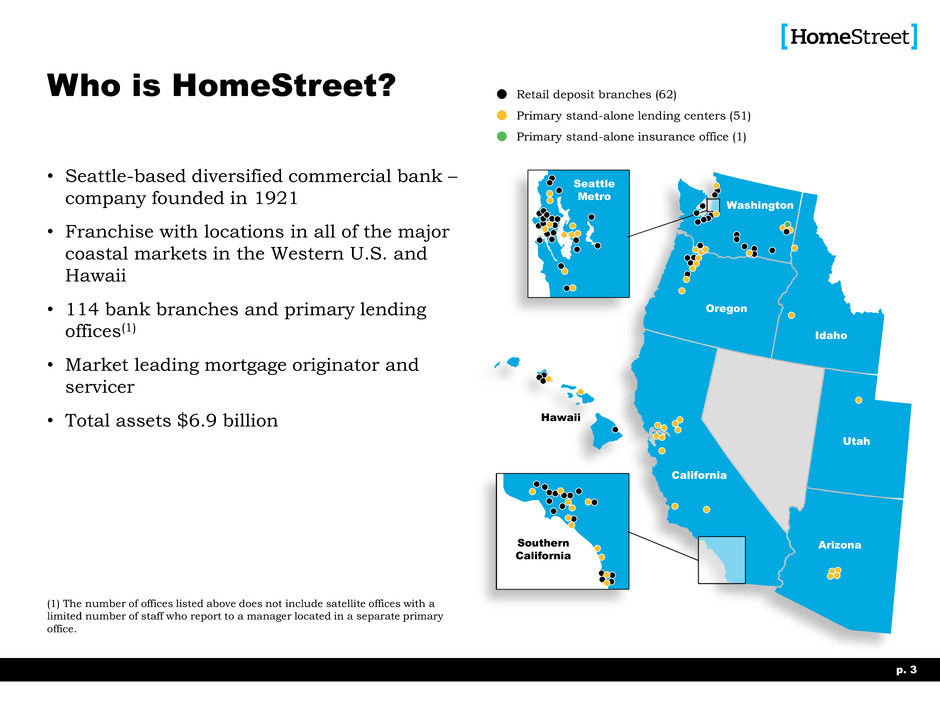
Seattle
Metro
Washington
Oregon
Idaho
Utah
Arizona
California
Hawaii
Southern
California
Retail deposit branches (62)
Primary stand-alone insurance office (1)
Primary stand-alone lending centers (51)
Who is HomeStreet?
• Seattle-based diversified commercial bank –
company founded in 1921
• Franchise with locations in all of the major
coastal markets in the Western U.S. and
Hawaii
• 114 bank branches and primary lending
offices(1)
• Market leading mortgage originator and
servicer
• Total assets $6.9 billion
p. 3
(1) The number of offices listed above does not include satellite offices with a
limited number of staff who report to a manager located in a separate primary
office.
p. 4
Grow and diversify
earnings with the
goal of becoming a
leading West
Coast, major
market footprint,
regional bank
Consolidated ROTE target
> 15%
Market Focus:
• Seattle / Puget Sound & Spokane, WA
• Portland, OR
• San Francisco / Bay Area, CA
• Southern California
• Hawaiian Islands

Strategy
• Grow and diversify loan portfolio with
focus on expanding commercial lending
• Grow core deposits to improve deposit mix
and support asset growth
• Improve efficiency through operating
leverage and process improvements
• Expand product offerings and be a
technology fast follower
• Grow market share in highly attractive
metropolitan markets
p. 5
Expand Commercial &
Consumer Banking Segment

Strategy (cont.)
• Committed to being a leading mortgage
originator and servicer in our markets
with a retail origination focus, broad
product mix, and superior customer
service
• Focus on optimizing mortgage banking
capacity within existing geographic
footprint
• Leverage mortgage customer distribution
by marketing bank products and services
p. 6
Optimize Single Family
Mortgage Banking & Servicing
Segment

Strategy (cont.)
• Mitigate cost of growth through operating
leverage and disciplined expense control
• Long-term target consolidated efficiency
ratio <70%
• Segment efficiency ratio targets
– Commercial and Consumer <60%
– Mortgage Banking <85%
p. 7
Disciplined Expense
Management

$2,000
$3,000
$4,000
$5,000
$6,000
$7,000
$8,000
1Q13 2Q13 3Q13 4Q13 1Q14 2Q14 3Q14 4Q14 1Q15 2Q15 3Q15 4Q15 1Q16 2Q16 3Q16 4Q16 1Q17 2Q17 3Q17 4Q17 1Q18
Bank & Branch M&A
Organic Growth
Delivering Consistent Growth
Total Assets
p. 8
$ Millions
November 2013:
Fortune ($142M)
Yakima ($125M)
December 2013
2 Branches ($32M)
Compound annual growth rate
of 23% & compound organic
growth rate of 16%
March 2015:
Simplicity ($879M)
December 2015:
1 Branch ($26M)
February 2016:
OCCB ($200M)
August 2016:
The Bank of
Oswego ($42M)
November 2016:
2 Branches ($105M)
September 2017:
1 Branch ($22M)

$1,000
$1,500
$2,000
$2,500
$3,000
$3,500
$4,000
$4,500
$5,000
$5,500
1Q13 2Q13 3Q13 4Q13 1Q14 2Q14 3Q14 4Q14 1Q15 2Q15 3Q15 4Q15 1Q16 2Q16 3Q16 4Q16 1Q17 2Q17 3Q17 4Q17 1Q18
Delivering Consistent Growth (cont.)
Total Deposits
p. 9
$ Millions
Capitol Hill
Compound annual growth
rate of 21%
Everett
Ballard
Greenlake
Madison PK
Phinney Ridge
University
Issaquah
Kaimuki
Mission Gorge
Kearny Mesa
Riverside
Point Loma
Kennewick
Baldwin Park
Redmond
Spokane
De Novo Branch Openings Mill Creek
Lake City
Gig Harbor
Operating Highlights
p. 10
Results of Operations
• First quarter 2018 core net income of $5.6 million, or $0.21
diluted EPS1
• Core net income of $10.2 million in Commercial and Consumer
Banking Segment, core ROTE of 7.8%1
• Total assets ended Mar. 31, 2018, at $6.9 billion, loans held for
investment at $4.8 billion
• Total deposits of $5.1 billion
• Nonperforming asset ratio of 0.16%, the lowest level of problem
assets since 2006
Strategic Results
• Three de novo retail branches opened in Puget Sound during the
quarter – in Lake City area of Seattle, in Mill Creek, a northern
suburb of Seattle, and in Gig Harbor, near Tacoma
Recent Developments
• Executed a cost reduction strategy in April 2018, resulting in a
headcount reduction of 86 FTE and expected annualized pre-tax
cost saves of $12.4 million
Quarterly loan
and deposit
growth of 6%
(1) Excludes impact of restructuring and acquisition-related expenses, net of tax. See appendix for
reconciliation o non-GAAP financial measures.

Results of Operations
3 Months Ended
$ Thousands Mar. 31, 2018 Dec. 31, 2017 Sep. 30, 2017 Jun. 30, 2017 Mar. 31, 2017
Net Interest Income $48,460 $51,079 $50,840 $46,868 $45,651
Provision for Credit Losses
750
- 250 500 -
Noninterest Income 60,831 72,801 83,884 81,008 74,461
Noninterest Expense 100,769 106,838 114,697 111,244 106,874
Net Income Before Taxes 7,772 17,042 19,777 16,132 13,238
Income Taxes 1,906 (17,873) 5,938 4,923 4,255
Net Income 5,866 34,915 13,839 11,209 8,983
Core Net Income(1) $5,597 $11,467 $16,588 $11,391 $8,983
Diluted EPS $0.22 $1.29 $0.51 $0.41 $0.33
Core EPS(1) $0.21 $0.42 $0.61 $0.42 $0.33
Tangible BV/Share(2) $24.90 $25.09 $23.86 $23.30 $22.73
Core ROAA(1) 0.33% 0.67% 0.99% 0.71% 0.57%
Core ROAE(1) 3.12% 6.54% 9.71% 6.82% 5.53%
Core ROATE(1) 3.25% 6.83% 10.15% 7.14% 5.81%
Net Interest Margin 3.25% 3.33% 3.40% 3.29% 3.23%
Core Efficiency Ratio(1) 92.5% 86.4% 82.0% 86.8% 89.0%
Tier 1 Leverage Ratio (Bank) 9.58% 9.67% 9.86% 10.13% 9.98%
Total Risk-Based Capital (Bank) 13.09% 14.02% 13.65% 14.01% 14.02%
p. 11
(1) Excludes impact of income tax reform-related benefit and restructuring and acquisition-related expenses, net of tax. See appendix for reconciliation of non-GAAP
financial measures.
(2) See appendix for reconciliation of non-GAAP financial measures.

$45.7
$46.9
$50.8 $51.1
$48.5
3.23%
3.29%
3.40%
3.33%
3.25%
1Q17 2Q17 3Q17 4Q17 1Q18
Net Interest Income
Net Interest Margin
Net Interest Income & Margin
Net Interest Income
p. 12
$ Millions
Rising short-term interest
rates and flat yield curve
adversely impacted the
net interest margin
• 1Q18 Net Interest Margin declined 8 bps and
net interest income decreased $2.6 million
compared to the prior quarter
• Net interest income decreased primarily due
to lower balance of loans held for sale
• NIM contracted primarily due to changes in
the composition and cost of interest-bearing
liabilities – primarily higher rates on FHLB
borrowings

3.90%
3.96%
4.12% 4.12% 4.12%
3.60%
3.70%
3.80%
3.90%
4.00%
4.10%
4.20%
4.30%
$0
$1
$2
$3
$4
$5
$6
$7
1Q17 2Q17 3Q17 4Q17 1Q18
Cash & Cash Equivalents
Investment Securities
Loans Held for Sale
Loans Held for Investment
Average Yield
Interest-Earning Assets
Average Balances
p. 13
$ Billions
Average Yield
Percent
Average loans held for investment
ending balances increased $212
million or 4.8% during the quarter.
$5.78 $5.84
$6.10 $6.27 $6.09
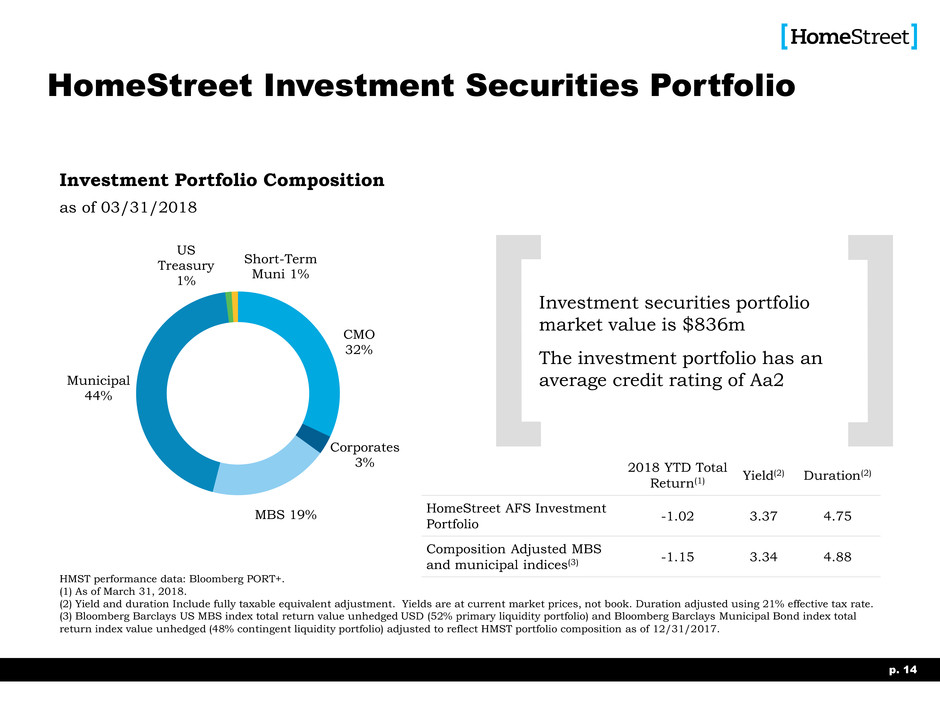
CMO
32%
Corporates
3%
MBS 19%
Municipal
44%
Short-Term
Muni 1%
US
Treasury
1%
HomeStreet Investment Securities Portfolio
Investment Portfolio Composition
p. 14
as of 03/31/2018
Investment securities portfolio
market value is $836m
The investment portfolio has an
average credit rating of Aa2
HMST performance data: Bloomberg PORT+.
(1) As of March 31, 2018.
(2) Yield and duration Include fully taxable equivalent adjustment. Yields are at current market prices, not book. Duration adjusted using 21% effective tax rate.
(3) Bloomberg Barclays US MBS index total return value unhedged USD (52% primary liquidity portfolio) and Bloomberg Barclays Municipal Bond index total
return index value unhedged (48% contingent liquidity portfolio) adjusted to reflect HMST portfolio composition as of 12/31/2017.
2018 YTD Total
Return(1)
Yield(2) Duration(2)
HomeStreet AFS Investment
Portfolio
-1.02 3.37 4.75
Composition Adjusted MBS
and municipal indices(3)
-1.15 3.34 4.88
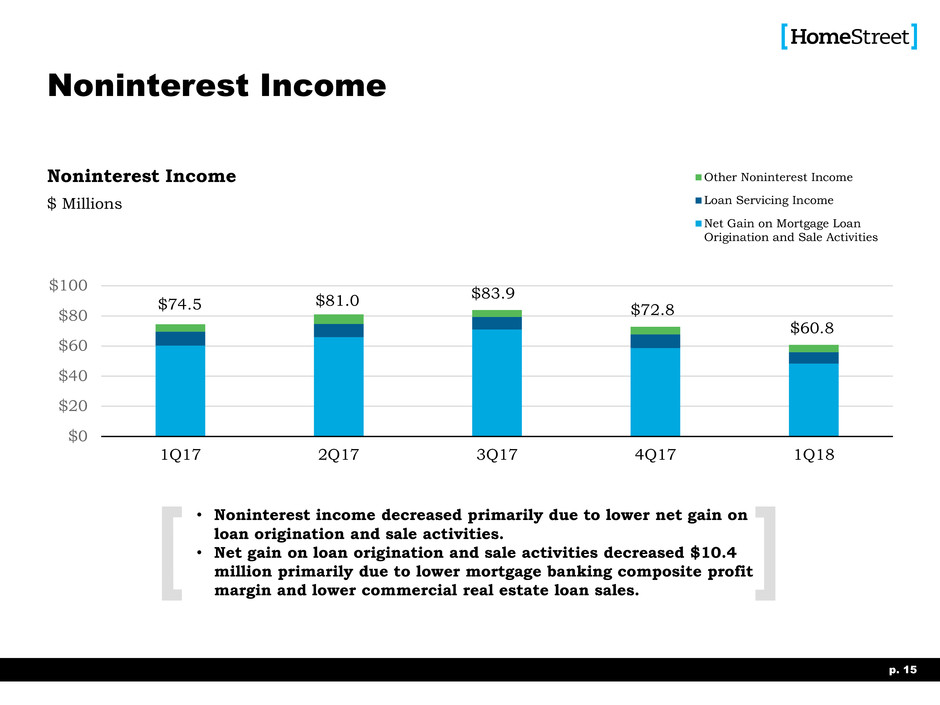
$0
$20
$40
$60
$80
$100
1Q17 2Q17 3Q17 4Q17 1Q18
Other Noninterest Income
Loan Servicing Income
Net Gain on Mortgage Loan
Origination and Sale Activities
Noninterest Income
Noninterest Income
p. 15
$ Millions
• Noninterest income decreased primarily due to lower net gain on
loan origination and sale activities.
• Net gain on loan origination and sale activities decreased $10.4
million primarily due to lower mortgage banking composite profit
margin and lower commercial real estate loan sales.
$74.5 $81.0
$83.9
$72.8
$60.8

2,100
2,200
2,300
2,400
2,500
2,600
2,700
$0
$20
$40
$60
$80
$100
$120
1Q17 2Q17 3Q17 4Q17 1Q18
Restructuring-related expenses
Merger-related expenses
Core noninterest expense
FTE
Noninterest Expense
Noninterest Expense
p. 16
$ Millions
Total Noninterest Expense $106.9 $111.2 $114.7 $106.8 $100.8
Restructuring-Related Expenses $0.0 $0.1 $3.9 ($0.3) ($0.3)
Merger-Related Expenses $0.0 $0.2 $0.4 $0.1 ($0.0)
Core Noninterest Expense(1) $106.9 $111.0 $110.5 $107.0 $101.1
Core Salaries & Related Costs(1) $71.3 $76.3 $74.8 $70.8 $66.7
Core General & Administrative(1) $17.1 $15.9 $16.1 $15.9 $14.6
Core Other Noninterest Expense(1) $18.5 $18.8 $19.6 $20.3 $19.8
FTE 2,581 2,542 2,463 2,419 2,384
Core Efficiency Ratio(1) 89.0% 86.8% 82.0% 86.4% 92.5%
(1) Excludes restructuring and acquisition-related expenses, which are shown in “restructuring-related expenses” and “merger-related expenses” in the table. See
appendix for reconciliation of non-GAAP financial measures.
FTE
Excluding restructuring and acquisition-related expenses, core noninterest expense declined $5.9 million in 1Q18,
primarily due to decreased commissions resulting from lower closed loan volume and ongoing headcount reductions.
Noninterest expense will continue to vary primarily based on headcount and mortgage origination volume.
Commercial &
Consumer
Banking
Segment
p. 17

Commercial & Consumer Banking
Segment Overview
Overview
• Commercial Banking
– Commercial lending, including SBA
– All CRE property types with multifamily focus
– FNMA DUS lender / servicer
– Residential and commercial construction
– Commercial deposit, treasury and cash management services
• Consumer Banking
– Consumer loan and deposit products
– Consumer investment, insurance and private banking products and services
Strategic Objectives
• Strategic focus on major coastal markets of Western U.S.
• Diversify and grow loan portfolio average of 2-4% per quarter(1)
• Manage revenue growth to exceed non-interest expense growth, creating
operating leverage
• Credit strategy of generally competing on price and not on credit terms
• Manage credit risk by monitoring portfolio and geographic early warning
indicators
• Long-term efficiency ratio target of <60%
• Long-term ROTE target > 12%
p. 18
(1) Actual growth of loan portfolio is subject to, among other things, actual loan production volumes,
portfolio runoff, portfolio loan sales, portfolio credit performance, net interest margin, and market forces.
Other portfolio management considerations include liquidity management, capital requirements and
profitability.
.

Commercial & Consumer Banking Segment
Quarterly Trend
3 Months Ended
$ Thousands Mar. 31, 2018 Dec. 31, 2017 Sep. 30, 2017 Jun. 30, 2017 Mar. 31, 2017
Net Interest Income $45,447 $45,876 $45,314 $42,448 $40,904
Provision for Credit Losses
750
- 250 500 -
Noninterest Income 7,096 12,697 11,962 8,276 9,425
Noninterest Expense 38,271 38,716 37,160 36,631 36,470
Net Income Before Taxes 13,522 19,857 19,866 13,593 13,859
Income Taxes 3,316 10,496 5,904 4,147 4,567
Net Income 10,206 9,361 13,962 9,446 9,292
Core Net Income(1) $10,167 $13,568 $14,191 $9,561 $9,292
Core ROAA(1) 0.69% 0.91% 1.00% 0.69% 0.69%
Core ROAE(1) 7.42% 9.55% 10.35% 7.16% 7.38%
Core ROATE(1) 7.83% 10.08% 10.94% 7.59% 7.85%
Net Interest Margin 3.18% 3.26% 3.33% 3.22% 3.19%
Core Efficiency Ratio(1) 72.9% 66.0% 64.3% 71.9% 72.5%
Total Average Earnings Assets $5,563,154 $5,492,058 $5,305,367 $5,229,120 $5,095,982
FTE 1,077 1,068 1,071 1,055 1,022
p. 19
(1) Excludes impact of income tax reform-related benefit and restructuring and acquisition-related expenses, net of tax. See appendix for reconciliation of non-GAAP
financial measures.

Loan Production Trend
p. 20
Commitments
$ Millions
Mar. 31, 2018 Dec. 31, 2017 Sept. 30, 2017 Jun. 30, 2017 Mar. 31, 2017
Single Family $125 18% $207 28% $188 23% $143 18% $75 14%
SFR Custom Home Construction 59 9% 53 7% 61 8% 63 8% 48 9%
Home Equity and Other 92 13% 98 13% 81 10% 92 11% 80 15%
Total Consumer Loans $276 40% $358 48% $330 41% $298 37% $203 37%
Non-owner Occupied CRE $36 5% $45 6% $54 7% $80 10% $29 5%
Multifamily 89 13% 55 7% 122 15% 122 15% 107 20%
Residential Construction 185 27% 167 23% 167 21% 154 19% 133 24%
CRE / Multifamily Construction 58 8% 64 8% 72 9% 65 8% 21 4%
Total CRE Loans $368 53% $331 44% $415 52% $421 52% $291 53%
Owner Occupied CRE $11 2% $29 4% $31 4% $27 3% $22 4%
Commercial Business 36 5% 28 4% 29 4% 62 8% 28 5%
Total C&I loans $47 7% $57 8% $60 7% $89 11% $50 9%
Total $691 100% $746 100% $805 100% $808 100% $544 100%

Loan Balance Trend
p. 21
Balances
$ Millions
Mar. 31, 2018 Dec. 31, 2017 Sept. 30, 2017 Jun. 30, 2017 Mar. 31, 2017
Single Family $1,444 30% $1,381 30% $1,269 29% $1,148 27% $1,100 28%
SFR Custom Home Construction 150 3% 145 3% 138 3% 149 4% 134 3%
Home Equity and Other 470 10% 454 10% 437 10% 414 10% 381 10%
Total Consumer Loans $2,064 43% $1,980 43% $1,844 42% $1,711 41% $1,615 41%
Non-owner Occupied CRE $634 13% $623 14% $651 15% $617 15% $600 15%
Multifamily 812 17% 728 16% 747 17% 781 19% 748 19%
Residential Construction 331 7% 310 7% 285 7% 281 7% 263 7%
CRE / Multifamily Construction 258 6% 232 5% 231 5% 219 5% 214 5%
Total CRE Loans $2,035 43% $1,893 42% $1,914 44% $1,898 45% $1,825 46%
Owner Occupied CRE $394 8% $392 9% $335 8% $325 8% $323 8%
Commercial Business 287 6% 265 6% 246 6% 249 6% 223 6%
Total C&I Loans $681 14% $657 15% $581 14% $574 14% $546 14%
Total Loans Held for Investment $4,780 100% $4,530 100% $4,339 100% $4,183 100% $3,986 100%
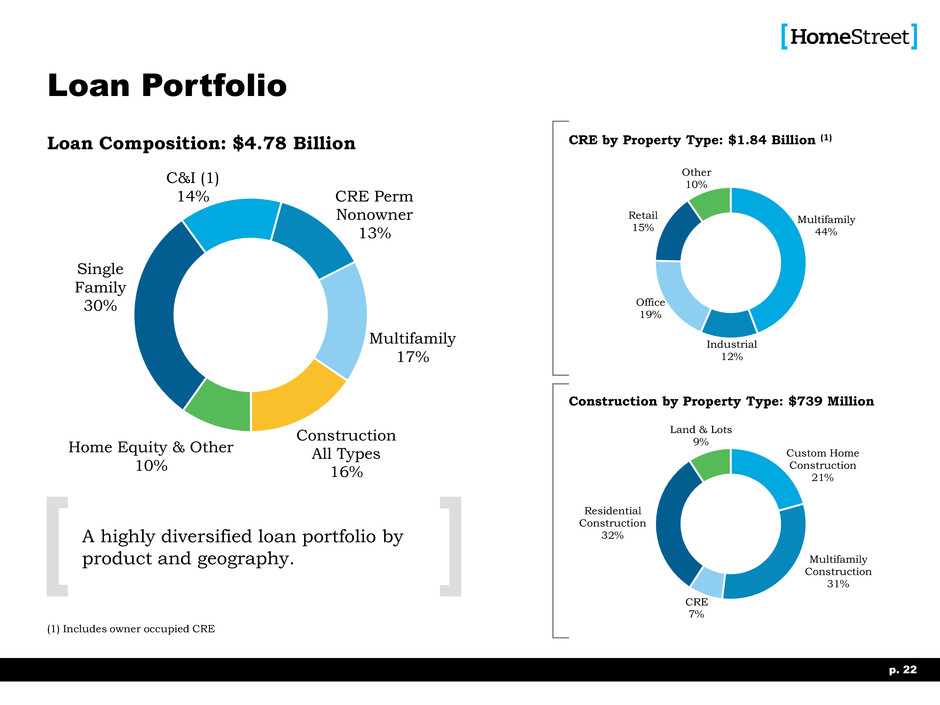
C&I (1)
14% CRE Perm
Nonowner
13%
Multifamily
17%
Construction
All Types
16%
Home Equity & Other
10%
Single
Family
30%
Loan Portfolio
p. 22
A highly diversified loan portfolio by
product and geography.
Multifamily
44%
Industrial
12%
Office
19%
Retail
15%
Other
10%
CRE by Property Type: $1.84 Billion (1)
Custom Home
Construction
21%
Multifamily
Construction
31%
CRE
7%
Residential
Construction
32%
Land & Lots
9%
Construction by Property Type: $739 Million
Loan Composition: $4.78 Billion
(1) Includes owner occupied CRE

Permanent Commercial Real Estate
Lending Overview
• Up To 30 Year Term
• $30MM Loan Amt. Max
• ≥ 1.15 DSCR
• Avg. LTV @ Orig. ~ 60%
p. 23
Loan Characteristics
• Up To 15 Year Term
• $30MM Loan Amt. Max
• ≥ 1.25 DSCR
• Avg. LTV @ Orig. ~ 68%
• Up To 15 Year Term
• $30MM Loan Amt. Max
• ≥ 1.25 DSCR
• Avg. LTV @ Orig. ~ 68%
• Up To 15 Year Term
• $30MM Loan Amt. Max
• ≥ 1.25 DSCR
• Avg. LTV @ Orig. ~ 62%
• Additional property types are
reviewed on a case by case
basis
• Includes acquired loan types
• Examples include: Self
Storage & Hotel
• Balance: $811M
• % of Balances: 44%
• Portfolio Avg. LTV ~ 55%(1)
• Portfolio Avg. DSCR ~ 1.52x
• Avg. Loan Size: $3.8M
• Largest Dollar Loan: $26.2M
3/31/18 Balances Outstanding Totaling $1.84 Billion
• Balance: $226M
• % of Balances: 12%
• % Owner Occupied: 51%
• Portfolio LTV ~ 60%(1)
• Portfolio Avg. DSCR ~ 1.61x
• Avg. Loan Size: $1.4M
• Largest Dollar Loan: $12.2M
• Balance: $348M
• % of Balances: 19%
• % Owner Occupied: 25%
• Portfolio LTV ~ 62%(1)
• Portfolio Avg. DSCR ~ 1.74x
• Avg. Loan Size: $3.9M
• Largest Dollar Loan: $25.1M
• Balance: $276M
• % of Balances: 15%
• % Owner Occupied: 24%
• Portfolio LTV ~ 54%(1)
• Portfolio Avg. DSCR ~ 1.73x
• Avg. Loan Size: $3.9M
• Largest Dollar Loan: $19.3M
• Balance: $179M
• % of Balances: 10%
• % of Owner Occupied: 25%
• Portfolio LTV ~ 46%(1)
• Portfolio Avg. DSCR ~ 2.01x
• Avg. Loan Size: $2.8M
• Largest Dollar Loan: $27.M
40%
15%6%
17%
11%
11%
Geographical Distribution (Balances)
Multifamily
19%
20%
3%3%
51%
4%
Industrial / Warehouse
10%
11%
14%
6%40%
19%
Office
20%
11%
16%4%
36%
13%
Retail
6% 2%
9%
1%
68%
14%
Other
CA Los Angeles County
CA Other
Oregon
Other
WA King/Pierce/Snohomish
WA Other
(1) Property values as of origination date.
HomeStreet lends within the full spectrum of commercial real estate lending types, but is deliberate in achieving diversification among
property types and geographic areas to mitigate concentration risk.

Construction Lending Overview
• 12 Month Term
• Consumer Owner Occupied
• Borrower Underwritten
similar to Single Family
p. 24
Loan Characteristics
• 18-36 Month Term
• ≤ 80% LTC
• Minimum 15% Cash Equity
• ≥ 1.15 DSC
• Portfolio LTV ~ 61%
• 18-36 Month Term
• ≤ 80% LTC
• Minimum 15% Cash Equity
• ≥ 1.25 DSC
• ≥ 50% pre-leased office/retail
• Portfolio LTV ~65%
• 12-18 Month Term
• LTC: ≤ 95% Presale & Spec
• Leverage, Liquid. & Net
Worth Covenants as
appropriate
• Portfolio LTV ~ 66%
• 12-24 Month Term
• ≤ 50% -80% LTC
• Strong, experienced,
vertically integrated builders
• Portfolio LTV ~ 65%
• Balance: $153M
• Unfunded Commitments:
$128M
• % of Balances: 21%
• % of Unfunded
Commitments: 17%
• Avg. Loan Size: $505K
• Largest Dollar Loan: $2.5M
3/31/18 Balances Outstanding Totaling $739 Million
• Balance: $230M
• Unfunded Commitments:
$248M
• % of Balances: 31%
• % of Unfunded
Commitments: 34%
• Avg. Loan Size: $3.9M
• Largest Dollar Loan: $26.8M
• Balance: $54M
• Unfunded Commitments:
$59M
• % of Balances: 7%
• % of Unfunded
Commitments: 8%
• Avg. Loan Size: $11.4M
• Largest Dollar Loan: $18.2M
• Balance: $234M
• Unfunded Commitments:
$287M
• % of Balances: 32%
• % of Unfunded
Commitments: 39%
• Avg. Loan Size: $322K
• Largest Dollar Loan: $5.8M
• Balance: $67M
• Unfunded Commitments:
$15M
• % of Balances: 9%
• % of Commitments: 2%
• Avg. Loan Size: $634K
• Largest Dollar Loan: $3.7M
38%
3%
3%24%
4%
3%
7%
15%
4%
Geographical Distribution (Balances)
Custom Home Construction
24%
14%
8%9%2%
1%
6%
14%
12%
9%
Multifamily
10%
55%
17%
7%
11%
Commercial
31%
1%
1%
26%3%
9%
9%
16%
4%
Residential Construction
32%
3%
1%
4%
1%4%9%
36%
10%
Land and Lots
Seattle Metro
Puget Sound Other
WA Other
Portland Metro
OR Other
Hawaii
California
Utah
Idaho
Other: AZ, CO
Construction lending is a broad category that includes many different loan types, which are often characterized by different risk profiles.
HomeStreet lends within the full spectrum of construction lending types, but is deliberate in achieving diversification among the types
to mitigate risk. Additionally, recent geographic expansion has provided an opportunity to increase diversification.
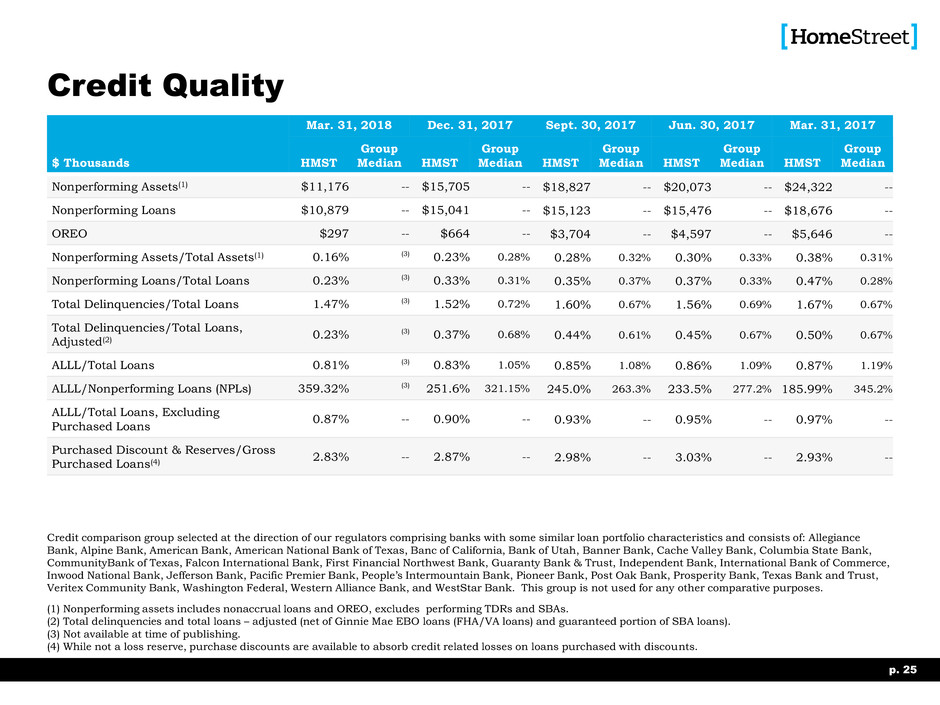
Credit Quality
p. 25
$ Thousands
Mar. 31, 2018 Dec. 31, 2017 Sept. 30, 2017 Jun. 30, 2017 Mar. 31, 2017
HMST
Group
Median HMST
Group
Median HMST
Group
Median HMST
Group
Median HMST
Group
Median
Nonperforming Assets(1) $11,176 -- $15,705 -- $18,827 -- $20,073 -- $24,322 --
Nonperforming Loans $10,879 -- $15,041 -- $15,123 -- $15,476 -- $18,676 --
OREO $297 -- $664 -- $3,704 -- $4,597 -- $5,646 --
Nonperforming Assets/Total Assets(1) 0.16% (3) 0.23% 0.28% 0.28% 0.32% 0.30% 0.33% 0.38% 0.31%
Nonperforming Loans/Total Loans 0.23% (3) 0.33% 0.31% 0.35% 0.37% 0.37% 0.33% 0.47% 0.28%
Total Delinquencies/Total Loans 1.47% (3) 1.52% 0.72% 1.60% 0.67% 1.56% 0.69% 1.67% 0.67%
Total Delinquencies/Total Loans,
Adjusted(2)
0.23% (3) 0.37% 0.68% 0.44% 0.61% 0.45% 0.67% 0.50% 0.67%
ALLL/Total Loans 0.81% (3) 0.83% 1.05% 0.85% 1.08% 0.86% 1.09% 0.87% 1.19%
ALLL/Nonperforming Loans (NPLs) 359.32% (3) 251.6% 321.15% 245.0% 263.3% 233.5% 277.2% 185.99% 345.2%
ALLL/Total Loans, Excluding
Purchased Loans
0.87% -- 0.90% -- 0.93% -- 0.95% -- 0.97% --
Purchased Discount & Reserves/Gross
Purchased Loans(4)
2.83% -- 2.87% -- 2.98% -- 3.03% -- 2.93% --
(1) Nonperforming assets includes nonaccrual loans and OREO, excludes performing TDRs and SBAs.
(2) Total delinquencies and total loans – adjusted (net of Ginnie Mae EBO loans (FHA/VA loans) and guaranteed portion of SBA loans).
(3) Not available at time of publishing.
(4) While not a loss reserve, purchase discounts are available to absorb credit related losses on loans purchased with discounts.
Credit comparison group selected at the direction of our regulators comprising banks with some similar loan portfolio characteristics and consists of: Allegiance
Bank, Alpine Bank, American Bank, American National Bank of Texas, Banc of California, Bank of Utah, Banner Bank, Cache Valley Bank, Columbia State Bank,
CommunityBank of Texas, Falcon International Bank, First Financial Northwest Bank, Guaranty Bank & Trust, Independent Bank, International Bank of Commerce,
Inwood National Bank, Jefferson Bank, Pacific Premier Bank, People’s Intermountain Bank, Pioneer Bank, Post Oak Bank, Prosperity Bank, Texas Bank and Trust,
Veritex Community Bank, Washington Federal, Western Alliance Bank, and WestStar Bank. This group is not used for any other comparative purposes.

Deposits
Balances
p. 26
$ Millions
Total Cost of Deposits 0.52% 0.52% 0.53% 0.57% 0.67%
• Total deposits of $5.05 billion at March 31, 2018 increased $288 million or 6% from December 31, 2017
and increased $453 million or 10% from March 31, 2017
• Transaction and savings accounts increased 4% from the prior quarter, primarily due to growth in business
money market deposit balances
• Deposit growth during the quarter of 9% in our de novo branches, those opened within five years. Opened
20 branches, or 32% of our total network, during this time period
• Cost of deposits increased 10 basis points during the quarter due to, among other things, brokered
deposits increasing from $327.4 million at 12/31/17 to $488.5 million at 3/31/18. These were priced
more attractively than FHLB advances and other wholesale borrowings.
9% 9% 11% 8% 9%
26% 27% 25% 25% 26%
13% 12% 13% 12% 12%
52% 51% 51% 54%
54%
$-
$1,000
$2,000
$3,000
$4,000
$5,000
$6,000
3/31/17 6/30/17 9/30/17 12/31/17 3/31/18
Interest-Bearing Transaction & Savings Deposits
Noninterest-Bearing Transaction & Savings Deposits
Time Deposits
Mortgage Svcg. Escrow Accts. & Other
$4,596 $4,748 $4,670 $4,761 $5,049

Mortgage
Banking
Segment
p. 27

Mortgage Banking Segment
Overview
Overview
• Regional Single Family retail mortgage origination and servicing
platform
• Majority of production sold into secondary market
• Fannie Mae, Freddie Mac, FHA, VA lender since programs’ inceptions
• Portfolio products: jumbo, HELOC and custom home construction
• Servicing retained on majority of originated loans sold to secondary
markets
Strategic Objectives
• Optimize operations and origination capacity to match market
conditions
• Leverage new loan origination system to drive operational efficiency,
provide stronger compliance management controls and improve
customer service
• Use retail focus, broad product mix, technology, and competitive
pricing to increase market share
• Long-term efficiency ratio target of <85%
• Long-term ROE target of >25%
p. 28
(1) Actual growth of loan portfolio is subject to, among other things, actual loan production volumes, portfolio
runoff, portfolio loan sales, portfolio credit performance, net interest margin, and market forces. Other
portfolio management considerations include liquidity management, capital requirements and profitability.
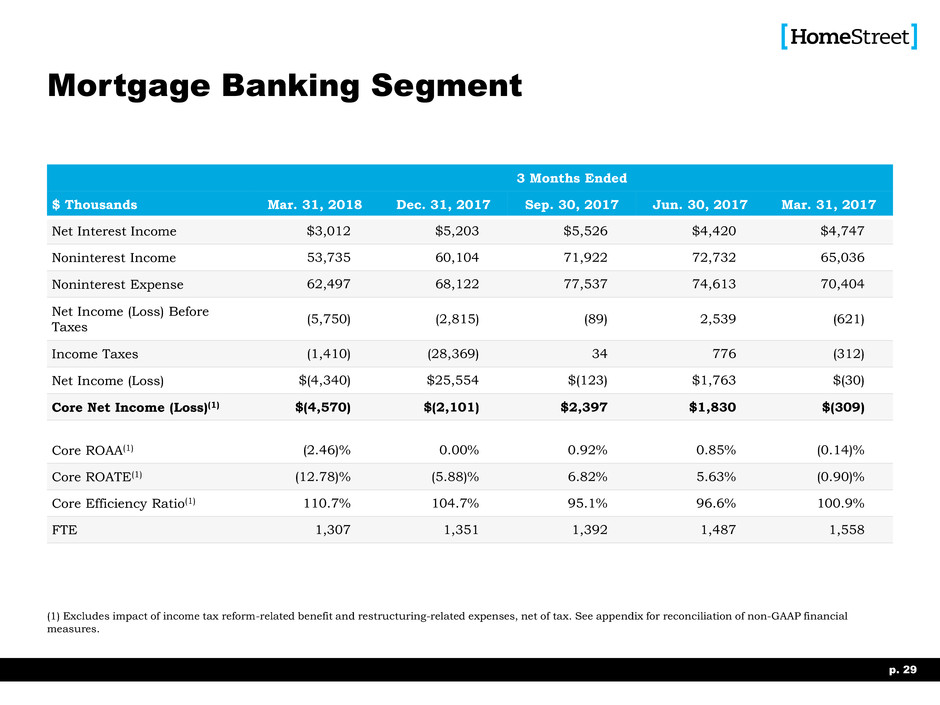
Mortgage Banking Segment
3 Months Ended
$ Thousands Mar. 31, 2018 Dec. 31, 2017 Sep. 30, 2017 Jun. 30, 2017 Mar. 31, 2017
Net Interest Income $3,012 $5,203 $5,526 $4,420 $4,747
Noninterest Income 53,735 60,104 71,922 72,732 65,036
Noninterest Expense 62,497 68,122 77,537 74,613 70,404
Net Income (Loss) Before
Taxes
(5,750) (2,815) (89) 2,539 (621)
Income Taxes (1,410) (28,369) 34 776 (312)
Net Income (Loss) $(4,340) $25,554 $(123) $1,763 $(30)
Core Net Income (Loss)(1) $(4,570) $(2,101) $2,397 $1,830 $(309)
Core ROAA(1) (2.46)% 0.00% 0.92% 0.85% (0.14)%
Core ROATE(1) (12.78)% (5.88)% 6.82% 5.63% (0.90)%
Core Efficiency Ratio(1) 110.7% 104.7% 95.1% 96.6% 100.9%
FTE 1,307 1,351 1,392 1,487 1,558
p. 29
(1) Excludes impact of income tax reform-related benefit and restructuring-related expenses, net of tax. See appendix for reconciliation of non-GAAP financial
measures.

$0
$500
$1,000
$1,500
$2,000
$2,500
1Q17 2Q17 3Q17 4Q17 1Q18
Total Closed Loans
Total Rate Locks
Mortgage Origination
Quarterly Volume Trend
p. 30
$ Millions
HMST $1,544 $1,866 $1,863 $1,753 $1,362
WMS $77 $145 $172 $134 $91
Closed Loans $1,621 $2,011 $2,035 $1,887 $1,453
Purchase Percent 67% 78% 77% 68% 67%
Refinance Percent 33% 22% 23% 32% 33%
Rate Locks $1,623 $1,950 $1,873 $1,535 $1,572
Purchase Percent 73% 77% 71% 68% 73%
Refinance Percent 27% 23% 29% 32% 27%

0
100
200
300
400
1Q17 2Q17 3Q17 4Q17 1Q18
Loan fees/closed loans
Secondary gains/rate locks
Mortgage Origination (cont.)
Single Family Composite Margin
p. 31
Basis Points
Secondary Gains/Rate Locks(1) 312 294 303 290 264
Loan Fees/Closed Loans(2) 37 37 39 39 40
Composite Margin 349 331 342 329 304
(1) Represents combined value of secondary market gains and originated mortgage servicing rights stated as a percentage of interest rate lock commitments.
(2) Loan origination and funding fees stated as a percentage of mortgage originations from the retail channel and excludes loans purchased from WMS.
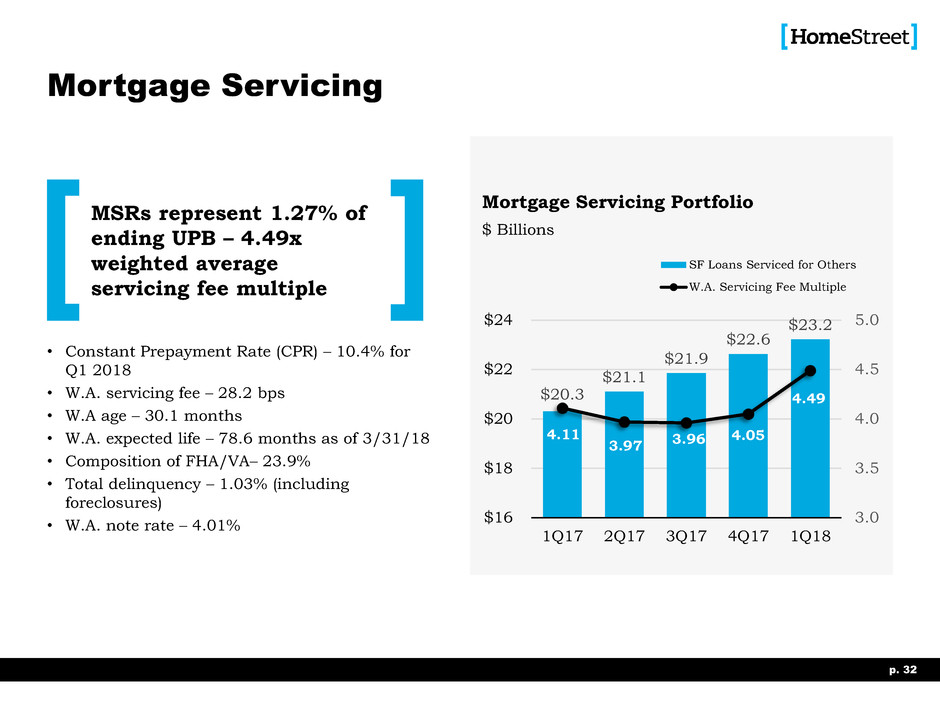
$20.3
$21.1
$21.9
$22.6
$23.2
4.11
3.97 3.96
4.05
4.49
3.0
3.5
4.0
4.5
5.0
$16
$18
$20
$22
$24
1Q17 2Q17 3Q17 4Q17 1Q18
SF Loans Serviced for Others
W.A. Servicing Fee Multiple
Mortgage Servicing
Mortgage Servicing Portfolio
p. 32
$ Billions
MSRs represent 1.27% of
ending UPB – 4.49x
weighted average
servicing fee multiple
• Constant Prepayment Rate (CPR) – 10.4% for
Q1 2018
• W.A. servicing fee – 28.2 bps
• W.A age – 30.1 months
• W.A. expected life – 78.6 months as of 3/31/18
• Composition of FHA/VA– 23.9%
• Total delinquency – 1.03% (including
foreclosures)
• W.A. note rate – 4.01%

Competitive Landscape
p. 33
Mortgage Market
• Despite the recent increase in mortgage rates, rates remain
historically low on an absolute basis
• The most recent Mortgage Bankers Association monthly
forecast projects total loan originations to decrease 5.79% in
2018 over last year, and then increase 2.11% in 2019.
• Low rates should continue to support housing affordability.
Nationally, purchases are expected to increase by 5.23%
from 2017 and comprise 73% of volume in 2018.
• Purchases comprised 63% of originations nationally and
54% in the Pacific Northwest in the first quarter.
HomeStreet continues to perform above the national and
regional averages, with purchases accounting for 67% of our
closed loans and interest rate lock commitments in the
quarter, however limited inventory continues to be a
significant constraining issue.
• New home construction in our markets is constrained by the
geography of the West Coast and the lingering effects of the
last recession.
Months supply of
inventory and
time on the
market are at
historically low
levels

Outlook
p. 34

Key Drivers Guidance
Metric 2Q18 3Q18 2018
Mortgage loan locks and forward sale
commitments
$1.8B $1.9B $6.7B
Mortgage loan held for sale closing volume $1.9B $1.9B $6.9B
Mortgage banking gain on sale composite margin
(bps)
305-315 305-315 305-315
Average quarterly net loan portfolio growth 2-4% 2-4% 2-4%
Net interest margin (bps) 325-335 330-340 330-340
Average noninterest expense growth(1) 5-6% 1% 1-2%
Average C&CB Segment noninterest expense
growth (2)
4-5% 1% 2-3%
p. 35
The information in this presentation, particularly including but not limited to that presented on this slide, is forward-looking in nature, and you should review Item
1A, “Risk Factors,” in our most recent Annual Report on Form 10-K for a list of factors that may cause us to deviate from our plans or to fall short of our
expectations.
(1) Subject to seasonality and cyclicality in single family closed loan volume. Quarter over quarter expense change forecasts are highly dependent on the seasonal
starting point.
(2) Subject to seasonality of commercial loan sales volume. Quarter over quarter expense change forecasts are highly dependent on the seasonal starting point.

Appendix
p. 36

Statements of Financial Condition
3 Months Ended
$ Thousands Mar. 31, 2018 Dec. 31, 2017 Sep. 30, 2017 Jun. 30, 2017 Mar. 31, 2017
Cash and Cash Equivalents $66,289 $72,718 $55,050 $54,447 $61,492
Investment Securities 915,483 904,304 919,459 936,522 1,185,654
Loans Held For Sale 500,533 610,902 851,126 784,556 537,959
Loans Held For Investment, Net 4,758,261 4,506,466 4,313,225 4,156,424 3,957,959
Mortgage Servicing Rights 320,105 284,653 268,072 258,222 257,421
Other Real Estate Owned 297 664 3,704 4,597 5,646
Federal Home Loan Bank Stock, at Cost 41,923 46,639 52,486 41,769 41,656
Premises and Equipment, Net 104,508 104,654 104,389 101,797 97,349
Goodwill 22,564 22,564 22,564 22,175 22,175
Other Assets 194,093 188,477 206,271 226,048 233,832
Total Assets $6,924,056 $6,742,041 $6,796,346 $6,586,557 $6,401,143
Deposits $5,048,996 $4,760,952 $4,670,486 $4,747,771 $4,595,809
Federal Home Loan Bank Advances 851,657 979,201 1,135,245 867,290 862,335
Accounts Payable And Other Liabilities 172,119 172,234 193,866 190,421 176,891
Federal funds purchased & securities sold
under agreements to repurchase 25,000 - - - -
Long-term Debt 125,321 125,274 125,280 125,234 125,189
Total Liabilities 6,223,093 6,037,661 6,124,877 5,930,716 5,760,224
Preferred Stock - - - - -
Common Stock 511 511 511 511 511
Additional Paid-in Capital 339,902 339,009 338,283 337,515 336,875
Retained Earnings 377,848 371,982 337,067 323,228 312,019
Accumulated Other Comprehensive Income
(Loss) (17,298) (7,122) (4,392) (5,413) (8,486)
Total Shareholders’ Equity 700,963 704,380 671,469 655,841 640,919
Total Liabilities and Shareholders’ Equity $6,924,056 $6,742,041 $6,796,346 $6,586,557 $6,401,143
p. 37

Segment Core Earnings Contribution
12 Months Ended
Average Earnings and
Returns
$ Thousands
Dec. 31,
2012
Dec. 31,
2013
Dec. 31,
2014
Dec. 31,
2015
Dec. 31,
2016
Dec. 31,
2017
1/1/2012-
12/31/2017
1/1/2013-
12/31/2017
Commercial & Consumer Banking
Core Net Income (Loss)(1)
(12,703) 8,930 16,734 21,035 35,438 46,612 19,341 25,750
Core ROATE(1) (7.74)% 4.65% 8.21% 7.07% 8.14% 9.19% 6.45% 7.87%
Core ROAA(1) (0.67)% 0.42% 0.65% 0.59% 0.74% 0.82% 0.56% 0.69%
Core Efficiency Ratio(1) 107.6% 82.9% 76.3% 74.9% 69.2% 68.4% 75.1% 72.5%
Mortgage Banking
Core Net Income (Loss)(1)
94,829 17,836 7,511 23,302 27,351 1,817 28,774 15,563
Core ROATE(1) 200.77% 32.79% 10.54% 18.68% 26.78% 1.31% 32.07% 15.85%
Core ROAA(1) 18.83% 2.97% 1.19% 2.35% 2.79% 0.20% 3.73% 1.88%
Core Efficiency Ratio(1) 50.1% 85.6% 93.8% 87.1% 87.5% 99.1% 84.3% 90.6%
HomeStreet Consolidated
Core Net Income (Loss)(1)
82,126 26,766 24,245 44,337 62,789 48,429 48,115 41,313
Core ROATE(1) 38.86% 10.87% 8.81% 10.50% 11.68% 7.50% 12.35% 9.71%
Core ROAA(1) 3.42% 0.98% 0.76% 0.97% 1.09% 0.73% 1.14% 0.90%
Core Efficiency Ratio(1) 61.5% 84.8% 87.6% 83.0% 81.1% 85.9% 81.2% 84.1%
p. 38
(1) Excludes impact of income tax reform-related (benefit ) expense and restructuring and acquisition-related expenses, net of tax.
See reconciliation of non-GAAP financial measures.

Stock Price Performance
Performance Since IPO
p. 39
Percent
1 Year Ending 3 Year Ending 5 Year Ending Since IPO Ending
3/30/18 3/30/18 3/30/18 2/10/12-3/30/18
HomeStreet, Inc. 6.7% 53.9% 27.0% 160.5%
KBW Nasdaq Regional Bank Index 6.1% 40.3% 83.2% 109.2%
12/29/17 12/29/17 12/29/17 12/29/17
HomeStreet, Inc. -8.5% 43.6% 10.7% 163.2%
KBW Nasdaq Regional Bank Index -0.4% 42.5% 93.8% 107.3%
9/29/17 9/29/17 9/29/17 9/29/17
HomeStreet, Inc. 6.6% 62.0% 43.0% 145.5%
KBW Nasdaq Regional Bank Index 27.3% 51.4% 92.3% 103.9%
6/30/17 6/30/17 6/30/17 6/30/17
HomeStreet, Inc. 39.4% 49.0% 72.2% 151.6%
KBW Nasdaq Regional Bank Index 35.2% 35.9% 91.4% 99.3%
-25%
25%
75%
125%
175%
HomeStreet, Inc.
KBW Nasdaq Regional Bank Index

Non-GAAP Financial Measures
Tangible Book Value
$ Thousands,
Except Share Data
Quarter Ended
Mar. 31, 2018 Dec. 31, 2017 Sep. 30, 2017 Jun. 30, 2017 Mar. 31, 2017
Shareholders’ Equity $700,963 $704,380 $671,469 $655,841 $640,919
Less: Goodwill and Other
Intangibles
(29,254) (29,661) (29,893) (29,783) (30,275)
Tangible Shareholders’ Equity $671,709 $674,719 $641,576 $626,058 $610,644
Common Shares Outstanding 26,972,074 26,888,288 26,884,402 26,874,871 26,862,744
Book Value Per Share $25.99 $26.20 $24.98 $24.40 $23.86
Impact of Goodwill and Other
Intangibles
($1.09) ($1.11) ($1.12) ($1.10) ($1.13)
Tangible Book Value Per Share $24.90 $25.09 $23.86 $23.30 $22.73
Average Shareholders’ Equity 717,742 701,849 683,186 668,377 649,439
Less: Average Goodwill and Other
Intangibles
(29,500) (29,898) (29,722) (30,104) (30,611)
Average Tangible Shareholders’ Equity 688,242 671,951 653,464 638,273 618,828
Return on Average Shareholders’
Equity
3.27% 19.90% 8.10% 6.71% 5.53%
Impact of Goodwill and Other
Intangibles
0.14% 0.88% 0.37% 0.31% 0.28%
Return on Average Tangible
Shareholders’ Equity
3.41% 20.78% 8.47% 7.02% 5.81%
p. 40

Non-GAAP Financial Measures
Core Net Income
$ Thousands
Quarter Ended
Mar. 31, 2018 Dec. 31, 2017 Sep. 30, 2017 Jun. 30, 2017 Mar. 31, 2017
Net Income 5,866 34,915 13,839 11,209 8,983
Impact of Income Tax Reform-related Benefit - (23,326) - - -
Impact of Restructuring-related Items (Net of Tax) (230) (169) 2,520 67 -
Impact of Acquisition-related Items (Net of Tax) (39) 47 229 115 -
Net Income, Excluding Income Tax Reform-related Benefit,
Restructuring (Net of Tax) and Acquisition-related Items (Net of Tax)
5,597 11,467 16,588 11,391 8,983
Noninterest Expense 100,769 106,838 114,697 111,244 106,874
Impact of Restructuring-related Expenses 291 260 (3,877) (103) -
Impact of Acquisition-related Expenses 50 (72) (353) (177) -
Noninterest Expense, Excluding Restructuring and Acquisition-
related Expenses
101,110 107,026 110,467 110,964 106,874
Diluted Earnings Per Common Share 0.22 1.29 0.51 0.41 0.33
Impact of Income Tax Reform-related Benefit - (0.86) - - -
Impact of Restructuring-related Items (Net of Tax) (0.01) (0.01) 0.09 - -
Impact Of Acquisition-related Items (Net of Tax) - - 0.01 0.01 -
Diluted Earnings Per Common Share, Excluding Income Tax Reform-
related Benefit, Restructuring (Net of Tax) and Acquisition-related
Items (Net of Tax)
0.21 0.42 0.61 0.42 0.33
Return On Average Assets 0.35% 2.03% 0.83% 0.70% 0.57%
Impact of Income Tax Reform-related Benefit 0.00% (1.35)% 0.00% 0.00% 0.00%
Impact of Restructuring-related Items (Net Of Tax) (0.01)% (0.01)% 0.15% 0.00% 0.00%
Impact of Acquisition-related Items (Net of Tax) (0.01)% 0.00% 0.01% 0.01% 0.00%
Return On Average Assets, Excluding Income Tax Reform-related
Benefit, Restructuring (Net of Tax) and Acquisition-related Items (Net
of Tax)
0.33% 0.67% 0.99% 0.71% 0.57%
p. 41
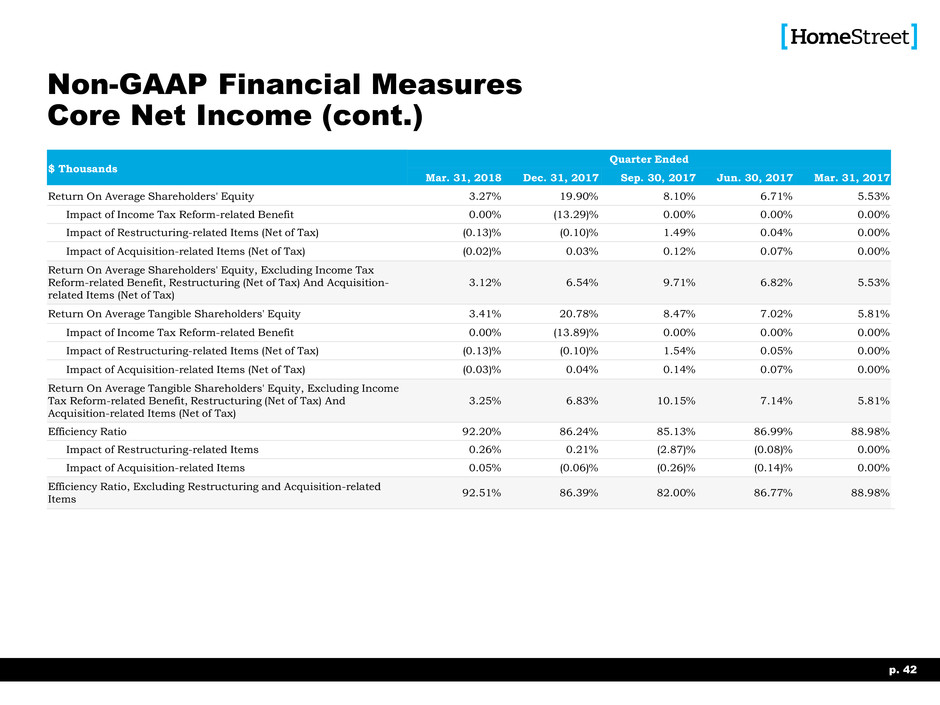
Non-GAAP Financial Measures
Core Net Income (cont.)
$ Thousands
Quarter Ended
Mar. 31, 2018 Dec. 31, 2017 Sep. 30, 2017 Jun. 30, 2017 Mar. 31, 2017
Return On Average Shareholders' Equity 3.27% 19.90% 8.10% 6.71% 5.53%
Impact of Income Tax Reform-related Benefit 0.00% (13.29)% 0.00% 0.00% 0.00%
Impact of Restructuring-related Items (Net of Tax) (0.13)% (0.10)% 1.49% 0.04% 0.00%
Impact of Acquisition-related Items (Net of Tax) (0.02)% 0.03% 0.12% 0.07% 0.00%
Return On Average Shareholders' Equity, Excluding Income Tax
Reform-related Benefit, Restructuring (Net of Tax) And Acquisition-
related Items (Net of Tax)
3.12% 6.54% 9.71% 6.82% 5.53%
Return On Average Tangible Shareholders' Equity 3.41% 20.78% 8.47% 7.02% 5.81%
Impact of Income Tax Reform-related Benefit 0.00% (13.89)% 0.00% 0.00% 0.00%
Impact of Restructuring-related Items (Net of Tax) (0.13)% (0.10)% 1.54% 0.05% 0.00%
Impact of Acquisition-related Items (Net of Tax) (0.03)% 0.04% 0.14% 0.07% 0.00%
Return On Average Tangible Shareholders' Equity, Excluding Income
Tax Reform-related Benefit, Restructuring (Net of Tax) And
Acquisition-related Items (Net of Tax)
3.25% 6.83% 10.15% 7.14% 5.81%
Efficiency Ratio 92.20% 86.24% 85.13% 86.99% 88.98%
Impact of Restructuring-related Items 0.26% 0.21% (2.87)% (0.08)% 0.00%
Impact of Acquisition-related Items 0.05% (0.06)% (0.26)% (0.14)% 0.00%
Efficiency Ratio, Excluding Restructuring and Acquisition-related
Items
92.51% 86.39% 82.00% 86.77% 88.98%
p. 42

Non-GAAP Financial Measures
Core Net Income Commercial & Consumer Banking
$ Thousands
Quarter Ended
Mar. 31, 2018 Dec. 31, 2017 Sep. 30, 2017 Jun. 30, 2017 Mar. 31, 2017
Net Income 10,206 9,361 13,962 9,446 9,292
Impact of Income Tax Reform-related Expense - 4,160 - - -
Impact of Acquisition-related Items (Net of Tax) (39) 47 229 115 -
Net Income, Excluding Income Tax Reform-related Expense and
Acquisition-related Items (Net of Tax)
10,167 13,568 14,191 9,561 9,292
ROAA 0.69% 0.63% 0.98% 0.69% 0.69%
Impact of Income Tax Reform-related Expense 0.00% 0.28% 0.00% 0.00% 0.00%
Impact of Acquisition-related Items (Net of Tax) 0.00% 0.00% 0.02% 0.00% 0.00%
ROAA, Excluding Income Tax Reform-related Expense and
Acquisition-related Items (Net of Tax)
0.69% 0.91% 1.00% 0.69% 0.69%
ROAE 7.44% 6.59% 10.19% 7.08% 7.38%
Impact of Income Tax Reform-related Expense 0.00% 2.93% 0.00% 0.00% 0.00%
Impact of Acquisition-related Items (Net of Tax) (0.02)% 0.03% 0.16% 0.08% 0.00%
ROAE, Excluding Income Tax Reform-related Expense and
Acquisition-related Items (Net of Tax)
7.42% 9.55% 10.35% 7.16% 7.38%
ROATE 7.86% 6.96% 10.76% 7.50% 7.85%
Impact of Income Tax Reform-related Expense 0.00% 3.09% 0.00% 0.00% 0.00%
Impact of Acquisition-related Items (Net of Tax) (0.03)% 0.03% 0.18% 0.09% 0.00%
ROATE, Excluding Income Tax Reform-related Expense and
Acquisition-related Items (Net of Tax)
7.83% 10.08% 10.94% 7.59% 7.85%
Efficiency Ratio 72.84% 66.10% 64.88% 72.22% 72.46%
Impact of Acquisition-related Items (Net of Tax) (0.09)% (0.12)% (0.62)% (0.35)% 0.00%
Efficiency Ratio, Excluding Acquisition-related Items (Net of Tax) 72.93% 65.98% 64.26% 71.87% 72.46%
p. 43

Non-GAAP Financial Measures
Core Net Income Mortgage Banking
$ Thousands
Quarter Ended
Mar. 31, 2018 Dec. 31, 2017 Sep. 30, 2017 Jun. 30, 2017 Mar. 31, 2017
Net Income $(4,340) $25,554 ($123) $1,763 ($309)
Impact of Income Tax Reform-related Benefit - (27,486) - - -
Impact of Restructuring-related Items (Net of Tax) (230) (169) 2,520 67 -
Net Income, Excluding Income Tax Reform-related Tax Benefit and
Restructuring-related Expenses (Net of Tax)
$(4,570) $(2,101) $2,397 $1,830 ($309)
ROAA (2.35)% 10.22% (0.05)% 0.80% (0.14)%
Impact of Income Tax Reform-related Benefit 0.00% (11.00)% 0.00% 0.00% 0.00%
Impact of Restructuring-related Items (Net of Tax) (0.12)% (0.06)% 0.97% 0.03% 0.00%
ROAA, Excluding Income Tax Reform-related Tax Benefit and
Restructuring-related Expenses (Net of Tax)
(2.47)% (0.84)% 0.92% 0.83% (0.14)%
ROATE (12.18% 71.46% (0.35)% 5.32% (0.90)%
Impact of Income Tax Reform-related Benefit (0.00)% (76.87)% 0.00% 0.00% 0.00%
Impact of Restructuring-related Items (Net of Tax) (0.65)% (0.47)% 7.17% 0.20% 0.00%
ROATE, Excluding Income Tax Reform-related Tax Benefit and
Restructuring-related Expenses (Net of Tax)
(12.83)% (5.88)% 6.82% 5.52% (0.90)%
Efficiency Ratio 110.13% 104.31% 100.11% 96.71% 100.89%
Impact of Restructuring-related Items 0.52% 0.40% (5.00)% (0.13)% 0.00%
Efficiency Ratio, Excluding Restructuring-related Expenses (Net of
Tax)
110.65% 104.71% 95.11% 96.58% 100.89%
p. 44

p. 45
(dollars in thousands, except share data) Dec. 31, 2012 Dec. 31, 2013 Dec. 31, 2014 Dec. 31, 2015 Dec. 31, 2016 Dec. 31, 2017
Commercial and Consumer Banking Segment:
Net income (loss) (12,703) 5,973 14,748 18,017 30,800 42,061
Impact of income tax reform-related expense - - - - - 4,160
Impact of acquisition-related items (net of tax) and bargain
purchase gain - 2,957 1,986 3,018 4,638 391
Core Net income (loss), excluding income tax reform-related expense
and acquisition-related items (net of tax)
(12,703) 8,930 16,734 21,035 35,438 46,612
ROATE (7.74)% 3.11% 6.86% 6.09% 7.08% 8.27%
Impact of income tax reform-related expense 0.00% 0.00% 0.00% 0.00% 0.00% 0.82%
Impact of acquisition-related items (net of tax) and bargain
purchase gain
0.00% 1.54% 1.35% 0.98% 1.06% 0.10%
Core ROATE, excluding income tax reform-related expense and
acquisition-related items (net of tax)
(7.74)% 4.65% 8.21% 7.07% 8.14% 9.19%
ROAA (0.67)% 0.27% 0.57% 0.51% 0.64% 0.74%
Impact of income tax reform-related expense 0.00% 0.00% 0.00% 0.00% 0.00% 0.07%
Impact of acquisition-related items (net of tax) and bargain
purchase gain
0.00% 0.15% 0.08% 0.08% 0.10% 0.01%
Core ROAA, excluding income tax reform-related expense and
acquisition-related items (net of tax)
(0.67)% 0.42% 0.65% 0.59% 0.74% 0.82%
Efficiency ratio 107.65% 89.06% 79.29% 82.07% 72.95% 68.68%
Impact of acquisition-related items (net of tax) and bargain
purchase gain
0.00% (6.12)% (3.03)% (7.22)% (3.76)% (0.27)%
Core Efficiency ratio, excluding income tax reform-related expense and
acquisition-related items
107.65% 82.94% 76.26% 74.85% 69.19% 68.41%
Mortgage Banking Segment:
Net income (loss) 94,829 17,836 7,511 23,302 27,351 26,885
Impact of income tax reform-related expense - - - - - (27,486)
Impact of restructuring-related items (net of tax) - - - - - 2,418
Core Net income (loss), excluding income tax reform-related expense
and acquisition-related items (net of tax)
94,829 17,836 7,511 23,302 27,351 1,817
ROATE 200.77% 32.79% 10.54% 18.68% 26.78% 19.45%
Impact of income tax reform-related expense 0.00% 0.00% 0.00% 0.00% 0.00% (19.89)%
Impact of restructuring-related items (net of tax) 0.00% 0.00% 0.00% 0.00% 0.00% 1.75%
Core ROATE, excluding income tax reform-related expense and
acquisition-related items (net of tax)
200.77% 32.79% 10.54% 18.68% 26.78% 1.31%
ROAA 18.83% 2.97% 1.19% 2.35% 2.79% 2.91%
Impact of income tax reform-related expense 0.00% 0.00% 0.00% 0.00% 0.00% (2.97)%
Impact of restructuring-related items (net of tax) 0.00% 0.00% 0.00% 0.00% 0.00% 0.26%
Core ROAA, excluding income tax reform-related expense and
acquisition-related items (net of tax)
18.83% 2.97% 1.19% 2.35% 2.79% 0.20%
Efficiency ratio 50.06% 85.56% 93.75% 87.07% 87.54% 100.34%
Impact of restructuring-related items 0.00% 0.00% 0.00% 0.00% 0.00% (1.28)%
Core Efficiency ratio, excluding income tax reform-related expense and
acquisition-related items
50.06% 85.56% 93.75% 87.07% 87.54% 99.06%
For the twelve months ended
(dollars in thousands, except share data) Dec. 31, 2012 Dec. 31, 2013 Dec. 31, 2014 Dec. 31, 2015 Dec. 31, 2016 Dec. 31, 2017
HomeStreet, Consolidated
Net income (loss) 82,126 23,809 22,259 41,319 58,151 68,946
Impact of income tax reform-related expense - - - - - (23,326)
Impact of restructuring-rel ted items (net of tax) - - - - - 2,418
Impact of acquisition-related items (net of tax) and bargain
purchase gain - 2,957 1,986 3,018 4,638 391
Core Net income (loss), excluding income tax reform-related expense
and acquisition-related items (net of tax)
82,126 26,766 24,245 44,337 62,789 48,429
ROATE 38.86 9.67 8.09 9.78 10.82 10.68%
Impact of income tax reform-related expense 0.00% 0.00% 0.00% 0.00% 0.00% (3.61)%
Impact of r structuring-related items (net of tax) 0.00 0.00 0.00 0.00 0.00 0.37%
Impact of acquisition-related items (net of tax) and bargain
purchase gain
0.00 1.20 0.72 0.72 0.86 0.06%
Core ROATE, e cluding income tax reform-related expense and
acquisition-related items (net of tax)
38.86% 10.87% 8.81% 10.50% 11.68% 7.50%
ROAA 3.42% 0.88% 0.69% 0.91% 1.01% 1.05%
Impact of income tax reform-related expense 0.00% 0.00% 0.00% 0.00% 0.00% (0.35)%
Impact of restructuring-related items (net of tax) 0.00 0.00 0.00 0.00 0.00 0.04%
Impact of acquisition-related items (net of tax) and bargain
purchase gain
0.00 0.10 0.07 0.06 0.08 (0.01)%
Core ROAA, xcluding income tax reform-related expense and
acquisition-related items (net of tax)
3.42 0.98 0.76 0.97 1.09 0.73%
Efficiency ratio 61.45 86.54 88.63 85.33 82.40 86.79%
Impact of restructuring-related items 0.00% 0.00% 0.00% 0.00% 0.00% (0.73)%
Impact of acquisition-related items (net of tax) and bargain
purchase gain
0.00% (1.72)% (1.07)% (2.36)% (1.32)% (0.13)%
Core Efficiency ratio, excluding income tax reform-related expense and
acquisition-related items
61.45% 84.82% 87.56% 82.97% 81.08% 85.93%
For the twelve months ended
Non-GAAP Financial Measures
Segment Core Earnings Contribution
