Attached files
| file | filename |
|---|---|
| EX-99.1 - EXHIBIT 99.1 - CURTISS WRIGHT CORP | a51800066ex99_1.htm |
| 8-K - CURTISS-WRIGHT CORPORATION 8-K - CURTISS WRIGHT CORP | a51800066.htm |
Exhibit 99.2

1Q 2018 Earnings Conference CallMay 3, 2018 NYSE: CW
Safe Harbor Statement Please note that the information provided in this presentation is accurate as of the date of the original presentation. The presentation will remain posted on this website from one to twelve months following the initial presentation, but content will not be updated to reflect new information that may become available after the original presentation posting. The presentation contains forward-looking statements including, among other things, management's estimates of future performance, revenue and earnings, our management's growth objectives, our management’s ability to integrate our acquisition, and our management's ability to produce consistent operating improvements. These forward-looking statements are based on expectations as of the time the statements were made only, and are subject to a number of risks and uncertainties which could cause us to fail to achieve our then-current financial projections and other expectations. This presentation also includes certain non-GAAP financial measures with reconciliations being made available in the earnings release that is posted to our website and furnished with the SEC. We undertake no duty to update this information. More information about potential factors that could affect our business and financial results is included in our filings with the Securities and Exchange Commission, including our Annual Reports on Form 10-K and Quarterly Reports on Form 10-Q, including, among other sections, under the captions, "Risk Factors" and "Management's Discussion and Analysis of Financial Condition and Results of Operations," which is on file with the SEC and available at the SEC's website at www.sec.gov.
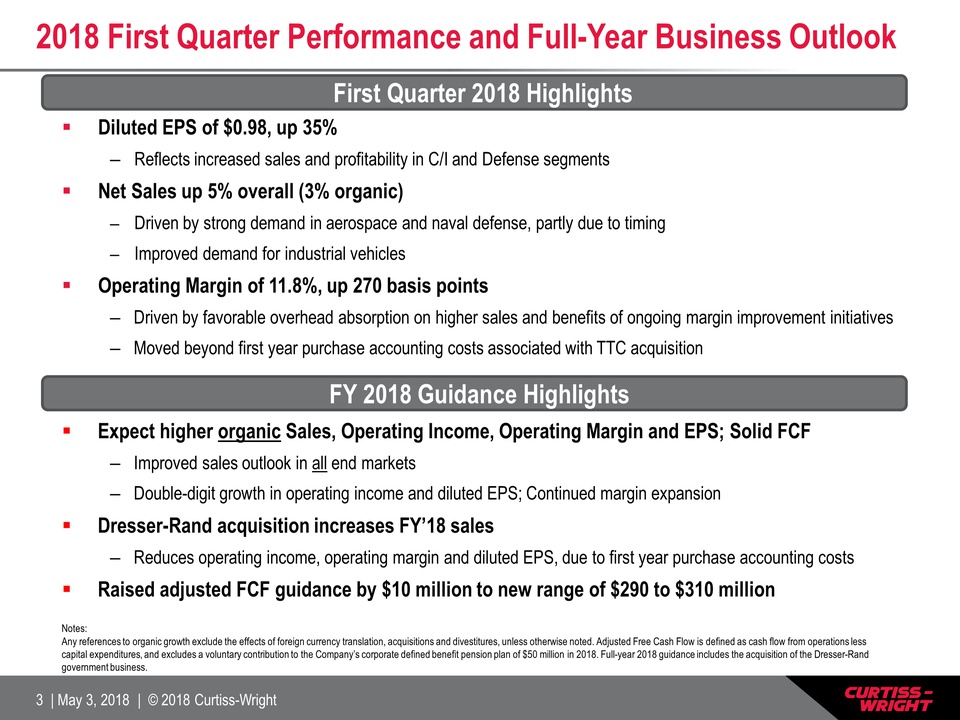
2018 First Quarter Performance and Full-Year Business Outlook Diluted EPS of $0.98, up 35%Reflects increased sales and profitability in C/I and Defense segmentsNet Sales up 5% overall (3% organic) Driven by strong demand in aerospace and naval defense, partly due to timingImproved demand for industrial vehiclesOperating Margin of 11.8%, up 270 basis pointsDriven by favorable overhead absorption on higher sales and benefits of ongoing margin improvement initiatives Moved beyond first year purchase accounting costs associated with TTC acquisition First Quarter 2018 Highlights FY 2018 Guidance Highlights Expect higher organic Sales, Operating Income, Operating Margin and EPS; Solid FCF Improved sales outlook in all end marketsDouble-digit growth in operating income and diluted EPS; Continued margin expansionDresser-Rand acquisition increases FY’18 salesReduces operating income, operating margin and diluted EPS, due to first year purchase accounting costsRaised adjusted FCF guidance by $10 million to new range of $290 to $310 million Notes: Any references to organic growth exclude the effects of foreign currency translation, acquisitions and divestitures, unless otherwise noted. Adjusted Free Cash Flow is defined as cash flow from operations less capital expenditures, and excludes a voluntary contribution to the Company’s corporate defined benefit pension plan of $50 million in 2018. Full-year 2018 guidance includes the acquisition of the Dresser-Rand government business.
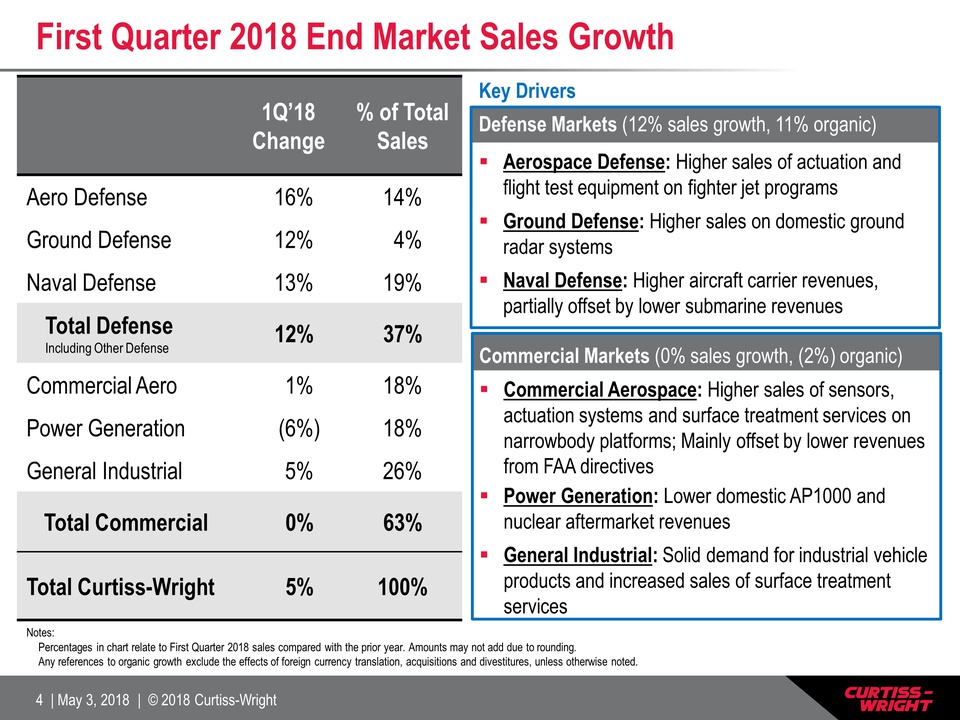
Key DriversDefense Markets (12% sales growth, 11% organic)Aerospace Defense: Higher sales of actuation and flight test equipment on fighter jet programsGround Defense: Higher sales on domestic ground radar systems Naval Defense: Higher aircraft carrier revenues, partially offset by lower submarine revenues First Quarter 2018 End Market Sales Growth Notes: Percentages in chart relate to First Quarter 2018 sales compared with the prior year. Amounts may not add due to rounding.Any references to organic growth exclude the effects of foreign currency translation, acquisitions and divestitures, unless otherwise noted. 1Q’18Change % of Total Sales Aero Defense 16% 14% Ground Defense 12% 4% Naval Defense 13% 19% Total DefenseIncluding Other Defense 12% 37% Commercial Aero 1% 18% Power Generation (6%) 18% General Industrial 5% 26% Total Commercial 0% 63% Total Curtiss-Wright 5% 100% Commercial Markets (0% sales growth, (2%) organic)Commercial Aerospace: Higher sales of sensors, actuation systems and surface treatment services on narrowbody platforms; Mainly offset by lower revenues from FAA directivesPower Generation: Lower domestic AP1000 and nuclear aftermarket revenuesGeneral Industrial: Solid demand for industrial vehicle products and increased sales of surface treatment services
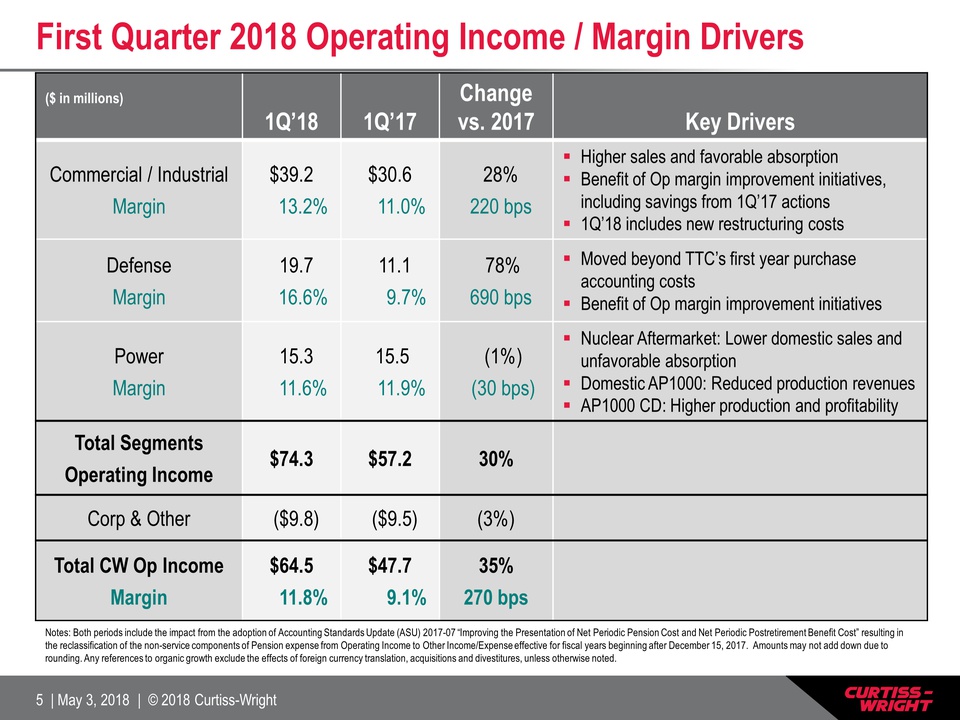
First Quarter 2018 Operating Income / Margin Drivers ($ in millions) 1Q’18 1Q’17 Change vs. 2017 Key Drivers Commercial / IndustrialMargin $39.2 13.2% $30.6 11.0% 28% 220 bps Higher sales and favorable absorptionBenefit of Op margin improvement initiatives, including savings from 1Q’17 actions1Q’18 includes new restructuring costs DefenseMargin 19.7 16.6% 11.1 9.7% 78% 690 bps Moved beyond TTC’s first year purchase accounting costsBenefit of Op margin improvement initiatives PowerMargin 15.3 11.6% 15.5 11.9% (1%) (30 bps) Nuclear Aftermarket: Lower domestic sales and unfavorable absorptionDomestic AP1000: Reduced production revenuesAP1000 CD: Higher production and profitability Total SegmentsOperating Income $74.3 $57.2 30% Corp & Other ($9.8) ($9.5) (3%) Total CW Op IncomeMargin $64.5 11.8% $47.7 9.1% 35%270 bps Notes: Both periods include the impact from the adoption of Accounting Standards Update (ASU) 2017-07 “Improving the Presentation of Net Periodic Pension Cost and Net Periodic Postretirement Benefit Cost” resulting in the reclassification of the non-service components of Pension expense from Operating Income to Other Income/Expense effective for fiscal years beginning after December 15, 2017. Amounts may not add down due to rounding. Any references to organic growth exclude the effects of foreign currency translation, acquisitions and divestitures, unless otherwise noted.
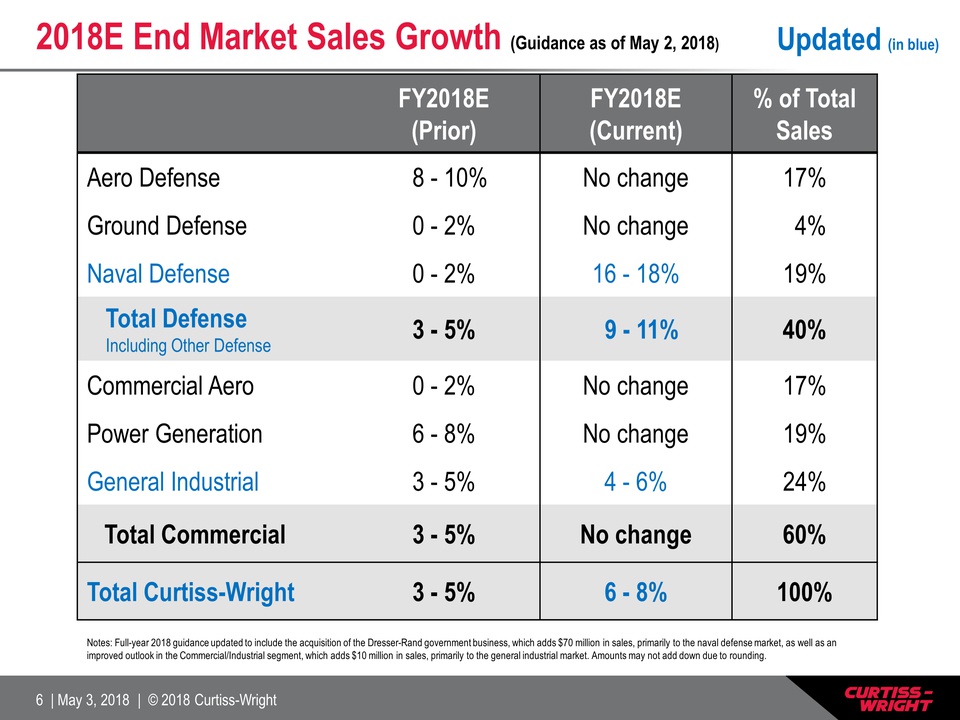
2018E End Market Sales Growth (Guidance as of May 2, 2018) FY2018E(Prior) FY2018E(Current) % of Total Sales Aero Defense 8 - 10% No change 17% Ground Defense 0 - 2% No change 4% Naval Defense 0 - 2% 16 - 18% 19% Total DefenseIncluding Other Defense 3 - 5% 9 - 11% 40% Commercial Aero 0 - 2% No change 17% Power Generation 6 - 8% No change 19% General Industrial 3 - 5% 4 - 6% 24% Total Commercial 3 - 5% No change 60% Total Curtiss-Wright 3 - 5% 6 - 8% 100% Notes: Full-year 2018 guidance updated to include the acquisition of the Dresser-Rand government business, which adds $70 million in sales, primarily to the naval defense market, as well as an improved outlook in the Commercial/Industrial segment, which adds $10 million in sales, primarily to the general industrial market. Amounts may not add down due to rounding. Updated (in blue)
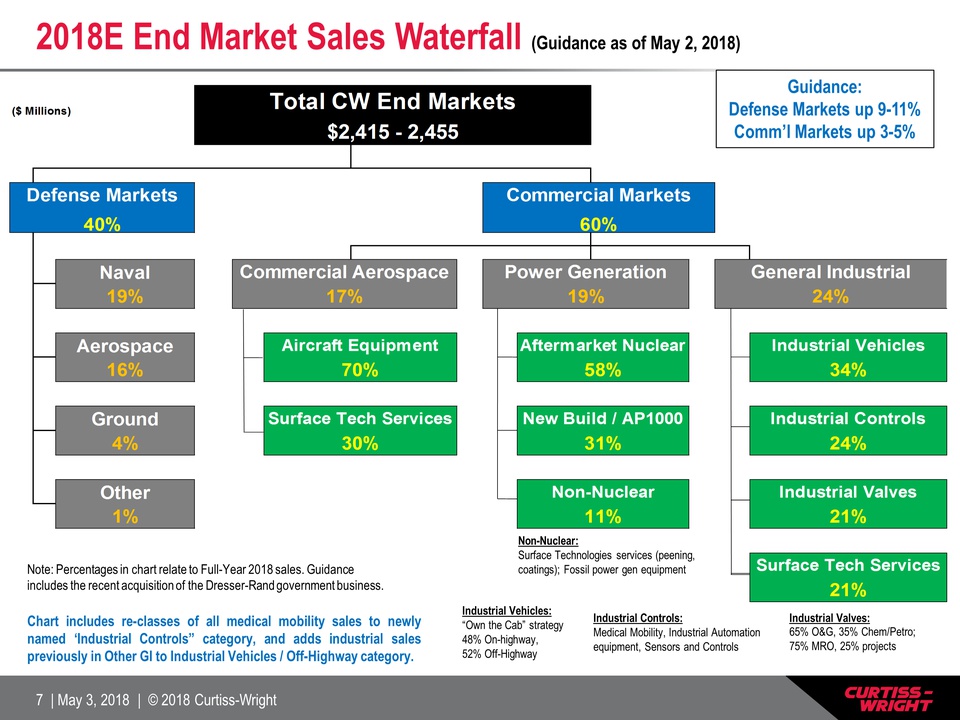
2018E End Market Sales Waterfall (Guidance as of May 2, 2018) Guidance:Defense Markets up 9-11%Comm’l Markets up 3-5% Industrial Controls:Medical Mobility, Industrial Automation equipment, Sensors and Controls Industrial Vehicles:“Own the Cab” strategy48% On-highway,52% Off-Highway Industrial Valves:65% O&G, 35% Chem/Petro; 75% MRO, 25% projects Non-Nuclear:Surface Technologies services (peening, coatings); Fossil power gen equipment Note: Percentages in chart relate to Full-Year 2018 sales. Guidance includes the recent acquisition of the Dresser-Rand government business. Chart includes re-classes of all medical mobility sales to newly named ‘Industrial Controls” category, and adds industrial sales previously in Other GI to Industrial Vehicles / Off-Highway category.
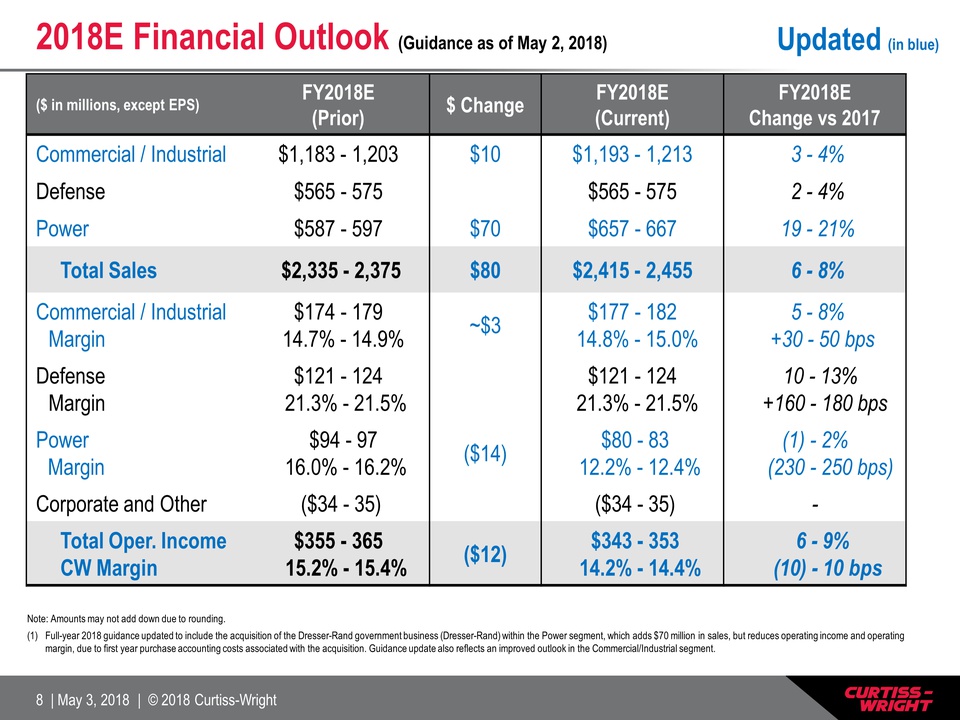
($ in millions, except EPS) FY2018E(Prior) $ Change FY2018E(Current) FY2018E Change vs 2017 Commercial / Industrial $1,183 - 1,203 $10 $1,193 - 1,213 3 - 4% Defense $565 - 575 $565 - 575 2 - 4% Power $587 - 597 $70 $657 - 667 19 - 21% Total Sales $2,335 - 2,375 $80 $2,415 - 2,455 6 - 8% Commercial / IndustrialMargin $174 - 179 14.7% - 14.9% ~$3 $177 - 182 14.8% - 15.0% 5 - 8% +30 - 50 bps DefenseMargin $121 - 124 21.3% - 21.5% $121 - 124 21.3% - 21.5% 10 - 13% +160 - 180 bps PowerMargin $94 - 97 16.0% - 16.2% ($14) $80 - 83 12.2% - 12.4% (1) - 2% (230 - 250 bps) Corporate and Other ($34 - 35) ($34 - 35) - Total Oper. IncomeCW Margin $355 - 365 15.2% - 15.4% ($12) $343 - 353 14.2% - 14.4% 6 - 9% (10) - 10 bps 2018E Financial Outlook (Guidance as of May 2, 2018) Note: Amounts may not add down due to rounding. Full-year 2018 guidance updated to include the acquisition of the Dresser-Rand government business (Dresser-Rand) within the Power segment, which adds $70 million in sales, but reduces operating income and operating margin, due to first year purchase accounting costs associated with the acquisition. Guidance update also reflects an improved outlook in the Commercial/Industrial segment. Updated (in blue)
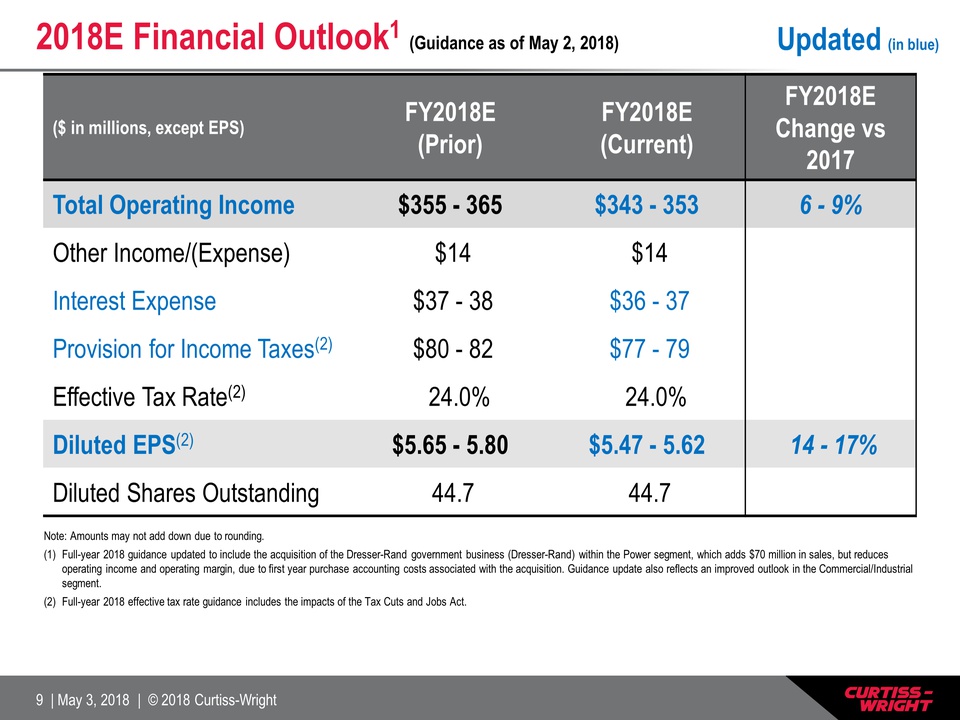
($ in millions, except EPS) FY2018E(Prior) FY2018E(Current) FY2018E Change vs 2017 Total Operating Income $355 - 365 $343 - 353 6 - 9% Other Income/(Expense) $14 $14 Interest Expense $37 - 38 $36 - 37 Provision for Income Taxes(2) $80 - 82 $77 - 79 Effective Tax Rate(2) 24.0% 24.0% Diluted EPS(2) $5.65 - 5.80 $5.47 - 5.62 14 - 17% Diluted Shares Outstanding 44.7 44.7 2018E Financial Outlook1 (Guidance as of May 2, 2018) Note: Amounts may not add down due to rounding. Full-year 2018 guidance updated to include the acquisition of the Dresser-Rand government business (Dresser-Rand) within the Power segment, which adds $70 million in sales, but reduces operating income and operating margin, due to first year purchase accounting costs associated with the acquisition. Guidance update also reflects an improved outlook in the Commercial/Industrial segment.Full-year 2018 effective tax rate guidance includes the impacts of the Tax Cuts and Jobs Act. Updated (in blue)
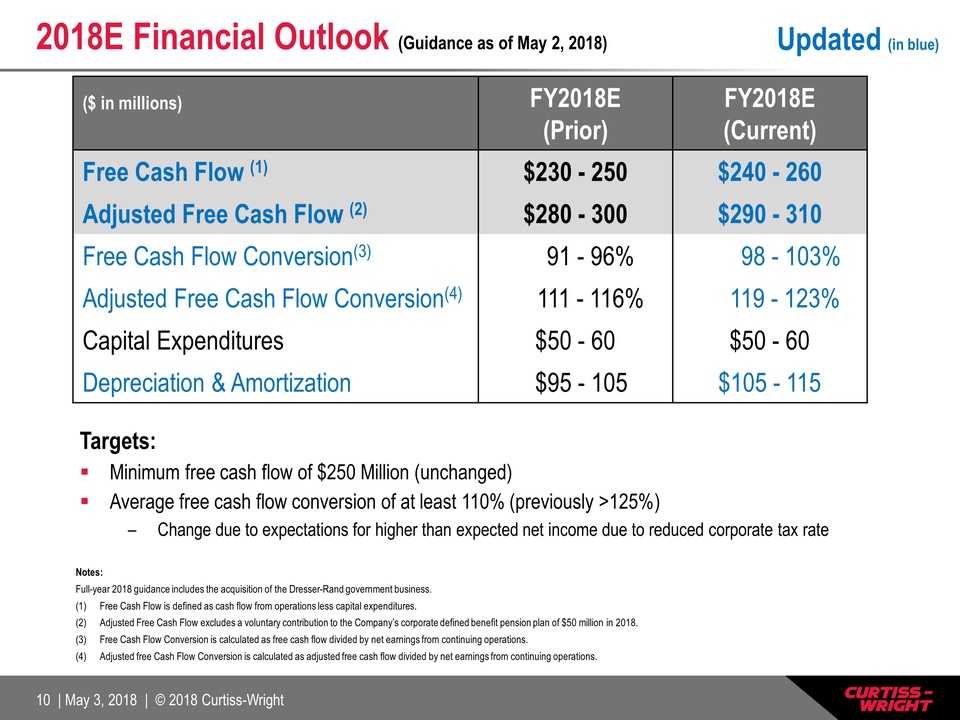
Notes:Full-year 2018 guidance includes the acquisition of the Dresser-Rand government business.Free Cash Flow is defined as cash flow from operations less capital expenditures. Adjusted Free Cash Flow excludes a voluntary contribution to the Company’s corporate defined benefit pension plan of $50 million in 2018.Free Cash Flow Conversion is calculated as free cash flow divided by net earnings from continuing operations.Adjusted free Cash Flow Conversion is calculated as adjusted free cash flow divided by net earnings from continuing operations. 2018E Financial Outlook (Guidance as of May 2, 2018) ($ in millions) FY2018E(Prior) FY2018E(Current) Free Cash Flow (1) $230 - 250 $240 - 260 Adjusted Free Cash Flow (2) $280 - 300 $290 - 310 Free Cash Flow Conversion(3) 91 - 96% 98 - 103% Adjusted Free Cash Flow Conversion(4) 111 - 116% 119 - 123% Capital Expenditures $50 - 60 $50 - 60 Depreciation & Amortization $95 - 105 $105 - 115 Targets:Minimum free cash flow of $250 Million (unchanged)Average free cash flow conversion of at least 110% (previously >125%)Change due to expectations for higher than expected net income due to reduced corporate tax rate Updated (in blue)
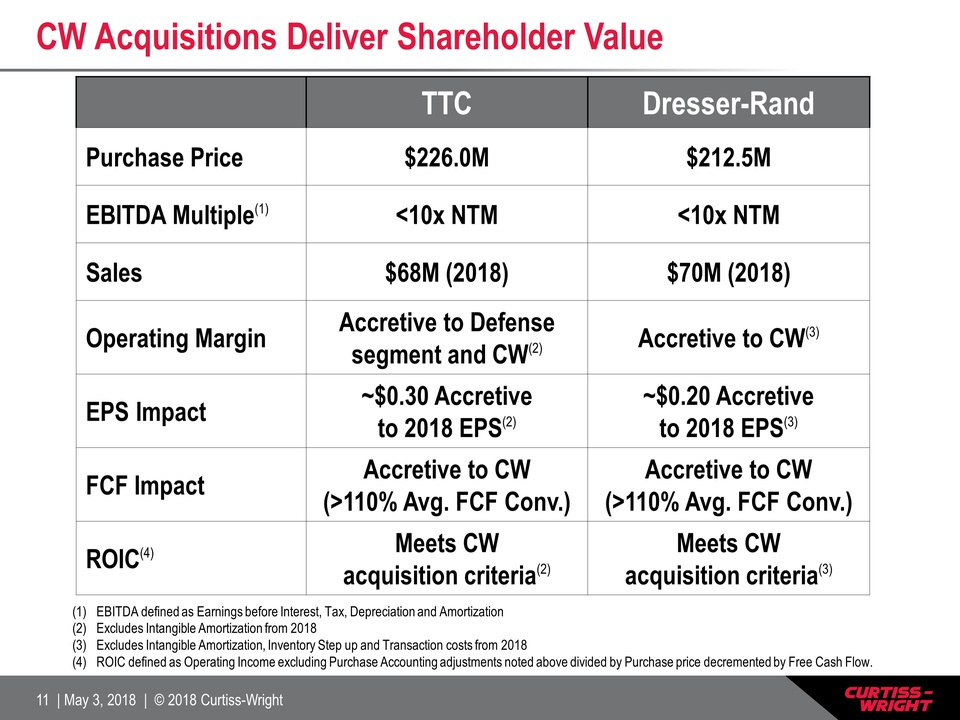
TTC Dresser-Rand Purchase Price $226.0M $212.5M EBITDA Multiple(1) <10x NTM <10x NTM Sales $68M (2018) $70M (2018) Operating Margin Accretive to Defense segment and CW(2) Accretive to CW(3) EPS Impact ~$0.30 Accretive to 2018 EPS(2) ~$0.20 Accretive to 2018 EPS(3) FCF Impact Accretive to CW(>110% Avg. FCF Conv.) Accretive to CW(>110% Avg. FCF Conv.) ROIC(4) Meets CW acquisition criteria(2) Meets CW acquisition criteria(3) CW Acquisitions Deliver Shareholder Value EBITDA defined as Earnings before Interest, Tax, Depreciation and Amortization Excludes Intangible Amortization from 2018 Excludes Intangible Amortization, Inventory Step up and Transaction costs from 2018ROIC defined as Operating Income excluding Purchase Accounting adjustments noted above divided by Purchase price decremented by Free Cash Flow.
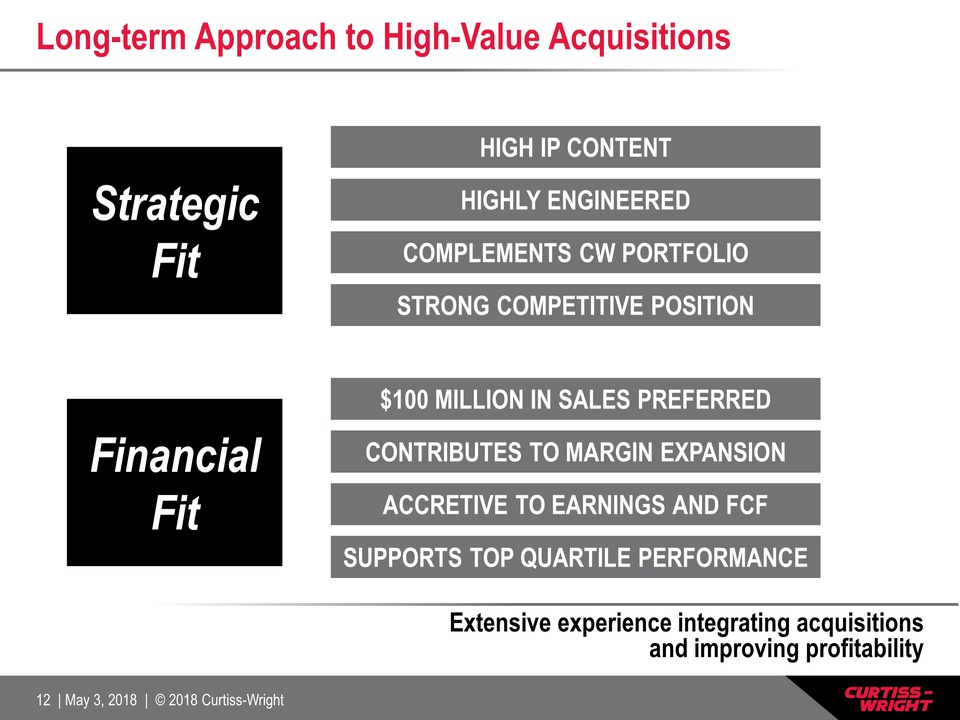
Long-term Approach to High-Value Acquisitions Extensive experience integrating acquisitions and improving profitability HIGH IP CONTENT HIGHLY ENGINEERED COMPLEMENTS CW PORTFOLIO STRONG COMPETITIVE POSITION Strategic Fit $100 MILLION IN SALES PREFERRED CONTRIBUTES TO MARGIN EXPANSION ACCRETIVE TO EARNINGS AND FCF SUPPORTS TOP QUARTILE PERFORMANCE Financial Fit
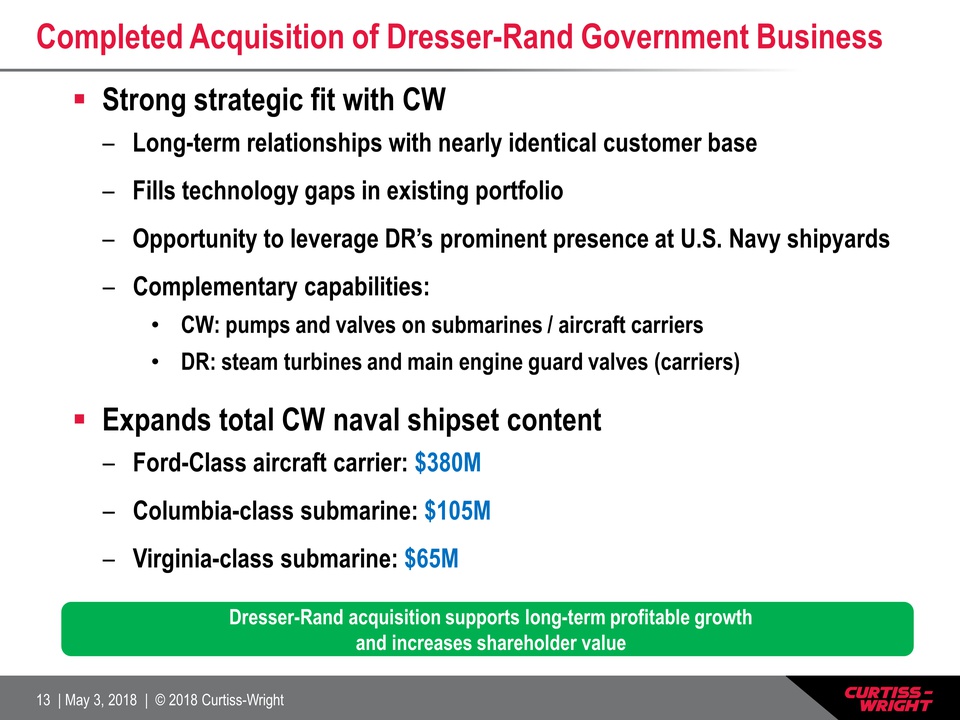
Completed Acquisition of Dresser-Rand Government Business Dresser-Rand acquisition supports long-term profitable growth and increases shareholder value Strong strategic fit with CWLong-term relationships with nearly identical customer baseFills technology gaps in existing portfolioOpportunity to leverage DR’s prominent presence at U.S. Navy shipyardsComplementary capabilities: CW: pumps and valves on submarines / aircraft carriers DR: steam turbines and main engine guard valves (carriers)Expands total CW naval shipset contentFord-Class aircraft carrier: $380MColumbia-class submarine: $105MVirginia-class submarine: $65M
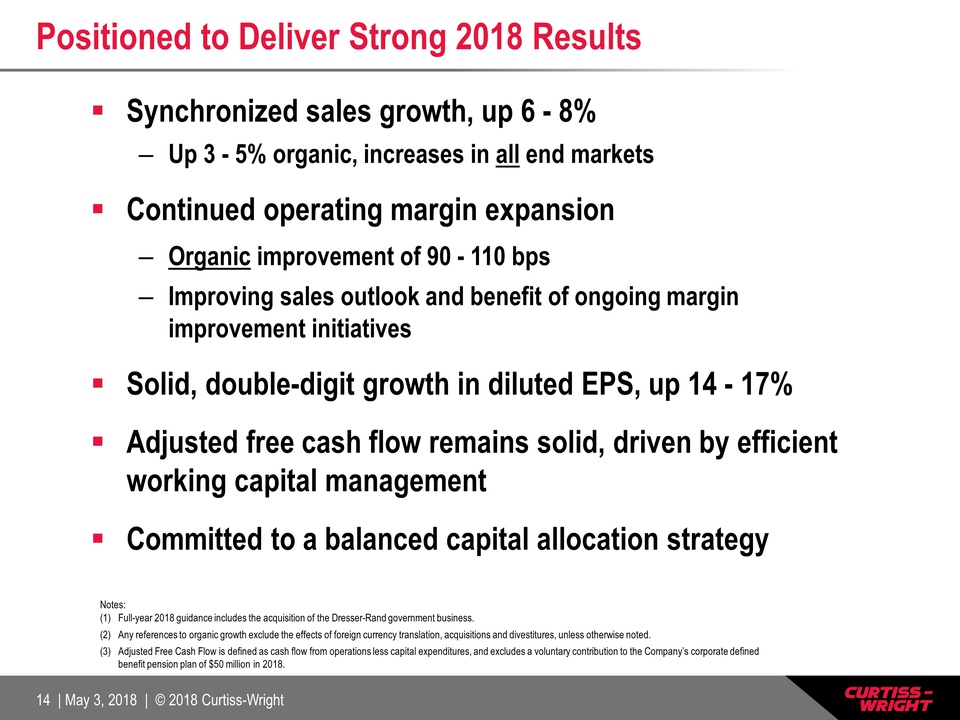
Positioned to Deliver Strong 2018 Results Synchronized sales growth, up 6 - 8%Up 3 - 5% organic, increases in all end marketsContinued operating margin expansion Organic improvement of 90 - 110 bpsImproving sales outlook and benefit of ongoing margin improvement initiativesSolid, double-digit growth in diluted EPS, up 14 - 17%Adjusted free cash flow remains solid, driven by efficient working capital managementCommitted to a balanced capital allocation strategy Notes: Full-year 2018 guidance includes the acquisition of the Dresser-Rand government business. Any references to organic growth exclude the effects of foreign currency translation, acquisitions and divestitures, unless otherwise noted. Adjusted Free Cash Flow is defined as cash flow from operations less capital expenditures, and excludes a voluntary contribution to the Company’s corporate defined benefit pension plan of $50 million in 2018.
Appendix
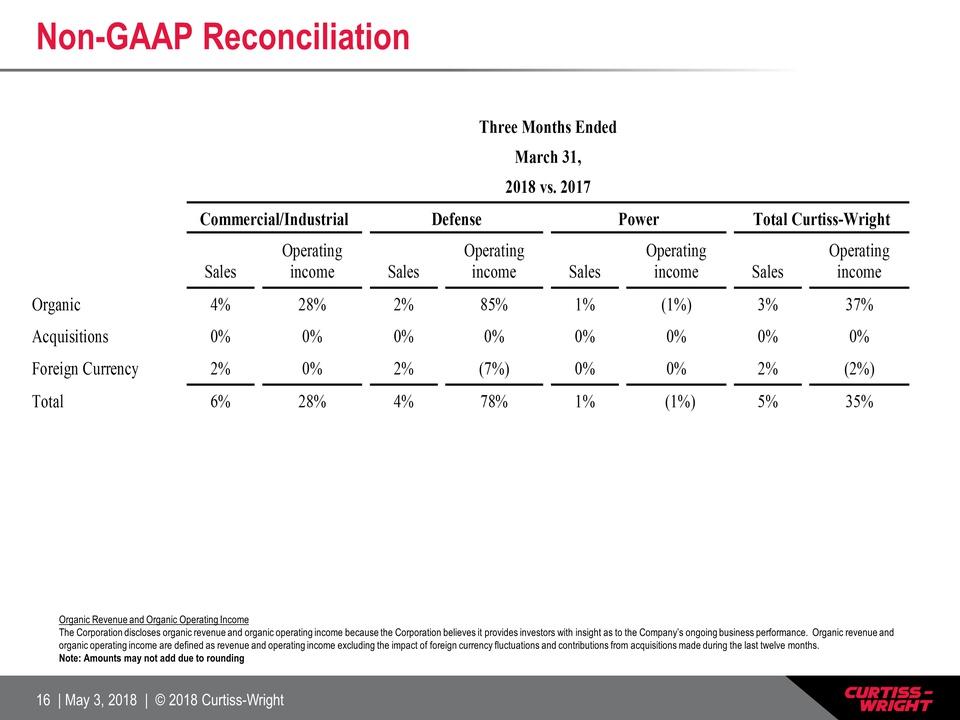
Non-GAAP Reconciliation Organic Revenue and Organic Operating Income The Corporation discloses organic revenue and organic operating income because the Corporation believes it provides investors with insight as to the Company’s ongoing business performance. Organic revenue and organic operating income are defined as revenue and operating income excluding the impact of foreign currency fluctuations and contributions from acquisitions made during the last twelve months. Note: Amounts may not add due to rounding
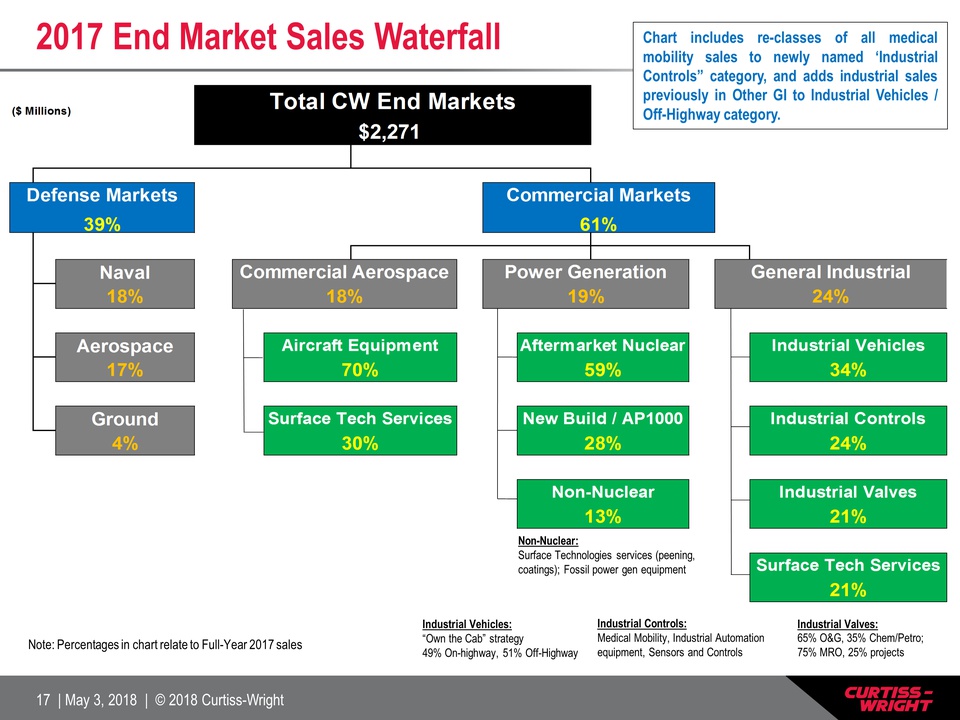
2017 End Market Sales Waterfall Industrial Controls:Medical Mobility, Industrial Automation equipment, Sensors and Controls Industrial Vehicles:“Own the Cab” strategy49% On-highway, 51% Off-Highway Industrial Valves:65% O&G, 35% Chem/Petro; 75% MRO, 25% projects Non-Nuclear:Surface Technologies services (peening, coatings); Fossil power gen equipment Note: Percentages in chart relate to Full-Year 2017 sales Chart includes re-classes of all medical mobility sales to newly named ‘Industrial Controls” category, and adds industrial sales previously in Other GI to Industrial Vehicles / Off-Highway category.