Attached files
| file | filename |
|---|---|
| EX-99.1 - EXHIBIT 99.1 - NOBLE ENERGY INC | nbl-20180331xearningsrelea.htm |
| 8-K - 8-K - NOBLE ENERGY INC | nbl-20180331x8kearningsrel.htm |

First Quarter Supplement
May 2018
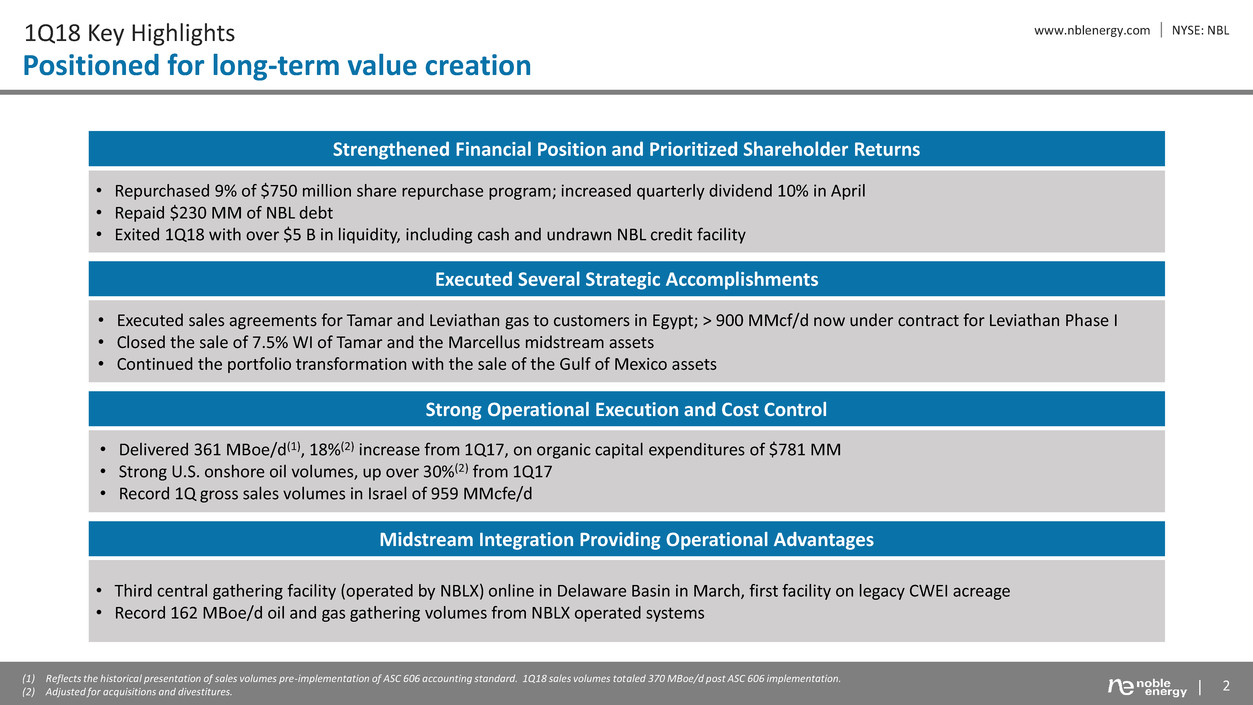
www.nblenergy.com NYSE: NBL 1Q18 Key Highlights
Positioned for long-term value creation
2
Strengthened Financial Position and Prioritized Shareholder Returns
Executed Several Strategic Accomplishments
Midstream Integration Providing Operational Advantages
Strong Operational Execution and Cost Control
• Repurchased 9% of $750 million share repurchase program; increased quarterly dividend 10% in April
• Repaid $230 MM of NBL debt
• Exited 1Q18 with over $5 B in liquidity, including cash and undrawn NBL credit facility
• Executed sales agreements for Tamar and Leviathan gas to customers in Egypt; > 900 MMcf/d now under contract for Leviathan Phase I
• Closed the sale of 7.5% WI of Tamar and the Marcellus midstream assets
• Continued the portfolio transformation with the sale of the Gulf of Mexico assets
• Delivered 361 MBoe/d(1), 18%(2) increase from 1Q17, on organic capital expenditures of $781 MM
• Strong U.S. onshore oil volumes, up over 30%(2) from 1Q17
• Record 1Q gross sales volumes in Israel of 959 MMcfe/d
• Third central gathering facility (operated by NBLX) online in Delaware Basin in March, first facility on legacy CWEI acreage
• Record 162 MBoe/d oil and gas gathering volumes from NBLX operated systems
(1) Reflects the historical presentation of sales volumes pre-implementation of ASC 606 accounting standard. 1Q18 sales volumes totaled 370 MBoe/d post ASC 606 implementation.
(2) Adjusted for acquisitions and divestitures.
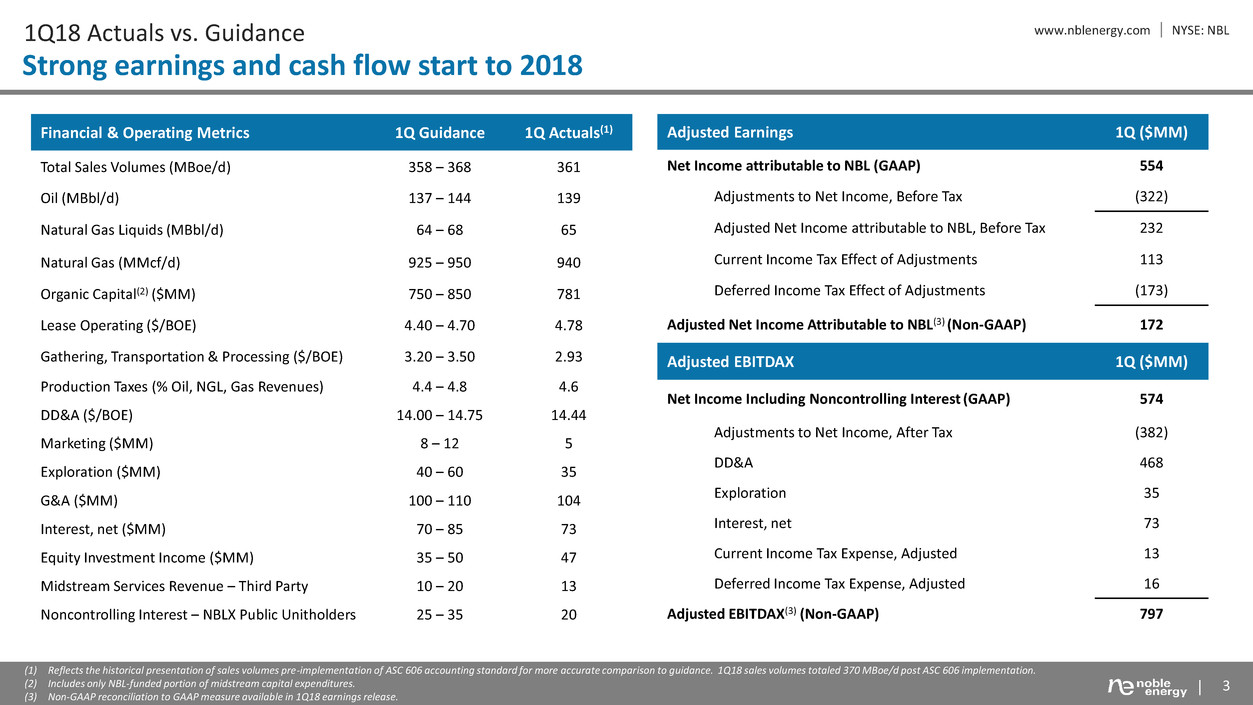
www.nblenergy.com NYSE: NBL 1Q18 Actuals vs. Guidance
Strong earnings and cash flow start to 2018
3
Financial & Operating Metrics 1Q Guidance 1Q Actuals(1)
Total Sales Volumes (MBoe/d) 358 – 368 361
Oil (MBbl/d) 137 – 144 139
Natural Gas Liquids (MBbl/d) 64 – 68 65
Natural Gas (MMcf/d) 925 – 950 940
Organic Capital(2) ($MM) 750 – 850 781
Lease Operating ($/BOE) 4.40 – 4.70 4.78
Gathering, Transportation & Processing ($/BOE) 3.20 – 3.50 2.93
Production Taxes (% Oil, NGL, Gas Revenues) 4.4 – 4.8 4.6
DD&A ($/BOE) 14.00 – 14.75 14.44
Marketing ($MM) 8 – 12 5
Exploration ($MM) 40 – 60 35
G&A ($MM) 100 – 110 104
Interest, net ($MM) 70 – 85 73
Equity Investment Income ($MM) 35 – 50 47
Midstream Services Revenue – Third Party 10 – 20 13
Noncontrolling Interest – NBLX Public Unitholders 25 – 35 20
Adjusted Earnings 1Q ($MM)
Net Income attributable to NBL (GAAP) 554
Adjustments to Net Income, Before Tax (322)
Adjusted Net Income attributable to NBL, Before Tax 232
Current Income Tax Effect of Adjustments 113
Deferred Income Tax Effect of Adjustments (173)
Adjusted Net Income Attributable to NBL(3) (Non-GAAP) 172
Adjusted EBITDAX 1Q ($MM)
Net Income Including Noncontrolling Interest (GAAP) 574
Adjustments to Net Income, After Tax (382)
DD&A 468
Exploration 35
Interest, net 73
Current Income Tax Expense, Adjusted 13
Deferred Income Tax Expense, Adjusted 16
Adjusted EBITDAX(3) (Non-GAAP) 797
(1) Reflects the historical presentation of sales volumes pre-implementation of ASC 606 accounting standard for more accurate comparison to guidance. 1Q18 sales volumes totaled 370 MBoe/d post ASC 606 implementation.
(2) Includes only NBL-funded portion of midstream capital expenditures.
(3) Non-GAAP reconciliation to GAAP measure available in 1Q18 earnings release.

www.nblenergy.com NYSE: NBL
4
Strengthened Financial Position
Prudent financial management: a pillar of NBL’s business success
Progressing Shareholder Return
• Repurchased $67.5 MM outstanding shares, 9% of $750 MM share
repurchase program
• 10% dividend increase with 1Q18 raise
. . . . . . . . . . . . . . . . . . . . . . . . . . . . . . . . . . . . . . . . . . . . . . . . . . . . . . . . . . . . . . . . . . . . . . . . . . . . . . . . . . . . . . . . . . . . . . . . . . .
Accomplished Over $600 MM NBL Debt Reduction Objective
• Repaid $230 MM of NBL debt in 1Q18
• Additional $379 MM reduction in 2Q18 removes legacy ROSE debt
. . . . . . . . . . . . . . . . . . . . . . . . . . . . . . . . . . . . . . . . . . . . . . . . . . . . . . . . . . . . . . . . . . . . . . . . . . . . . . . . . . . . . . . . . . . . . . . . . . .
Investment Grade Credit Rating Reaffirmed
• Fitch revised outlook to positive from stable
• S&P revised outlook to stable from negative
0.0
2.0
4.0
6.0
1Q17 4Q17 1Q18
Available NBL Revolver Cash
Increased Liquidity to Over $5 B $ B
> $2.5 B
NBL debt reduction since
beginning of 2016
> $600 MM
NBL debt reduction
YTD in 2018
www.nblenergy.com NYSE: NBL U.S. Onshore
Delivering increasing oil volume growth through 2018
5
(1) Adjusted for acquisitions and divestitures.
(2) Reflects the historical presentation of sales volumes, pre-implementation of ASC 606 accounting standard. 1Q18 Total U.S. Onshore sales volumes totaled 246 MBoe/d and 1Q18 DJ Basin sales volumes totaled 120
MBoe/d post ASC 606 implementation.
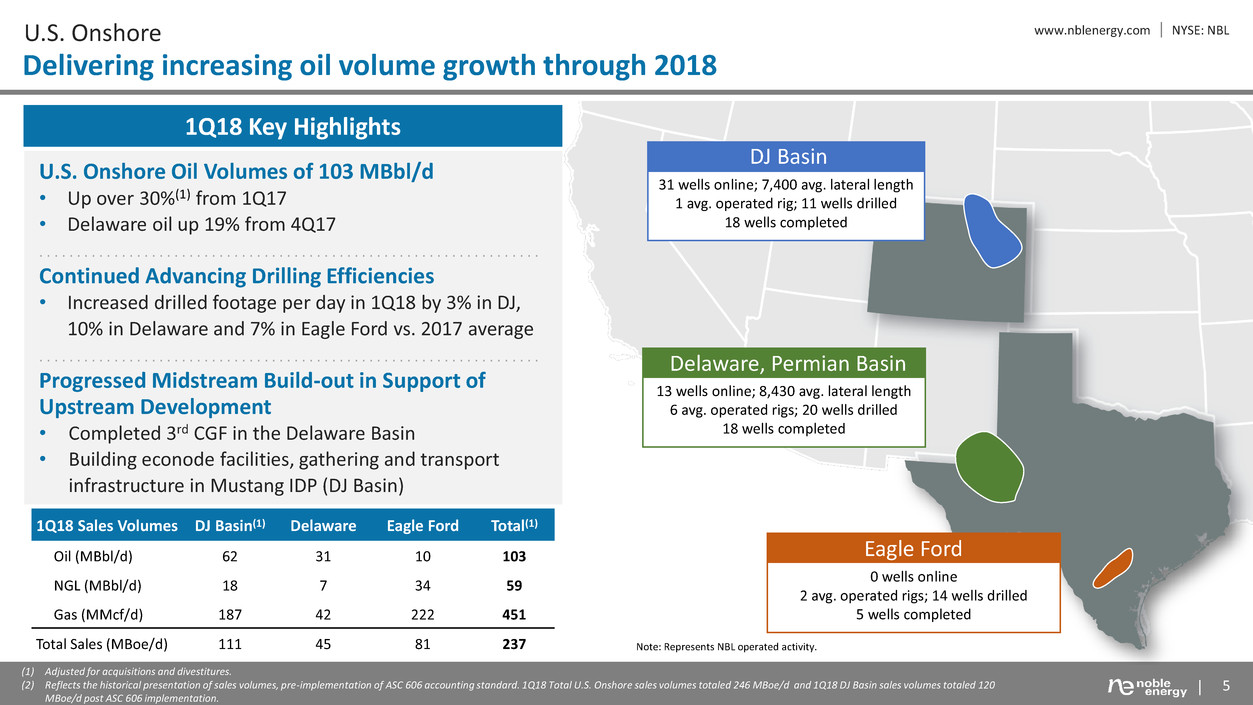
1Q18 Key Highlights
U.S. Onshore Oil Volumes of 103 MBbl/d
• Up over 30%(1) from 1Q17
• Delaware oil up 19% from 4Q17
. . . . . . . . . . . . . . . . . . . . . . . . . . . . . . . . . . . . . . . . . . . . . . . . . . . . . . . . . . . . . . . . . . .
Continued Advancing Drilling Efficiencies
• Increased drilled footage per day in 1Q18 by 3% in DJ,
10% in Delaware and 7% in Eagle Ford vs. 2017 average
. . . . . . . . . . . . . . . . . . . . . . . . . . . . . . . . . . . . . . . . . . . . . . . . . . . . . . . . . . . . . . . . . . .
Progressed Midstream Build-out in Support of
Upstream Development
• Completed 3rd CGF in the Delaware Basin
• Building econode facilities, gathering and transport
infrastructure in Mustang IDP (DJ Basin)
0 wells online
2 avg. operated rigs; 14 wells drilled
5 wells completed
Eagle Ford
13 wells online; 8,430 avg. lateral length
6 avg. operated rigs; 20 wells drilled
18 wells completed
Delaware, Permian Basin
31 wells online; 7,400 avg. lateral length
1 avg. operated rig; 11 wells drilled
18 wells completed
DJ Basin
1Q18 Sales Volumes DJ Basin(1) Delaware Eagle Ford Total(1)
Oil (MBbl/d) 62 31 10 103
NGL (MBbl/d) 18 7 34 59
Gas (MMcf/d) 187 42 222 451
Total Sales (MBoe/d) 111 45 81 237 Note: Represents NBL operated activity.
www.nblenergy.com NYSE: NBL
6
U.S. Onshore Marketing
Diversification provides price optionality and flow assurance
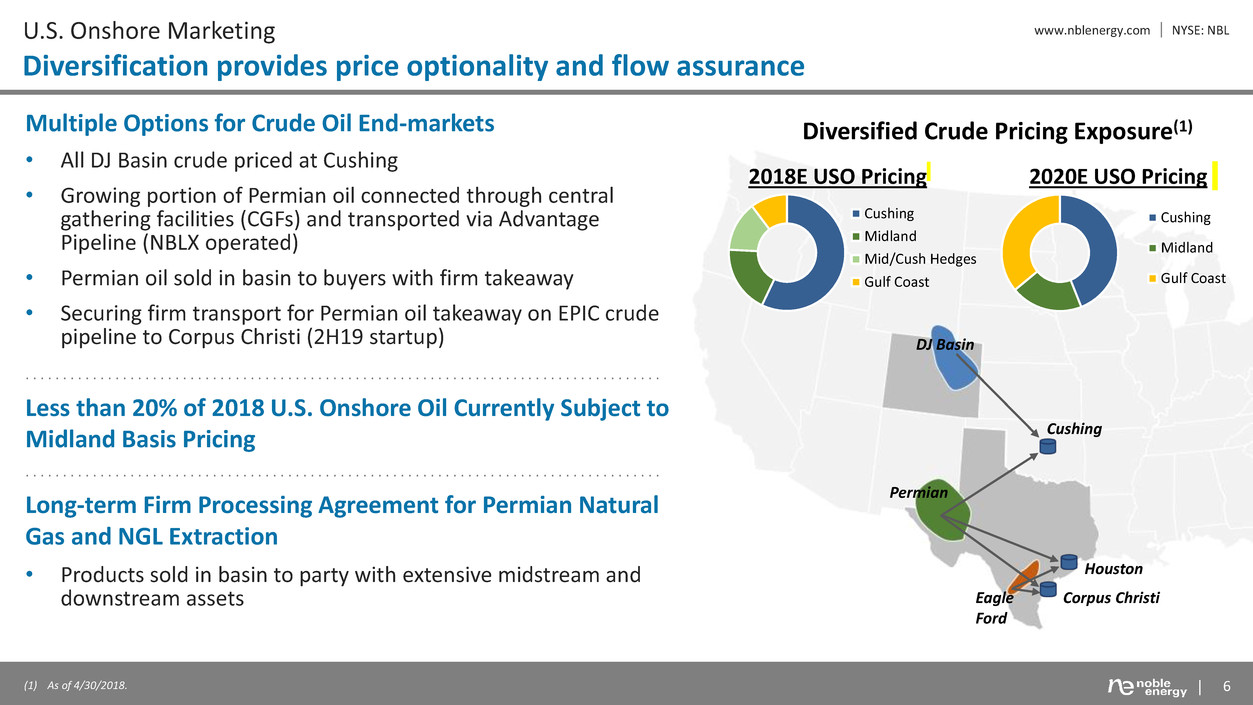
Multiple Options for Crude Oil End-markets
• All DJ Basin crude priced at Cushing
• Growing portion of Permian oil connected through central
gathering facilities (CGFs) and transported via Advantage
Pipeline (NBLX operated)
• Permian oil sold in basin to buyers with firm takeaway
• Securing firm transport for Permian oil takeaway on EPIC crude
pipeline to Corpus Christi (2H19 startup)
. . . . . . . . . . . . . . . . . . . . . . . . . . . . . . . . . . . . . . . . . . . . . . . . . . . . . . . . . . . . . . . . . . . . . . . . . . . . . . . . . . . . .
Less than 20% of 2018 U.S. Onshore Oil Currently Subject to
Midland Basis Pricing
. . . . . . . . . . . . . . . . . . . . . . . . . . . . . . . . . . . . . . . . . . . . . . . . . . . . . . . . . . . . . . . . . . . . . . . . . . . . . . . . . . . . .
Long-term Firm Processing Agreement for Permian Natural
Gas and NGL Extraction
• Products sold in basin to party with extensive midstream and
downstream assets
Diversified Crude Pricing Exposure(1)
Permian
Eagle
Ford
DJ Basin
Cushing
Houston
Corpus Christi
Cushing
Midland
Mid/Cush Hedges
Gulf Coast
2018E USO Pricing 2020E USO Pricing
(1) As of 4/30/2018.
Cushing
Midland
Gulf Coast

www.nblenergy.com NYSE: NBL
117,000
Net acres
3,800
Gross locations(1)
7,800 ft
Average lateral Length
2 BBoe
Net unrisked resources(1)
1Q17 2Q17 3Q17 4Q17 1Q18
0
10
20
30
40
50
Total Oil (MBbl/d)
Delaware Basin
Progressing full-field development
7
Solid Execution Start to 2018
• 19% oil growth from 4Q17
• 13 wells online in 1Q, all multi-well pads and multi-zone
development with 9 wells flowing through CGFs
• Operating 6 rigs and 3 frac crews
. . . . . . . . . . . . . . . . . . . . . . . . . . . . . . . . . . . . . . . . . . . . . . . . . . . . . . . . . . . . . . . . . . . . . . . . . . . . . . . . . . . . . .
Progressing Midstream Infrastructure Build-out
• 3rd CGF completed in 1Q18, 1st servicing legacy CWEI acreage
• 2 additional CGFs online by end of 2Q18, expanding oil
takeaway capacity to 90 MBbl/d
• All CGFs connected and flowing through Advantage pipeline
. . . . . . . . . . . . . . . . . . . . . . . . . . . . . . . . . . . . . . . . . . . . . . . . . . . . . . . . . . . . . . . . . . . . . . . . . . . . . . . . . . . . . .
Driving Operating Efficiencies from Multi-well Pads and
Longer Laterals
• 26% reduction in completion cycle time from multi-well pads in
1Q18 vs. single well development in 2017
• Increased wells online lateral length by 24% vs. 2017 average
Delaware Basin Net Production
Delivering High Margin Growth
MBoe/d
Ward
Pecos
Reeves
NBL Acreage
(1) Locations and resources estimate effective as of beginning of 2018.
TX

www.nblenergy.com NYSE: NBL
8
Delaware Basin 1Q18 Activity
Multi-well pad development across multiple zones
Reeves
NBL Acreage
CGFs Online
2Q18 CGF
Calamity Jane 7-well Pad
2 3rd Bone Spring, avg. IP-90 ~2,000 Boe/d
3 Wolfcamp A Upper, avg. IP-90 ~1,620 Boe/d
2 Wolfcamp A Lower, avg. IP-90 ~730 Boe/d
Online late 4Q17, 7,000 ft avg. lateral length, 70% oil
1Q18 Multi-Well Pads
6 wells in North and 7 wells in South
5 Wolfcamp A Upper, 6 Wolfcamp A Lower, 1 3rd Bone
Spring and 1 Wolfcamp C
8,440 ft total avg. laterals
Extended Calamity Jane Results Exhibiting Flatter Declines
• Wolfcamp A Upper and 3rd Bone Spring continue to outperform expectations
. . . . . . . . . . . . . . . . . . . . . . . . . . . . . . . . . . . . . . . . . . . . . . . . . . . . . . . . . . . . . . . . . . . . . . . . . . . . . . . . . . . . . . . . . . . . . . . . . . . . . .
Continued Strong Well Results Across Acreage
• 9 of 11 Wolfcamp A wells ranged from 1,000 – 2,400 Boe/d IP-30 with 78%
average oil mix
• Managing flowback (IPs) on longer laterals
• Certain wells drilled to hold acreage
• Continue to be encouraged by initial results from other zones
. . . . . . . . . . . . . . . . . . . . . . . . . . . . . . . . . . . . . . . . . . . . . . . . . . . . . . . . . . . . . . . . . . . . . . . . . . . . . . . . . . . . . . . . . . . . . . . . . . . . . .
Extending Long Lateral and Multi-well Pad Development into Legacy
CWEI Acreage
• Pace of development aligned with infrastructure buildout
• First 3-well pad tied into 3rd NBLX operated CGF, 1st CGF servicing legacy
CWEI acreage
• First 10,000+ ft laterals showing flatter declines
1Q18 pads

www.nblenergy.com NYSE: NBL Delaware Basin Produced Water Management
Increasing operational flexibility and value
9
< [VALUE]
9%
> 30%
0%
10%
20%
30%
40%
50%
2017 Avg. 1Q18 YE18 Target
Substantially Increasing Use of Recycled
Water for Completions
Kingfisher Water Facility
Infrastructure Strategically Designed with Produced Water
Recycling and Disposal Options for Flow Assurance
• NBL recycle facilities and pond storage
• Increasing NBL operated vs. 3rd party SWD capacity
• Reduces footprint and removes truck usage for water hauling
. . . . . . . . . . . . . . . . . . . . . . . . . . . . . . . . . . . . . . . . . . . . . . . . . . . . . . . . . . . . . . . . . . . . . . . . . . . . . . . . . . . . . . . . .
Establishing Water Pipeline Network Across Acreage Position
• Increasing ability to utilize recycled water in completions
. . . . . . . . . . . . . . . . . . . . . . . . . . . . . . . . . . . . . . . . . . . . . . . . . . . . . . . . . . . . . . . . . . . . . . . . . . . . . . . . . . . . . . . . .
Expanding Recycling Efforts in 2018
• Over 1 MMBbl produced water recycled since late 2017
• Initial wells using recycled water performing in-line with
expectations
• Reduces need for disposal and use of fresh water in completions

www.nblenergy.com NYSE: NBL
335,000
Net acres
2,350
Gross locations(3)
9,800 ft
Average lateral Length
1.7 BBoe
Net unrisked resources(3)
10
DJ Basin
Strong execution and cash flow generation
0
25
50
75
100
1Q17 2Q17 3Q17 4Q17 1Q18
MBoe/d
(1) Before tax operating cash flow (not including corporate burden) less capital investments (excluding NBLX capital).
(2) Reflects the historical presentation of sales volumes, pre-implementation of ASC 606 accounting standard. 1Q18 DJ Basin oil mix totaled 52% post ASC 606 implementation.
(3) Locations and resources estimate effective as of beginning of 2018.
CO
Weld
Wells
Ranch
East
Pony
Mustang
NBL Acreage Municipalities
Low GOR: Mid High
Wells Ranch and East Pony Sales Volumes(2)
> 40% growth vs. 1Q17
Solid Operational Execution in 1Q18
• Over $100 MM asset level free cash flow(1)
• Record oil mix of 56%(2)
• Record combined volumes(2) of 88 MBoe/d from Wells
Ranch and East Pony
. . . . . . . . . . . . . . . . . . . . . . . . . . . . . . . . . . . . . . . . . . . . . . . . . . . . . . . . . . . . . . . . . . . . . . . . . . . . . . .
Volumes Return to Growth in 2H18
• 2Q18 volumes expected slightly lower than 1Q18 with
planned third party processing turn-around
• Adding 2nd rig and 3rd frac crew in 2Q18
• Timing Mustang wells online in coordination with
infrastructure expansion
• Developing Wells Ranch to maximize CGF throughput
www.nblenergy.com NYSE: NBL
11
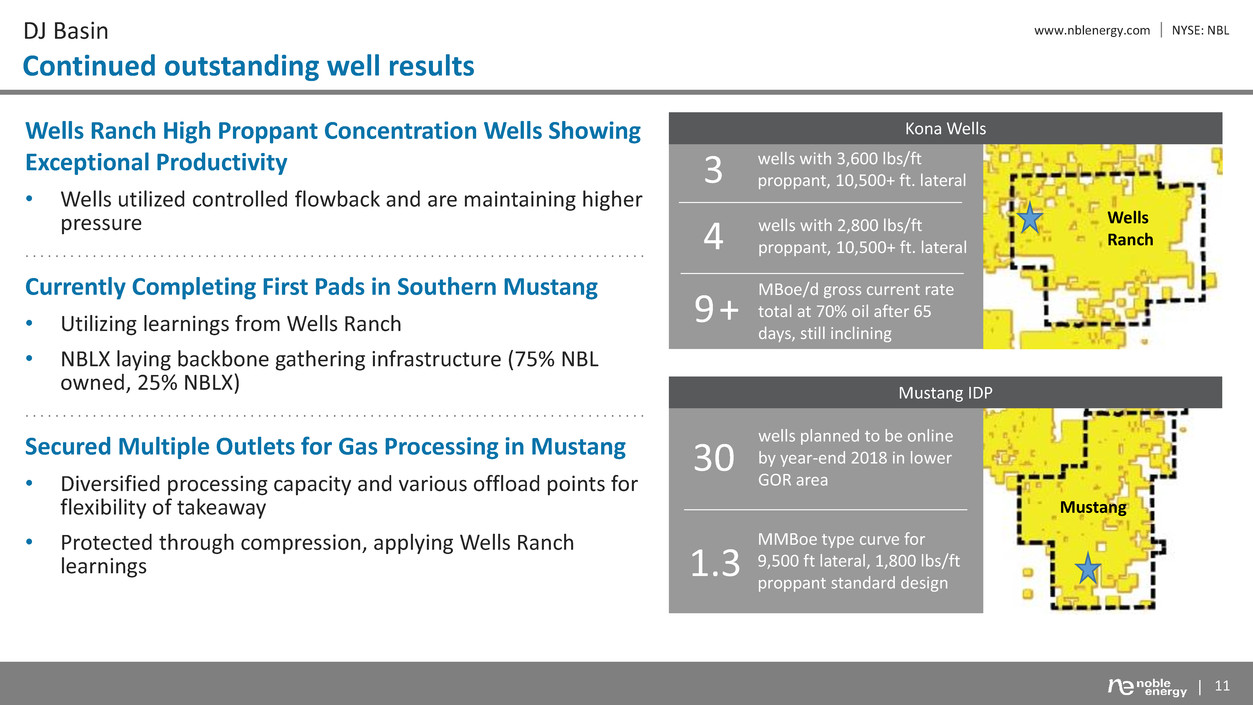
DJ Basin
Continued outstanding well results
Wells
Ranch
Mustang
Kona Wells
3
4
9 +
wells with 3,600 lbs/ft
proppant, 10,500+ ft. lateral
wells with 2,800 lbs/ft
proppant, 10,500+ ft. lateral
MBoe/d gross current rate
total at 70% oil after 65
days, still inclining
30
Mustang IDP
1.3
MMBoe type curve for
9,500 ft lateral, 1,800 lbs/ft
proppant standard design
wells planned to be online
by year-end 2018 in lower
GOR area
Wells Ranch High Proppant Concentration Wells Showing
Exceptional Productivity
• Wells utilized controlled flowback and are maintaining higher
pressure
. . . . . . . . . . . . . . . . . . . . . . . . . . . . . . . . . . . . . . . . . . . . . . . . . . . . . . . . . . . . . . . . . . . . . . . . . . . . . . . . . . .
Currently Completing First Pads in Southern Mustang
• Utilizing learnings from Wells Ranch
• NBLX laying backbone gathering infrastructure (75% NBL
owned, 25% NBLX)
. . . . . . . . . . . . . . . . . . . . . . . . . . . . . . . . . . . . . . . . . . . . . . . . . . . . . . . . . . . . . . . . . . . . . . . . . . . . . . . . . . .
Secured Multiple Outlets for Gas Processing in Mustang
• Diversified processing capacity and various offload points for
flexibility of takeaway
• Protected through compression, applying Wells Ranch
learnings

www.nblenergy.com NYSE: NBL
12
Noble Midstream (NBLX)
Peer-leading distribution growth and growing third-party services
DJ Basin Highlights Delaware Basin Highlights
24%
increase in 1Q18 fresh
water delivery
compared to 4Q17
20%
targeted
annual distribution
growth
2.3x
distribution coverage
with a strong
balance sheet
162
MBoe/d record quarterly oil
and gas volumes gathered
in 1Q
• Delivering CGF Construction to Plan in Support of NBL
Delaware Volume Growth
Coronado (3rd CGF in basin) online in 2Q18
Billy Miner II (4th CGF in basin) online in late April
Collier (5th CGF in basin) expected online by end of
2Q18
• All CGFs Connecting through Advantage System by
Mid-year
• Grew Advantage Pipeline Oil Throughput to 88 MBbl/d;
47% increase from 4Q17
• Expanding Advantage Pipeline Capacity to 200 MBbl/d by
End of 3Q18
• Record Wells Ranch and East Pony Volumes Gathered
• Construction Underway on Mustang IDP Gathering
Infrastructure, Online by Mid-2018
Began fresh water delivery in March
Spec oil, gas and water system expected online by
mid-year
• Closed Acquisition of Saddle Butte and Successfully
Integrated Operations
Planned connection for Mustang volumes
• Planning for Significant 2H18 Activity and Throughput
Ramp

www.nblenergy.com NYSE: NBL
33,000
Net acres
320
Gross locations(1)
6,400 ft
Average lateral Length
400 MMBoe
Net unrisked resources(1)
13
Eagle Ford
Maximizing cash flows
Eagle Ford Net Production
Volumes Trending as Expected
0
25
50
75
100
1Q17 2Q17 3Q17 4Q17 1Q18
MBoe/d
TX
Dimmit
Gates
Ranch
NBL Acreage
Webb
(1) Locations and resources estimate effective as of beginning of 2018.
Cash Flow Generation from Significant 2017 Volume
Ramp
• 1Q18 sales volumes of 81 MBoe/d, up nearly 2x vs. 1Q17
• ~3 MBoe/d facility down-time impacts to 1Q18
. . . . . . . . . . . . . . . . . . . . . . . . . . . . . . . . . . . . . . . . . . . . . . . . . . . . . . . . . . . . . . . . . . . . . . . . . . . .
2018 Wells Online in North Gates Ranch
• 5-well pad co-development of Upper and Lower Eagle
Ford wells online in 2Q18
• 4-well pad targeting Lower Eagle Ford expected online in
2Q18
. . . . . . . . . . . . . . . . . . . . . . . . . . . . . . . . . . . . . . . . . . . . . . . . . . . . . . . . . . . . . . . . . . . . . . . . . . . .
Strong Safety Performance
• 185 days no lost time or recordable incidents
www.nblenergy.com NYSE: NBL
14
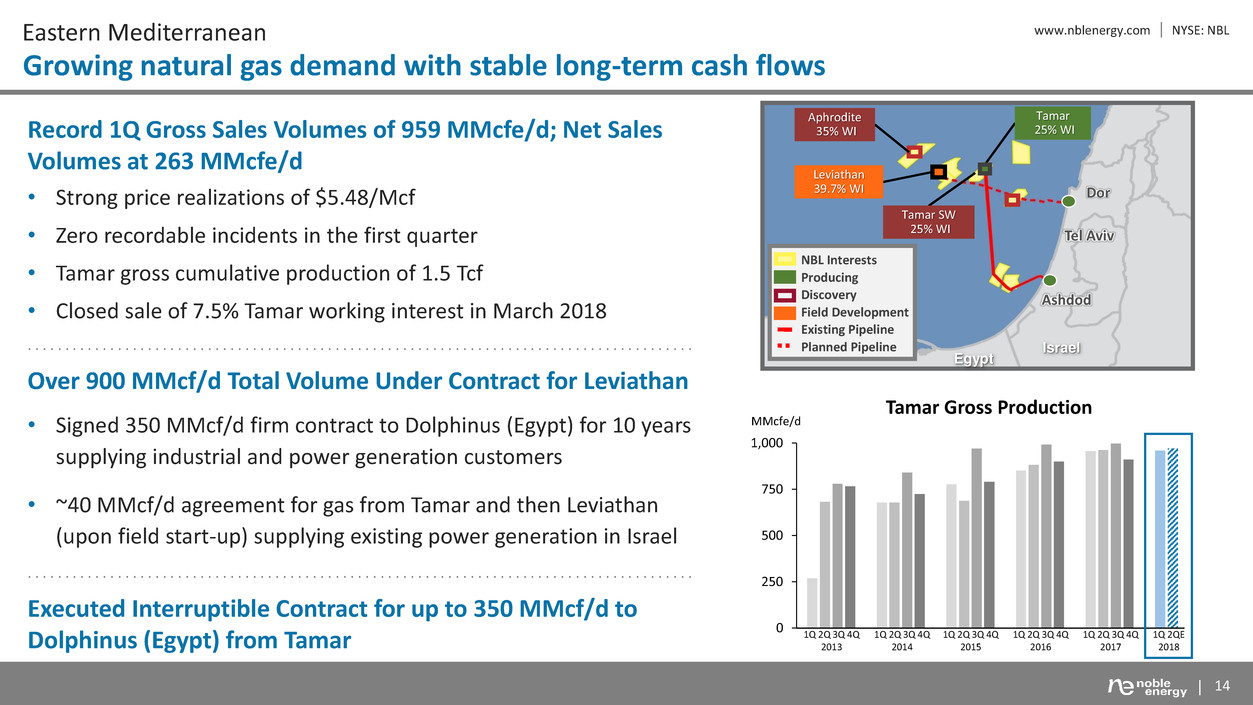
Eastern Mediterranean
Growing natural gas demand with stable long-term cash flows
Tamar
25% WI
Tamar SW
25% WI Tel Aviv
Ashdod
Israel
Egypt
Aphrodite
35% WI
Leviathan
39.7% WI Dor
Discovery
Existing Pipeline
Planned Pipeline
Field Development
NBL Interests
Producing
0
250
500
750
1,000
Tamar Gross Production
MMcfe/d
1Q 2Q 3Q 4Q
2014
1Q 2Q 3Q 4Q
2015
1Q 2Q 3Q 4Q
2016
1Q 2Q 3Q 4Q
2017
1Q 2QE
2018
1Q 2Q 3Q 4Q
2013
Record 1Q Gross Sales Volumes of 959 MMcfe/d; Net Sales
Volumes at 263 MMcfe/d
• Strong price realizations of $5.48/Mcf
• Zero recordable incidents in the first quarter
• Tamar gross cumulative production of 1.5 Tcf
• Closed sale of 7.5% Tamar working interest in March 2018
. . . . . . . . . . . . . . . . . . . . . . . . . . . . . . . . . . . . . . . . . . . . . . . . . . . . . . . . . . . . . . . . . . . . . . . . . . . . . . . . . . . . . . . . .
Over 900 MMcf/d Total Volume Under Contract for Leviathan
• Signed 350 MMcf/d firm contract to Dolphinus (Egypt) for 10 years
supplying industrial and power generation customers
• ~40 MMcf/d agreement for gas from Tamar and then Leviathan
(upon field start-up) supplying existing power generation in Israel
. . . . . . . . . . . . . . . . . . . . . . . . . . . . . . . . . . . . . . . . . . . . . . . . . . . . . . . . . . . . . . . . . . . . . . . . . . . . . . . . . . . . . . . . .
Executed Interruptible Contract for up to 350 MMcf/d to
Dolphinus (Egypt) from Tamar
www.nblenergy.com NYSE: NBL
15
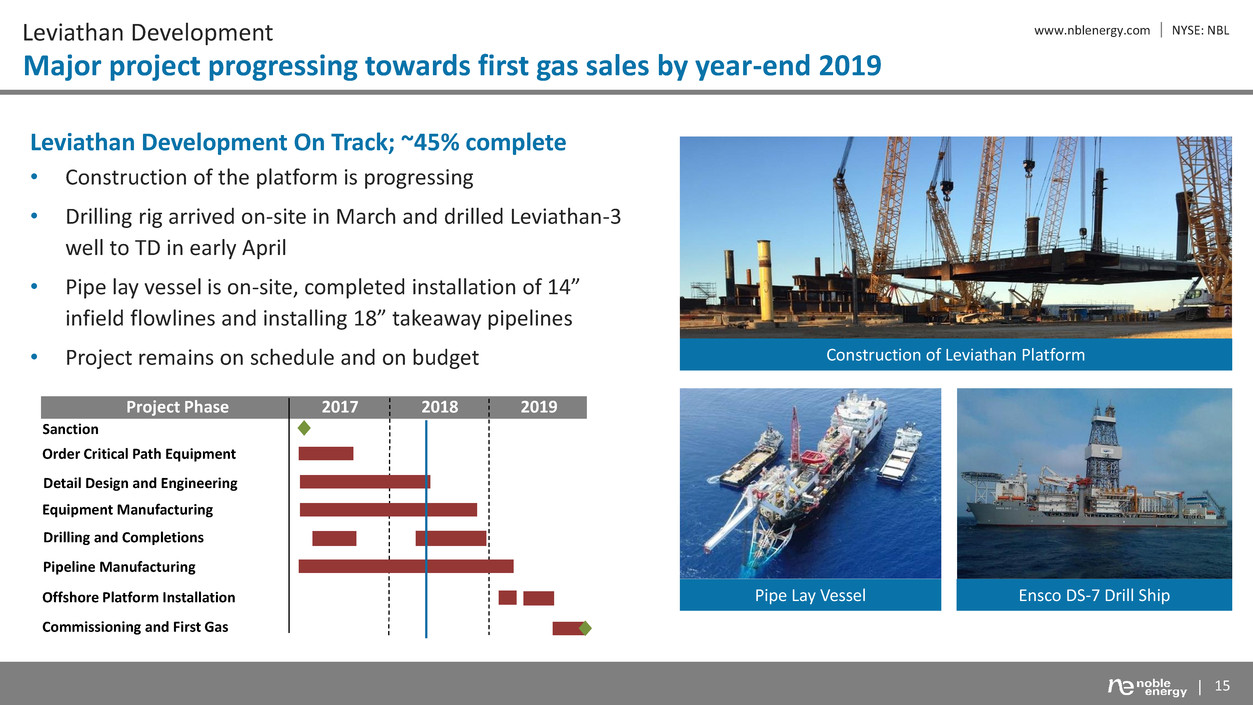
Leviathan Development
Major project progressing towards first gas sales by year-end 2019
Leviathan Development On Track; ~45% complete
• Construction of the platform is progressing
• Drilling rig arrived on-site in March and drilled Leviathan-3
well to TD in early April
• Pipe lay vessel is on-site, completed installation of 14”
infield flowlines and installing 18” takeaway pipelines
• Project remains on schedule and on budget Construction of Leviathan Platform
Project Phase 2017 2018 2019
Sanction
Order Critical Path Equipment
Detail Design and Engineering
Pipeline Manufacturing
Equipment Manufacturing
Commissioning and First Gas
Drilling and Completions
Offshore Platform Installation Pipe Lay Vessel Ensco DS-7 Drill Ship

www.nblenergy.com NYSE: NBL Other Global Offshore
Continued exceptional operational and safety performance
Reliable Performance at West Africa
• West Africa sales volumes of 56 MBoe/d (30% oil)
• Exceeded 2 years at Aseng and almost 4 years at Alen without a
recordable safety incident
• Strong West Africa volumes in 2Q expected from multiple liftings,
anticipated to be underlifted in 3Q
. . . . . . . . . . . . . . . . . . . . . . . . . . . . . . . . . . . . . . . . . . . . . . . . . . . . . . . . . . . . . . . . . . . . . . . . . . . . . . . . . . . . . . . . . . . . . .
Progressing Negotiations with all Stakeholders to Monetize
Significant Discovered Gas in EG and Cameroon
. . . . . . . . . . . . . . . . . . . . . . . . . . . . . . . . . . . . . . . . . . . . . . . . . . . . . . . . . . . . . . . . . . . . . . . . . . . . . . . . . . . . . . . . . . . . . .
Closed Sale of Gulf of Mexico Business on April 12th
• Earlier than anticipated closing due to Fieldwood’s successful
restructuring
• Volumes included in 2Q guidance through closing date
16
Equatorial
Guinea
Cameroon
Aseng
40% WI
Methanol Plant 45% WI
LPG Plant 28% WI
Bioko
Island
Alen
45% WI
Alba Field
33% WI
Producing
NBL Interests
Yoyo
Yolanda
Discoveries
Alen Platform, West Africa

www.nblenergy.com NYSE: NBL
17
Appendix
www.nblenergy.com NYSE: NBL
18
Forward-Looking Statements and Other Matters
This presentation contains certain "forward-looking statements" within the meaning of federal securities laws. Words such as "anticipates", "believes“, "expects", "intends", "will", "should",
"may", and similar expressions may be used to identify forward-looking statements. Forward-looking statements are not statements of historical fact and reflect Noble Energy's current views
about future events. Such forward-looking statements may include, but are not limited to, future financial and operating results, and other statements that are not historical facts, including
estimates of oil and natural gas reserves and resources, estimates of future production, assumptions regarding future oil and natural gas pricing, planned drilling activity, future results of
operations, projected cash flow and liquidity, business strategy and other plans and objectives for future operations. No assurances can be given that the forward-looking statements
contained in this presentation will occur as projected and actual results may differ materially from those projected. Forward-looking statements are based on current expectations, estimates
and assumptions that involve a number of risks and uncertainties that could cause actual results to differ materially from those projected. These risks and uncertainties include, without
limitation, the volatility in commodity prices for crude oil and natural gas, the presence or recoverability of estimated reserves, the ability to replace reserves, environmental risks, drilling and
operating risks, exploration and development risks, competition, government regulation or other actions, the ability of management to execute its plans to meet its goals and other risks
inherent in Noble Energy's businesses that are discussed in Noble Energy's most recent annual reports on Form 10-K, respectively, and in other Noble Energy reports on file with the
Securities and Exchange Commission (the "SEC"). These reports are also available from the sources described above. Forward-looking statements are based on the estimates and opinions of
management at the time the statements are made. Noble Energy does not assume any obligation to update any forward-looking statements should circumstances or management’s
estimates or opinions change.
The SEC requires oil and gas companies, in their filings with the SEC, to disclose proved reserves that a company has demonstrated by actual production or conclusive formation tests to be
economically and legally producible under existing economic and operating conditions. The SEC permits the optional disclosure of probable and possible reserves, however, we have not
disclosed our probable and possible reserves in our filings with the SEC. We may use certain terms in this presentation, such as “net unrisked resources”, which by their nature are more
speculative than estimates of proved, probable and possible reserves and accordingly are subject to substantially greater risk of being actually realized. The SEC guidelines strictly prohibit us
from including these estimates in filings with the SEC. Investors are urged to consider closely the disclosures and risk factors in our most recent Form 10-K and in other reports on file with the
SEC, available from Noble Energy’s offices or website, http://www.nblenergy.com.
This presentation also contains certain non-GAAP measures of financial performance that management believes are good tools for internal use and the investment community in evaluating
Noble Energy’s overall financial performance. These non-GAAP measures are broadly used to value and compare companies in the crude oil and natural gas industry. Please see the attached
schedules for reconciliations of the differences between any historical non-GAAP measures used in this presentation and the most directly comparable GAAP financial measures.

www.nblenergy.com NYSE: NBL
19
Second Quarter 2018 Guidance
Capital & Cost Metrics
Capital Expenditures(2) ($MM)
Total Company Organic Capital $750 - $850
Cost Metrics LOW HIGH
Lease Operating Expense ($/BOE) 3.70 4.00
Gathering, Transportation & Processing ($/BOE) 3.30 3.60
Production Taxes (% Oil, Gas, NGL Revenues) 4.5 4.9
Marketing ($MM) 8 12
DD&A ($/BOE) 14.00 14.75
Exploration ($MM) 30 50
G&A ($MM) 100 110
Interest, net ($MM) 70 80
Other Guidance Items ($MM)
Equity Investment Income 35 50
Midstream Services Revenue – Third Party 10 20
Non-Controlling Interest – NBLX Public Unitholders 10 20
2Q 2018 Sales Volume
Crude Oil and
Condensate (MBbl/d)
Natural Gas Liquids
(MBbl/d)
Natural Gas
(MMcf/d)
Total Equivalent
(MBoe/d)
Low High Low High Low High Low High
United States Onshore 103 108 60 64 460 485 240 250
United States Gulf of Mexico(1) 4 4 - - 4 4 4 5
Israel - - - - 200 220 33 37
Equatorial Guinea 15 19 - - 205 225 51 56
Equatorial Guinea - Equity method investment 1 2 5 6 - - 6 7
Total Company 124 132 65 70 885 910 340 350
(1) U.S. Gulf of Mexico volumes are included in sales guidance through closing April 12, 2018.
(2) Includes only NBL-funded portion of midstream capital expenditures.

www.nblenergy.com NYSE: NBL
20
Full-Year 2018 Guidance
Capital & Cost Metrics
Capital Expenditures(2) ($MM)
Total Company Organic Capital $2,700 - $2,900
Cost Metrics LOW HIGH
Lease Operating Expense ($/BOE) 3.80 4.20
Gathering, Transportation & Processing ($/BOE) 3.15 3.50
Production Taxes (% Oil, Gas, NGL Revenues) 4.7 5.1
Marketing ($MM) 35 50
DD&A ($/BOE) 14.50 15.25
Exploration ($MM) 125 150
G&A ($MM) 400 430
Interest, net ($MM) 260 300
Other Guidance Items ($MM)
Equity Investment Income 160 200
Midstream Services Revenue – Third Party 60 80
Non-Controlling Interest – NBLX Public Unitholders 80 105
Full-Year 2018 Sales Volume
Crude Oil and
Condensate (MBbl/d)
Natural Gas Liquids
(MBbl/d)
Natural Gas
(MMcf/d)
Total Equivalent
(MBoe/d)
Low High Low High Low High Low High
United States Onshore 111 117 61 66 460 490 252 262
United States Gulf of Mexico(1) 5 6 - 1 6 7 6 7
Israel(1) - - - - 215 240 36 40
Equatorial Guinea 13 17 - - 185 210 45 50
Equatorial Guinea - Equity method investment 1 2 5 5 - - 6 7
Total Company 133 139 68 72 895 920 350 360
(1) U.S. Gulf of Mexico volumes are included in sales guidance through closing April 12, 2018. Israel sales volumes reflect divestment of 7.5% interest in Tamar on March 11, 2018.
(2) Includes only NBL-funded portion of midstream capital expenditures.
Investor Relations Contacts
Brad Whitmarsh Megan Dolezal Lauren Brown
281.943.1670 281.943.1861 281.872.3208
brad.whitmarsh@nblenergy.com megan.dolezal@nblenergy.com lauren.brown@nblenergy.com
Visit us on the Investor Relations Homepage at www.nblenergy.com
