Attached files
| file | filename |
|---|---|
| 8-K - FORM 8-K - JUNIPER NETWORKS INC | d581036d8k.htm |
| EX-99.1 - EXHIBIT 99.1 - JUNIPER NETWORKS INC | d581036dex991.htm |
Exhibit 99.2

Juniper Networks, Inc.
1133 Innovation Way
Sunnyvale, CA 94089
May 1, 2018
CFO Commentary on First Quarter Preliminary Financial Results
Related Information
The following commentary is provided by management and should be referenced in conjunction with Juniper Networks’ first quarter 2018 preliminary financial results press release available on its Investor Relations website at http://investor.juniper.net. These remarks represent management’s current views of the Company’s financial and operational performance and outlook and are provided to give investors and analysts further insight into the Company’s performance in advance of the earnings call webcast.
In the first quarter of 2018, we revised the naming convention of our key customer verticals as follows:
| • | Telecom / Cable will now be referred to as ‘Service Provider’ |
| • | Strategic Enterprise will now be referred to as ‘Enterprise’ |
| • | Cloud will remain unchanged |
The customers included in each of these verticals remain unchanged.
Q1 2018 Preliminary Financial Results
GAAP
| (in millions, except per share amounts and percentages) | Q1’18 | Q4’17 | Q1’17 | Q/Q Change |
Y/Y Change | |||||||||||||||
| Revenue |
$ | 1,082.6 | $ | 1,239.5 | $ | 1,221.0 | (13) | % | (11) | % | ||||||||||
| Product |
710.8 | 830.4 | 828.9 | (14) | % | (14) | % | |||||||||||||
| Service |
371.8 | 409.1 | 392.1 | (9) | % | (5) | % | |||||||||||||
| Gross margin % |
57.1 | % | 60.6 | % | 61.1 | % | (3.5) | pts | (4.0) | pts | ||||||||||
| Research and development |
269.4 | 227.9 | 276.2 | 18 | % | (2) | % | |||||||||||||
| Sales and marketing |
239.4 | 233.6 | 244.2 | 2 | % | (2) | % | |||||||||||||
| General and administrative |
56.0 | 50.8 | 50.5 | 10 | % | 11 | % | |||||||||||||
| Restructuring (benefits) charges |
(1.9) | 36.2 | 19.4 | N/M | N/M | |||||||||||||||
|
|
|
|
|
|
|
|||||||||||||||
| Total operating expenses |
$ | 562.9 | $ | 548.5 | $ | 590.3 | 3 | % | (5) | % | ||||||||||
|
|
|
|
|
|
|
|||||||||||||||
| Operating margin % |
5.1 | % | 16.4 | % | 12.8 | % | (11.3) | pts | (7.7 | )pts | ||||||||||
|
|
|
|
|
|
|
|||||||||||||||
| Net income (loss) |
$ | 34.4 | $ | (148.1) | $ | 108.8 | N/M | (68) | % | |||||||||||
|
|
|
|
|
|
|
|||||||||||||||
| Diluted net income (loss) per share |
$ | 0.10 | $ | (0.40) | $ | 0.28 | N/M | (64) | % | |||||||||||
|
|
|
|
|
|
|
|||||||||||||||
N/M—Not meaningful
Non-GAAP
| (in millions, except per share amounts and percentages) | Q2’18 Guidance | Q1’18 | Q4’17 | Q1’17 | Q/Q Change |
Y/Y Change | ||||||||||||||||||
| Revenue(1) |
$ | 1,175 +/- $30 | $ | 1,082.6 | $ | 1,239.5 | $ | 1,221.0 | (13 | )% | (11 | )% | ||||||||||||
| Product(1) |
710.8 | 830.4 | 828.9 | (14 | )% | (14 | )% | |||||||||||||||||
| Service(1) |
371.8 | 409.1 | 392.1 | (9 | )% | (5 | )% | |||||||||||||||||
| Gross margin % |
59.0% +/- 1 | % | 58.2 | % | 61.3 | % | 62.5 | % | (3.1 | )pts | (4.3 | )pts | ||||||||||||
| Research and development |
222.9 | 208.6 | 239.6 | 7 | % | (7 | )% | |||||||||||||||||
| Sales and marketing |
223.9 | 222.3 | 226.5 | 1 | % | (1 | )% | |||||||||||||||||
| General and administrative |
49.8 | 48.1 | 43.0 | 4 | % | 16 | % | |||||||||||||||||
|
|
|
|
|
|
|
|||||||||||||||||||
| Total operating expenses |
$ | 490 +/- $5 | $ | 496.6 | $ | 479.0 | $ | 509.1 | 4 | % | (2 | )% | ||||||||||||
|
|
|
|
|
|
|
|||||||||||||||||||
| Operating margin % |
|
~ 17.5% at the midpoint |
|
12.3 | % | 22.7 | % | 20.8 | % | (10.4 | )pts | (8.5 | )pts | |||||||||||
|
|
|
|
|
|
|
|||||||||||||||||||
| Net income |
$ | 99.5 | $ | 199.4 | $ | 178.0 | (50 | )% | (44 | )% | ||||||||||||||
|
|
|
|
|
|
|
|||||||||||||||||||
| Diluted net income per share |
$ | 0.44 +/- $0.03 | $ | 0.28 | $ | 0.53 | $ | 0.46 | (47 | )% | (39 | )% | ||||||||||||
|
|
|
|
|
|
|
|||||||||||||||||||
| (1) | Revenue numbers are GAAP and Q1’18 actual and Q2’18 guidance are provided under revenue recognition requirements under ASC 606. |
Overview of the Accounting Impact for the Adoption of ASC 606
The Company adopted the new revenue accounting standard (ASC 606) on January 1, 2018, using the modified retrospective approach. The adoption primarily impacted the following areas:
| 1) | Allocation of revenue between product and services |
| 2) | Recognition of revenue from sales to distributors upon delivery of the product to the distributor rather than delivery of the product to the end customer |
| 3) | Estimating variable consideration of revenue for certain contractual clauses that previously precluded revenue recognition |
| 4) | Recognition of revenue from certain software licenses, which were previously deferred and recognized over time, are now recognized at the time of delivery |
For the three months ended March 31, 2018, the accounting impact of the adoption was an increase in revenue recognition by approximately $2 million and operating expense of approximately $1 million. Product revenue was approximately $29 million higher, primarily due to the impact of allocation of revenue between products and services, and variable consideration; partially offset by timing of recognition of revenue from sales to distributors. Product revenue increase from ASC 606 was primarily allocated between Routing and Switching. Service revenue was approximately $27 million lower, primarily due to the impact of allocation of revenue between products and services. Operating expense increased by approximately $1 million due to the timing of commissions. On a go forward basis, we don’t expect a material difference in total annual revenue; however, we believe the adoption of ASC 606 will impact the allocation of revenue between product and service.
GAAP Q1’18 606 vs. 605
| (in millions, except per share amounts and percentages) | 606 | 605 | Delta | |||||||||
| Revenue |
$ | 1,082.6 | $ | 1,080.7 | — | % | ||||||
| Product |
710.8 | 682.1 | 4 | % | ||||||||
| Service |
371.8 | 398.6 | (7 | )% | ||||||||
| Gross margin % |
57.1 | % | 57.1 | % | — | pts | ||||||
|
|
|
|
|
|||||||||
| Total operating expenses |
$ | 562.9 | $ | 562.0 | — | % | ||||||
|
|
|
|
|
|||||||||
| Operating margin % |
5.1 | % | 5.1 | % | — | pts | ||||||
|
|
|
|
|
|||||||||
| Net income |
$ | 34.4 | $ | 35.3 | (3 | )% | ||||||
|
|
|
|
|
|||||||||
| Diluted net income per share |
$ | 0.10 | $ | 0.10 | — | % | ||||||
|
|
|
|
|
|||||||||
Non-GAAP Q1’18 606 vs. 605
| (in millions, except per share amounts and percentages) | 606 | 605 | Delta | |||||||||
| Revenue |
$ | 1,082.6 | $ | 1,080.7 | — | % | ||||||
| Product |
710.8 | 682.1 | 4 | % | ||||||||
| Service |
371.8 | 398.6 | (7 | )% | ||||||||
| Gross margin % |
58.2 | % | 58.2 | % | — | pts | ||||||
|
|
|
|
|
|||||||||
| Total operating expenses |
$ | 496.6 | $ | 495.6 | — | % | ||||||
|
|
|
|
|
|||||||||
| Operating margin % |
12.3 | % | 12.3 | % | — | pts | ||||||
|
|
|
|
|
|||||||||
| Net income |
$ | 99.5 | $ | 99.6 | — | % | ||||||
|
|
|
|
|
|||||||||
| Diluted net income per share |
$ | 0.28 | $ | 0.28 | — | % | ||||||
|
|
|
|
|
|||||||||
This CFO Commentary contains non-GAAP financial measures, and the reconciliation between GAAP and non-GAAP financial measures can be found at the end of this document. We are unable to provide a reconciliation of forward-looking non-GAAP guidance measures to corresponding GAAP measures without unreasonable effort due to the overall high variability and low visibility of most of the items that are excluded from our non-GAAP guidance measures. More information on these exclusions can be found under “Q2 2018 Outlook” below.
Q1 2018 Overview
We reported first quarter revenue of $1,083 million, non-GAAP gross margin of 58.2% and non-GAAP earnings per share of $0.28, above the mid-point of our guidance, which was provided under ASC 605. The change to ASC 606 did not materially impact the overall Q1’18 financial results. The discussion of Q1’18 results below reflects the adoption of ASC 606.
As we expected, the architectural shifts in the Cloud vertical continued; however, Cloud revenues were up slightly sequentially and ahead of our expectations. The Service Provider vertical was challenged due to the timing of customer deployments, resulting in decreases both year-over-year and sequentially. Enterprise increased 4% year-over-year due to strength from all technologies. Routing and Switching both declined year-over-year; however, we continue to see positive momentum in Security where we saw a second consecutive quarter of year-over-year growth.
In reviewing our top 10 customers for the quarter, four were Cloud, four were Service Provider, and two were Enterprise. Of these customers, four were located outside of the U.S.
Product deferred revenue was $159 million, down $123 million and 44% year-over-year and down $175 million or 52% sequentially, primarily driven by the adoption of ASC 606. Without the impact of ASC 606, deferred product revenue would have been up approximately 19% year-over-year and flat sequentially.
Non-GAAP operating expense declined 2% year-over-year, but increased 4% sequentially, reflecting the annual reset of variable compensation. The sequential increase reflects the annual reset of variable compensation as well as targeted investments in R&D and sales and marketing designed to strengthen products and market opportunities that we believe will drive differentiation and create future shareholder value.
Cash flow from operations was $271 million for the quarter. During the quarter, we initiated a $750 million accelerated share repurchase program (ASR) and paid $62 million in dividends, reflecting a quarterly dividend of $0.18 per share. The total cash, cash equivalents, and investments ending Q1’18 was $3.4 billion, and we repatriated $2.5 billion during the quarter.
Revenue
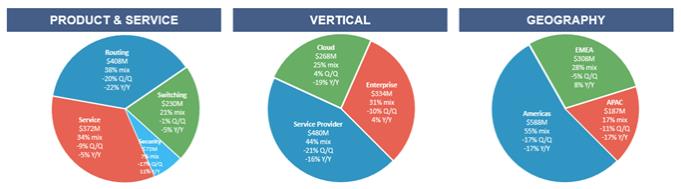
Product & Service
| • | Routing product revenue: $408 million, down 22% year-over-year and down 20% sequentially. The year-over-year decrease was primarily due to Service Provider and Cloud. The sequential decrease was primarily driven by Service Provider. The MX product family declined year-over-year and sequentially. The PTX product family grew year-over-year and declined sequentially. |
| • | Switching product revenue: $230 million, down 5% year-over-year and down 1% sequentially. The year-over-year decrease was driven by Cloud, partially offset by the impact of the adoption of ASC 606 and Enterprise. Sequentially, the decrease was driven by all verticals partially offset by the impact of the adoption of ASC 606. |
| • | Security product revenue: $73 million, up 11% year-over-year and down 17% sequentially. Year-over-year, the increase was driven by all verticals. The sequential decrease was driven by Enterprise and Service Provider. |
| • | Service revenue: $372 million, down 5% year-over-year and down 9% sequentially. Year-over-year, the decrease was driven by the impact of the adoption of ASC 606. Excluding the impact of the adoption of ASC 606, our service net revenues increased 2% year-over-year primarily driven by strong renewal and attach rates of support contracts. Sequentially, the decrease was primarily driven by the impact of the adoption of ASC 606. |
Vertical
Cloud: $268 million, down 19% year-over-year and up 4% sequentially. Year-over-year, the decrease was primarily due to Switching and Routing, partially offset by Services. The sequential increase was primarily due to Routing, partially offset by Switching.
| • | Service Provider: $480 million, down 16% year-over-year and down 21% sequentially. Year-over-year, the decrease was primarily due to Routing, partially offset by the impact of the adoption of ASC 606. Sequentially, the decrease was driven by Routing, partially offset by the impact of the adoption of ASC 606. |
| • | Enterprise: $334 million, up 4% year-over-year and down 10% sequentially. Year-over-year, the increase was driven by all technologies and services, partially offset by the impact of the adoption of ASC 606. Sequentially, the decrease reflects typical seasonality across all technologies as well as the impact of the adoption of ASC 606. |
Geography
| • | Americas: $588 million, down 17% year-over-year and down 17% sequentially. Year-over-year, the decrease was due to Service Provider and Cloud, partially offset by Enterprise. Sequentially, the decrease was due to all verticals. |
| • | EMEA: $308 million, up 8% year-over-year and down 5% sequentially. Year-over-year, the increase was primarily due to the impact of the adoption of ASC 606 and Enterprise, partially offset by Service Provider. Sequentially, the decrease was driven by Service Provider, partially offset by the impact of the adoption of ASC 606 and Cloud. |
| • | APAC: $187 million, down 17% year-over-year and down 11% sequentially. Year-over-year, the decrease was driven by Service Provider. The sequential decrease was primarily driven by Service Provider and Enterprise. |
Gross Margin
| • | GAAP gross margin: 57.1%, compared to 61.1% from the prior year and 60.6% from last quarter. |
| • | Non-GAAP gross margin: 58.2%, compared to 62.5% from the prior year and 61.3% from last quarter. |
| • | GAAP product gross margin: 56.9%, down 3.3 points from the prior year and down 2.8 points from last quarter. |
| • | Non-GAAP product gross margin: 57.7%, down 3.8 points from the prior year and down 2.6 points from last quarter. |
Year-over-year, the decrease in product gross margin, on a GAAP and non-GAAP basis, was primarily due to lower revenue, customer and product mix and higher costs of certain memory components, partially offset by the adoption of ASC 606 and improvements in our cost structure.
The sequential decrease, on a GAAP and non-GAAP basis, was primarily driven by lower revenue, customer and product mix partially offset by the adoption of ASC 606.
| • | GAAP service gross margin: 57.6%, down 5.6 points from the prior year and down 4.8 points from last quarter. |
| • | Non-GAAP service gross margin: 59.1%, down 5.4 points from the prior year and down 4.3 points from last quarter. |
Year-over-year and sequentially, the decrease in service gross margin, on a GAAP and non-GAAP basis, was primarily due to lower revenue as a result of the adoption of ASC 606 and higher delivery costs.
Operating Expenses
| • | GAAP operating expenses: $563 million, a decrease of $27 million, or 5% year-over-year, and an increase of $14 million, or 3% sequentially. |
The year-over-year decrease in operating expenses was primarily due to lower restructuring costs and lower headcount. The sequential increase was primarily due to stock based compensation, higher variable compensation and the seasonal increase in fringe costs partially offset by lower restructuring charges.
GAAP operating expenses were 52.0% of revenue, up 3.7 points year-over-year and up 7.7 points quarter-over-quarter.
| • | Non-GAAP operating expenses: $497 million, a decrease of $13 million, or 2% year-over-year, and an increase of $18 million or 4% sequentially. |
The year-over-year decrease in operating expenses was primarily due to lower headcount related costs.
The sequential increase reflects the annual reset of variable compensation, the seasonal increase in fringe costs as well as targeted investments in R&D and sales and marketing designed to strengthen products and market opportunities that we believe will drive differentiation and create future shareholder value.
Non-GAAP operating expenses were 45.9% of revenue, up 4.2 points year-over-year and up 7.3 points quarter-over-quarter, primarily due to lower revenue.
Operating Margin
| • | GAAP operating margin: 5.1%, a decrease of 7.7 points year-over-year and 11.3 points sequentially. |
| • | Non-GAAP operating margin: 12.3%, a decrease of 8.5 points year-over-year and 10.4 points sequentially. |
Tax Rate
| • | GAAP tax rate: 16.9%, a decrease compared to 174.0% last quarter and 22.6% in Q1’17. |
The year-over-year and sequential decrease in the effective tax rate, on a GAAP basis, was primarily due to a lower tax rate as a result of the US Tax Cuts and Jobs Act (the “Tax Act”) enacted in Q4’17, partially offset by an unfavorable change in the forecasted geographic mix of earnings.
| • | Non-GAAP tax rate: 16.7%, a decrease compared to 26.3% last quarter and 25.2% in Q1’17. |
The year-over-year decrease in the effective tax rate was primarily due to the lower tax rate as a result of the Tax Act enacted in Q4’17, partially offset by an unfavorable change in the forecasted geographic mix of earnings.
The sequential decrease in the effective tax rate was primarily due to a lower tax rate as a result of the Tax Act enacted in Q4’17, and a reduction of income tax reserves, partially offset by an unfavorable change in the forecasted geographic mix of earnings.
Diluted Earnings Per Share
| • | GAAP diluted earnings per share: $0.10, a decrease of $0.18 year-over-year and an increase of $0.50 sequentially. |
The year-over-year decrease was due to lower revenue and lower gross margin, partially offset by lower operating expenses. The sequential increase was primarily due to a lower tax rate as a result of the Tax Act, partially offset by lower revenue and gross margin.
| • | Non-GAAP diluted earnings per share: $0.28, a decrease of $0.18 year-over-year and a decrease of $0.25 sequentially. |
The year-over-year and sequential decreases were primarily due to lower revenue and lower gross margin.
Balance Sheet, Cash Flow, Capital Return, and Other Financial Metrics
| (in millions, except days sales outstanding (“DSO”), and headcount) |
Q1’18 | Q4’17 | Q3’17 | Q2’17 | Q1’17 | |||||||||||||||
| Cash(1, 2) |
$ | 3,448.4 | $ | 4,021.0 | $ | 4,199.3 | $ | 4,214.6 | $ | 4,043.7 | ||||||||||
| Debt |
2,137.0 | 2,136.3 | 2,135.7 | 2,135.0 | 2,134.4 | |||||||||||||||
| Net cash and investments(3) |
1,311.4 | 1,884.7 | 2,063.6 | 2,079.6 | 1,909.3 | |||||||||||||||
| Operating cash flow(4) |
271.1 | 211.6 | 201.3 | 298.8 | 546.6 | |||||||||||||||
| Capital expenditures |
42.2 | 53.6 | 33.3 | 32.2 | 32.1 | |||||||||||||||
| Depreciation and amortization |
55.0 | 55.0 | 56.3 | 54.8 | 54.2 | |||||||||||||||
| Share repurchases(7) |
750.0 | 329.7 | 140.0 | 125.0 | 125.0 | |||||||||||||||
| Dividends |
$ | 62.1 | $ | 36.9 | $ | 37.7 | $ | 37.8 | $ | 38.0 | ||||||||||
| Diluted shares(5) |
360.6 | 371.5 | 382.7 | 385.6 | 388.0 | |||||||||||||||
| DSO |
57 | 62 | 52 | 52 | 49 | |||||||||||||||
| Headcount(6) |
9,363 | 9,381 | 9,694 | 9,661 | 9,694 | |||||||||||||||
| (1) | Includes cash, cash equivalents, and investments. |
| (2) | 65% held onshore as of the end of Q1’18. |
| (3) | Net cash and investments includes, cash, cash equivalents, and investments, net of debt. |
| (4) | In Q1’18, we adopted the new accounting pronouncement requiring classification of restricted cash to be included with cash and cash equivalents when reconciling the beginning of period and end of period total amounts on the statement of cash flows. We applied this on a retrospective basis. |
| (5) | Non-GAAP diluted shares for Q4’17 was 376.6. |
| (6) | Q1’17 and Q2’17 excludes headcount impacted by restructuring activities. |
| (7) | For Q1’18, $750 million represents the full amount of the ASR. 23.3 million shares were received initially for an aggregate price of $600 million. The ASR has not concluded. |
Cash Flow
| • | Cash flow from operations: $271 million, down $276 million year-over-year and up $60 million sequentially. The year-over-year decrease was due to historically high Q1’17 cash collections from service renewals. The sequential increase was primarily due to timing differences in working capital related to accounts receivable, partially offset by higher payments related to variable compensation. |
Days Sales Outstanding (DSO)
| • | DSO: 57 days, compared to 62 days, a decrease of 5 days from the prior quarter, due primarily to better linearity and higher collectability of in-quarter invoicing, as well as a decrease in overall invoicing volume. |
Capital Return
| • | In the quarter, we entered into an ASR program to repurchase an aggregate of $750 million in shares. Under the ASR, we made an upfront payment of $750 million and received an initial delivery of 23.3 million shares for an aggregate price of $600 million. The ASR is still underway and is expected to settle no later than August 6, 2018. |
| • | In the quarter, we also paid a dividend of $0.18 per share for a total of $62 million. |
Demand metrics
| • | Total deferred revenue was $1,257 million, down $236 million year-over-year and down $282 million sequentially. |
| • | Product deferred revenue was $159 million, a decrease of $123 million year-over-year and down $175 million quarter-over-quarter. |
The lower product deferred revenue was primarily driven by the adoption of ASC 606. Without the impact of ASC 606, deferred product revenue would have been up approximately 19% year-over-year and flat sequentially. The lower service deferred revenue was primarily driven by the adoption of ASC 606. Without the impact of ASC 606, deferred service revenue would have been up 4% year-over-year and sequentially.
Headcount
| • | Ending headcount was 9,363, a decrease of 331 employees year-over-year and approximately flat sequentially. The year-over-year decrease was primarily related to restructuring in 2017. |
Outlook
These metrics are provided on a non-GAAP basis, except for revenue and share count. Earnings per share is on a fully diluted basis. The outlook assumes that the exchange rate of the U.S. dollar to other currencies will remain relatively stable at current levels.
Our Q2 revenue outlook reflects a return to normal seasonality. While customer spending remains dynamic and difficult to predict, we continue to expect sequential growth through the remainder of the year, with a return to year-over year growth during the December quarter.
We expect gross margins for the quarter to improve sequentially, due to increased volume and improvements in our cost structure. For the remainder of the year, we expect gross margin to improve with volume; however, the pace of this improvement could be impacted by mix as well as other factors.
We continue to undertake specific efforts to address the pressure on our gross margins. These efforts include value engineering, optimizing our supply chain, pricing management and increasing software and solution sales.
We expect annual operating expenses to be approximately flat on a year-over-year basis.
Our guidance for the quarter ending June 30, 2018 is as follows:
| • | Revenues will be approximately $1,175 million, plus or minus $30 million. |
| • | Non-GAAP gross margin will be approximately 59.0%, plus or minus 1%. |
| • | Non-GAAP operating expenses will be approximately $490 million, plus or minus $5 million. |
| • | Non-GAAP operating margin will be approximately 17.5% at the midpoint of revenue guidance. |
| • | Non-GAAP tax rate will be approximately 21%. |
| • | Non-GAAP net income per share will be approximately $0.44, plus or minus $0.03. This assumes a share count of approximately 351 million. |
The guidance above is provided under ASC 606.
Forward-Looking Statements
Statements in this CFO Commentary and related conference call concerning Juniper Networks’ business, economic and market outlook, including pricing pressure and product mix; factors that impact our gross margin; our long-term financial model and strategy; the architectural transition and timing of deployments with large customers; the expected impact of the adoption of ASC 606 on our future financial results; our product portfolio and success of particular products and product families; our expectations around revenue and earnings, including growing revenue on a sequential basis and returning to year-on-year growth by Q4’2018; our expectations around margin growth, including growing margin sequentially, and our ability to realize benefits from our gross margin optimization programs; trends in seasonality; our future financial and operating results, including our financial guidance; our areas of focus and our ability to deliver on growth, operational expense discipline, and shareholder returns; improvements to our cost structure and expense reductions and management; strength of certain of our customer segments; our capital return program, and our overall future prospects are forward looking statements within the meaning of the Private Securities Litigation Reform Act that involve a number of uncertainties and risks. Actual results or events could differ materially from those anticipated in those forward-looking statements as a result of several factors, including: general economic and political conditions globally or regionally; business and economic conditions in the networking industry; changes in overall technology spending by our customers and spending by communication service providers and major customers, including Cloud providers; the network capacity requirements of our customers and, in particular, cloud and telecommunication service providers; contractual terms that may result in the deferral of revenue; increases in and the effect of competition; the timing of orders and their fulfillment; manufacturing and supply chain constraints, changes or disruptions; availability of key product components; ability to establish and maintain relationships with distributors, resellers and other partners; variations in the expected mix of products sold; changes in customer mix; changes in geography mix; customer and industry analyst perceptions of Juniper Networks and its technology, products and future prospects; delays in scheduled product availability; market acceptance of Juniper Networks products and services; rapid technological and market change; adoption of regulations or standards affecting Juniper Networks products, services or the networking industry; the ability to successfully acquire, integrate and manage businesses and technologies; product defects, returns or vulnerabilities; the ability to recruit and retain key personnel; significant effects of tax legislation, including the Tax Act, and judicial or administrative interpretation of tax regulations; currency fluctuations; litigation settlements and resolutions; the potential impact of activities related to the execution of capital return, restructurings and product rationalization; and other factors listed in Juniper Networks’ most recent report on Form 10-K or 10-Q filed with the Securities and Exchange Commission (”SEC”). Note that our estimates as to tax rate and the impact of the Tax Act on our business are based on current tax law, including current interpretations of the Tax Act, and could be materially affected by changing interpretations of and additional legislation and guidance around the Tax Act. All statements made in this CFO Commentary and related conference call are made only as of the date set forth at the beginning of this document. Juniper Networks undertakes no obligation to update the information made in this document or the related conference call in the event facts or circumstances subsequently change after the date of this document.
Use of Non-GAAP Financial Measures
This CFO Commentary contains references to the following non-GAAP financial measures: gross margin; product gross margin; service gross margin; product gross margin as a percentage of product revenue; service gross margin as a percentage of service revenue; gross margin as a percentage of revenue; research and development expense; sales and marketing expense; general and administrative expense; operating expense; operating expense as a percentage of revenue; operating income; operating margin; provision for income tax; income tax rate; net income; and diluted
earnings per share. For important commentary on why Juniper Networks considers non-GAAP information a useful view of the company’s financial results, please see the press release furnished with our Form 8-K filed today with the SEC. With respect to future financial guidance provided on a non-GAAP basis, we have excluded estimates for amortization of intangible assets, share-based compensation expenses, acquisition-related charges, restructuring benefits or charges, impairment charges, litigation settlement benefits or charges and resolution charges, gain or loss on equity investments, retroactive impact of certain tax settlements, non-recurring income tax adjustments, valuation allowance on deferred tax assets, and the income tax effect of non-GAAP exclusions, and do not include the impact of any future acquisitions, divestitures, or joint ventures that may occur in the quarter. These measures are not presented in accordance with, nor are they a substitute for U.S. generally accepted accounting principles or GAAP. In addition, these measures may be different from non-GAAP measures used by other companies, limiting their usefulness for comparison purposes. The non-GAAP financial measures used in this CFO Commentary should not be considered in isolation from measures of financial performance prepared in accordance with GAAP. Investors are cautioned that there are material limitations associated with the use of non-GAAP financial measures as an analytical tool. In particular, many of the adjustments to our GAAP financial measures reflect the exclusion of items that are recurring and will be reflected in our financial results for the foreseeable future.
A reconciliation of non-GAAP guidance measures to corresponding GAAP measures is not available on a forward-looking basis due to the high variability and low visibility with respect to the charges which are excluded from these non-GAAP measures. For example, share-based compensation expense is impacted by the Company’s future hiring needs, and restructuring actions, the type and volume of equity awards necessary for such future hiring, and the price at which the Company’s stock will trade in those future periods. Amortization of intangible assets is significantly impacted by the timing and size of any future acquisitions. The items that are being excluded are difficult to predict and a reconciliation could result in disclosure that would be imprecise or potentially misleading. Material changes to any one of these items could have a significant effect on our guidance and future GAAP results. Certain exclusions, such as amortization of intangible assets and share-based compensation expenses, are generally incurred each quarter, but the amounts have historically and may continue to vary significantly from quarter to quarter.
Juniper Networks, Inc.
Preliminary Supplemental Data
(in millions, except percentages)
(unaudited)
Deferred Revenue
| As of | ||||||||
| March 31, 2018 |
December 31, 2017 |
|||||||
| Deferred product revenue: |
||||||||
| Undelivered product commitments and other product deferrals |
$ | 166.4 | $ | 312.6 | ||||
| Distributor inventory and other sell-through items |
— | 68.1 | ||||||
|
|
|
|
|
|||||
| Deferred gross product revenue |
166.4 | 380.7 | ||||||
| Deferred cost of product revenue |
(7.6 | ) | (46.5 | ) | ||||
|
|
|
|
|
|||||
| Deferred product revenue, net |
158.8 | 334.2 | ||||||
| Deferred service revenue |
1,098.1 | 1,205.1 | ||||||
|
|
|
|
|
|||||
| Total |
$ | 1,256.9 | $ | 1,539.3 | ||||
|
|
|
|
|
|||||
| Reported as: |
||||||||
| Current |
$ | 888.2 | $ | 1,030.3 | ||||
| Long-term |
368.7 | 509.0 | ||||||
|
|
|
|
|
|||||
| Total |
$ | 1,256.9 | $ | 1,539.3 | ||||
|
|
|
|
|
|||||
Vertical Reporting: Revenue Trend
| 2016 | 2017 | Q1’17 | Q2’17 | Q3’17 | Q4’17 | Q1’18 | Q/Q Change | Y/Y Change | ||||||||||||||||||||||||||||||||||||
| Cloud |
$ | 1,322.3 | $ | 1,314.9 | $ | 331.6 | $ | 379.6 | $ | 344.9 | $ | 258.8 | $ | 268.3 | $ | 9.5 | 3.7 | % | $ | (63.3 | ) | (19.1 | )% | |||||||||||||||||||||
| Service Provider |
2,324.7 | 2,315.7 | 568.5 | 562.4 | 576.9 | 607.9 | 479.9 | (128.0 | ) | (21.1 | )% | (88.6 | ) | (15.6 | )% | |||||||||||||||||||||||||||||
| Enterprise |
1,343.1 | 1,396.6 | 320.9 | 366.9 | 336.0 | 372.8 | 334.4 | (38.4 | ) | (10.3 | )% | 13.5 | 4.2 | % | ||||||||||||||||||||||||||||||
|
|
|
|
|
|
|
|
|
|
|
|
|
|
|
|
|
|
|
|
|
|
|
|||||||||||||||||||||||
| Total revenue |
$ | 4,990.1 | $ | 5,027.2 | $ | 1,221.0 | $ | 1,308.9 | $ | 1,257.8 | $ | 1,239.5 | $ | 1,082.6 | $ | (156.9 | ) | (12.7 | )% | $ | (138.4 | ) | (11.3 | )% | ||||||||||||||||||||
|
|
|
|
|
|
|
|
|
|
|
|
|
|
|
|
|
|
|
|
|
|
|
|||||||||||||||||||||||
Juniper Networks, Inc.
Preliminary Reconciliations between GAAP and non-GAAP Financial Measures
(in millions, except percentages and per share amounts)
(unaudited)
| Three Months Ended | ||||||||||||
| March 31, 2018 | December 31, 2017 | March 31, 2017 | ||||||||||
| GAAP gross margin—Product |
$ | 404.4 | $ | 495.9 | $ | 498.7 | ||||||
| GAAP product gross margin % of product revenue |
56.9 | % | 59.7 | % | 60.2 | % | ||||||
| Share-based compensation expense |
1.9 | 0.8 | 0.9 | |||||||||
| Share-based payroll tax expense |
0.2 | — | 0.2 | |||||||||
| Amortization of purchased intangible assets |
3.8 | 3.8 | 3.1 | |||||||||
| Supplier component remediation charges |
— | — | 7.1 | |||||||||
|
|
|
|
|
|
|
|||||||
| Non-GAAP gross margin—Product |
$ | 410.3 | $ | 500.5 | $ | 510.0 | ||||||
|
|
|
|
|
|
|
|||||||
| Non-GAAP product gross margin % of product revenue |
57.7 | % | 60.3 | % | 61.5 | % | ||||||
| GAAP gross margin—Service |
$ | 214.0 | $ | 255.3 | $ | 247.9 | ||||||
| GAAP service gross margin % of service revenue |
57.6 | % | 62.4 | % | 63.2 | % | ||||||
| Share-based compensation expense |
4.8 | 4.0 | 4.3 | |||||||||
| Share-based payroll tax expense |
1.0 | — | 0.7 | |||||||||
|
|
|
|
|
|
|
|||||||
| Non-GAAP gross margin—Service |
$ | 219.8 | $ | 259.3 | $ | 252.9 | ||||||
|
|
|
|
|
|
|
|||||||
| Non-GAAP service gross margin % of service revenue |
59.1 | % | 63.4 | % | 64.5 | % | ||||||
| GAAP gross margin |
$ | 618.4 | $ | 751.2 | $ | 746.6 | ||||||
| GAAP gross margin % of revenue |
57.1 | % | 60.6 | % | 61.1 | % | ||||||
| Share-based compensation expense |
6.7 | 4.8 | 5.2 | |||||||||
| Share-based payroll tax expense |
1.2 | — | 0.9 | |||||||||
| Amortization of purchased intangible assets |
3.8 | 3.8 | 3.1 | |||||||||
| Supplier component remediation charges |
— | — | 7.1 | |||||||||
|
|
|
|
|
|
|
|||||||
| Non-GAAP gross margin |
$ | 630.1 | $ | 759.8 | $ | 762.9 | ||||||
|
|
|
|
|
|
|
|||||||
| Non-GAAP gross margin % of revenue |
58.2 | % | 61.3 | % | 62.5 | % | ||||||
| GAAP research and development expense |
$ | 269.4 | $ | 227.9 | $ | 276.2 | ||||||
| Share-based compensation expense |
(44.1 | ) | (19.2 | ) | (34.8 | ) | ||||||
| Share-based payroll tax expense |
(2.4 | ) | (0.1 | ) | (1.8 | ) | ||||||
|
|
|
|
|
|
|
|||||||
| Non-GAAP research and development expense |
$ | 222.9 | $ | 208.6 | $ | 239.6 | ||||||
|
|
|
|
|
|
|
|||||||
| GAAP sales and marketing expense |
$ | 239.4 | $ | 233.6 | $ | 244.2 | ||||||
| Share-based compensation expense |
(13.5 | ) | (10.3 | ) | (15.3 | ) | ||||||
| Share-based payroll tax expense |
(1.6 | ) | (0.1 | ) | (1.4 | ) | ||||||
| Amortization of purchased intangible assets |
(0.4 | ) | (0.9 | ) | (1.0 | ) | ||||||
|
|
|
|
|
|
|
|||||||
| Non-GAAP sales and marketing expense |
$ | 223.9 | $ | 222.3 | $ | 226.5 | ||||||
|
|
|
|
|
|
|
|||||||
| GAAP general and administrative expense |
$ | 56.0 | $ | 50.8 | $ | 50.5 | ||||||
| Share-based compensation expense |
(6.1 | ) | (2.1 | ) | (6.7 | ) | ||||||
| Share-based payroll tax expense |
(0.4 | ) | — | (0.3 | ) | |||||||
| Amortization of purchased intangible assets |
(0.2 | ) | (0.2 | ) | (0.2 | ) | ||||||
| Acquisition-related and other charges |
(0.1 | ) | (0.4 | ) | (0.3 | ) | ||||||
| Litigation settlement benefits |
0.6 | — | — | |||||||||
|
|
|
|
|
|
|
|||||||
| Non-GAAP general and administrative expense |
$ | 49.8 | $ | 48.1 | $ | 43.0 | ||||||
|
|
|
|
|
|
|
|||||||
Juniper Networks, Inc.
Preliminary Reconciliations between GAAP and non-GAAP Financial Measures
(in millions, except percentages and per share amounts)
(unaudited)
| Three Months Ended | ||||||||||||
| March 31, 2018 | December 31, 2017 | March 31, 2017 | ||||||||||
| GAAP operating expenses |
$ | 562.9 | $ | 548.5 | $ | 590.3 | ||||||
| GAAP operating expenses % of revenue |
52.0 | % | 44.3 | % | 48.3 | % | ||||||
| Share-based compensation expense |
(63.7 | ) | (31.6 | ) | (56.8 | ) | ||||||
| Share-based payroll tax expense |
(4.4 | ) | (0.2 | ) | (3.5 | ) | ||||||
| Amortization of purchased intangible assets |
(0.6 | ) | (1.1 | ) | (1.2 | ) | ||||||
| Restructuring benefits (charges) |
1.9 | (36.2 | ) | (19.4 | ) | |||||||
| Acquisition-related and other charges |
(0.1 | ) | (0.4 | ) | (0.3 | ) | ||||||
| Litigation settlement benefits |
0.6 | — | — | |||||||||
|
|
|
|
|
|
|
|||||||
| Non-GAAP operating expenses |
$ | 496.6 | $ | 479.0 | $ | 509.1 | ||||||
|
|
|
|
|
|
|
|||||||
| Non-GAAP operating expenses % of revenue |
45.9 | % | 38.6 | % | 41.7 | % | ||||||
| GAAP operating income |
$ | 55.5 | $ | 202.7 | $ | 156.3 | ||||||
| GAAP operating margin |
5.1 | % | 16.4 | % | 12.8 | % | ||||||
| Share-based compensation expense |
70.4 | 36.4 | 62.0 | |||||||||
| Share-based payroll tax expense |
5.6 | 0.2 | 4.4 | |||||||||
| Amortization of purchased intangible assets |
4.4 | 4.9 | 4.3 | |||||||||
| Restructuring (benefits) charges |
(1.9 | ) | 36.2 | 19.4 | ||||||||
| Acquisition-related and other charges |
0.1 | 0.4 | 0.3 | |||||||||
| Litigation settlement benefits |
(0.6 | ) | — | — | ||||||||
| Supplier component remediation charges |
— | — | 7.1 | |||||||||
|
|
|
|
|
|
|
|||||||
| Non-GAAP operating income |
$ | 133.5 | $ | 280.8 | $ | 253.8 | ||||||
|
|
|
|
|
|
|
|||||||
| Non-GAAP operating margin |
12.3 | % | 22.7 | % | 20.8 | % | ||||||
| GAAP income tax provision |
$ | 7.0 | $ | 348.3 | $ | 31.8 | ||||||
| GAAP income tax rate |
16.9 | % | 174.0 | % | 22.6 | % | ||||||
| Estimated tax expense from income tax reform |
— | (289.5 | ) | — | ||||||||
| Income tax effect of non-GAAP exclusions |
12.9 | 12.3 | 28.3 | |||||||||
|
|
|
|
|
|
|
|||||||
| Non-GAAP provision for income tax |
$ | 19.9 | $ | 71.1 | $ | 60.1 | ||||||
|
|
|
|
|
|
|
|||||||
| Non-GAAP income tax rate |
16.7 | % | 26.3 | % | 25.2 | % | ||||||
| GAAP net income (loss) |
$ | 34.4 | $ | (148.1 | ) | $ | 108.8 | |||||
| Share-based compensation expense |
70.4 | 36.4 | 62.0 | |||||||||
| Share-based payroll tax expense |
5.6 | 0.2 | 4.4 | |||||||||
| Amortization of purchased intangible assets |
4.4 | 4.9 | 4.3 | |||||||||
| Restructuring (benefits) charges |
(1.9 | ) | 36.2 | 19.4 | ||||||||
| Acquisition-related and other charges |
0.1 | 0.4 | 0.3 | |||||||||
| Litigation settlement benefits |
(0.6 | ) | — | — | ||||||||
| Supplier component remediation charges |
— | — | 7.1 | |||||||||
| Gain on equity investments |
— | (7.8 | ) | — | ||||||||
| Estimated tax expense from income tax reform |
— | 289.5 | — | |||||||||
| Income tax effect of non-GAAP exclusions |
(12.9 | ) | (12.3 | ) | (28.3 | ) | ||||||
|
|
|
|
|
|
|
|||||||
| Non-GAAP net income |
$ | 99.5 | $ | 199.4 | $ | 178.0 | ||||||
|
|
|
|
|
|
|
|||||||
Juniper Networks, Inc.
Preliminary Reconciliations between GAAP and non-GAAP Financial Measures
(in millions, except percentages and per share amounts)
(unaudited)
| Three Months Ended | ||||||||||||
| March 31, 2018 | December 31, 2017 | March 31, 2017 | ||||||||||
| GAAP diluted net income (loss) per share |
$ | 0.10 | $ | (0.40 | ) | $ | 0.28 | |||||
|
|
|
|
|
|
|
|||||||
| Non-GAAP diluted net income per share |
$ | 0.28 | $ | 0.53 | $ | 0.46 | ||||||
|
|
|
|
|
|
|
|||||||
| Shares used in computing GAAP diluted net income (loss) per share |
360.6 | 371.5 | 388.0 | |||||||||
|
|
|
|
|
|
|
|||||||
| Shares used in computing Non-GAAP diluted net income per share |
360.6 | 376.6 | 388.0 | |||||||||
|
|
|
|
|
|
|
|||||||