Attached files
| file | filename |
|---|---|
| 8-K - 8-K - IMPERIAL OIL LTD | d577999d8k.htm |
|
Exhibit 99.1 April 27 Annual Meeting of Shareholders
|
Cautionary statement Statements of future events or conditions in this report, including projections, targets, expectations, estimates, and business plans are forward-looking statements. Actual future financial and operating results, including demand growth and energy source mix; production growth and mix; project plans, dates, costs and capacities; production rates; production life and resource recoveries; cost savings; product sales; financing sources; and capital and environmental expenditures could differ materially depending on a number of factors, such as changes in the supply of and demand for crude oil, natural gas, and petroleum and petrochemical products and resulting price and margin impacts; transportation for accessing markets; political or regulatory events, including changes in law or government policy, applicable royalty rates and tax laws; the receipt, in a timely manner, of regulatory and third-party approvals; third party opposition to operations and projects; environmental risks inherent in oil and gas exploration and production activities; environmental regulation, including climate change and greenhouse gas restrictions; currency exchange rates; availability and allocation of capital; availability and performance of third party service providers; unanticipated operational disruptions; management effectiveness; commercial negotiations; project management and schedules; response to unexpected technological developments; operational hazards and risks; disaster response preparedness; the ability to develop or acquire additional reserves; and other factors discussed in in Item 1A of Imperial Oil Limited’s Form 10-K for the year ended December 31, 2017 and in the management’s discussion and analysis of financial condition and results of operations contained in Item 7. Forward- looking statements are not guarantees of future performance and involve a number of risks and uncertainties, some that are similar to other oil and gas companies and some that are unique to Imperial Oil Limited. Imperial Oil Limited’s actual results may differ materially from those expressed or implied by its forward-looking statements and readers are cautioned not to place undue reliance on them. Imperial Oil Limited undertakes no obligation to update any forward-looking statements contained herein, except as required by applicable law. All financial information is presented in Canadian dollars, unless otherwise indicated. In these materials, certain natural gas volumes have been converted to barrels of oil equivalent (BOE) on the basis of six thousand cubic feet (Mcf) to one barrel (bbl). BOE may be misleading, particularly if used in isolation. A BOE conversion ratio of 6 Mcf to one bbl is based on an energy-equivalency conversion method primarily applicable at the burner tip and does not represent a value equivalency at the wellhead. Given that the value ratio based on the current price of crude oil as compared to natural gas is significantly different than the energy equivalency ratio of 6 Mcf to 1 bbl, using a 6:1 conversion ratio may be misleading as an indication of value. All reserves and contingent resources estimates provided in these materials are effective as of December 31, 2017, and based on definitions contained in the Canadian Oil and Gas Evaluation Handbook (COGEH) and are presented in accordance with National Instrument 51-101, as disclosed in Imperial’s Form 51-101F1 for the fiscal year ending December 31,2017. Except as otherwise disclosed herein, reserves and contingent resource information are an estimate of the company’s working interest before royalties at year-end 2017, as determined by Imperial’s internal qualified reserves evaluator. Reserves are the estimated remaining quantities of oil and natural gas and related substances anticipated to be recoverable from known accumulations, from a given date forward, based on: analysis of drilling, geological, geophysical and engineering data, the use of established technology, and specified economic conditions, which are generally accepted as being reasonable. Proved reserves are those reserves which can be estimated with a high degree of certainty to be recoverable. Probable reserves are those additional reserves that are less certain to be recovered than proved reserves. Contingent resources do not constitute, and should not be confused with, reserves. Contingent resources are those quantities of petroleum considered to be potentially recoverable from known accumulations using established technology or technology under development, but are currently not considered to be commercially recoverable due to one or more contingencies. Contingencies that preclude the classification of Imperial’s contingent resources as reserves include, but are not limited to, the need for further design and the associated uncertainty in development costs and timelines; regulatory approvals; need for internal approvals to proceed with development; lackof market access; and the need for further delineation analysis to improve certainty of resources. Contingent resource volumes represented in these materials are technical best estimate volumes, considered to be a realistic estimate of the quantity that may actually be recovered; it is equally likely that the actual quantities recovered may be greater or less than the technical best estimate. Estimates of contingent resources have not been adjusted for risk based on the chance of development. There is uncertainty that it will be commercially viable to produce any portion of the resource, nor is there certainty as to the timing of any such development. Significant positive and negative factors relevant to the estimate include, but are not limited to, the commodity price environment and regulatory and tax uncertainty. The estimates of various classes of reserves (proved and probable) and of contingent resources in these materials represent arithmetic sums of multiple estimates of such classes for different properties, which statistical principles indicate may be misleading as to volumes that may actually be recovered. Readers should give attention to the estimates of individual classes of reserves and contingent resources and appreciate the differing probabilities of recovery associated with each class. The term “project” as used in these materials can refer to a varietyof different activities and does not necessarily have the same meaning as in any government payment transparency reports.

|
Meeting proceedings Rich Kruger Chairman, President and CEO Lara Pella Corporate Secretary Imperial | 2018 | 3
|
Audit committee report Victor Young Audit Committee Chair Imperial | 2018 | 6
|
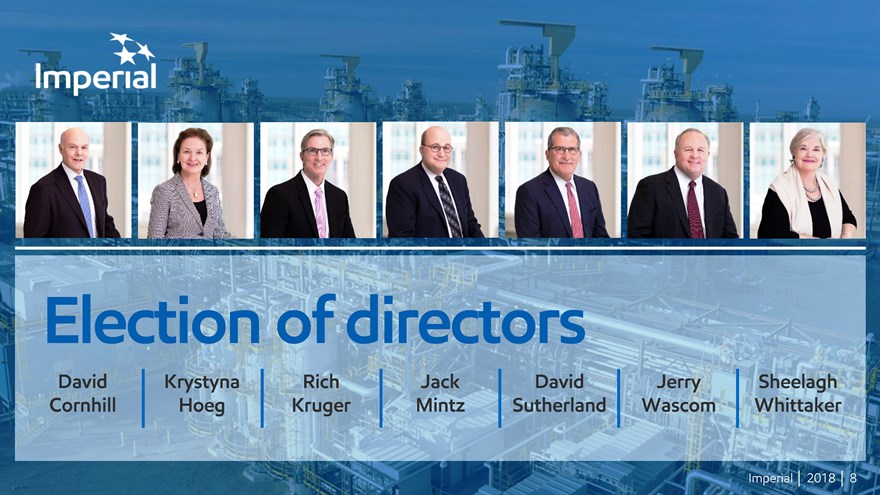
Election of directors David Cornhill Richu Kruger Jack Mintz David Sutherland Sheelagh Whittaker Krystyna Hoeg Jerry Wascom Imperial Imperial | 2018 | 8
|
Shareholder proposals Rich Kruger Chairman, President and CEO Lara Pella Corporate Secretary Imperial | 2018 | 9
|
Chairman’s remarks Rich Kruger Chairman, President and CEO Imperial | 2018 | 10
|
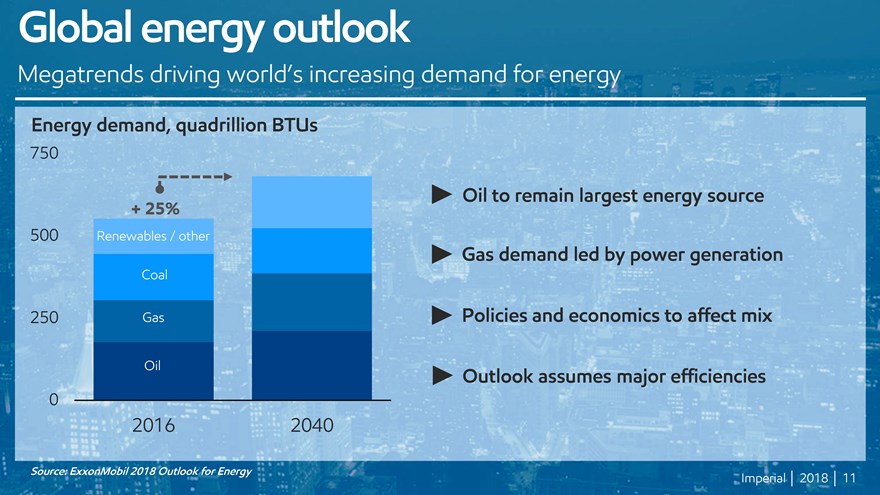
Global energy outlook Megatrends driving world’s increasing demand for energy Energy demand, quadrillion BTUs 750 500 250 2016 2040 Oil to remain largest energy source Gas demand led by power generation Policies and economics to affect mix Outlook assumes major efficiencies 0 Source: ExxonMobil 2018 Outlook for Energy Imperial | 2018 | 11
|
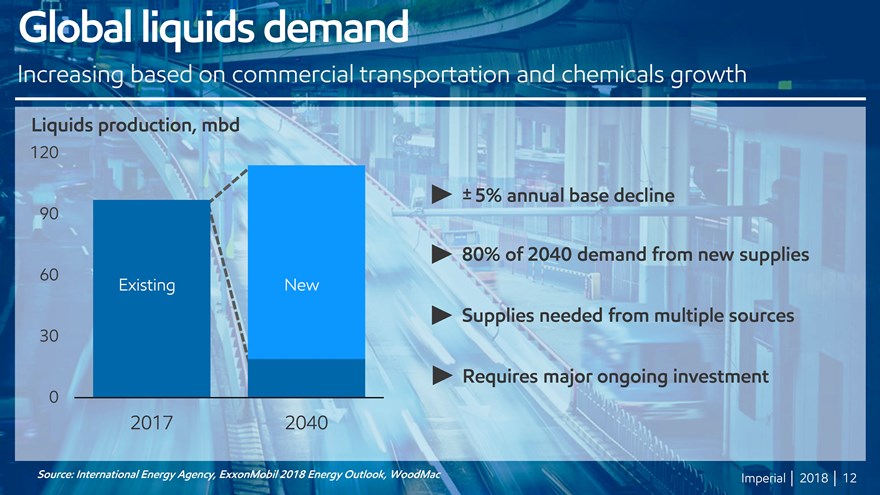
Global liquids demand Increasing based on commercial transportation and chemicals growth Liquids production, mbd 120 90 60 30 0 2017 2040 ±5% annual base decline 80% of 2040 demand from new supplies Supplies needed from multiple sources Requires major ongoing investment Source: International Energy Agency, ExxonMobil 2018 Energy Outlook, WoodMac Imperial | 2018 | 12
|
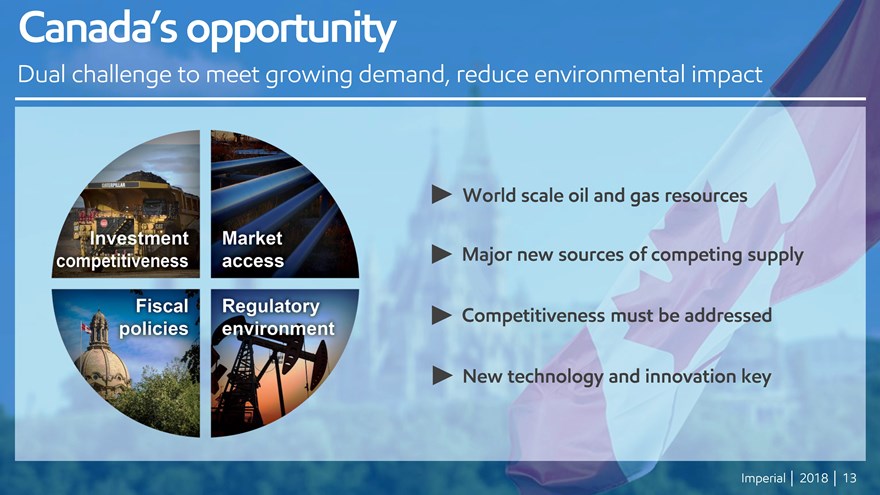
Canada’s opportunity Dual challenge to meet growing demand, reduce environmental impact World scale oil and gas resources Major new sources of competing supply Competitiveness must be addressed New technology and innovation key Imperial | 2018 | 13
|
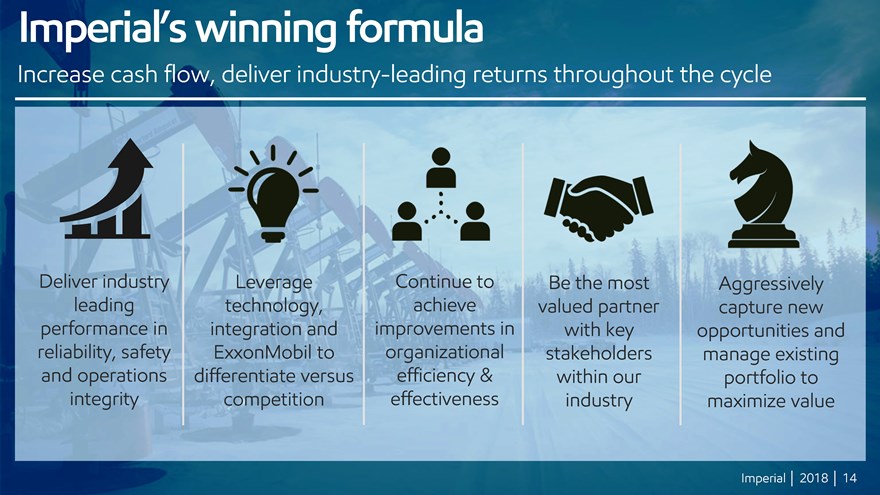
Imperial’s winning formula Increase cash flow, deliver industry-leading returns throughout the cycle Deliver industry leading performance in reliability, safety and operations integrity Leverage technology, integration and ExxonMobil to differentiate versus competition Continue to achieve improvements in organizational efficiency & effectiveness Be the most valued partner with key stakeholders within our industry Aggressively capture new opportunities and manage existing portfolio to maximize value Imperial | 2018 | 14
|
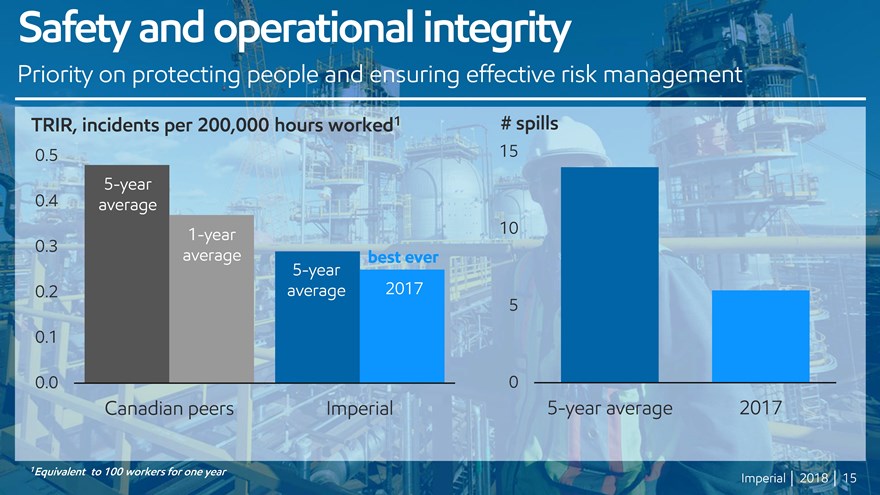
Safety and operational integrity £ Priority on protecting people and ensuring effective risk management 1 Equivalent to 100 workers for one year Imperial | 2018 | 15
|
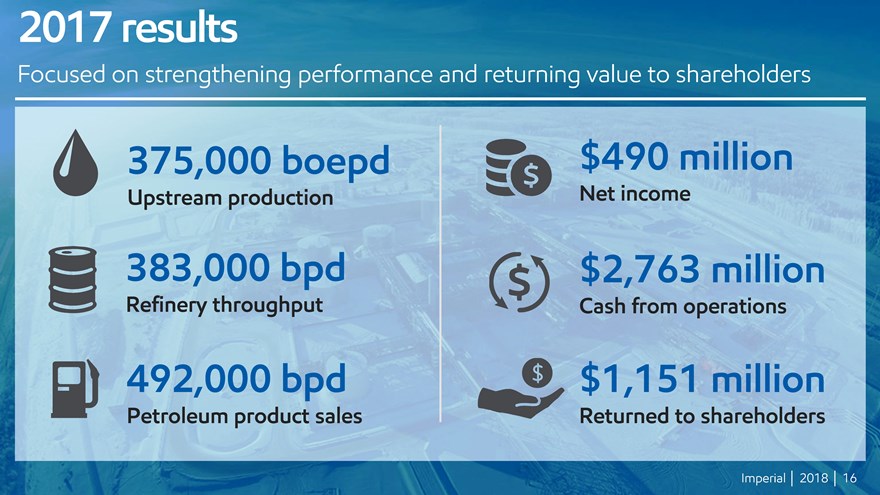
2017 results Focused on strengthening performance and returning value to shareholders $490 million Net income 3,000 bpd Refinery throughput $2,763 million Cash from operations © 492,000 bpd Petroleum product sales ©, $1,151 million Returned to shareholders 0 Imperial | 2018 | 16
|
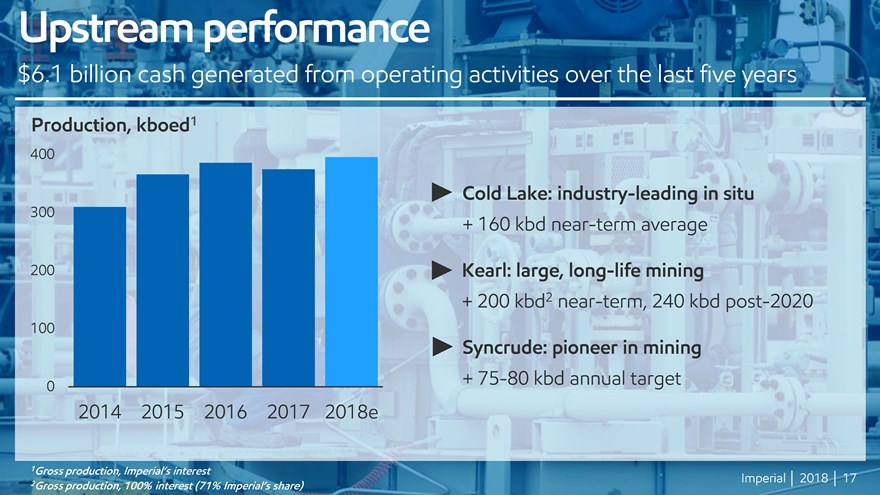
Upstream performance $6.1 billion cash generated from operating activities over the last five years 1 Gross production, Imperial’s interest 2Gross production, 100% interest (71% Imperial’s share) Cold Lake: industry-leading in situ + 160 kbd near-term average Kearl: large, long-life mining + 200 kbd2 near-term, 240 kbd post-2020 Syncrude: pioneer in mining + 75-80 kbd annual target Imperial | 2018 | 17
|
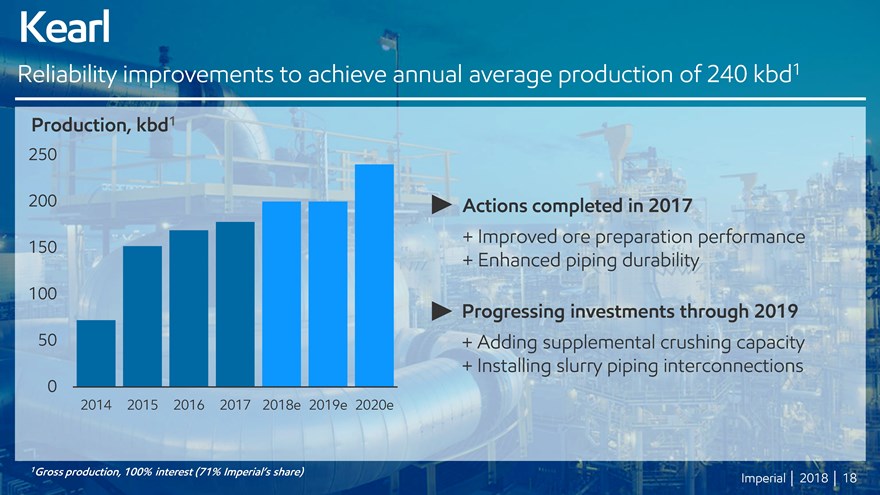
Kearl Reliability improvements to achieve annual average production of 240 kbd1 250 200 150 100 50 0 2014 2015 2016 2017 2018e 1019e 2020e Actions completed in 2017 + Improved ore preparation performance + Enhanced piping durability Progressing investments through 2019 + Adding supplemental crushing capacity + Installing slurry piping interconnections 1 Gross production, 100% interest (71% Imperial’s share) Imperial | 2018 | 18
|
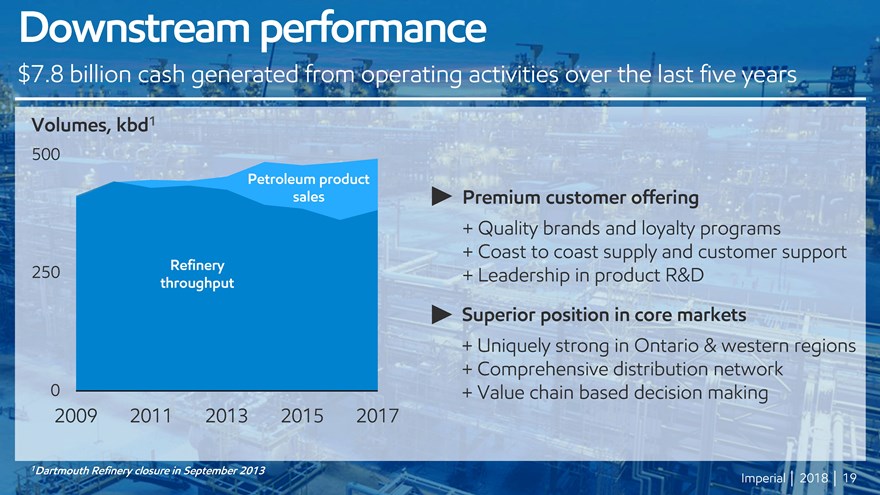
Downstream performance $7.8 billion cash generated from operating activities over the last five years Volumes, kbd1 500 250 Refinery throughput Petroleum product sales 0 2009 2011 2013 2015 2017 Premium customer offering + Quality brands and loyalty programs + Coast to coast supply and customer support + Leadership in product R&D Superior position in core markets + Uniquely strong in Ontario & western regions + Comprehensive distribution network + Value chain based decision making 1 Dartmouth Refinery closure in September 2013 Imperial | 2018 | 19
|
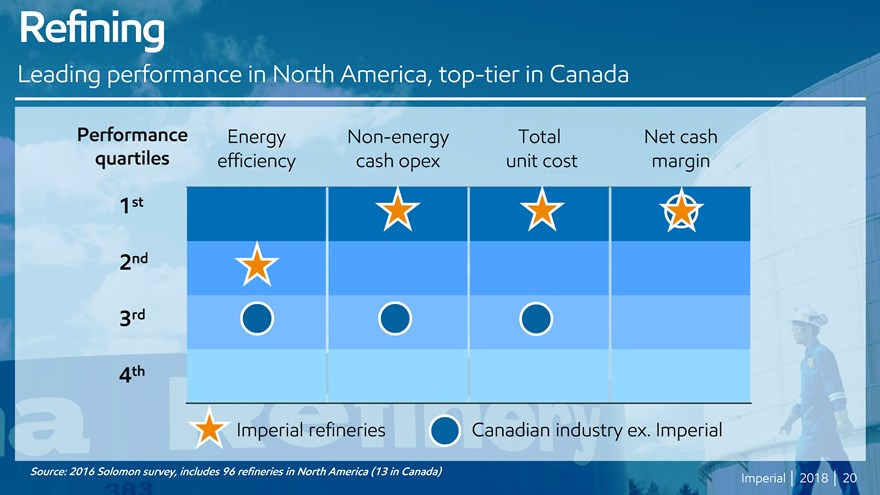
Refining Leading performance in North America, top-tier in Canada Performance Energy Non-energy quartiles efficiency cash opex Total unit cost Net cash margin 1st 3rd 4th Source: 2016 Solomon survey, includes 96 refineries in North America (13 in Canada) Imperial | 2018 | 20
|
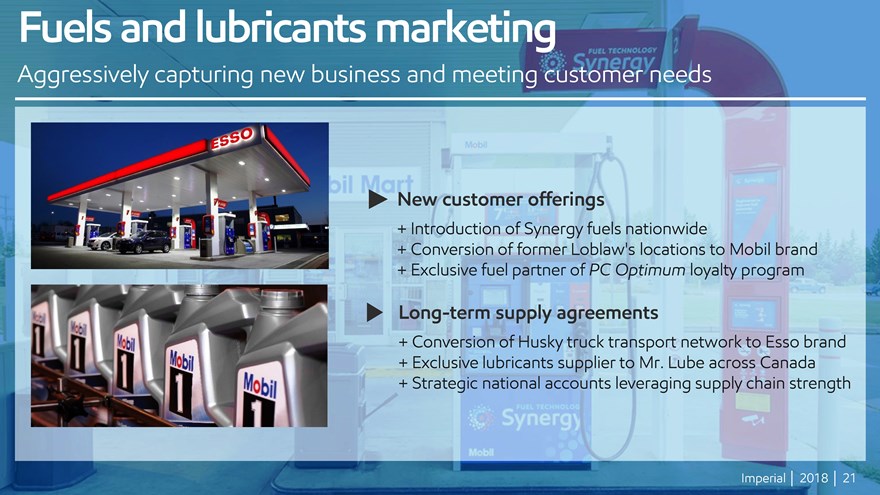
Fuels and lubricants marketing Aggressively capturing new business and meeting customer needs New customer offerings + Introduction of Synergy fuels nationwide + Conversion of former Loblaw’s locations to Mobil brand + Exclusive fuel partner of PC Optimum loyalty program Long-term supply agreements + Conversion of Husky truck transport network to Esso brand + Exclusive lubricants supplier to Mr. Lube across Canada + Strategic national accounts leveraging supply chain strength Imperial | 2018 | 21
|
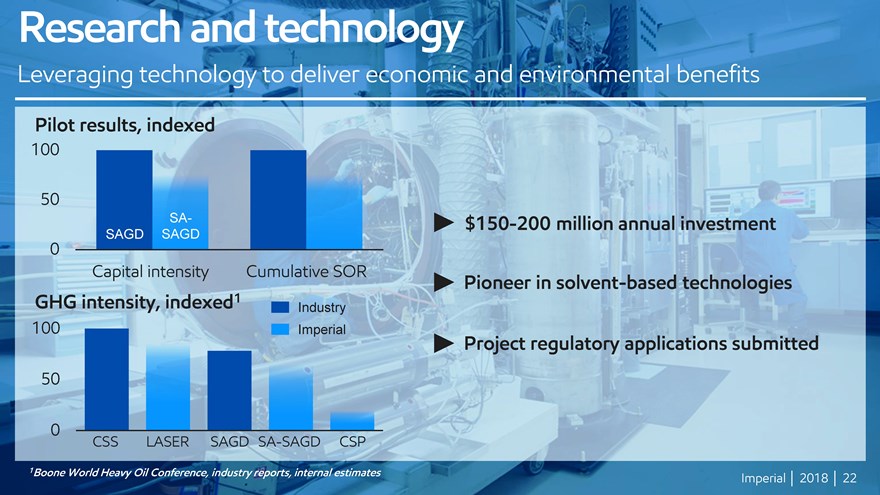
Research and technology wSRJ Leveraging technology to deliver economic and environmental benefits $150-200 million annual investment Pioneer in solvent-based technologies Project regulatory applications submitted 1 Boone World Heavy OH Conference, industry reports, internal estimates Imperial | 2018 | 22
|
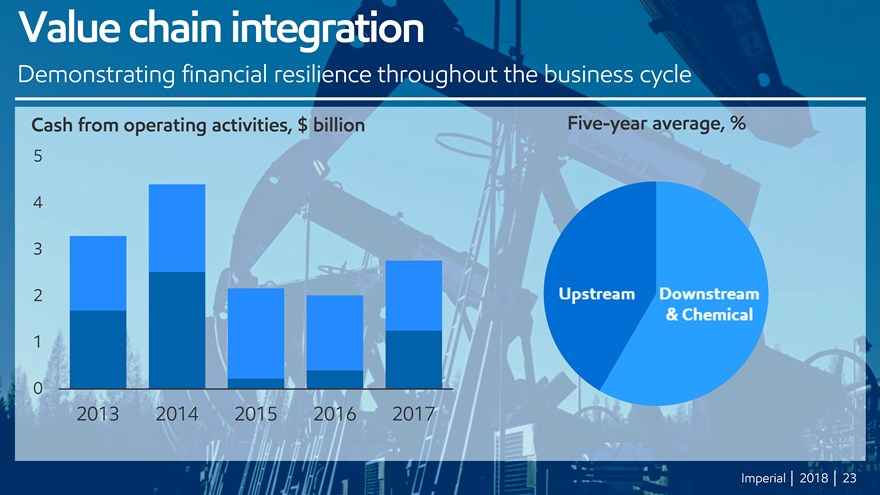
Value chain integration Demonstrating financial resilience throughout the business cycle 1 Five-year average, % 5 4 3 2 1 2013 2014 2015 2016 2017 Cash from operating activities, $ billion Upstream Downstream & Chemical Imperial | 2018 | 23
|
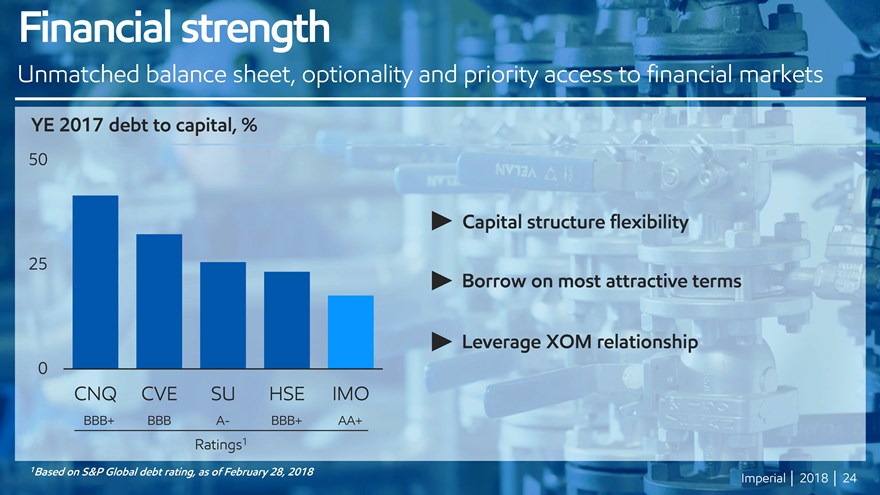
Financial strength , an Unmatched balance sheet, optionality and priority access to financial markets YE 2017 debt to capital, % 50 Ratings1 Capital structure flexibility Borrow on most attractive terms Leverage XOM relationship 1 Based on S&P Global debt rating, as of February28,2018 Imperial | 2018 | 24
|
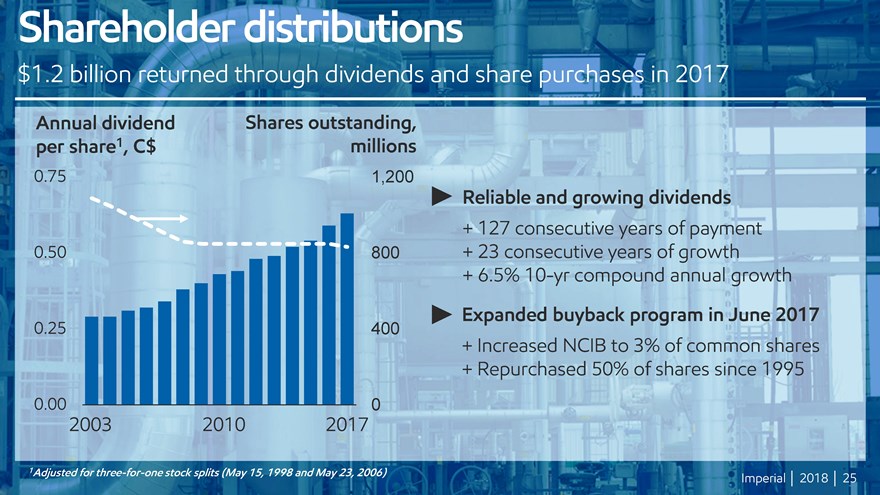
Shareholder distributions $1.2 billion returned through dividends and share purchases in 2017 0.75 0.50 0.25 0.00 2003 2010 2017 1,200 800 400 0 Reliable and growing dividends + 127 consecutive years of payment + 23 consecutive years of growth + 6.5% 10-yr compound annual growth Expanded buyback program in June 2017 + Increased NCIB to 3% of common shares + Repurchased 50% of shares since 1995 Imperial | 2018 | 25
|
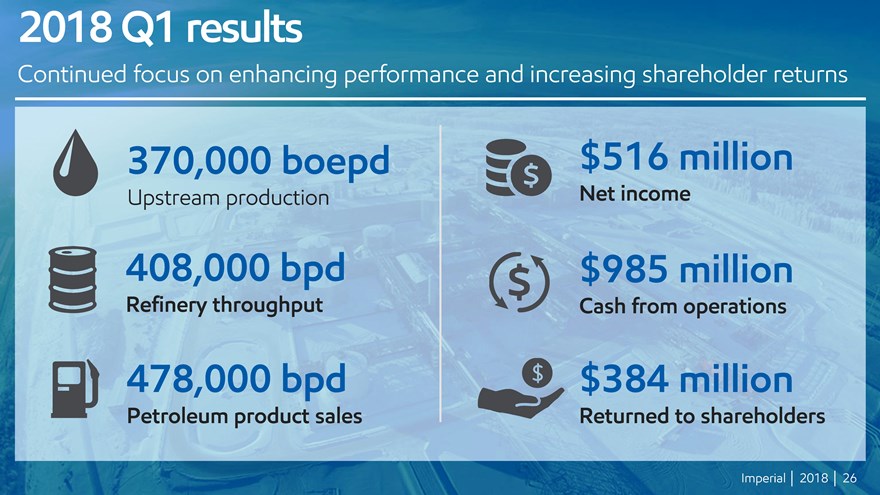
2018 Q1 results Continued focus on enhancing performance and increasing shareholder returns 370,000 boepd Upstream production 408,000 bpd Refinery throughput 478,000 bpd Petroleum product sales $516 million Net income $985 million Cash from operations $384 million Returned to shareholders Imperial | 2018 | 26
|
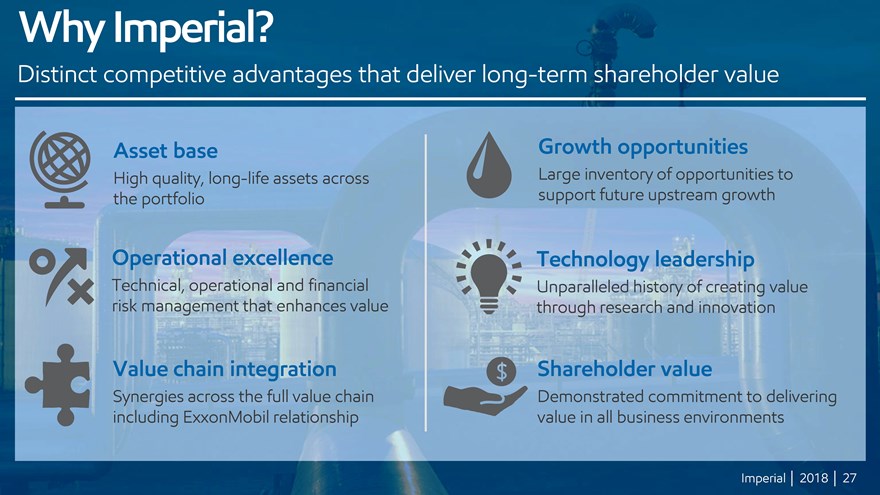
Why Imperial? Distinct competitive advantages that deliver long-term shareholder value Operational excellence Technical, operational and financial risk management that enhances value Value chain integration Synergies across the full value chain including ExxonMobil relationship Asset base High quality, long-life assets across the portfolio Growth opportunities Large inventory of opportunities to support future upstream growth Technology leadership Unparalleled history of creating value through research and innovation Shareholder value Demonstrated commitment to delivering value in all business environments Imperial | 2018 | 27
|
Q & A
|
Scrutineers’report Lara Pella Corporate Secretary Imperial | 2018 | 29
|
April 27 Annual Meeting of Shareholders