Attached files
| file | filename |
|---|---|
| EX-99.1 - EXHIBIT 99.1 - Great Ajax Corp. | exhibit991-33118.htm |
| 8-K - 8-K - Great Ajax Corp. | form8-k.htm |
First Quarter Investor Presentation
May 1, 2018

Safe Harbor Disclosure
2
We make forward-looking statements in this presentation that are subject to risks and uncertainties. These forward-looking
statements include information about possible or assumed future results of our business, financial condition, liquidity, results
of operations, cash flow and plans and objectives. When we use the words “believe,” “expect,” “anticipate,” “estimate,”
“plan,” “continue,” “intend,” “should,” “may” or similar expressions, we intend to identify forward-looking statements.
Statements regarding the following subjects, among others, may be forward-looking: market trends in our industry, interest
rates, real estate values, the debt financing markets or the general economy or the demand for and availability of residential
and small-balance commercial real estate loans; our business and investment strategy; our projected operating results;
actions and initiatives of the U.S. government and changes to U.S. government policies and the execution and impact of these
actions, initiatives and policies; the state of the U.S. economy generally or in specific geographic regions; economic trends and
economic recoveries; our ability to obtain and maintain financing arrangements; changes in the value of our mortgage
portfolio; changes to our portfolio of properties; impact of and changes in governmental regulations, tax law and rates,
accounting guidance and similar matters; our ability to satisfy the REIT qualification requirements for U.S. federal income tax
purposes; availability of qualified personnel; estimates relating to our ability to make distributions to our stockholders in the
future; general volatility of the capital markets and the market price of our shares of common stock; and the degree and
nature of our competition.
The forward-looking statements are based on our beliefs, assumptions and expectations of our future performance, taking
into account all information currently available to us. Forward-looking statements are not predictions of future events. These
beliefs, assumptions and expectations can change as a result of many possible events or factors, not all of which are known to
us. If a change occurs, our business, financial condition, liquidity and results of operations may vary materially from those
expressed in our forward-looking statements. Furthermore, forward-looking statements are subject to risks and uncertainties,
including, among other things, those described under Item 1A of our Annual Report on Form 10-K for the year ended
December 31, 2017, which can be accessed through the link to our SEC filings on our website (www.great-ajax.com) or at the
SEC's website (www.sec.gov). Other risks, uncertainties, and factors that could cause actual results to differ materially from
those projected may be described from time to time in reports we file with the SEC, including reports on Forms 10-Q, 10-K
and 8-K. Any forward-looking statement speaks only as of the date on which it is made. New risks and uncertainties arise over
time, and it is not possible for us to predict those events or how they may affect us. Except as required by law, we are not
obligated to, and do not intend to, update or revise any forward-looking statements, whether as a result of new information,
future events or otherwise. Unless stated otherwise, financial information included in this presentation is as of March 31,
2018.
Business Overview
3
Leverage long-standing relationships to acquire mortgage loans through privately
negotiated transactions from a diverse group of customers
– Over 90% of our acquisitions since inception have been privately negotiated
– Acquisitions made in 232 transactions since inception. 6 transactions closed in Q1
2018
Use our manager’s proprietary analytics to price each pool on an asset-by-asset basis
Adjust individual loan bid price to accumulate clusters of loans in attractive demographic
metropolitan areas
– Typical acquisition contains 25 – 100 loans with total market value between $5 – $20
million
Our affiliated servicer services the loans asset-by-asset and borrower-by-borrower
Objective is to maximize returns for each asset by utilizing a full menu of loss mitigation
and asset optimization techniques
Use moderate non-mark-to-market leverage

Highlights – Quarter Ended March 31, 2018
4
Purchased $17.6 million of re-performing mortgage loans (“RPL”) with an aggregate unpaid
principal balance (“UPB”) of $19.7 million and underlying collateral value of $32.4 million.
Purchased one multi-family 32 unit building with underlying collateral value of $3.5 million
Interest income of $25.6 million; net interest income of $13.1 million
Net income attributable to common stockholders of $7.7 million
Basic earnings per share (“EPS”) of $0.41
Taxable income of $0.37 per share
Book value per share of $15.53 at March 31, 2018
Cash collections of $50.4 million during the quarter
Held $47.5 million of cash and cash equivalents at March 31, 2018. Average daily cash balance of
$51.5 million during the quarter
Quarter end leverage ratios1
Asset Level : 2.8x
Corporate Level : 3.1x
On January 26, 2018, we closed the first step of the two-step acquisition of an 8% ownership
interest in Great Ajax Financial Services LLC (“GAFS”), the parent of our servicer, Gregory Funding
LLC. We acquired a 4.9% interest and three warrants. The second step is expected to close late May
2018
1 Excluding consolidation of the portion of 2017-D that is owned by a third-party
Portfolio Overview – as of March 31, 2018
5
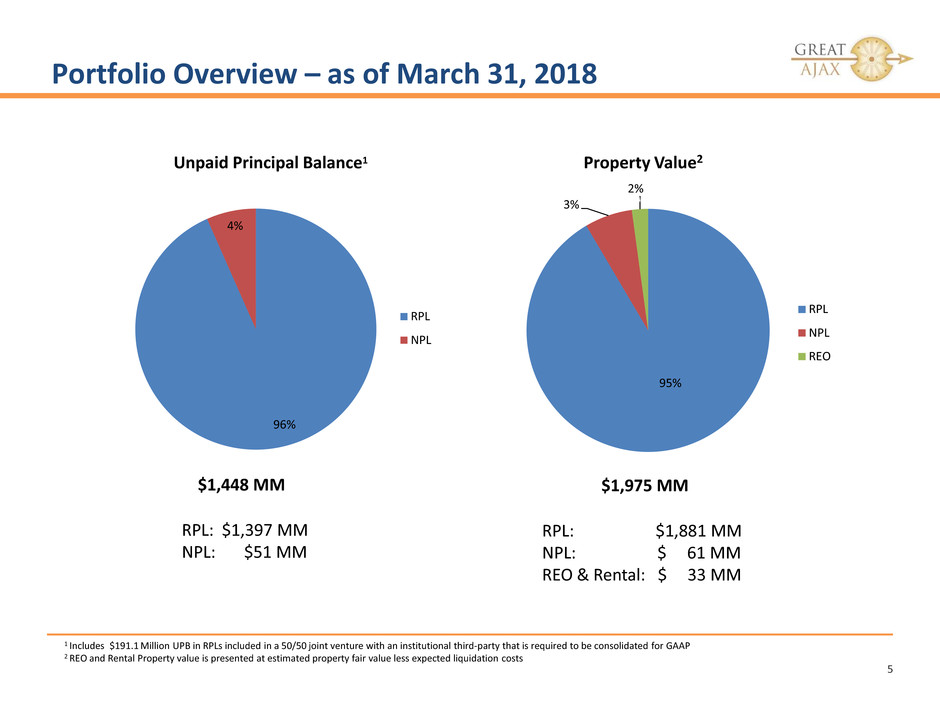
$1,448 MM
RPL: $1,397 MM
NPL: $51 MM
$1,975 MM
RPL: $1,881 MM
NPL: $ 61 MM
REO & Rental: $ 33 MM
95%
3%
2%
Property Value2
RPL
NPL
REO
1 Includes $191.1 Million UPB in RPLs included in a 50/50 joint venture with an institutional third-party that is required to be consolidated for GAAP
2 REO and Rental Property value is presented at estimated property fair value less expected liquidation costs
96%
4%
Unpaid Principal Balance1
RPL
NPL
Portfolio Growth
6
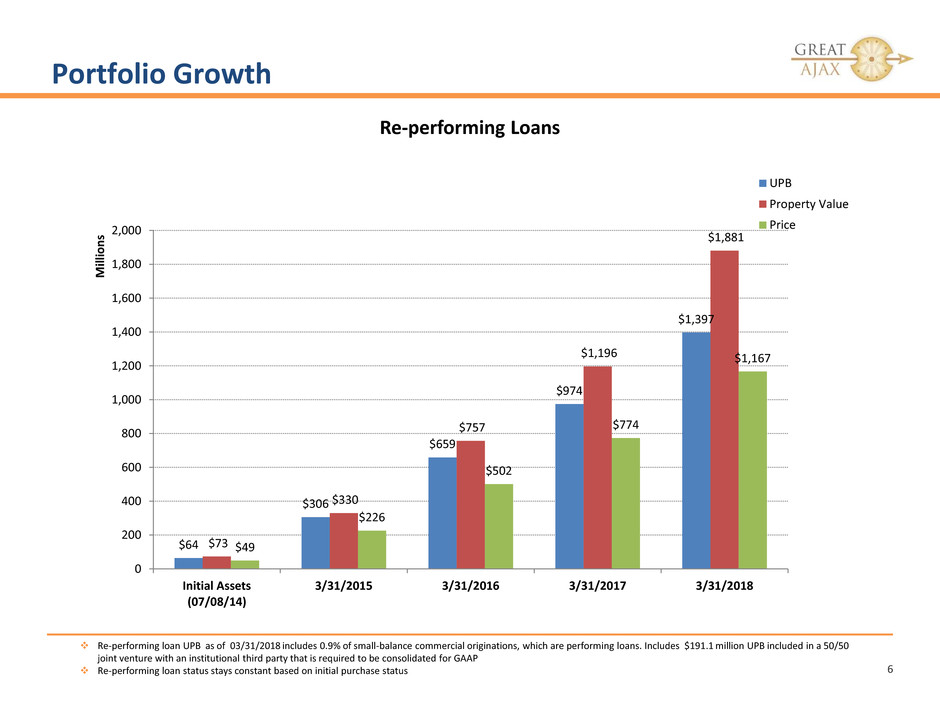
Re-performing Loans
Re-performing loan UPB as of 03/31/2018 includes 0.9% of small-balance commercial originations, which are performing loans. Includes $191.1 million UPB included in a 50/50
joint venture with an institutional third party that is required to be consolidated for GAAP
Re-performing loan status stays constant based on initial purchase status
$64
$306
$659
$974
$1,397
$73
$330
$757
$1,196
$1,881
$49
$226
$502
$774
$1,167
0
200
400
600
800
1,000
1,200
1,400
1,600
1,800
2,000
Initial Assets
(07/08/14)
3/31/2015 3/31/2016 3/31/2017 3/31/2018
M
ill
io
n
s
UPB
Property Value
Price

Portfolio Growth
7
Non-performing loan status stays constant based on initial purchase status
$96
$100
$69
$103 $105
$77
$62
$59
$61
$43
$33
0
20
40
60
80
100
120
Initial Assets (07/08/14) 3/31/2015 3/31/2016 3/31/2017 3/31/2018
M
ill
io
n
s
UPB
Property Value
Price
Non-performing Loans
$51
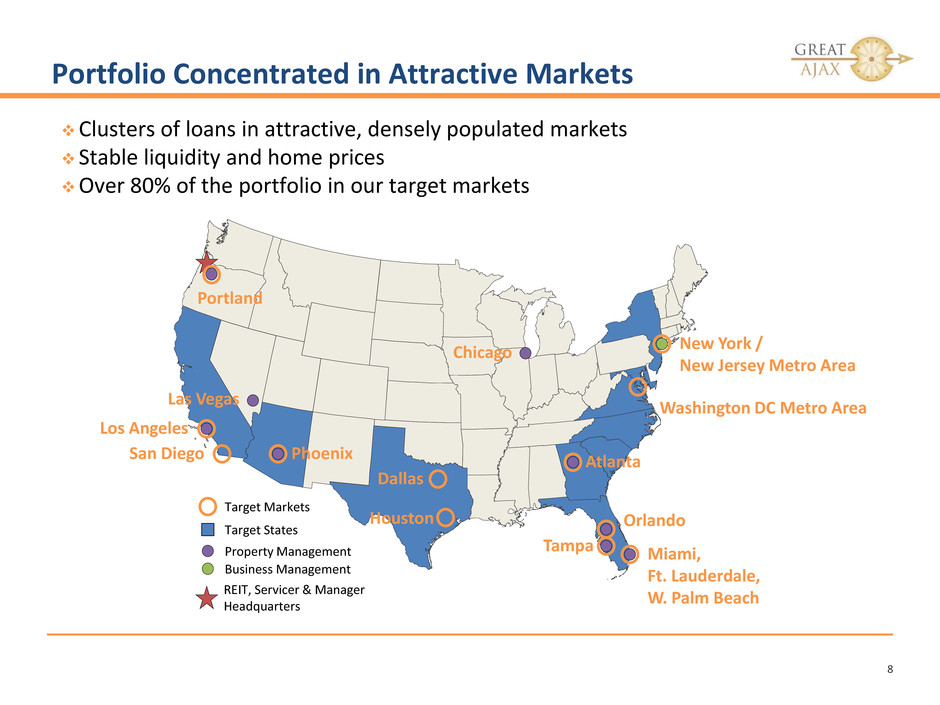
Portfolio Concentrated in Attractive Markets
8
Clusters of loans in attractive, densely populated markets
Stable liquidity and home prices
Over 80% of the portfolio in our target markets
Target States
Target Markets
Los Angeles
San Diego
Dallas
Portland
Phoenix
Washington DC Metro Area
Chicago
Atlanta
Orlando
Tampa Miami,
Ft. Lauderdale,
W. Palm Beach
New York /
New Jersey Metro Area
Las Vegas
REIT, Servicer & Manager
Headquarters
Property Management
Business Management
Houston

Portfolio Migration
9
24 for 24: Loan that has made 24 full payments in the last 24 months
12 for 12: Loan that has made 12 full payments in the last 12 months
7 for 7: Loan that has made 7 full payments in the last 7 months
NPL: <1 full payment in the last three months
Count UPB Count UPB
Liquidated - - 1151 233,378
24for24 416 74,273 2526 559,263
12for12 303 63,180 1840 395,644
7for7 3101 694,253 511 108,795
4f4-6f6 1508 331,766 346 72,291
Less than 4f4 2161 449,513 963 201,958
REO - - 147 37,431
NPL 512 124,914 546 134,765
Purchased REO 34 8,074 5 2,448
8,035 1,745,973 8,035 1,745,973
Total Pre 1Q2018 Acquisitions ($$ in thousands)
Acquisition Current Based on

Financial Metrics – Excluding consolidation of the portion of 2017-D
owned by third-parties
10
1 Amount is based off a daily calculation to be more consistent with the Company’s operations
($ in thousands)
Q1 -18 Excluding
the Consolidation
of 2017-D
Q4-17 Excluding
the consolidation
of 2017 D Q3-17 Q2-17
Interest Income on Loans 24,124 23,778 24,396 21,682
Average Loans1 1,163,970 1,071,415 1,052,038 952,638
Average Loan Yield 8.6% 9.2% 9.6% 9.4%
Total Interest Expense 11,683 11,136 10,775 9,293
Asset Level Interest Expense 9,533 8,990 8,863 8,022
Average Asset Level Debt 881,587 817,316 791,261 715,288
Average Asset Level Debt Cost 4.4% 4.5% 4.6% 4.6%
Asset Level Net Interest Margin 4.2% 4.7% 5.0% 4.9%
Total Average Debt 984,224 919,763 883,770 775,717
Total Average Debt Cost 4.8% 5.0% 5.0% 4.9%
Total Net Interest Margin 3.7% 4.1% 4.6% 4.5%
Non-Interest Operating Expenses 5,813 5,693 5,312 5,100
Non-Interest Operating Expenses/Avg Assets 2.1% 1.9% 1.8% 2.0%
ROAA - ex net REO impairments and losses 2.7% 2.6% 3.1% 3.0%
ROAA - Net REO Impairments, gains and losses 0.1% -0.4% -0.4% -0.3%
ROAA - Total 2.8% 2.2% 2.7% 2.7%
ROAE - ex net REO impairments and losses 10.1% 10.7% 12.7% 11.4%
ROAE - Net REO Impairments, gains and losses 0.3% -1.4% -1.6% -1.1%
ROAE - Total 10.4% 9.3% 11.1% 10.3%
Average Leverage Ratio - Asset Backed 2.9 2.7 2.7 2.5
Average Leverage Ratio - Convertible Debt 0.3 0.3 0.3 0.2
Average Leverage Ratio - Total 3.2 3.1 3.0 2.7
Ending Leverage Ratio - Asset Backed 2.8 2.9 2.6 2.6
Ending Leverage Ratio - Convertible Debt 0.3 0.3 0.3 0.3
Ending Leverage Ratio - Total 3.1 3.2 2.9 2.9
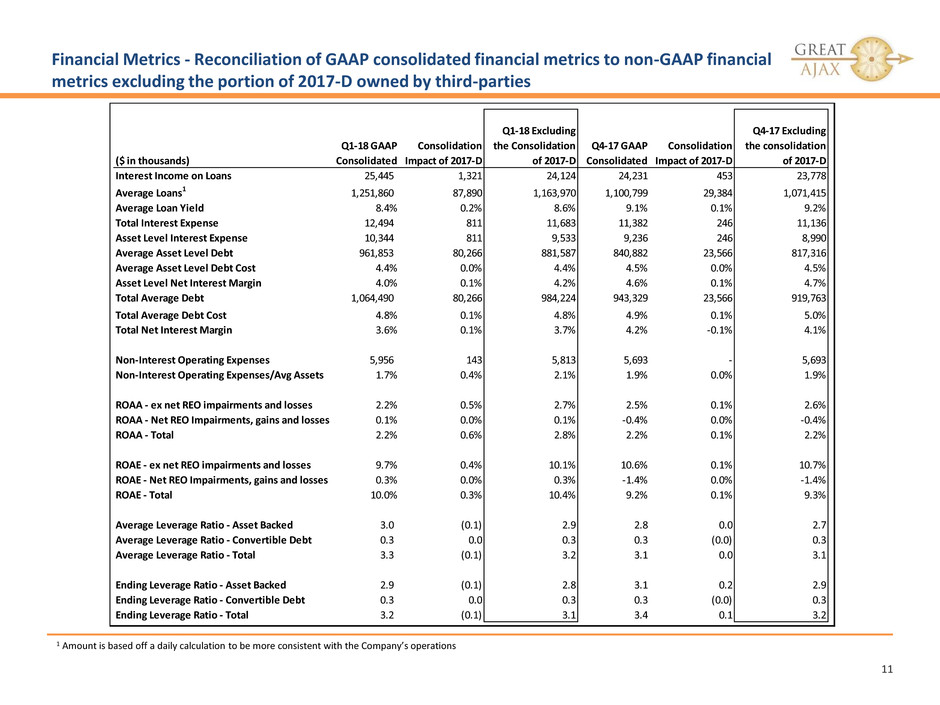
Financial Metrics - Reconciliation of GAAP consolidated financial metrics to non-GAAP financial
metrics excluding the portion of 2017-D owned by third-parties
11
1 Amount is based off a daily calculation to be more consistent with the Company’s operations
($ in thousands)
Q1-18 GAAP
Consolidated
Consolidation
Impact of 2017-D
Q1-18 Excluding
the Consolidation
of 2017-D
Q4-17 GAAP
Consolidated
Consolidation
Impact of 2017-D
Q4-17 Excluding
the consolidation
of 2017-D
Interest Income on Loans 25,445 1,321 24,124 24,231 453 23,778
Average Loans1 1,251,860 87,890 1,163,970 1,100,799 29,384 1,071,415
Average Loan Yield 8.4% 0.2% 8.6% 9.1% 0.1% 9.2%
Total Interest Expense 12,494 811 11,683 11,382 246 11,136
Asset Level Interest Expense 10,344 811 9,533 9,236 246 8,990
Average Asset Level Debt 961,853 80,266 881,587 840,882 23,566 817,316
Average Asset Level Debt Cost 4.4% 0.0% 4.4% 4.5% 0.0% 4.5%
Asset Level Net Interest Margin 4.0% 0.1% 4.2% 4.6% 0.1% 4.7%
Total Average Debt 1,064,490 80,266 984,224 943,329 23,566 919,763
Total Average Debt Cost 4.8% 0.1% 4.8% 4.9% 0.1% 5.0%
Total Net Interest Margin 3.6% 0.1% 3.7% 4.2% -0.1% 4.1%
Non-Interest Operating Expenses 5,956 143 5,813 5,693 - 5,693
Non-Interest Operating Expenses/Avg Assets 1.7% 0.4% 2.1% 1.9% 0.0% 1.9%
ROAA - ex net REO impairments and losses 2.2% 0.5% 2.7% 2.5% 0.1% 2.6%
ROAA - Net REO Impairments, gains and losses 0.1% 0.0% 0.1% -0.4% 0.0% -0.4%
ROAA - Total 2.2% 0.6% 2.8% 2.2% 0.1% 2.2%
ROAE - ex net REO impairments and losses 9.7% 0.4% 10.1% 10.6% 0.1% 10.7%
ROAE - Net REO Impairments, gains and losses 0.3% 0.0% 0.3% -1.4% 0.0% -1.4%
ROAE - Total 10.0% 0.3% 10.4% 9.2% 0.1% 9.3%
Average Leverage Ratio - Asset Backed 3.0 (0.1) 2.9 2.8 0.0 2.7
Average Leverage Ratio - Convertible Debt 0.3 0.0 0.3 0.3 (0.0) 0.3
Average Leverage Ratio - Total 3.3 (0.1) 3.2 3.1 0.0 3.1
Ending Leverage Ratio - Asset Backed 2.9 (0.1) 2.8 3.1 0.2 2.9
Ending Leverage Ratio - Convertible Debt 0.3 0.0 0.3 0.3 (0.0) 0.3
Ending Leverage Ratio - Total 3.2 (0.1) 3.1 3.4 0.1 3.2

Subsequent Events
12
1 While these acquisitions are expected to close, there can be no assurance that these acquisitions will close or that the terms thereof may not change
On April 26, 2018 we closed Ajax Mortgage Loan Trust 2018-A, a joint venture with two institutional investors, with an aggregate of
$128.0 million of senior securities and $32.0 million of equity issued with respect to $160.0 million of mortgage loans with 94%
RPLs. The senior securities represent 80% of the UPB of the underlying mortgage loans. The bonds may be sold by any party at a
future date. We have retained a 9.4% interest and expect to account for Ajax Mortgage Loan Trust 2018-A as an equity-method
investee
A dividend of $0.30 per share will be payable on May 30, 2018 to our stockholders of record as of May 15, 2018
Joint Venture Pending Acquisitions1
NPL
UPB: $123.7MM
Collateral Value: $155.6MM
Price/UPB: 79.5%
Price/Collateral Value: 63.2%
504 loans in 1 transaction
Ajax Mortgage Loan Trust 2018-A April Acquisition
RPL
UPB: $13.2MM
Collateral Value: $18.7MM
Price/UPB: 87.5%
Price/Collateral Value: 61.8%
42 loans in 1 transaction
Ajax Mortgage Loan Trust 2018-A Pre-funded Pending Acquisitions1
RPL
UPB: $138.3MM
Collateral Value: $223.0MM
Price/UPB: 92.1%
Price/Collateral Value: 57.1%
810 loans in 3 transactions
NPL
UPB: $5.8MM
Collateral Value: $8.5MM
Price/UPB: 57.5%
Price/Collateral Value: 39.6%
49 loans in 1 transaction
Non - Joint Venture Pending Acquisitions1
RPL
UPB: $18.1MM
Collateral Value: $27.8MM
Price/UPB: 91.9%
Price/Collateral Value: 60.0%
85 loans in 2 transactions

Consolidated Statements of Income
13
(Dollars in thousands except per share amounts) (Unaudited)
Three months ended
March 31,
2018
December 31,
2017
September 30,
2017
June 30,
2017
(unaudited) (unaudited) (unaudited) (unaudited)
INCOME:
Interest income $ 25,591 $ 24,367 $ 24,529 $ 21,721
Interest expense (12,494 ) (11,382 ) (10,775 ) (9,293 )
Net interest income 13,097 12,985 13,754 12,428
Income from investment in Manager 135 89 143 142
Other income 1,511 723 329 535
Total income 14,743 13,797 14,226 13,105
EXPENSE:
Related party expense - loan servicing fees 2,469 2,242 2,187 1,935
Related party expense - management fee 1,532 1,510 1,428 1,330
Loan transaction expense 355 214 290 442
Professional fees 609 856 497 507
Real estate operating expense 449 518 1,151 637
Other expense 991 871 910 886
Total expense 6,405 6,211 6,463 5,737
Loss on debt extinguishment — 913 — 218
Income before provision for income tax 8,338 6,673 7,763 7,150
Provision for income tax (benefit) 16 35 47 48
Consolidated net income 8,322 6,638 7,716 7,102
Less: consolidated net income attributable to non-
controlling interests 657
454
246
238
Consolidated net income attributable to common
stockholders $ 7,665
$ 6,184
$ 7,470
$ 6,864
Basic earnings per common share $ 0.41 $ 0.34 $ 0.41 $ 0.38
Diluted earnings per common share $ 0.38 $ 0.33 $ 0.38 $ 0.36
Weighted average shares – basic 18,508,089 18,236,488 18,072,045 18,008,499
Weighted average shares – diluted 26,395,158 26,111,202 25,246,764 23,026,679
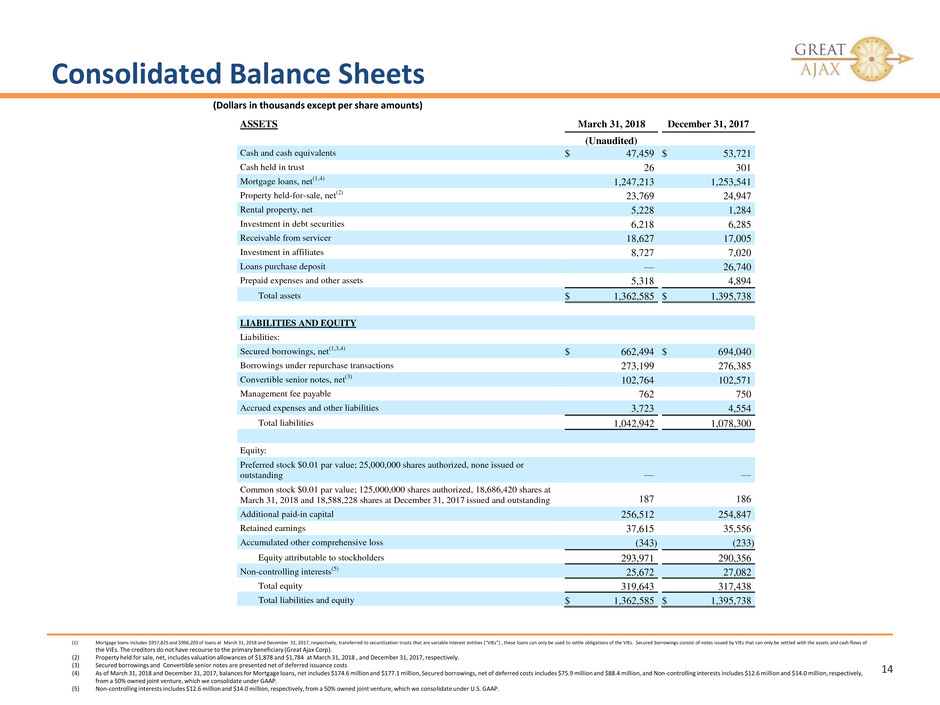
Consolidated Balance Sheets
14
(1) Mortgage loans includes $957,825 and $996,203 of loans at March 31, 2018 and December 31, 2017, respectively, transferred to securitization trusts that are variable interest entities (“VIEs”) , these loans can only be used to settle obligations of the VIEs. Secured borrowings consist of notes issued by VIEs that can only be settled with the assets and cash flows of
the VIEs. The creditors do not have recourse to the primary beneficiary (Great Ajax Corp).
(2) Property held for sale, net, includes valuation allowances of $1,878 and $1,784 at March 31, 2018 , and December 31, 2017, respectively.
(3) Secured borrowings and Convertible senior notes are presented net of deferred issuance costs
(4) As of March 31, 2018 and December 31, 2017, balances for Mortgage loans, net includes $174.6 million and $177.1 million, Secured borrowings, net of deferred costs includes $75.9 million and $88.4 million, and Non-controlling interests includes $12.6 million and $14.0 million, respectively,
from a 50% owned joint venture, which we consolidate under GAAP.
(5) Non-controlling interests includes $12.6 million and $14.0 million, respectively, from a 50% owned joint venture, which we consolidate under U.S. GAAP.
(Dollars in thousands except per share amounts)
ASSETS March 31, 2018 December 31, 2017
(Unaudited)
Cash and cash equivalents $ 47,459 $ 53,721
Cash held in trust 26 301
Mortgage loans, net(1,4) 1,247,213 1,253,541
Property held-for-sale, net(2) 23,769 24,947
Rental property, net 5,228 1,284
Investment in debt securities 6,218 6,285
Receivable from servicer 18,627 17,005
Investment in affiliates 8,727 7,020
Loans purchase deposit — 26,740
Prepaid expenses and other assets 5,318 4,894
Total assets $ 1,362,585 $ 1,395,738
LIABILITIES AND EQUITY
Liabilities:
Secured borrowings, net(1,3,4) $ 662,494 $ 694,040
Borrowings under repurchase transactions 273,199 276,385
Convertible senior notes, net(3) 102,764 102,571
Management fee payable 762 750
Accrued expenses and other liabilities 3,723 4,554
Total liabilities 1,042,942 1,078,300
Equity:
Preferred stock $0.01 par value; 25,000,000 shares authorized, none issued or
outstanding —
—
Common stock $0.01 par value; 125,000,000 shares authorized, 18,686,420 shares at
March 31, 2018 and 18,588,228 shares at December 31, 2017 issued and outstanding 187
186
Additional paid-in capital 256,512 254,847
Retained earnings 37,615 35,556
Accumulated other comprehensive loss (343 ) (233 )
Equity attributable to stockholders 293,971 290,356
Non-controlling interests(5) 25,672 27,082
Total equity 319,643 317,438
Total liabilities and equity $ 1,362,585 $ 1,395,738
