Attached files
| file | filename |
|---|---|
| 8-K - 8-K - TETRA TECHNOLOGIES INC | tti-8k_20180427.htm |
April 2018 TETRA Technologies, Inc. Reclassification of Prior Periods Financial Information for Segment Reporting and Discontinued Operations Exhibit. 99.1
RECLASSIFICATION OF PRIOR PERIODS FINANCIAL INFORMATION - EXPLANATORY NOTE As previously disclosed, on February 28, 2018, TETRA Technologies, Inc. (“TETRA”) completed its acquisition (the “Acquisition”) of Swiftwater Energy Services, LLC (“Swiftwater”). Swiftwater is engaged in the business of providing water management and water solutions to oil and gas operators in the Permian Basin market. As also previously disclosed, on March 1, 2018, TETRA completed its divestiture (the “Divestiture”) of its offshore heavy lift, plugging and abandonment, decommissioning, cutting, diving and related consulting businesses and the operations of Maritech Resources, LLC (“Maritech”), including Maritech’s offshore oil and gas leases. As a result of the Acquisition and the Divestiture, TETRA has reorganized its financial reporting segments and intends to manage its operations through three operating divisions: (i) Completion Fluids & Products, (ii) Water & Flowback Services, and (ii) Compression. TETRA previously had five financial reporting segments organized into four operating divisions: (i) Fluids, (ii) Production Testing, (iii) Compression, and (iv) Offshore. The Completion Fluids & Products operation was previously reported as part of the Fluids Division. The Fluids Division also included TETRA’s water management services operations (as they existed prior to the Acquisition). The Water & Flowback Services Division will include the expanded water management services operations and TETRA’s production testing operations. The operations of the former Offshore Division, which consisted of the previous Offshore Services segment and the Maritech segment, will be reported as discontinued operations. TETRA will utilize the new financial segment presentation in its Quarterly Report on Form 10-Q for the quarter ended March 31, 2018 and in TETRA’s related earnings release. In an effort to assist investors in their understanding of the new financial segment presentation and to facilitate the ability to more effectively evaluate and compare prior operating results with future operating results, TETRA is furnishing the following summary of unaudited historical financial information reclassified under the new financial segment presentation as well as on a consolidated basis. The following pages present unaudited historical financial information for the quarterly and annual periods in the three year period ended December 31, 2017 reclassified to conform to the new segment presentation, and excluding our discontinued operations. Reconciliations of all non-GAAP financial measurements to their nearest GAAP measurement are presented in the attached appendix.
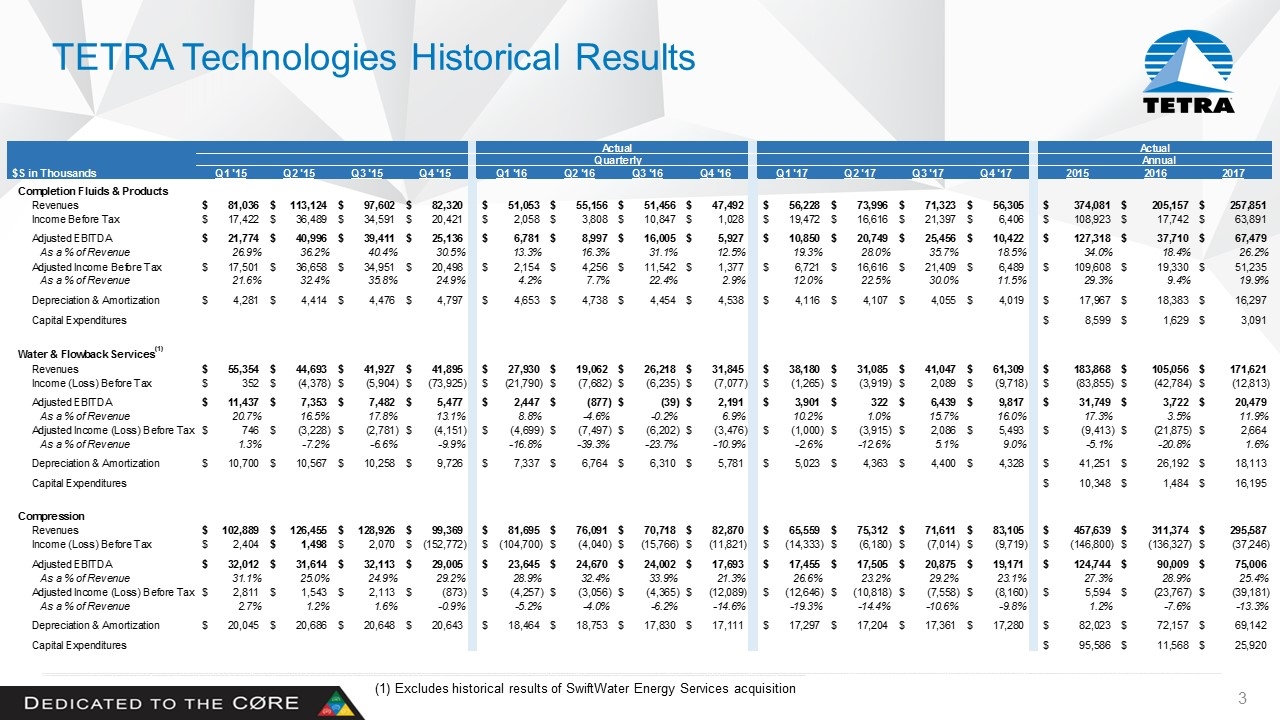
TETRA Technologies Historical Results (1) Excludes historical results of SwiftWater Energy Services acquisition New Segment Reporting Date Updated:4/26/2018ActualActualQuarterlyAnnual$S in ThousandsQ1 '15Q2 '15Q3 '15Q4 '15Q1 '16Q2 '16Q3 '16Q4 '16Q1 '17Q2 '17Q3 '17Q4 '17201520162017Completion Fluids & Products Revenues $81,036 $113,124 $97,602 $82,320 $51,053 $55,156 $51,456 $47,492 $56,228 $73,996 $71,323 $56,305 $374,081 $205,157 $257,851 $- Income Before Tax $17,422 $36,489 $34,591 $20,421 $2,058 $3,808 $10,847 $1,028 $19,472 $16,616 $21,397 $6,406 $108,923 $17,742 $63,891 $- Adjusted EBITDA $21,774 $40,996 $39,411 $25,136 $6,781 $8,997 $16,005 $5,927 $10,850 $20,749 $25,456 $10,422 $127,318 $37,710 $67,479 $- As a % of Revenue26.9%36.2%40.4%30.5%13.3%16.3%31.1%12.5%19.3%28.0%35.7%18.5%34.0%18.4%26.2%Adjusted Income Before Tax $17,501 $36,658 $34,951 $20,498 $2,154 $4,256 $11,542 $1,377 $6,721 $16,616 $21,409 $6,489 $109,608 $19,330 $51,235 $- As a % of Revenue21.6%32.4%35.8%24.9%4.2%7.7%22.4%2.9%12.0%22.5%30.0%11.5%29.3%9.4%19.9%Depreciation & Amortization $4,281 $4,414 $4,476 $4,797 $4,653 $4,738 $4,454 $4,538 $4,116 $4,107 $4,055 $4,019 $17,967 $18,383 $16,297 $- Capital Expenditures $8,599 $1,629 $3,091 $- Water & Flowback Services(1)Revenues $55,354 $44,693 $41,927 $41,895 $27,930 $19,062 $26,218 $31,845 $38,180 $31,085 $41,047 $61,309 $183,868 $105,056 $171,621 $- Income (Loss) Before Tax $352 $(4,378) $(5,904) $(73,925) $(21,790) $(7,682) $(6,235) $(7,077) $(1,265) $(3,919) $2,089 $(9,718) $(83,855) $(42,784) $(12,813) $- Adjusted EBITDA $11,437 $7,353 $7,482 $5,477 $2,447 $(877) $(39) $2,191 $3,901 $322 $6,439 $9,817 $31,749 $3,722 $20,479 $- As a % of Revenue20.7%16.5%17.8%13.1%8.8%-4.6%-0.2%6.9%10.2%1.0%15.7%16.0%17.3%3.5%11.9%Adjusted Income (Loss) Before Tax $746 $(3,228) $(2,781) $(4,151) $(4,699) $(7,497) $(6,202) $(3,476) $(1,000) $(3,915) $2,086 $5,493 $(9,413) $(21,875) $2,664 $- As a % of Revenue1.3%-7.2%-6.6%-9.9%-16.8%-39.3%-23.7%-10.9%-2.6%-12.6%5.1%9.0%-5.1%-20.8%1.6%Depreciation & Amortization $10,700 $10,567 $10,258 $9,726 $7,337 $6,764 $6,310 $5,781 $5,023 $4,363 $4,400 $4,328 $41,251 $26,192 $18,113 $- Capital Expenditures $10,348 $1,484 $16,195 $- Compression Revenues $102,889 $126,455 $128,926 $99,369 $81,695 $76,091 $70,718 $82,870 $65,559 $75,312 $71,611 $83,105 $457,639 $311,374 $295,587 $- Income (Loss) Before Tax $2,404 $1,498 $2,070 $(152,772) $(104,700) $(4,040) $(15,766) $(11,821) $(14,333) $(6,180) $(7,014) $(9,719) $(146,800) $(136,327) $(37,246) $- Adjusted EBITDA $32,012 $31,614 $32,113 $29,005 $23,645 $24,670 $24,002 $17,693 $17,455 $17,505 $20,875 $19,171 $124,744 $90,009 $75,006 $- As a % of Revenue31.1%25.0%24.9%29.2%28.9%32.4%33.9%21.3%26.6%23.2%29.2%23.1%27.3%28.9%25.4%Adjusted Income (Loss) Before Tax $2,811 $1,543 $2,113 $(873) $(4,257) $(3,056) $(4,365) $(12,089) $(12,646) $(10,818) $(7,558) $(8,160) $5,594 $(23,767) $(39,181) $- As a % of Revenue2.7%1.2%1.6%-0.9%-5.2%-4.0%-6.2%-14.6%-19.3%-14.4%-10.6%-9.8%1.2%-7.6%-13.3%Depreciation & Amortization $20,045 $20,686 $20,648 $20,643 $18,464 $18,753 $17,830 $17,111 $17,297 $17,204 $17,361 $17,280 $82,023 $72,157 $69,142 $- Capital Expenditures $95,586 $11,568 $25,920 $-
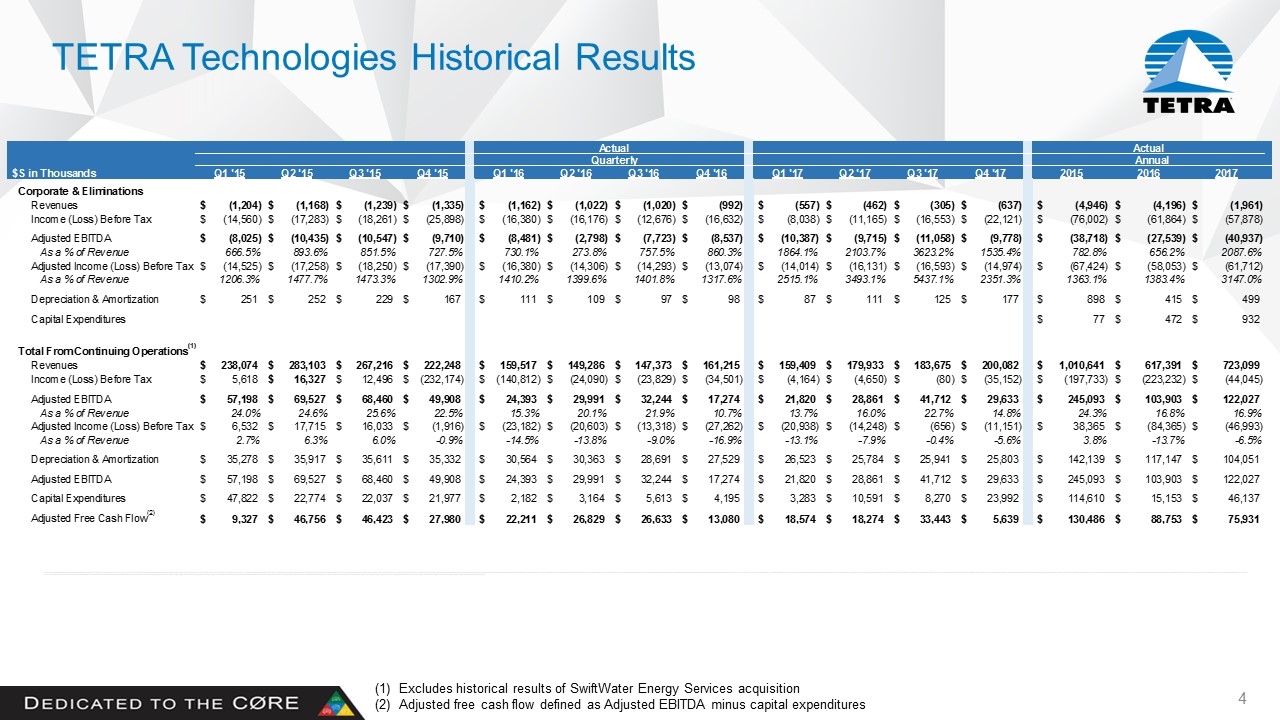
TETRA Technologies Historical Results Excludes historical results of SwiftWater Energy Services acquisition Adjusted free cash flow defined as Adjusted EBITDA minus capital expenditures New Segment Reporting Date Updated:4/26/2018ActualActualQuarterlyAnnual$S in ThousandsQ1 '15Q2 '15Q3 '15Q4 '15Q1 '16Q2 '16Q3 '16Q4 '16Q1 '17Q2 '17Q3 '17Q4 '17201520162017Corporate & Eliminations Revenues $(1,204) $(1,168) $(1,239) $(1,335) $(1,162) $(1,022) $(1,020) $(992) $(557) $(462) $(305) $(637) $(4,946) $(4,196) $(1,961) $- Income (Loss) Before Tax $(14,560) $(17,283) $(18,261) $(25,898) $(16,380) $(16,176) $(12,676) $(16,632) $(8,038) $(11,165) $(16,553) $(22,121) $(76,002) $(61,864) $(57,878) $- Adjusted EBITDA $(8,025) $(10,435) $(10,547) $(9,710) $(8,481) $(2,798) $(7,723) $(8,537) $(10,387) $(9,715) $(11,058) $(9,778) $(38,718) $(27,539) $(40,937) $0 As a % of Revenue666.5%893.6%851.5%727.5%730.1%273.8%757.5%860.3%1864.1%2103.7%3623.2%1535.4%782.8%656.2%2087.6%Adjusted Income (Loss) Before Tax $(14,525) $(17,258) $(18,250) $(17,390) $(16,380) $(14,306) $(14,293) $(13,074) $(14,014) $(16,131) $(16,593) $(14,974) $(67,424) $(58,053) $(61,712) $- As a % of Revenue1206.3%1477.7%1473.3%1302.9%1410.2%1399.6%1401.8%1317.6%2515.1%3493.1%5437.1%2351.3%1363.1%1383.4%3147.0%Depreciation & Amortization $251 $252 $229 $167 $111 $109 $97 $98 $87 $111 $125 $177 $898 $415 $499 $- Capital Expenditures $77 $472 $932 $- Total From Continuing Operations(1)Revenues $238,074 $283,103 $267,216 $222,248 $159,517 $149,286 $147,373 $161,215 $159,409 $179,933 $183,675 $200,082 $1,010,641 $617,391 $723,099 $- Income (Loss) Before Tax $5,618 $16,327 $12,496 $(232,174) $(140,812) $(24,090) $(23,829) $(34,501) $(4,164) $(4,650) $(80) $(35,152) $(197,733) $(223,232) $(44,045) $- Adjusted EBITDA $57,198 $69,527 $68,460 $49,908 $24,393 $29,991 $32,244 $17,274 $21,820 $28,861 $41,712 $29,633 $245,093 $103,903 $122,027 $- As a % of Revenue24.0%24.6%25.6%22.5%15.3%20.1%21.9%10.7%13.7%16.0%22.7%14.8%24.3%16.8%16.9%Adjusted Income (Loss) Before Tax $6,532 $17,715 $16,033 $(1,916) $(23,182) $(20,603) $(13,318) $(27,262) $(20,938) $(14,248) $(656) $(11,151) $38,365 $(84,365) $(46,993) $- As a % of Revenue2.7%6.3%6.0%-0.9%-14.5%-13.8%-9.0%-16.9%-13.1%-7.9%-0.4%-5.6%3.8%-13.7%-6.5%Depreciation & Amortization $35,278 $35,917 $35,611 $35,332 $30,564 $30,363 $28,691 $27,529 $26,523 $25,784 $25,941 $25,803 $142,139 $117,147 $104,051 $- Adjusted EBITDA $57,198 $69,527 $68,460 $49,908 $24,393 $29,991 $32,244 $17,274 $21,820 $28,861 $41,712 $29,633 $245,093 $103,903 $122,027 $- Capital Expenditures $47,822 $22,774 $22,037 $21,977 $2,182 $3,164 $5,613 $4,195 $3,283 $10,591 $8,270 $23,992 $114,610 $15,153 $46,137 $- Adjusted Free Cash Flow(2) $9,327 $46,756 $46,423 $27,980 $22,211 $26,829 $26,633 $13,080 $18,574 $18,274 $33,443 $5,639 $130,486 $88,753 $75,931 $-
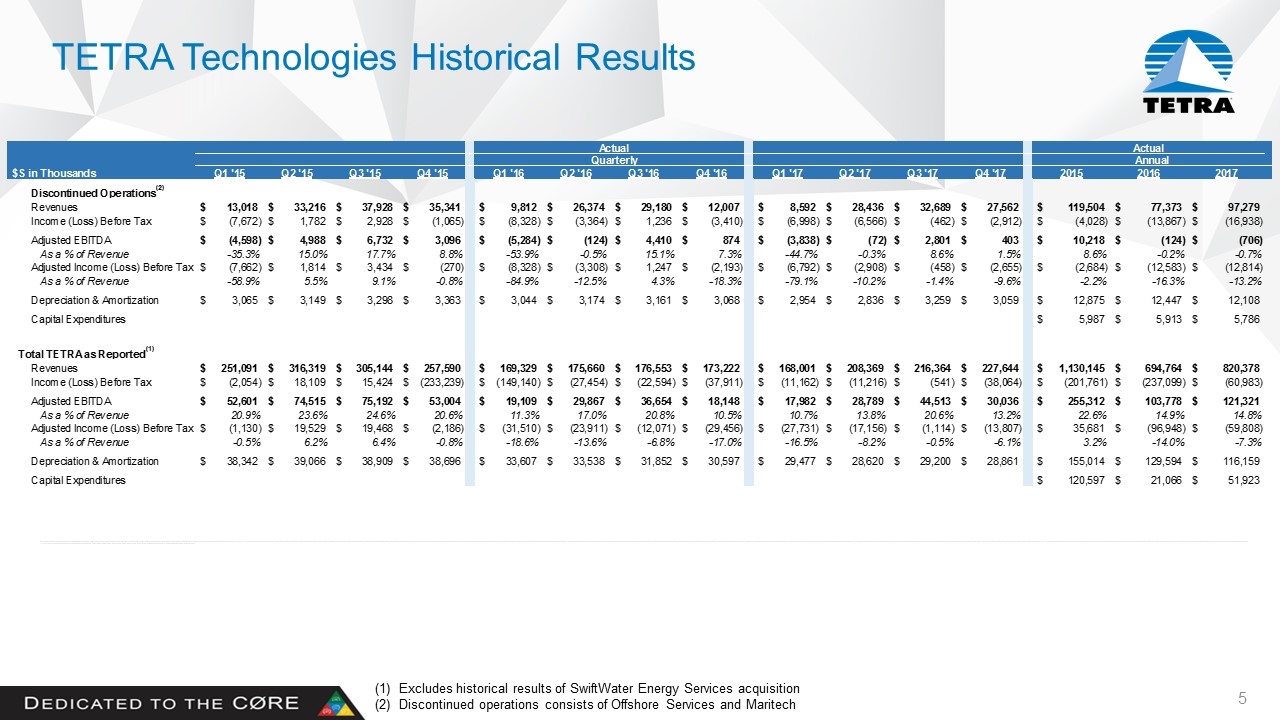
TETRA Technologies Historical Results Excludes historical results of SwiftWater Energy Services acquisition Discontinued operations consists of Offshore Services and Maritech New Segment Reporting Date Updated:4/26/2018ActualActualQuarterlyAnnual$S in ThousandsQ1 '15Q2 '15Q3 '15Q4 '15Q1 '16Q2 '16Q3 '16Q4 '16Q1 '17Q2 '17Q3 '17Q4 '17201520162017Discontinued Operations(2)Revenues $13,018 $33,216 $37,928 $35,341 $9,812 $26,374 $29,180 $12,007 $8,592 $28,436 $32,689 $27,562 $119,504 $77,373 $97,279 $- Income (Loss) Before Tax $(7,672) $1,782 $2,928 $(1,065) $(8,328) $(3,364) $1,236 $(3,410) $(6,998) $(6,566) $(462) $(2,912) $(4,028) $(13,867) $(16,938) $- Adjusted EBITDA $(4,598) $4,988 $6,732 $3,096 $(5,284) $(124) $4,410 $874 $(3,838) $(72) $2,801 $403 $10,218 $(124) $(706) $- As a % of Revenue-35.3%15.0%17.7%8.8%-53.9%-0.5%15.1%7.3%-44.7%-0.3%8.6%1.5%8.6%-0.2%-0.7%Adjusted Income (Loss) Before Tax $(7,662) $1,814 $3,434 $(270) $(8,328) $(3,308) $1,247 $(2,193) $(6,792) $(2,908) $(458) $(2,655) $(2,684) $(12,583) $(12,814) $- As a % of Revenue-58.9%5.5%9.1%-0.8%-84.9%-12.5%4.3%-18.3%-79.1%-10.2%-1.4%-9.6%-2.2%-16.3%-13.2%Depreciation & Amortization $3,065 $3,149 $3,298 $3,363 $3,044 $3,174 $3,161 $3,068 $2,954 $2,836 $3,259 $3,059 $12,875 $12,447 $12,108 $- Capital Expenditures $5,987 $5,913 $5,786 $- Total TETRA as Reported(1)Revenues $251,091 $316,319 $305,144 $257,590 $169,329 $175,660 $176,553 $173,222 $168,001 $208,369 $216,364 $227,644 $1,130,145 $694,764 $820,378 $- Income (Loss) Before Tax $(2,054) $18,109 $15,424 $(233,239) $(149,140) $(27,454) $(22,594) $(37,911) $(11,162) $(11,216) $(541) $(38,064) $(201,761) $(237,099) $(60,983) $- Adjusted EBITDA $52,601 $74,515 $75,192 $53,004 $19,109 $29,867 $36,654 $18,148 $17,982 $28,789 $44,513 $30,036 $255,312 $103,778 $121,321 $- As a % of Revenue20.9%23.6%24.6%20.6%11.3%17.0%20.8%10.5%10.7%13.8%20.6%13.2%22.6%14.9%14.8%Adjusted Income (Loss) Before Tax $(1,130) $19,529 $19,468 $(2,186) $(31,510) $(23,911) $(12,071) $(29,456) $(27,731) $(17,156) $(1,114) $(13,807) $35,681 $(96,948) $(59,808) $- As a % of Revenue-0.5%6.2%6.4%-0.8%-18.6%-13.6%-6.8%-17.0%-16.5%-8.2%-0.5%-6.1%3.2%-14.0%-7.3%Depreciation & Amortization $38,342 $39,066 $38,909 $38,696 $33,607 $33,538 $31,852 $30,597 $29,477 $28,620 $29,200 $28,861 $155,014 $129,594 $116,159 $- Capital Expenditures $120,597 $21,066 $51,923 $-
Non-GAAP Financial Measures This presentation includes non-GAAP financial measures, Adjusted EBITDA, Adjusted EBITDA as a percent of revenue, Adjusted income (loss) before taxes, Adjusted income (loss) before taxes as a percent of revenue, adjusted free cash flow. Adjusted EBITDA is used as a supplemental financial measure by the management to: evaluate the financial performance of assets without regard to financing methods, capital structure or historical cost basis; and determine the ability to incur and service debt and fund capital expenditures. Adjusted EBITDA is defined as earnings before interest, taxes, depreciation, amortization, impairments and special items, equity compensation, and allocated corporate TETRA’s overhead charges to our CSI Compressco LP subsidiary, pursuant to our Omnibus Agreement, which were reimbursed with CSI Compressco LP(CCLP) common units. Adjusted EBITDA as a percent of revenue is defined as Adjusted EBITDA divided by revenue. Adjusted income (loss) before taxes (and adjusted income (loss) before taxes as a percent of revenue) is defined as the Company's (or the segment's) income (loss) before taxes, excluding certain special or other charges (or credits). Adjusted income (loss) before taxes as a percent of revenue is defined as Adjusted income (loss) before taxes divided by revenue. Adjusted free cash flow is a non-GAAP measure that TETRA defines as Adjusted EBITDA minus capital expenditures. These non-GAAP financial measures should not be considered an alternative to net income, operating income, cash flows from operating activities or any other measure of financial performance presented in accordance with GAAP. These non-GAAP financial measures may not be comparable to EBITDA, or other similarly titled measures of other entities, as other entities may not calculate these non-GAAP financial measures in the same manner. Management compensates for the limitation of these non-GAAP financial measures as an analytical tool by reviewing the comparable GAAP measures, understanding the differences between the measures and incorporating this knowledge into management's decision making process.
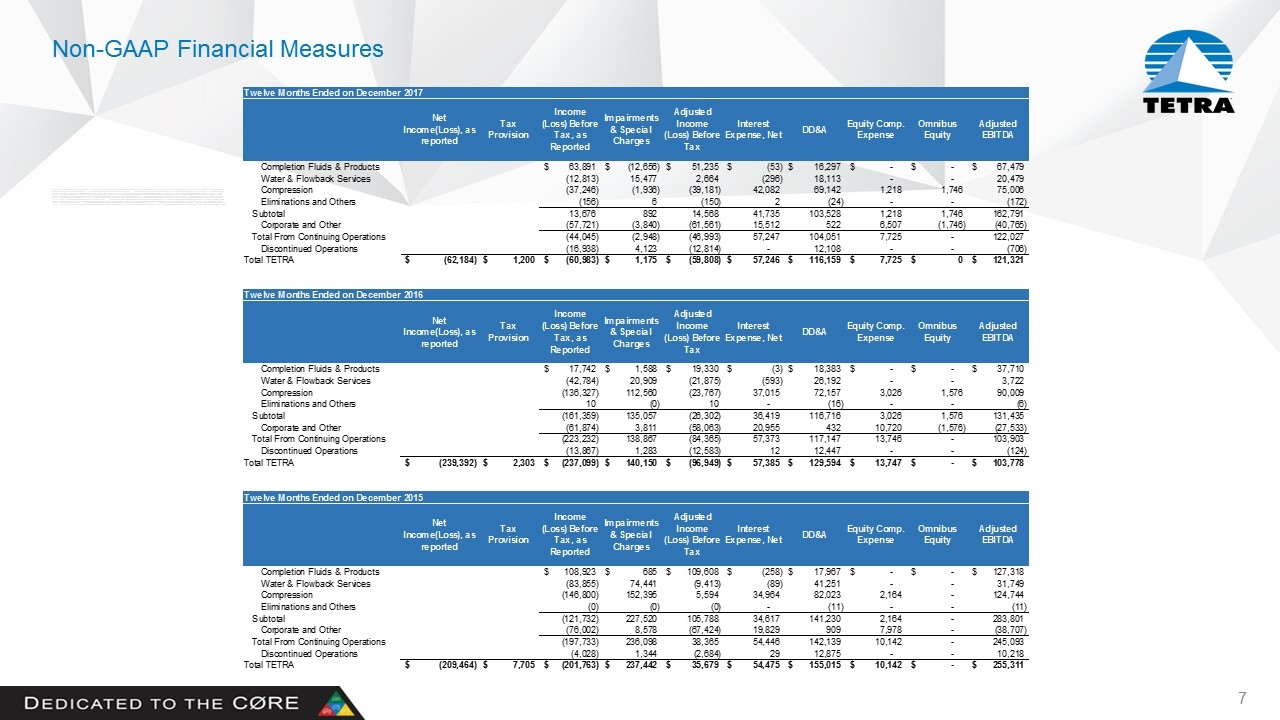
Non-GAAP Financial Measures Twelve Months Ended on December 2017Net Income(Loss), as reported Tax Provision Income (Loss) Before Tax, as Reported Impairments & Special Charges Adjusted Income (Loss) Before Tax Interest Expense, Net DD&A Equity Comp. Expense Omnibus Equity Adjusted EBITDA Completion Fluids & Products $63,891 $(12,656) $51,235 $(53) $16,297 $- $- $67,479 Water & Flowback Services (12,813) 15,477 2,664 (296) 18,113 - - 20,479 Compression (37,246) (1,936) (39,181) 42,082 69,142 1,218 1,746 75,006 Eliminations and Others (156) 6 (150) 2 (24) - - (172)Subtotal 13,676 892 14,568 41,735 103,528 1,218 1,746 162,791 Corporate and Other (57,721) (3,840) (61,561) 15,512 522 6,507 (1,746) (40,765)Total From Continuing Operations (44,045) (2,948) (46,993) 57,247 104,051 7,725 - 122,027 Discontinued Operations (16,938) 4,123 (12,814) - 12,108 - - (706)Total TETRA $(62,184) $1,200 $(60,983) $1,175 $(59,808) $57,246 $116,159 $7,725 $0 $121,321 Twelve Months Ended on December 2016Net Income(Loss), as reported Tax Provision Income (Loss) Before Tax, as Reported Impairments & Special Charges Adjusted Income (Loss) Before Tax Interest Expense, Net DD&A Equity Comp. Expense Omnibus Equity Adjusted EBITDA Completion Fluids & Products $17,742 $1,588 $19,330 $(3) $18,383 $- $- $37,710 Water & Flowback Services (42,784) 20,909 (21,875) (593) 26,192 - - 3,722 Compression (136,327) 112,560 (23,767) 37,015 72,157 3,026 1,576 90,009 Eliminations and Others 10 (0) 10 - (16) - - (6)Subtotal (161,359) 135,057 (26,302) 36,419 116,716 3,026 1,576 131,435 Corporate and Other (61,874) 3,811 (58,063) 20,955 432 10,720 (1,576) (27,533)Total From Continuing Operations (223,232) 138,867 (84,365) 57,373 117,147 13,746 - 103,903 Discontinued Operations (13,867) 1,283 (12,583) 12 12,447 - - (124)Total TETRA $(239,392) $2,303 $(237,099) $140,150 $(96,949) $57,385 $129,594 $13,747 $- $103,778 Twelve Months Ended on December 2015Net Income(Loss), as reported Tax Provision Income (Loss) Before Tax, as Reported Impairments & Special Charges Adjusted Income (Loss) Before Tax Interest Expense, Net DD&A Equity Comp. Expense Omnibus Equity Adjusted EBITDA Completion Fluids & Products $108,923 $685 $109,608 $(258) $17,967 $- $- $127,318 Water & Flowback Services (83,855) 74,441 (9,413) (89) 41,251 - - 31,749 Compression (146,800) 152,395 5,594 34,964 82,023 2,164 - 124,744 Eliminations and Others (0) (0) (0) - (11) - - (11)Subtotal (121,732) 227,520 105,788 34,617 141,230 2,164 - 283,801 Corporate and Other (76,002) 8,578 (67,424) 19,829 909 7,978 - (38,707)Total From Continuing Operations (197,733) 236,098 38,365 54,446 142,139 10,142 - 245,093 Discontinued Operations (4,028) 1,344 (2,684) 29 12,875 - - 10,218 Total TETRA $(209,464) $7,705 $(201,763) $237,442 $35,679 $54,475 $155,015 $10,142 $- $255,311
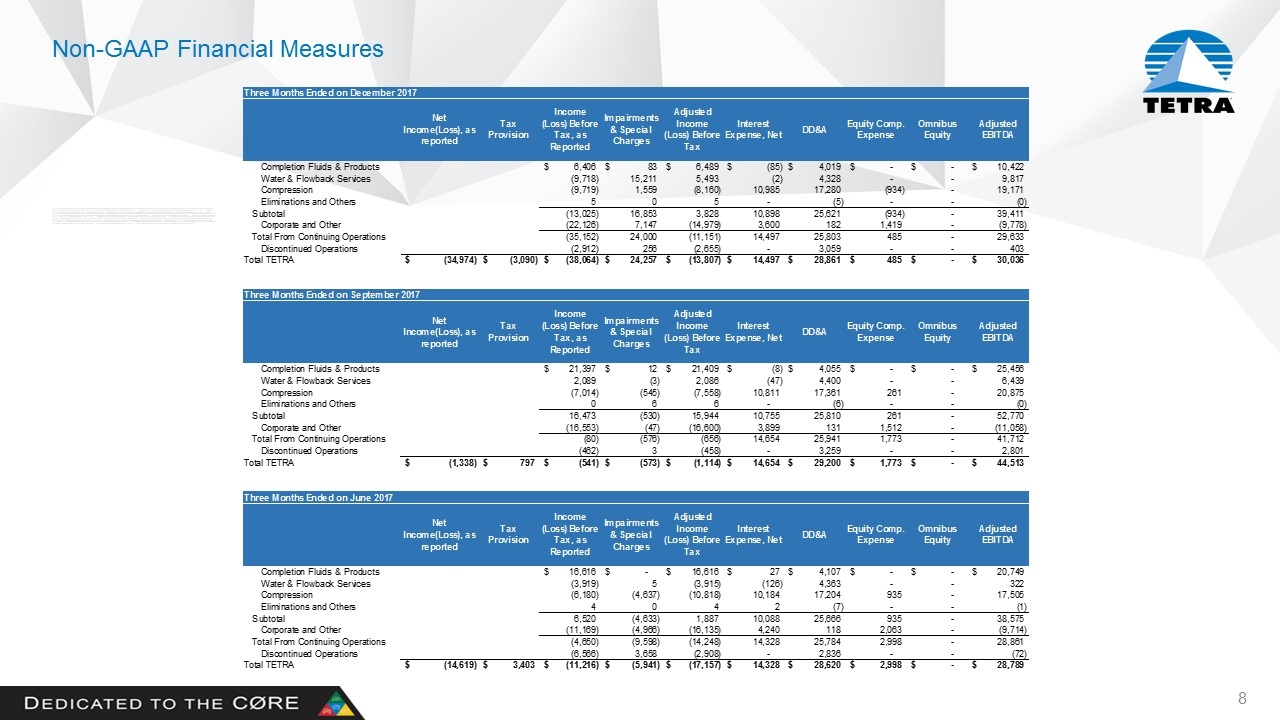
Non-GAAP Financial Measures Three Months Ended on December 2017Net Income(Loss), as reported Tax Provision Income (Loss) Before Tax, as Reported Impairments & Special Charges Adjusted Income (Loss) Before Tax Interest Expense, Net DD&A Equity Comp. Expense Omnibus Equity Adjusted EBITDA Completion Fluids & Products $6,406 $83 $6,489 $(85) $4,019 $- $- $10,422 Water & Flowback Services (9,718) 15,211 5,493 (2) 4,328 - - 9,817 Compression (9,719) 1,559 (8,160) 10,985 17,280 (934) - 19,171 Eliminations and Others 5 0 5 - (5) - - (0)Subtotal (13,025) 16,853 3,828 10,898 25,621 (934) - 39,411 Corporate and Other (22,126) 7,147 (14,979) 3,600 182 1,419 - (9,778)Total From Continuing Operations (35,152) 24,000 (11,151) 14,497 25,803 485 - 29,633 Discontinued Operations (2,912) 256 (2,655) - 3,059 - - 403 Total TETRA $(34,974) $(3,090) $(38,064) $24,257 $(13,807) $14,497 $28,861 $485 $- $30,036 Three Months Ended on September 2017Net Income(Loss), as reported Tax Provision Income (Loss) Before Tax, as Reported Impairments & Special Charges Adjusted Income (Loss) Before Tax Interest Expense, Net DD&A Equity Comp. Expense Omnibus Equity Adjusted EBITDA Completion Fluids & Products $21,397 $12 $21,409 $(8) $4,055 $- $- $25,456 Water & Flowback Services 2,089 (3) 2,086 (47) 4,400 - - 6,439 Compression (7,014) (545) (7,558) 10,811 17,361 261 - 20,875 Eliminations and Others 0 6 6 - (6) - - (0)Subtotal 16,473 (530) 15,944 10,755 25,810 261 - 52,770 Corporate and Other (16,553) (47) (16,600) 3,899 131 1,512 - (11,058)Total From Continuing Operations (80) (576) (656) 14,654 25,941 1,773 - 41,712 Discontinued Operations (462) 3 (458) - 3,259 - - 2,801 Total TETRA $(1,338) $797 $(541) $(573) $(1,114) $14,654 $29,200 $1,773 $- $44,513 Three Months Ended on June 2017Net Income(Loss), as reported Tax Provision Income (Loss) Before Tax, as Reported Impairments & Special Charges Adjusted Income (Loss) Before Tax Interest Expense, Net DD&A Equity Comp. Expense Omnibus Equity Adjusted EBITDA Completion Fluids & Products $16,616 $- $16,616 $27 $4,107 $- $- $20,749 Water & Flowback Services (3,919) 5 (3,915) (126) 4,363 - - 322 Compression (6,180) (4,637) (10,818) 10,184 17,204 935 - 17,505 Eliminations and Others 4 0 4 2 (7) - - (1)Subtotal 6,520 (4,633) 1,887 10,088 25,666 935 - 38,575 Corporate and Other (11,169) (4,966) (16,135) 4,240 118 2,063 - (9,714)Total From Continuing Operations (4,650) (9,598) (14,248) 14,328 25,784 2,998 - 28,861 Discontinued Operations (6,566) 3,658 (2,908) - 2,836 - - (72)Total TETRA $(14,619) $3,403 $(11,216) $(5,941) $(17,157) $14,328 $28,620 $2,998 $- $28,789
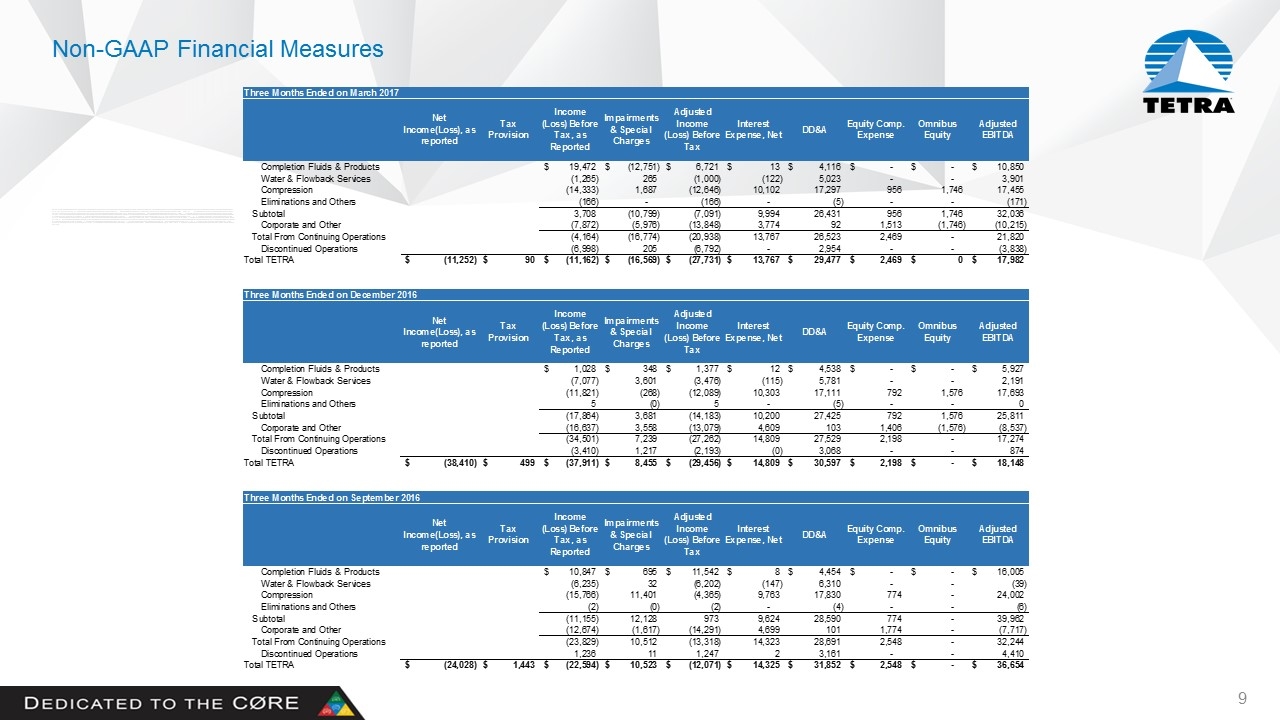
Non-GAAP Financial Measures Three Months Ended on March 2017Net Income(Loss), as reported Tax Provision Income (Loss) Before Tax, as Reported Impairments & Special Charges Adjusted Income (Loss) Before Tax Interest Expense, Net DD&A Equity Comp. Expense Omnibus Equity Adjusted EBITDA Completion Fluids & Products $19,472 $(12,751) $6,721 $13 $4,116 $- $- $10,850 Water & Flowback Services (1,265) 265 (1,000) (122) 5,023 - - 3,901 Compression (14,333) 1,687 (12,646) 10,102 17,297 956 1,746 17,455 Eliminations and Others (166) - (166) - (5) - - (171)Subtotal 3,708 (10,799) (7,091) 9,994 26,431 956 1,746 32,036 Corporate and Other (7,872) (5,976) (13,848) 3,774 92 1,513 (1,746) (10,215)Total From Continuing Operations (4,164) (16,774) (20,938) 13,767 26,523 2,469 - 21,820 Discontinued Operations (6,998) 205 (6,792) - 2,954 - - (3,838)Total TETRA $(11,252) $90 $(11,162) $(16,569) $(27,731) $13,767 $29,477 $2,469 $0 $17,982 Three Months Ended on December 2016Net Income(Loss), as reported Tax Provision Income (Loss) Before Tax, as Reported Impairments & Special Charges Adjusted Income (Loss) Before Tax Interest Expense, Net DD&A Equity Comp. Expense Omnibus Equity Adjusted EBITDA Completion Fluids & Products $1,028 $348 $1,377 $12 $4,538 $- $- $5,927 Water & Flowback Services (7,077) 3,601 (3,476) (115) 5,781 - - 2,191 Compression (11,821) (268) (12,089) 10,303 17,111 792 1,576 17,693 Eliminations and Others 5 (0) 5 - (5) - - 0 Subtotal (17,864) 3,681 (14,183) 10,200 27,425 792 1,576 25,811 Corporate and Other (16,637) 3,558 (13,079) 4,609 103 1,406 (1,576) (8,537)Total From Continuing Operations (34,501) 7,239 (27,262) 14,809 27,529 2,198 - 17,274 Discontinued Operations (3,410) 1,217 (2,193) (0) 3,068 - - 874 Total TETRA $(38,410) $499 $(37,911) $8,455 $(29,456) $14,809 $30,597 $2,198 $- $18,148 Three Months Ended on September 2016Net Income(Loss), as reported Tax Provision Income (Loss) Before Tax, as Reported Impairments & Special Charges Adjusted Income (Loss) Before Tax Interest Expense, Net DD&A Equity Comp. Expense Omnibus Equity Adjusted EBITDA Completion Fluids & Products $10,847 $695 $11,542 $8 $4,454 $- $- $16,005 Water & Flowback Services (6,235) 32 (6,202) (147) 6,310 - - (39)Compression (15,766) 11,401 (4,365) 9,763 17,830 774 - 24,002 Eliminations and Others (2) (0) (2) - (4) - - (6)Subtotal (11,155) 12,128 973 9,624 28,590 774 - 39,962 Corporate and Other (12,674) (1,617) (14,291) 4,699 101 1,774 - (7,717)Total From Continuing Operations (23,829) 10,512 (13,318) 14,323 28,691 2,548 - 32,244 Discontinued Operations 1,236 11 1,247 2 3,161 - - 4,410 Total TETRA $(24,028) $1,443 $(22,594) $10,523 $(12,071) $14,325 $31,852 $2,548 $- $36,654
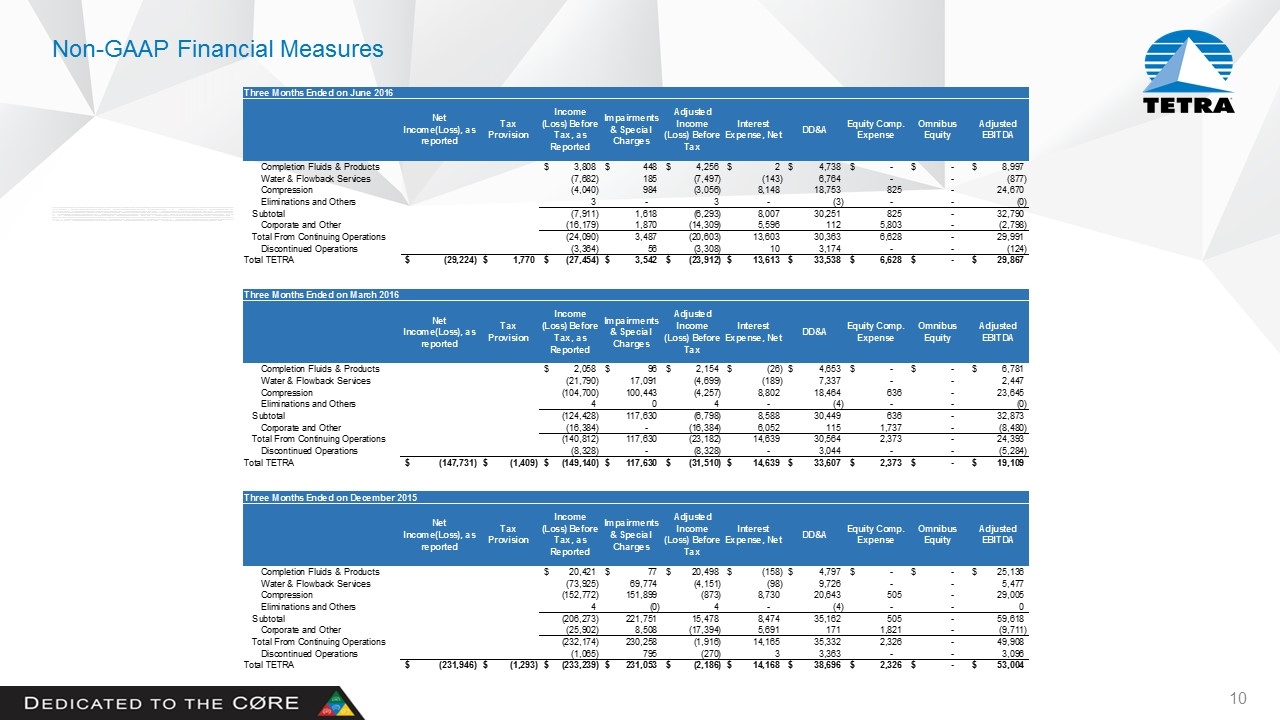
Non-GAAP Financial Measures Three Months Ended on June 2016Net Income(Loss), as reported Tax Provision Income (Loss) Before Tax, as Reported Impairments & Special Charges Adjusted Income (Loss) Before Tax Interest Expense, Net DD&A Equity Comp. Expense Omnibus Equity Adjusted EBITDA Completion Fluids & Products $3,808 $448 $4,256 $2 $4,738 $- $- $8,997 Water & Flowback Services (7,682) 185 (7,497) (143) 6,764 - - (877)Compression (4,040) 984 (3,056) 8,148 18,753 825 - 24,670 Eliminations and Others 3 - 3 - (3) - - (0)Subtotal (7,911) 1,618 (6,293) 8,007 30,251 825 - 32,790 Corporate and Other (16,179) 1,870 (14,309) 5,596 112 5,803 - (2,798)Total From Continuing Operations (24,090) 3,487 (20,603) 13,603 30,363 6,628 - 29,991 Discontinued Operations (3,364) 56 (3,308) 10 3,174 - - (124)Total TETRA $(29,224) $1,770 $(27,454) $3,542 $(23,912) $13,613 $33,538 $6,628 $- $29,867 Three Months Ended on March 2016Net Income(Loss), as reported Tax Provision Income (Loss) Before Tax, as Reported Impairments & Special Charges Adjusted Income (Loss) Before Tax Interest Expense, Net DD&A Equity Comp. Expense Omnibus Equity Adjusted EBITDA Completion Fluids & Products $2,058 $96 $2,154 $(26) $4,653 $- $- $6,781 Water & Flowback Services (21,790) 17,091 (4,699) (189) 7,337 - - 2,447 Compression (104,700) 100,443 (4,257) 8,802 18,464 636 - 23,645 Eliminations and Others 4 0 4 - (4) - - (0)Subtotal (124,428) 117,630 (6,798) 8,588 30,449 636 - 32,873 Corporate and Other (16,384) - (16,384) 6,052 115 1,737 - (8,480)Total From Continuing Operations (140,812) 117,630 (23,182) 14,639 30,564 2,373 - 24,393 Discontinued Operations (8,328) - (8,328) - 3,044 - - (5,284)Total TETRA $(147,731) $(1,409) $(149,140) $117,630 $(31,510) $14,639 $33,607 $2,373 $- $19,109 Three Months Ended on December 2015Net Income(Loss), as reported Tax Provision Income (Loss) Before Tax, as Reported Impairments & Special Charges Adjusted Income (Loss) Before Tax Interest Expense, Net DD&A Equity Comp. Expense Omnibus Equity Adjusted EBITDA Completion Fluids & Products $20,421 $77 $20,498 $(158) $4,797 $- $- $25,136 Water & Flowback Services (73,925) 69,774 (4,151) (98) 9,726 - - 5,477 Compression (152,772) 151,899 (873) 8,730 20,643 505 - 29,005 Eliminations and Others 4 (0) 4 - (4) - - 0 Subtotal (206,273) 221,751 15,478 8,474 35,162 505 - 59,618 Corporate and Other (25,902) 8,508 (17,394) 5,691 171 1,821 - (9,711)Total From Continuing Operations (232,174) 230,258 (1,916) 14,165 35,332 2,326 - 49,908 Discontinued Operations (1,065) 795 (270) 3 3,363 - - 3,096 Total TETRA $(231,946) $(1,293) $(233,239) $231,053 $(2,186) $14,168 $38,696 $2,326 $- $53,004
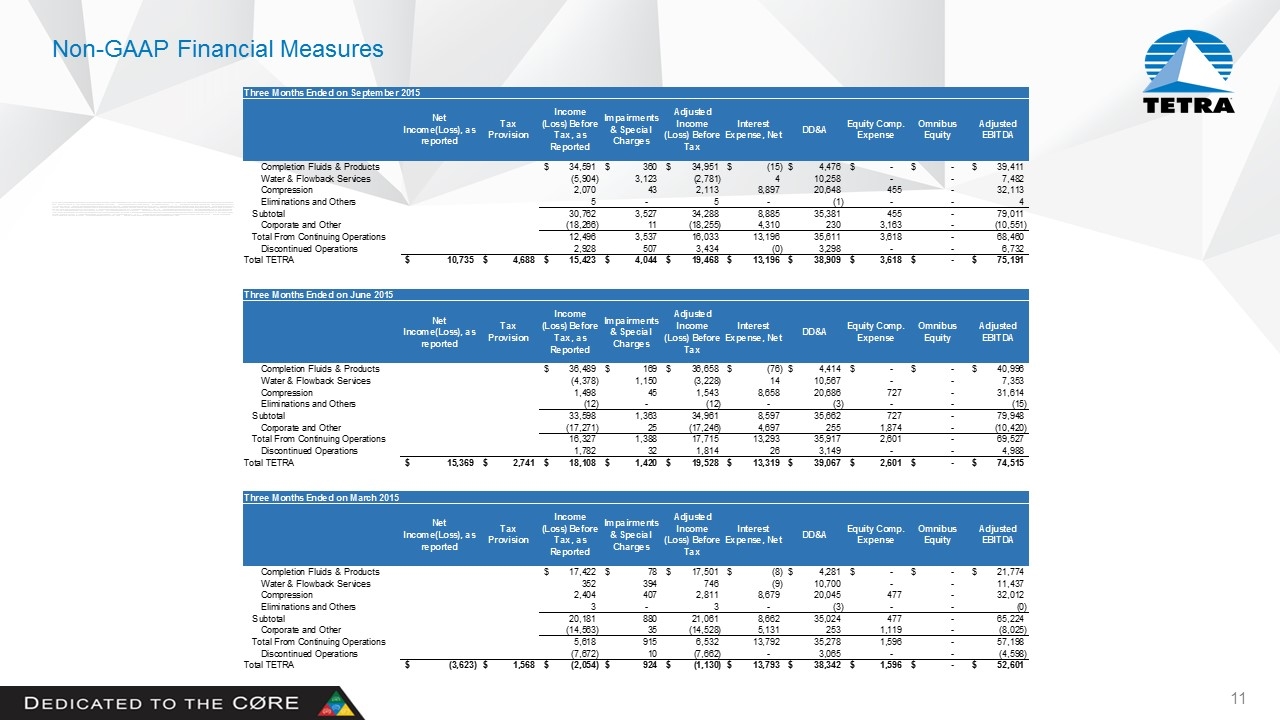
Non-GAAP Financial Measures Three Months Ended on September 2015Net Income(Loss), as reported Tax Provision Income (Loss) Before Tax, as Reported Impairments & Special Charges Adjusted Income (Loss) Before Tax Interest Expense, Net DD&A Equity Comp. Expense Omnibus Equity Adjusted EBITDA Completion Fluids & Products $34,591 $360 $34,951 $(15) $4,476 $- $- $39,411 Water & Flowback Services (5,904) 3,123 (2,781) 4 10,258 - - 7,482 Compression 2,070 43 2,113 8,897 20,648 455 - 32,113 Eliminations and Others 5 - 5 - (1) - - 4 Subtotal 30,762 3,527 34,288 8,885 35,381 455 - 79,011 Corporate and Other (18,266) 11 (18,255) 4,310 230 3,163 - (10,551)Total From Continuing Operations 12,496 3,537 16,033 13,196 35,611 3,618 - 68,460 Discontinued Operations 2,928 507 3,434 (0) 3,298 - - 6,732 Total TETRA $10,735 $4,688 $15,423 $4,044 $19,468 $13,196 $38,909 $3,618 $- $75,191 Three Months Ended on June 2015Net Income(Loss), as reported Tax Provision Income (Loss) Before Tax, as Reported Impairments & Special Charges Adjusted Income (Loss) Before Tax Interest Expense, Net DD&A Equity Comp. Expense Omnibus Equity Adjusted EBITDA Completion Fluids & Products $36,489 $169 $36,658 $(76) $4,414 $- $- $40,996 Water & Flowback Services (4,378) 1,150 (3,228) 14 10,567 - - 7,353 Compression 1,498 45 1,543 8,658 20,686 727 - 31,614 Eliminations and Others (12) - (12) - (3) - - (15)Subtotal 33,598 1,363 34,961 8,597 35,662 727 - 79,948 Corporate and Other (17,271) 25 (17,246) 4,697 255 1,874 - (10,420)Total From Continuing Operations 16,327 1,388 17,715 13,293 35,917 2,601 - 69,527 Discontinued Operations 1,782 32 1,814 26 3,149 - - 4,988 Total TETRA $15,369 $2,741 $18,108 $1,420 $19,528 $13,319 $39,067 $2,601 $- $74,515 Three Months Ended on March 2015Net Income(Loss), as reported Tax Provision Income (Loss) Before Tax, as Reported Impairments & Special Charges Adjusted Income (Loss) Before Tax Interest Expense, Net DD&A Equity Comp. Expense Omnibus Equity Adjusted EBITDA Completion Fluids & Products $17,422 $78 $17,501 $(8) $4,281 $- $- $21,774 Water & Flowback Services 352 394 746 (9) 10,700 - - 11,437 Compression 2,404 407 2,811 8,679 20,045 477 - 32,012 Eliminations and Others 3 - 3 - (3) - - (0)Subtotal 20,181 880 21,061 8,662 35,024 477 - 65,224 Corporate and Other (14,563) 35 (14,528) 5,131 253 1,119 - (8,025)Total From Continuing Operations 5,618 915 6,532 13,792 35,278 1,596 - 57,198 Discontinued Operations (7,672) 10 (7,662) - 3,065 - - (4,598)Total TETRA $(3,623) $1,568 $(2,054) $924 $(1,130) $13,793 $38,342 $1,596 $- $52,601
