Attached files
| file | filename |
|---|---|
| EX-99.4 - RECONCILIATION OF NON-GAAP FINANCIAL MEASURES - SANDRIDGE ENERGY INC | sd3413631-ex994.htm |
| EX-31.4 - SECTION 302 CERTIFICATION-CHIEF FINANCIAL OFFICER - SANDRIDGE ENERGY INC | sd3413631-ex314.htm |
| EX-31.3 - SECTION 302 CERTIFICATION-CHIEF EXECUTIVE OFFICER - SANDRIDGE ENERGY INC | sd3413631-ex313.htm |
UNITED STATES
SECURITIES AND EXCHANGE COMMISSION
Washington, D.C. 20549
_____________________
Form 10-K/A
(Amendment No. 1)
_____________________
| (Mark One) | |
| ☑ | ANNUAL REPORT PURSUANT TO SECTION 13 OR 15(d) OF THE SECURITIES EXCHANGE ACT OF 1934 |
| For the fiscal year ended December 31, 2017 | |
| OR | |
| ☐ | TRANSITION REPORT PURSUANT TO SECTION 13 OR 15(d) OF THE SECURITIES EXCHANGE ACT OF 1934 |
| For the transition period from to |
| Commission File Number: 001-33784 |
| SANDRIDGE ENERGY, INC. |
| (Exact name of registrant as specified in its charter) |
| Delaware | 20-8084793 |
| (State or other jurisdiction | (I.R.S. Employer |
| of incorporation or organization) | Identification No.) |
| 123 Robert S. Kerr Avenue | |
| Oklahoma City, Oklahoma | 73102 |
| (Address of principal executive offices) | (Zip code) |
| (405) 429-5500 | ||
| (Registrant’s telephone number, including area code) | ||
| Securities registered pursuant to Section 12(b) of the Act: | ||
| Title of Each Class | Name of Each Exchange on Which Registered | |
| Common Stock, $0.001 par value | New York Stock Exchange | |
| Securities registered pursuant to Section 12(g) of the Act: | ||
| None | ||
Indicate by check mark if the registrant is a well-known seasoned issuer, as defined in Rule 405 of the Securities Act. Yes ☐ No ☑
Indicate by check mark if the registrant is not required to file reports pursuant to Section 13 or Section 15(d) of the Act. Yes ☐ No ☑
Indicate by check mark whether the registrant (1) has filed all reports required to be filed by Section 13 or 15(d) of the Securities Exchange Act of 1934 during the preceding 12 months (or for such shorter period that the registrant was required to file such reports), and (2) has been subject to such filing requirements for the past 90 days. Yes ☑ No ☐
Indicate by check mark whether the registrant has submitted electronically and posted on its corporate website, if any, every Interactive Data File required to be submitted and posted pursuant to Rule 405 of Regulation S-T during the preceding 12 months (or for such shorter period that the registrant was required to submit and post such files). Yes ☑ No ☐
Indicate by check mark if disclosure of delinquent filers pursuant to Item 405 of Regulation S-K is not contained herein, and will not be contained, to the best of registrant’s knowledge, in definitive proxy or information statements incorporated by reference in Part III of this Form 10-K or any amendment to this Form 10-K. ☑
Indicate by check mark whether the registrant has filed all documents and reports required to be filed by Section 12, 13 or 15(d) of the Securities Exchange Act of 1934 subsequent to the distribution of securities under a plan confirmed by a court. Yes ☑ No ☐
Indicate by check mark whether the registrant is a large accelerated filer, an accelerated filer, a non-accelerated filer, a smaller reporting company, or an emerging growth company. See the definitions of “large accelerated filer,” “accelerated filer,” “smaller reporting company,” and “emerging growth company” in Rule 12b-2 of the Exchange Act.
| Large accelerated filer ☐ | Accelerated filer ☑ | |
| Non-accelerated filer ☐ (Do not check if a smaller reporting company) | Smaller reporting company ☐ | |
| Emerging growth company ☐ |
If an emerging growth company, indicate by check mark if the registrant has elected not to use the extended transition period for complying with any new or revised financial accounting standards provided pursuant to Section 13(a) of the Exchange Act. ☐
Indicate by check mark whether the registrant is a shell company (as defined in Rule 12b-2 of the Exchange Act). Yes ☐ No ☑
The aggregate market value of our common stock held by non-affiliates on June 30, 2017 was approximately $586.9 million based on the closing price as quoted on the New York Stock Exchange. As of April 20, 2018 there were 35,402,981 shares of our common stock outstanding.
DOCUMENTS INCORPORATED BY REFERENCE
None.
EXPLANATORY NOTE
The purpose of this Amendment No. 1 to SandRidge Energy, Inc’s Annual Report on Form 10-K for the fiscal year ended December 31, 2017 (this “Report”), filed with the U.S. Securities and Exchange Commission (the “SEC”) on February 22, 2018 (the “Original Report”), is to amend Part III, Items 10 through 14 of the Original Report to include information previously omitted from the Original Report in reliance on General Instructions G to Form 10-K, which provides that registrants may incorporate by reference certain information from a definitive proxy statement filed with the SEC within 120 days after the end of the fiscal year.
We are also amending Part IV, Item 15 of the Original Report to include certain exhibits to be filed with this Amendment No. 1 to the Original Report.
Except as described above, this Amendment No. 1 to the Original Report does not amend, update or change any other items or disclosures in the Original Report and does not purport to reflect information or events subsequent to the filing thereof.
References in this report to the “Company,” “SandRidge,” “we,” “our,” and “us” mean SandRidge Energy, Inc., including its consolidated subsidiaries and variable interest entities of which it is the primary beneficiary.
Item 10. Directors, Executive Officers and Corporate Governance
The names of the members of our Board of Directors (the “Board”) and certain information concerning each of them as of April 30, 2017 are set forth below.
Members of the Board of Directors
| Name | Age | Position | ||
| Sylvia K. Barnes | 61 | Director | ||
| Kenneth H. Beer | 60 | Director | ||
| Michael L. Bennett | 64 | Chairman | ||
| William M. Griffin, Jr. | 58 | Director | ||
| David J. Kornder | 57 | Director |
Sylvia K. Barnes. Ms. Barnes has served as a director since February 2018. Ms. Barnes has over thirty years of oil & gas finance experience and a background in engineering. Since April 2015, Ms. Barnes has been Principal and owner of Tanda Resources LLC, a privately-held oil and gas investment and consulting company. From 2011 to April 2015, Ms. Barnes served as Managing Director and Group Head for KeyBanc Capital Markets Oil & Gas Investment and Corporate Banking Group and was a member of the firm’s Executive Committee. Prior to joining KeyBanc, Ms. Barnes was Head of Energy Investment Banking at Madison Williams from 2009 to 2011, and Managing Director at Merrill Lynch’s energy investment banking practice. She joined Merrill as part of the firm’s acquisition of Petrie Parkman & Co. From 1994 to 2000, Ms. Barnes worked as Managing Director and SVP for Nesbitt Burns, including serving as head of the firm’s U.S. energy investment banking group. Prior to that she worked in various capacities at Nesbitt Burns and its parent company, Bank of Montreal. As a banker Ms. Barnes devoted her career to serving companies in the upstream oil and gas sector and she successfully executed a variety of mergers, acquisitions and divestiture transactions, and advised on public and private equity offerings and private debt and equity placements. Ms. Barnes currently services as a member on the board of directors of Pure Acquisition Corp (NASDAQ: PACQU), where she is Chair of the audit committee and a member of the nominating & governance and compensation committees. Ms. Barnes previously served on the Board of Directors of Halcon Resources Corporation (NYSE: HK) and as a member of its audit and reserves committees. Ms. Barnes began her career as a reservoir engineer for Esso Resources. Ms. Barnes graduated from the University of Manitoba with a Bachelor of Science in Engineering (Dean’s List), was a licensed professional engineer in Alberta and earned a Masters of Business Administration in Finance from York University. She is experienced in advising boards of directors, special committees and executive management on financial decisions with strategic and governance considerations including mergers & acquisitions, being responsible for strategic growth initiatives, budgets and P&L, and raising private and public capital. Ms. Barnes’ experience provides her with valuable insights into corporate strategy, capital allocation, equity and debt financing and the assessment and management of risks faced by energy companies.
The Board believes Ms. Barnes’ extensive financial analysis and transaction experience and knowledge of the oil and gas industry qualifies her to serve on the Board.
Kenneth H. Beer. Mr. Beer has served as a director since April 2018. Mr. Beer has nearly forty years of financial analysis, transactional and managerial experience, as well as knowledge of the oil & gas industry. Since January 2011, Mr. Beer has been the Executive Vice President and Chief Financial Officer of Stone Energy Corporation, an oil and natural gas exploration and production company, prior to which, he served as the Senior Vice President and Chief Financial Officer from August 2005. During this time, he has been responsible for significant financial transactions including equity and debt offerings, investor relations, financial analysis and planning, risk management, marketing, IT and facilities. From 1992 to 2005, Mr. Beer was Partner and Director of Equity Research of Johnson Rice & Company, an energy brokerage and investment bank. From 1986 to 1992, Mr. Beer worked at Howard Weil, a U.S. energy investment business. From 1984 to 1985, Mr. Beer worked at Wood Mackenzie/Gintel, a research and consulting business for global energy, chemicals, metals and mining industries. From 1979 to 1981, Mr. Beer worked at Boston Consulting Group, a global management and strategy consulting firm. Additionally, Mr. Beer has previously served on the board of directors of International Shipholding (NYSE: ISH), including on its audit (chairman), compensation (chairman) and governance committees, and he currently serves as a board member of certain private entities. Mr. Beer has a Master’s of Business Administration from Stanford University and an A.B. in Economics from Dartmouth College.
1
The Board believes that Mr. Beer’s financial analysis, transactional and managerial experience, as well as his knowledge of the oil and gas industry, service on other public company boards and his background in overseeing public company financial management and reporting qualify him to serve on the Board.
Michael L. Bennett. Mr. M. Bennett has served as a director since October 2016. Mr. M. Bennett has over forty years of technical and managerial experience in the petrochemical industry. From 1973 until 2010, Mr. M. Bennett was an employee of Terra Industries Inc., a manufacturer of nitrogen products. During such time he served in a variety of leadership roles, including Executive Vice President and Chief Operating Officer, from February 1997 until April 2001, and President and Chief Executive Officer, from April 2001 until April 2010, when the company was acquired by CF Industries. Since May 2010, Mr. M. Bennett has been a private investor with Albaton Enterprises LLC in Sioux City, Iowa. Mr. M. Bennett currently serves as Chairman of the board of directors of OCI N.V. (NYSE Euronext: OCI), a producer of nitrogen fertilizers, methanol, and other natural gas-based products, serving agricultural and industrial customers from the Americas to Asia. Mr. M. Bennett also serves as Chairman of the board of directors of OCI Partners, L.P. (NYSE: OCIP), which operates OCI Beaumont, the largest integrated ammonia and methanol production complex in the United States. In addition, Mr. M. Bennett previously served on the board of directors of Alliant Energy (NYSE: LNT) and is a past Chairman of the board of The Fertilizer Institute, the Methanol Institute, the Agribusiness Association of Iowa, and Morningside College.
The Board believes Mr. M. Bennett’s senior management experience, his service on other public company boards and his background in overseeing public company financial management and reporting qualifies him to serve on the Board.
William (Bill) M. Griffin. Mr. B. Griffin has served as a director since October 2016 and Interim President and Chief Executive Officer (“CEO”) of SandRidge since February 2018. Mr. B. Griffin has over thirty-five years of technical and leadership experience with active public and privately owned upstream energy organizations in most oil and gas basins throughout the United States and Gulf of Mexico. Mr. B. Griffin most recently served as President and CEO of Petro Harvester Oil & Gas, a private equity based company with oil production and asset development in the Williston Basin and U.S. Gulf Coast from 2012 to August 2015. Mr. B. Griffin founded and served as President of Ironwood Oil & Gas, a privately held upstream organization focused on acquisition and self-development of Texas horizontal natural gas fields and opportunities from 2008 to 2012. From 1999 to 2007, he had full business responsibilities for various U.S. onshore and offshore basins with El Paso Exploration and Production Company, ultimately serving as Sr. Vice President, Onshore U.S. Division. He held various technical and asset management positions, including District Vice President with Sonat Exploration Company, an oil and natural gas exploration and production business from 1990 to 1999 and began his career serving in various petroleum engineering and operations roles during tenure with TXO Production Corp., an oil and natural gas production company from 1981 to 1990. In addition to Petro Harvester Oil & Gas, Mr. B. Griffin previously served on the boards of Black Warrior Methane Corp. and Four Star Oil & Gas Company. Mr. B. Griffin is a registered professional engineer with a B.S. in mechanical engineering from Texas A&M University.
The Board believes Mr. B. Griffin’s senior management experience in the exploration and production industry and his operational/technical experience in the exploration and production industry qualifies him to serve on the Board.
David J. Kornder. Mr. Kornder has served as a director since October 2016. Mr. Kornder has over twenty five years of experience in oil and gas and finance. In November 2016, Mr. Kornder co-founded Sequel Energy Group LLC, a privately held oil and gas company for which he serves as a Managing Director. Sequel Energy Group is financially backed by GSO Capital Partners and is focused on making investments in non-operated drilling joint ventures in proven areas with experienced oil and gas teams. From September 2008 until June 2015, Mr. Kornder served as President and Chief Executive Officer of Cornerstone Natural Resources, LLC, a privately held independent oil and gas company primarily focused on drilling and production in the Williston Basin in North Dakota. Previously, Mr. Kornder served as the Executive Vice President and Chief Financial Officer at BioFuel Energy Corp., a publicly traded ethanol production company, as Senior Vice President and Chief Financial Officer at Petrie, Parkman, LLC, a privately held investment bank focused on the energy sector, and as Executive Vice President, Chief Financial Officer and Director for Patina Oil & Gas Corporation, a publicly traded oil and gas company. Mr. Kornder also worked as the Assistant Vice President – Finance at Gillett Group Management and as a senior accountant with Deloitte, Haskins & Sells. Mr. Kornder presently serves on the boards of 3 Bear Energy, LLC, and Bear Cub Energy, both privately held midstream energy companies, and as a director of the Colorado Oil & Gas Association. Mr. Kornder holds a B.A. in accounting from Montana State University.
2
The Board believes Mr. Kornder’s senior management experience in the exploration and production industry, his prior service on other public company boards, his background in energy-focused investing and capital raising activities and his background in overseeing public company financial management and reporting qualifies him to serve on the Board.
Executive Officers
Set forth below is information regarding each of our executive officers as of April 30, 2018:
| Name | Age | Position | ||
| William (“Bill”) M. Griffin | 58 | President and CEO | ||
| Michael A. Johnson | 52 | Senior Vice President, Chief Financial Officer and Chief Accounting Officer | ||
| John P. Suter | 57 | Executive Vice President and Chief Operating Officer | ||
| Philip T. Warman | 47 | Executive Vice President, General Counsel and Corporate Secretary |
Bill Griffin. Mr. B. Griffin was named President and CEO, effective February 8, 2018 on an interim basis. Biographical information about Mr. B. Griffin can be found above under the heading “Directors, Executive Officers and Corporate Governance —Members of the Board of Directors.”
Michael A. Johnson. Mr. Johnson was named Chief Financial Officer, effective at the close of business on February 22, 2018 on an interim basis. Mr. Johnson joined SandRidge in August 2017 as the Company’s Senior Vice President and Chief Accounting Officer. Prior to that, Mr. Johnson served as Senior Vice President – Accounting, Controller and Chief Accounting Officer at Chesapeake Energy Corporation from 2000 until May 10, 2017 and served as its Vice President of Accounting and Financial Reporting from 1998 to 2000 and as Assistant Controller from 1993 to 1998. From 1991 to 1993, Mr. Johnson served as Project Manager of Phibro Energy Production, Inc. From 1987 to 1991, he served as an Audit Manager of Arthur Andersen & Co. Mr. Johnson is a Certified Public Accountant and graduated from the University of Texas at Austin in 1987.
John P. Suter. Mr. Suter was appointed as Executive Vice President and Chief Operating Officer effective December 1, 2016. Mr. Suter joined SandRidge in April 2015 as Senior Vice President of Mid-Continent Operations, bringing with him extensive experience in the exploration and production sector, including most recently serving as Vice President of the Woodford business unit at American Energy Partners, LP from November 2013 to April 2015. From May 2010 to September 2013, he served as Vice President of Operations for Chesapeake Energy Corporation’s Western Division, and before that, as Chesapeake’s District Manager for the Barnett Shale and Southern Oklahoma assets. Before joining Chesapeake Energy, Mr. Suter served in various operational roles at Continental Resources, Inc., Cabot Oil & Gas Corporation and Petro-Lewis Corporation. He holds a Bachelor of Science degree in Petroleum Engineering from Texas Tech University.
Philip T. Warman. Mr. Warman was appointed as Executive Vice President, General Counsel and Corporate Secretary, effective February 8, 2018, with an expanded role encompassing the people and culture department. Mr. Warman joined SandRidge in August 2010 as Senior Vice President, General Counsel and Corporate Secretary. Prior to joining the Company, Mr. Warman was the Associate General Counsel for SEC and finance matters for Spectra Energy Corporation from January 2007 through July 2010. From 1998 through 2006 he practiced law as a corporate finance attorney with Vinson & Elkins, LLP in Houston, Texas. Mr. Warman earned a Bachelor of Science in Chemical Engineering from the University of Houston in 1993 and graduated from the University of Texas School of Law in 1998.
Section 16(a) Beneficial Ownership Compliance
Section 16(a) of the Exchange Act requires our officers and directors and persons who own more than 10% of the outstanding shares of our common stock to file reports of ownership and changes in ownership concerning their shares of our common stock with the SEC and to furnish us with copies of all Section 16(a) forms they file. We are required to disclose delinquent filings of reports by such persons.
3
Based solely on the copies of such reports and amendments thereto received by us, or written representations that no filings were required, we believe that all Section 16(a) filing requirements applicable to our executive officers and directors and 10% stockholders were met for the fiscal year ended December 31, 2017.
Corporate Governance Guidelines, Code of Business Conduct and Ethics and Financial Code of Ethics
The Board has adopted corporate governance guidelines that define those governance practices of the Board that are not included in our Bylaws. Our Board has also adopted a Code of Business Conduct and Ethics, which contains general guidelines for conducting our business and applies to all of our officers, directors and employees, and a Financial Code of Ethics that applies to our CEO and Senior Vice President, Chief Financial Officer and Chief Accounting Officer. Our corporate governance guidelines and codes can be found in the corporate governance section of our website at http://www.sandridgeenergy.com.
Audit Committee
SandRidge has a separately standing Audit Committee established in accordance with section 3(a)(58)(A) of the Securities Exchange Act of 1934, as amended (the “Exchange Act”). The Audit Committee members are Messrs. Kornder (Chairman) and Beer and Ms. Barnes. Each member of the Audit Committee has been determined by our Board to be an “audit committee financial expert” as defined under the rules of the SEC and to satisfy the independence requirements of Audit Committee members required by the Exchange Act and the New York Stock Exchange (the “NYSE”) Listed Company Manual.
Item 11. Executive Compensation
COMPENSATION DISCUSSION & ANALYSIS
The following Compensation Discussion and Analysis (“CD&A”), we describe our compensation philosophy, objectives and practices, our compensation setting process, our executive compensation program components, and the decisions regarding our named executive officers for 2017. Detailed information regarding the compensation earned by named executive officers is set forth in the Summary Compensation Table and other compensation tables contained in this CD&A.
2017 NAMED EXECUTIVE OFFICERS
| Name | Position | |
| James D. Bennett(1) | President & CEO | |
| Julian M. Bott(2) | Executive Vice President and Chief Financial Officer | |
| John P. Suter | Executive Vice President and Chief Operating Officer | |
| Philip T. Warman | Executive Vice President, General Counsel, & Corporate Secretary | |
| Robert S. (“Scott”) Griffin(3) | Senior Vice President, People and Culture | |
| Duane M. Grubert(4) | Executive Vice President, Investor Relations & Strategy |
| (1) |
Mr. J. Bennett departed the Company effective February 8, 2018. |
| (2) |
Mr. Bott departed the Company effective February 22, 2018. |
| (3) |
Mr. S. Griffin departed the Company effective March 1, 2018. |
| (4) |
Mr. Grubert departed the Company effective July 11, 2017. |
4
We present our CD&A in the following sections:
| 1. |
Executive Summary. In this section, we lead with a message from the Compensation Committee, which is followed by a summary of our business strategy and performance, extensive stockholder outreach, and compensation highlights. |
|
| |
| 2. |
Our Executive Compensation and Governance Principles. In this section, we describe the Company’s executive compensation strategy and objectives. |
|
| |
| 3. |
Key 2017 Compensation Program Elements. In this section, we highlight the material elements of the 2017 compensation program for named executive officers. |
|
| |
| 4. |
2017 Executive Compensation. In this section, we explain each of the material elements of the 2017 compensation program for named executive officers established by the Board or the Compensation Committee. |
|
| |
| 5. |
Process for Determining 2017 Executive Compensation. In this section, we describe the process for arriving at compensation decisions for 2017. |
|
| |
| 6. |
Actions Related to 2018 Executive Compensation. In this section, we provide an overview of the Compensation Committee’s compensation decisions made for 2018 including those in connection with the management transition. |
|
| |
| 7. |
Other Executive Compensation Matters. In this section, we provide an overview of policies related to minimum stock ownership, compensation clawbacks, and the prohibition on pledging and derivative transactions, and we discuss the relationship between our executive compensation program and risk and the tax treatment of executive compensation. |
1. Executive Summary
Compensation Committee Message and Report
DEAR FELLOW SANDRIDGE ENERGY STOCKHOLDERS,
The success of our business depends on setting and achieving goals tied to our strategic objectives. Incentivizing performance relative to those goals is fundamental to our compensation principles and executive compensation program. As we reflect on 2017, we are proud of the results that our Company delivered during a challenging period of low commodity prices and following the Company’s emergence from Chapter 11 reorganization in October 2016. We believe these results are reflected in our near-top-quartile stock price performance for the year relative to our 2017 peer group. Although our team delivered on key performance goals in 2017, in light of our new strategic direction, discussions with large stockholders and robust deliberation among the independent members of the Board, we determined to transition to a new leadership team, which resulted in the departure of Messrs. J. Bennett, Bott and S. Griffin during the first quarter of 2018.
ALIGNING COMPENSATION WITH STRATEGY AND PERFORMANCE
Our business and principal source of revenue is the production of oil, natural gas, and natural gas liquids (“NGLs”). Our Company exceeded our production growth goals for 2017 while simultaneously surpassing our per unit adjusted operating cost reduction goal and effectively managing its capital program rate of return. We found establishing a balanced set of goals focused our management team on growth that contributes long-term value, not just growth for growth’s sake.
Further, our team delivered on numerous qualitative goals that were fundamental to our Company’s 2017 performance, including:
| ● | Reducing 2017 total reportable incident rate by 33% and our motor vehicle incident rate by 41% compared to 2016. |
| ● | Increasing our NW STACK acreage position and entering into a $200 million development agreement with an initial $100 million tranche to efficiently fund the delineation of our NW STACK asset. |
| ● | Refinancing our non-conforming credit facility to increase our borrowing base, eliminate onerous covenants, release $50 million in cash from escrow and trigger the conversion of $264 million in convertible debt to equity. |
| ● | Selling $21.9 million in non-core assets (resulting in $33.7 million in non-core asset sales since emerging from Chapter 11). |
5
STOCKHOLDER ENGAGEMENT AND FEEDBACK
The Compensation Committee, as well as the full Board, values input and feedback received from our stockholders. We were not satisfied with the outcome of our say-on-pay vote at our 2017 annual meeting of stockholders, having received only 43% of the votes cast. We therefore initiated robust engagement with our largest stockholders and proxy advisory firms Institutional Shareholder Services and Glass Lewis. We took the feedback we received seriously, and our 2017 and 2018 compensation programs are responsive to the concerns we heard. We expect to continue such engagement in the future.
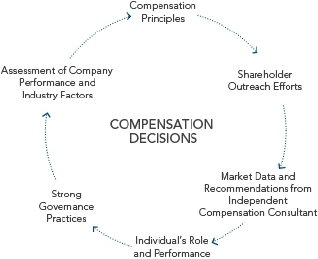
2017 COMPENSATION DECISIONS
For 2017, we returned to historic base salaries and incentive opportunities that were effective prior to our reorganization in 2016 and we implemented a multi-metric performance scorecard comprised of important drivers of value creation for each of the annual incentive program and the performance share units granted under our long-term incentive program. The scorecard balanced production growth with cost reduction and capital program return goals to ensure our management team was not incentivized to pursue growth at any cost, a concern we heard among stockholders. Eliminating the incentive compensation structure the Company adopted during its chapter 11 reorganization, and the absence of comparable emergence equity awards from our 2017 long-term incentive program, addresses feedback we heard regarding outlier compensation levels, particularly for our CEO, in 2016. Our Compensation Committee also replaced its independent compensation consultant with Mercer Company (“Mercer”).
2018 COMPENSATION DECISIONS - GOING FORWARD
For 2018, the Compensation Committee and Board continued applying a balanced scorecard approach in establishing the annual incentive program and committed that 50% of the Company’s long-term incentive awards made later in 2018 would be performance-based. Further, in light of the departure of Mr. J. Bennett and the termination of his employment agreement, which contained minimum base salary and effective minimum bonus and long-term incentive opportunities, the Company may now recalibrate total target compensation for his successor in a way that is both competitive and more reflective of the compensation found among our peer group companies. We believe that the compensation package established for Bill Griffin, our Interim President and CEO, reflects these principles in a way that is consistent with the market for interim chief executives.
We held 7 Compensation Committee meetings during 2017 and numerous other informational update calls in addition to calls and in person meetings with stockholders. We are engaged and take our responsibilities very seriously in establishing and overseeing SandRidge’s executive compensation program.
| By the Compensation Committee of the Board: | |
| Sylvia K. Barnes, Chair | Michael L. Bennett |
6
2017 FINANCIAL AND OPERATIONAL PERFORMANCE
SandRidge Total Shareholder Return (“TSR”) outperformed its E&P peer group average in 2017. For a complete description of the Company’s 2017 peer group, see “Setting 2017 Target Compensation Levels–The Peer Group”.
| TSR PEER SHARE PRICE PERFORMANCE | Rank | TSR Peer | SORTED FY 2017 Return | Quartile | |||
|
|
1 | MTDR | 19 | % | |||
| 2 | SRCI | -5 | % | Q1 | |||
| 3 | ECR | -9 | % | ||||
| 4 | SD | -10 | % | ||||
| 5 | HK | -18 | % | Q2 | |||
| 6 | MPO | -21 | % | ||||
| 7 | LPI | -29 | % | ||||
| 8 | SN | -44 | % | Q3 | |||
| 9 | CRZO | -44 | % | ||||
| 10 | OAS | -47 | % | ||||
| 11 | WLL | -48 | % | Q4 | |||
| 12 | EPE | -65 | % | ||||
| 13 | JONE | -76 | % | ||||
| TSR Peer Average | -32 | % | |||||
2017 was a year of solid operating performance, delivering within, or exceeding our production and cost guidance.
| What we said we would do1 |
What we did2 | How we did it | ||||
|
4.0 - 4.2 |
 |
|
4.2 MMBbls |
Increased production guidance Q2’17 by 200 Mboe (100% liquids) due to well performance in both plays and improved the Niobrara type curve due to shallower decline; generation 3 Niobrara wells collectively outperformed improved type curve by 8%; minimized Midcontinent downtime through various preventative methods with a production deferral rate of only 5% | ||
|
14.0 - 14.7 |
 |
14.9 MMBOE |
||||
| $8.00 - $9.00 Lease operating expense per BOE |
|
$6.89 |
Reduced lease operating guidance twice in 2017 (Q2’17 & Q3’17), primarily from efficiency and cost reduction gains in the Midcontinent. Centralized supervision and dispatch allowed for the reduction of associated headcount and water-hauling costs; extended artificial lift run-time and use of existing equipment reduced workover spend; electrical initiatives resulted in lower facility maintenance costs | |||
| $4.25 - $4.50 Adjusted G&A Expense per BOE3 |
|
$5.10 |
Realized savings through intensive office and fleet cost management, reduced consulting spend and project timing, and favorable legal outcomes | |||
|
$3.72 |
| 1 |
As detailed under “2017 Capital Expenditure and Operational Guidance” in the Company’s press release titled, “SandRidge Energy, Inc. Reports Financial and Operational Results for Fourth Quarter and the Full Year of 2016” issued February 22, 2017. |
| 2 |
As detailed under “2017 Actual Results v. 2017 Capital Expenditure and Operational Guidance” in the Company’s press release titled, “SandRidge Energy, Inc. Reports Financial and Operational Results for Fourth Quarter and Full Year of 2017” issued February 21, 2018. |
| 3 | Adjusted G&A expense is a non-GAAP financial measure. The Company has defined this measure and reconciled to the most directly comparable GAAP financial measure in the attached Exhibit 99.4 to this Report. |
7
Safety, capital program return, balance sheet initiatives and acquisition and divestiture activity improved SandRidge’s competitiveness in 2017
|
14.7 MMBOE TRIR of 0.40 MVIR of 1.46 |
|
$264 million Refinanced non-conforming credit facility with onerous covenants to a conforming credit facility with increased borrowing base $9 million savings in Non-D&C workover capex, reduced by 24% |
|
Acquired NW STACK $200 Million |
STOCKHOLDER ENGAGEMENT AND ADVISORY VOTE ON COMPENSATION
Investor Outreach
How we engage with our investors
Both the Compensation Committee and the full Board value the input and feedback received from our stockholders, and we view our stockholder outreach efforts as an important part of our compensation setting process. Beginning in 2017 and continuing into the first quarter of 2018, the Board has supplemented management’s investor outreach with its own extensive engagement to directly solicit and receive stockholder input on the Company’s business strategies, governance and executive compensation. We believe such outreach helps ensure that the issues that matter most to our stockholders are understood and considered by management and the Board. We plan to continue engagement practices adopted by the Board throughout the year.

We heard you and took action
At the 2017 annual meeting of stockholders, our executive compensation program for 2016 received the support of approximately 43% of the votes cast. Acknowledging our vote result, and in line with our commitment to ongoing stockholder engagement, during the fall of 2017, we solicited feedback from our largest stockholders representing approximately 60% of the Company’s outstanding common stock. We held conversations with holders representing greater than 40% of shares then outstanding as well as prominent proxy advisory firms Institutional Stockholder Services and Glass Lewis.
8
While we were not satisfied with the outcome of our 2017 advisory Say-on-Pay vote, we view it as an opportunity to continue to engage with stockholders, evaluate their input, and improve our pay programs and policies. The following timeline of key events reflects the Company’s strong engagement with its stockholders:

9
Stockholders were generally supportive of our outreach and our 2017 compensation programs and approach, as we described them. These were some key themes expressed by our stockholders:
| What we heard | What we did for 2017 | What we are doing for 2018 | ||
|
2016 compensation was too high. |
✓The Company returned to a compensation program consisting of base salary, performance-based annual incentive and a combination of time- and performance-based long-term incentive compensation at historic target levels.
✓The salary for the Company’s CEO returned to the minimum prescribed by his employment agreement and his total direct compensation for 2017 was less than 40% of that in 2016.
|
→The Compensation Committee, in consultation with its independent compensation consultant, has set interim CEO compensation at a competitive level considering relevant market data.
→Going forward, Mr. J. Bennett’s departure permits the Company to recalibrate total target compensation for his successor in a way that is both competitive and more reflective of the compensation found among our peer group companies.
| ||
| Metrics that incentivize growth for growth’s sake are inappropriate. We heard concerns that production growth and reserves growth goals may provide perverse incentives, which could be mitigated if balanced with other metrics. |
✓The Company adopted a balanced scorecard approach in our 2017 annual incentive program. Our Capital Program Return (25%), Per Unit Adjusted Operating Cost (25%) and qualitative (25%) metrics ensure that we are not solely focused on production growth (25%) at any expense.
✓The Compensation Committee determined to use a discretionary approach to long-term incentive metrics relating to earnings before interest, taxes, depreciation and amortization (“EBITDA”) growth and proved reserves growth to eliminate the potential for stale targets and allow the Board and management to make decisions based on the best outcome for the business irrespective of the impact to a specific performance measure. |
→The Company continued a balanced scorecard approach in our 2018 annual incentive program.
→Significant portions of our named executive officer compensation continue to be at risk and tied to stock price performance, which ensures that our executives remain focused on delivering value to stockholders. |
10
| What we heard | What we did for 2017 | What we are doing for 2018 | ||
| A larger proportion of the long-term incentive should be performance-based. We heard concerns regarding the weighting of our long-term incentive program, specifically that the 2016 emergence grant, which consisted of 25% performance units was insufficiently performance-based. |
→While the 2017 long-term incentive program continued with a 25% proportion of performance share units, the Compensation Committee committed that the 2018 long-term incentive program will consist of 50% performance share units when grants are made in July 2018 and incorporate three-year vesting and performance periods.
| |||
|
Single trigger equity acceleration upon a Change in Control. We heard concerns that such a provision may discourage potential buyers of the Company. |
✓Beginning in December 2017, all restricted stock awards contain double trigger vesting language. |
We are committed to continuing to evaluate this and other feedback we receive as part of our ongoing stockholder engagement process. We will continue to refine and update our compensation programs and policies to maintain continued alignment of management’s interests with those of stockholders and ensure that our programs reinforce our strong pay-for-performance philosophy.
11
2. Our Executive Compensation and Governance Principles
HOW OUR COMPENSATION PROGRAM IS ALIGNED WITH COMPANY PERFORMANCE
SandRidge’s compensation programs are driven by the following guiding principles:
| Guiding Principles | How We Meet Our Principles | |
|
Attract, motivate and retain high performing individuals that will successfully execute our strategic financial and operational priorities |
✓Provide a competitive total compensation package taking into account base salary, incentives and benefits
✓Provide a significant portion of each named executive officer’s target total direct compensation in the form of variable, performance-based compensation
✓Long-term incentives with multi-year performance and vesting periods help to retain executives
| |
|
Pay competitive levels considering a combination of market data from our peers, an individual’s duties and responsibilities, and the performance of the individual and the Company |
✓Regularly evaluate our pay programs against the competitive market of our peer group
✓Individual compensation decisions are made based on market rate, as well as individual and Company performance, time in role, scope of responsibility, leadership skills and experience
| |
|
Align compensation – both program design and levels – with stockholder interests, while rewarding long-term value creation and discouraging excessive risk taking |
✓Align our executive compensation with short-term and long-term performance of the Company
✓The annual incentive program uses a balanced approach scorecard containing strategic, financial and operational goals to encourage executives to execute on short-term goals that lead to long-term stockholder value
✓Pay programs contain a substantial proportion of long-term incentive
compensation
✓Share ownership guidelines contribute to alignment between long-term stockholder value and management decisions
✓Clawback policy provides the Board with the discretion to recover incentive compensation paid in connection with misstated financial or operating results resulting from fraud, misconduct, or a violation of Company policy
| |
|
Promote and emphasize high ethical conduct, safety and environmental stewardship |
✓Stock ownership guidelines and clawback, anti-hedging and anti-pledging policies for executive officers and directors
✓Qualitative safety and environmental goals ensure that these matters are front and center when the Company pursues its other operational goals
|
12
What We Do & What We Do Not Do
Below is a summary of executive compensation practices we have adopted, and a list of problematic pay practices that we avoid to help reinforce our compensation principles:
What We Do
| ✓ | Align compensation with stockholders’ interests – the majority of the value of our compensation programs are tied to stock price and/or Company performance |
| ✓ | Link performance incentive compensation to the achievement of pre-established goals tied to operational, financial, and strategic objectives |
| ✓ | Engage in a rigorous target-setting process for incentive plan metrics |
| ✓ | Use market data from a relevant peer group as a key input in our compensation setting process |
| ✓ | Maintain a clawback policy |
| ✓ | Apply robust stock ownership guidelines |
| ✓ | Annually perform a risk assessment of our compensation programs and policies |
| ✓ | Use an independent compensation consultant |
What We Do Not Do
| ✕ | No “single-trigger” change-of-control cash payments |
| ✕ | No tax gross-ups |
| ✕ | No excessive perquisites |
| ✕ | No hedging or pledging of Company stock |
| ✕ | No repricing of underwater stock options |
13
3. Key 2017 Compensation Program Elements
We provide our executives with a mix of compensation featuring short- and long-term pay periods, fixed and variable payment amounts tied to performance, and cash and equity-based consideration reflective of our compensation philosophy and objectives. Retirement programs and other forms of compensation are not detailed in our key compensation programs (for additional information about these programs see “2017 Executive Compensation”).
| Fixed | Variable | ||||||||
| Long-Term Incentive Program | |||||||||
| Base Salary | Annual Incentive Program | Performance Share Units (PSUs): 25% weighting |
Restricted Stock: 75% weighting | ||||||
| What? | |||||||||
| Cash | Stock | ||||||||
| When? | Annual | Annual | 2.5-year performance period (transitioning to three-year performance period beginning in 2018) | Three-tranches vesting over a 2.5-year vesting period (transitioning to three-year vesting period beginning in 2018) | |||||
| How? Measures, Weightings, & Payouts |
Market rate, as well as individual performance, time in role, scope of responsibility, leadership skills and experience |
Multi-metric performance scorecard consisting of: 75% quantitative financial and operational metrics (25% capital program return, 25% per unit adjusted operating costs, 12.5% oil production and 12.5% total production) |
Multi-metric performance scorecard consisting of:
25% relative total stockholder return (quantitative) Value delivered through long-term stock price performance |
Value delivered through long-term stock price performance upon vesting | |||||
| Why? | Attract and retain talent | Motivate executives by linking variable cash compensation to key annual performance goals tied to business strategy | Rewards sustainable performance that delivers long-term value to stockholders through the achievement of key long-term financial and operational goals tied to business strategy, drives ownership mentality and aligns the interests of executives with those of stockholders |
Promotes retention of key talent, drives ownership mentality and reinforces the link between the interest of executives and those of stockholders | |||||
14
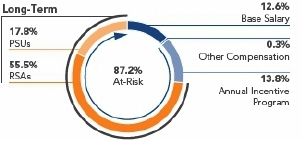
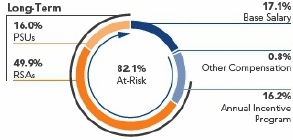
TARGET PAY MIX
Consistent with our pay-for-performance philosophy, 87.2% of our President & CEO’s target pay package and 82.1% of the average of our other named executive officers (other than Mr. Grubert) target pay packages in 2017 were variable/at-risk and contingent upon the Company’s financial, operational, and/or share price performance. The 2017 target pay package excludes the 2016 performance unit awards, which were a component of the long-term incentive grants made in October 2016 following the Company’s emergence from Chapter 11 reorganization, but are reportable in the Summary Compensation Table in the years that they are earned.
TARGET PAY MIX
| President & CEO | Average of Other Named Executive Officers (other than Mr. Grubert) |
 |
 |
4. 2017 Executive Compensation
BASE SALARY
The purpose of base salary is to provide a fixed level of cash compensation for performing day-to-day responsibilities. Each named executive officer’s base salary is set considering market median data, as well as the individual’s experience, responsibilities, and performance. The employment agreements we maintain or maintained with our named executive officers establish minimum base salaries, and increases, if any, are based on the achievement of individual and Company objectives, contributions to our performance and culture, leadership accomplishments, and market data for comparable positions in our industry. As discussed further below, the employment agreements in effect at the Company’s emergence from Chapter 11 bankruptcy on October 4, 2016 were assumed pursuant to the plan of reorganization, which was approved by substantial majorities of the Company’s creditors and confirmed by the Bankruptcy Court prior to the appointment of the Company’s Board.
The salaries of our named executive officers have been held flat since 2015, with the exceptions of Mr. Suter’s base salary, which was increased to reflect his appointment to Executive Vice President and Chief Operating Officer in December 2016 and Mr. Grubert’s salary, which was increased in 2016 in recognition of his individual performance and the expansion of his responsibilities without commensurate base salary increases in preceding years. The 2017 base salary of each of Messrs. Bennett, Bott, Suter and Warman reflect the minimum base salary provided in his employment agreement with the Company. Based on the market analysis performed by Alvarez & Marsal North America, LLC (“A&M”), the Compensation Committee's prior independent compensation consultant, Mr. J. Bennett’s 2017 base salary exceeded the 90th percentile of the Company’s 2017 peer group companies and the base salaries of the other named executive officers were generally between the 50th and 75th percentiles of the Company’s 2017 peer group companies.
Base salaries for 2017 for our named executive officers were:
| Executive | Title | 2016 Base Salary(a) |
2017 Base Salary |
Year-over- year change | |||||||
| James D. Bennett | President and CEO | $ | 915,000 | $ | 915,000 | No change | |||||
| Julian M. Bott | Executive Vice President and Chief | $ | 425,000 | $ | 425,000 | No change | |||||
| Financial Officer | |||||||||||
| John P. Suter | Executive Vice President and Chief | $ | 350,000 | (b) | $ | 420,000 | 8.33% | (e) | |||
| Operating Officer | increase | ||||||||||
15
| Executive | Title | 2016 Base Salary(a) |
2017 Base Salary |
Year-over- year change | ||||||
| Philip T. Warman | Executive Vice President, General Counsel | $ | 375,000 | $ | 375,000 | No change | ||||
| and Corporate Secretary | ||||||||||
| Scott Griffin | Senior Vice President, People and Culture | — | (c) | $ | 250,000 | N/A | ||||
| Duane M. Grubert | Former Executive Vice President of Investor | $ | 385,000 | $ | 385,000 | (d) | No change | |||
| Relations and Strategy | ||||||||||
| (a) |
Amounts may differ slightly from the actual base salaries realized during that year as detailed in the Summary Compensation Table for 2016 due to the misalignment of compensation earned versus the pay periods during the calendar year. |
| (b) |
Mr. Suter was appointed Executive Vice President and Chief Operating Officer effective December 1, 2016. This figure reflects his base salary prior to his promotion. |
| (c) |
Mr. S. Griffin was a named executive officer for the first time in 2017. |
| (d) |
Mr. Grubert departed the company effective in July of 2017. This figure reflects his pre-departure annualized base salary. |
| (e) |
The change in salary for Mr. Suter reflects an increase in his base salary upon his appointment as Executive Vice President and Chief Operating Officer. |
16
ANNUAL INCENTIVE PROGRAM2
The purpose of the annual incentive is to motivate executives by linking variable cash compensation to key annual performance goals tied to business strategy. In February 2017, the Compensation Committee adopted baseline hurdle of $50 million in Adjusted EBITDA and established the following metrics, weightings, and goals for our 2017 annual incentive program. These goals tie to our strategic objectives and reflect a balanced scorecard approach to assessing performance. In February 2018, having exceeded the baseline hurdle with Adjusted EBITDA of $193 million, the Board approved annual incentive program payouts of 116% of target based on its assessment of the Company’s performance in 2017.
The following chart shows the metrics, weightings and goals chosen by the Compensation Committee for 2017 and our performance against such metrics.
| Metric | Link to Business Strategy | Weighting | Threshold | Target | Maximum | Result | Weighting Score | |||||||
|
Capital Program Return(1) |
Efficient and effective allocation of capital combined with strong operational performance |
|
 |
17.46% |
15.9% | |||||||||
|
Per Unit Adjusted Operating Cost(2) |
Achievement of production targets while operating efficiently and minimizing unnecessary costs |
 |
 |
$11.28/BOE |
50.0% | |||||||||
|
Oil Production(3) |
Driver of revenue and growth |
 |
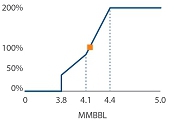 |
4.16 MMBBL |
13.3% | |||||||||
|
Total Production(4) |
Driver of revenue and growth |
 |
 |
14.91 MMBOE |
13.9% | |||||||||
|
Strategic and Operational Goals |
Qualitative assessment of various other key operational and strategic value drivers |
 |
In consideration of the Company’s achievements in safety and improved capital structure and resource base as well as neutral performance respecting other matters. |
|
23% | |||||||||
| TOTAL: |
116% | |||||||||||||
| (1) |
The capital program return metric equals the weighted average internal rate of return of the 2017 drilling and completion capital program together with certain other capital costs, such as facilities infrastructure construction costs and 3D seismic studies. The IRR calculation reflects actual production and realized pricing for 2017 and forecasted production, pricing and cost assumptions consistent with applicable type curves. |
| (2) |
Per Unit Adjusted Operating Costs G&A expense is a non-GAAP financial measure. The Company has defined this measure and reconciled to the most directly comparable GAAP financial measure in the attached Exhibit 99.4 to this Report. |
| (3) |
Oil Production equals total oil production (excludes NGLs) for 2017, expressed in barrels. |
| (4) |
Total Production equals total production for 2017, expressed in (“BOE”) with Oil and NGLs in barrels, and gas at a 6:1 equivalent ratio. |
17
In February 2017, the Compensation Committee considered our compensation principles and relevant market data and determined to establish target opportunities for each of our named executive officers that were unchanged from 2016.
Based on the market analysis performed by A&M for the Compensation Committee, Mr. J. Bennett’s 2017 target bonus as a percentage of base salary was between the 50th and 75th percentiles of the Company’s 2017 peer group companies and the 2017 target bonus as a percentage of base salary for the other named executive officers ranged from the 25th percentile to the 90th percentile of the Company’s 2017 peer group companies.
The following formula was used to calculate the payment to be awarded to a named executive officer under 2017 annual incentive program:
| Target Bonus (% of Base Salary) |
➔ | Target Bonus ($) | ✕ | Actual Performance (% of Target) |
= | Final Payout |
Based on the Company’s performance relative to the metrics outlined above, the final calculation and amounts paid to our named executive officers for 2017 performance were:
| Name | Target Bonus (% of Base Salary) |
➔ | Target Bonus ($) |
✕ | Actual Performance (% of Target) |
= | Final Payout(1) | ||||||||||
| James D. Bennett | 110 | % | $ | 1,006,500 | 116% | $ | 0 | ||||||||||
| Julian M. Bott | 90 | % | $ | 382,500 | $ | 0 | |||||||||||
| John P. Suter | 100 | % | $ | 420,000 | $ | 487,200 | |||||||||||
| Philip T. Warman | 75 | % | $ | 281,250 | $ | 326,250 | |||||||||||
| Scott Griffin | 65 | % | $ | 162,500 | $ | 188,500 | |||||||||||
| Duane M. Grubert | 90 | % | $ | 346,500 | $ | 0 | |||||||||||
| (1) |
The employment of each of Messrs. J. Bennett, Bott and Grubert was terminated prior to the day on which amounts due under the 2017 annual incentive program were paid out, and they did not receive a payment under the 2017 Annual Incentive Program. |
2017 TRANCHE OF EMERGENCE PERFORMANCE UNITS
Variable Cash-Settled Units
The performance unit awards motivate our executive officers to achieve future annual business objectives that drive long-term performance. The performance unit awards were a component of the long-term incentive grants made in October 2016 following the Company’s emergence from Chapter 11 reorganization and are reportable in the Summary Compensation Table in the years that they are earned. The performance unit awards vest in one-third increments on each of December 31, 2017, 2018 and 2019 and payments are made based on the Company’s performance relative to the metrics established in each year’s annual incentive scorecard.
The first tranche, for which right to payment vested on December 31, 2017, was paid based on the company’s 2017 annual incentive plan performance scorecard.
| Name | Performance Units (vested on 12/31/17) |
➔ | $100 / Unit ($s) |
✕ | Actual Performance (% of Target) |
= | Final Payout | |||||||||
| James D. Bennett | 8,750 | $ | 100 | 116% | $ | 1,015,000 | ||||||||||
| Julian M. Bott | 3,083 | $ | 100 | $ | 357,628 | |||||||||||
| John P. Suter | 1,667 | $ | 100 | $ | 193,372 | |||||||||||
| Philip T. Warman | 1,250 | $ | 100 | $ | 145,000 | |||||||||||
| Scott Griffin | 1,250 | $ | 100 | $ | 145,000 | |||||||||||
| Duane M. Grubert | 1,667 | $ | 100 | $ | 193,372 | |||||||||||
18
LONG-TERM INCENTIVE (“LTI”) PROGRAM
The purpose of long-term incentives is to align executives’ compensation with interests of stockholders, encourage retention, and reward long-term operational and financial performance. For 2017, we granted long-term incentive awards consisting of 25% stock-settled performance share units and 75% time-based restricted stock awards. We changed the timing of our annual long-term incentive grants from February to July to incentivize mid-year retention, to distribute the Compensation Committee’s workload more evenly throughout the year and to permit the incorporation of additional stockholder feedback and say-on-pay results into the current year’s long-term incentive compensation program. Due to this transition, the 2017 performance share units have a performance period of 2.5 years (January 2017 to June 2019) and the restricted stock awards have a 2.5 year vesting period. We expect that in future years, our long-term incentive grants will have a three-year performance and/or vesting period.
In February 2017, the Compensation Committee considered our compensation principles and relevant market data and determined to establish target opportunities for each of our named executive officers that were unchanged from 2016.
Based on the market analysis performed by A&M for the Compensation Committee, Mr. J. Bennett’s target 2017 long-term incentive awards were between the 75th and 90th percentiles of the Company’s 2017 peer group companies and the target 2017 long-term incentive awards for the other named executive officers ranged from less than the 25th percentile to the 75th percentile of the Company’s 2017 peer group companies. The following table reflects the target 2017 long-term incentive awards expressed as a percentage of base salary and the individual and aggregate grant date fair values of the 2017 long-term incentive awards:
| Name | Target LTI (% of Base Salary) |
Target PSU Value (25% Weighting) |
Target RSA Value (75% Weighting) |
Aggregate Target LTI ($ Value)(1) | ||||||||
| James D. Bennett | 588 | % | $ | 1,293,741 | $ | 4,035,133 | $ | 5,328,874 | ||||
| Julian M. Bott | 350 | % | $ | 357,678 | $ | 1,115,619 | $ | 1,473,297 | ||||
| John P. Suter | 360 | % | $ | 363,581 | $ | 1,133,992 | $ | 1,497,573 | ||||
| Philip T. Warman | 150 | % | $ | 135,260 | $ | 421,870 | $ | 557,130 | ||||
| Scott Griffin | 125 | % | $ | 75,136 | $ | 234,366 | $ | 309,502 | ||||
| Duane M. Grubert | 243 | % | $ | 224,961 | $ | 701,643 | $ | 926,604 | ||||
| (1) |
The grant date fair value of the long-term incentive awards for each named executive officer is slightly less than the target long-term incentive expressed as a percentage of his base salary because the Company determined the number of performance share units awarded based on the closing price of the Company’s common stock on the grant date rather than based on the grant date fair value calculated in accordance with Financial Accounting Standards Board Accounting Standards Codification Topic 718, Compensation-Stock Compensation. |
See “Executive Compensation Tables” for the Grants of Plan-based Awards Table.
Performance Share Units (PSUs)
In February 2017, we granted stock-settled performance share units to our named executive officers. The Compensation Committee selected one quantitative goal of relative TSR and three discretionary financial and operational goals including relative adjusted EBITDA growth, proved reserves growth and per unit adjusted operating costs. The Compensation Committee determined to use a discretionary approach to measuring Company performance against the latter three performance measures to eliminate the potential for stale targets, minimize potential competing influence of different performance periods, ease the application of results from merger and acquisition activity and allow the Board and management to make decisions based on the best outcome for the business irrespective of the impact to a specific performance measure. The two relative metrics – relative TSR and relative adjusted EBITDA growth – performance will be measured against the Company’s 2017 peer group described on below.
The ultimate value realized by our named executive officers at the end of the performance period, which runs from January 1, 2017 through June 30, 2019 will be contingent upon both SandRidge’s performance against these goals and the Company’s stock price. PSUs are also subject to a time-vesting requirement, which generally requires a participant to remain employed by the Company through the end of the performance period.
19
| Metric | Link to Business Strategy | Weighting | Threshold | Target | Maximum | |||||
|
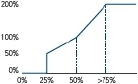
Quantitative: Relative TSR |
Competitive stock price appreciation and value creation |
 |
 | |||||||
|
Discretionary: Relative Adjusted EBITDA Growth(1) |
Operational effectiveness and profitability |
 |
||||||||
|
Proved Reserves Growth |
Increase the amount of high-quality proven assets to drive future production growth and value creation |
|||||||||
|
Per Unit Adjusted Operating Cost(2) |
Achievement of production targets while operating efficiently and minimizing unnecessary costs |
|||||||||
| (1) |
Relative Adjusted EBITDA is a non-GAAP financial measure. The Company has defined this measure in the attached Exhibit 99.4 to this Report. |
| (2) |
Per Unit Adjusted Operating Costs is a non-GAAP financial measure. The Company has defined this measure in the attached Exhibit 99.4 to this Report. |
Restricted Stock Awards
In February 2017, we granted restricted stock to our named executive officers. These awards vest ratably on each of June 30, 2017, 2018, and 2019 and help motivate and retain executives and provide stability to the compensation programs. The ultimate value realized by our named executive officers at the time of vesting will be contingent upon SandRidge’s stock price, thus providing further alignment with stockholders.
OTHER COMPENSATION MATTERS
Health and Welfare Benefits
Our named executive officers were eligible to participate in medical, dental, vision, disability and life insurance to meet their health and welfare needs. These benefits are provided to assure that we are able to maintain a competitive position in terms of attracting and retaining officers and other employees. This is a fixed component of compensation and the benefits are provided on a nondiscriminatory basis to all of our employees.
Limited Perquisites and Other Personal Benefits
We believe that the total mix of compensation and benefits provided to our named executive officers is competitive and, generally, perquisites should not play a large role in our executive officers’ total compensation. As a result, the perquisites and other personal benefits we provide to our executive officers are limited.
401(k) Plan
We maintain a 401(k) retirement plan for the benefit of all of our executive officers and employees on a non-discriminatory basis. Under the plan, eligible employees may elect to defer a portion of their earnings up to the annual maximum allowed by regulations promulgated by the Internal Revenue Service. Beginning in 2017, the aggregate matching contribution available to our 401(k) retirement plan participants equals 100% of the first 10% of deferred base salary (exclusive of incentive compensation). In 2017, we made matching contributions equal to 100% on the first 10% of employee deferred base salary (exclusive of incentive compensation). Matching contributions are made in investment vehicles selected by each employee from a variety of options.
20
Nonqualified Deferred Compensation Plan
Previously, we maintained a nonqualified deferred compensation plan (“NQDC Plan”) to provide our named executive officers and other eligible employees flexibility for meeting their future income needs and assisting them in their retirement planning. Under the terms of the NQDC Plan, eligible employees were provided the opportunity to defer income in excess of the Internal Revenue Service annual limitations on qualified 401(k) retirement plans.
Under the NQDC Plan, we made discretionary contributions to the deferred compensation account of each participant. The Board approved matching contributions for the NQDC Plan equal to 100% of employee contributions up to 10% of the employee’s annual cash compensation minus any matching contributions made under the 401(k) retirement plan.
In December 2016, we initiated termination of the NQDC Plan, following which no additional deferrals were permitted into the NQDC Plan. Active employee balances were distributed in January 2018.
5. Process for Determining 2017 Executive Compensation
COMPENSATION SETTING APPROACH
Our approach to setting compensation programs and levels for our named executive officers involves a comprehensive process reflecting the input and consideration of numerous factors.
INDEPENDENT COMPENSATION GOVERNANCE
Independent members of our Board and the Compensation Committee seek input from our CEO and other members of our management team as well as input and advice from the Compensation Committee’s independent compensation consultant to ensure our compensation principles and all information relevant to individual compensation decisions are taken into account in setting executive compensation programs and levels. The following summary sets forth the responsibilities of various parties in connection with the implementation of our compensation programs.
21
| Role | President and CEO |
Management | Independent Compensation Consultant |
Compensation Committee |
Independent Members of Board of Directors | |||||
| Peer Group / Market Data and Best Practices for Compensation Design and Decisions | Reviews | Reviews | Develops | Recommends | Approves | |||||
| Annual Named Executive Officer Target Compensation | Recommends | — | Reviews / Advises | Approves | Ratifies | |||||
| Annual CEO Target Compensation | — | — | Reviews / Advises | Approves | Ratifies | |||||
| Annual and Long-Term Incentive Measures and Performance Targets | Reviews | Develops | Reviews / Advises | Approves | Ratifies | |||||
| Performance Results | Reviews | Develops | Reviews / Advises | Evaluates | Approves | |||||
| Long-Term Incentive Grants to non-executives, Dilution, Burn Rate | Reviews and approves | Develops | Reviews / Advises | Approves | — | |||||
| CD&A Disclosure | Reviews | Develops | Reviews / Advises | Recommends | Approves | |||||
| Say on Pay Result | — | — | Reviews / Advises | Reviews / Recommends | — |
The following describes the roles of the key participants in the compensation-setting process:
Independent Compensation Committee
The Compensation Committee is composed of two non-employee independent directors. The Compensation Committee’s duties in administering the executive compensation programs include the following:
| ● |
Reviewing, evaluating, and approving the Company’s corporate goals and objectives relevant to the compensation of the Company’s CEO and the Company’s other executive officers, as well as other members of the Company’s senior management on an annual basis and making adjustments as it deems appropriate |
| ● |
Evaluating the performance of the Company’s CEO and, in consultation with the CEO, the Company’s other executive officers and other members of the Company’s senior management in light of those goals and objectives |
| ● |
Regularly reviewing and approving the annual total compensation paid to executive officers and other members of senior management |
The Compensation Committee reviews the components of our executive officer compensation program on an annual basis and approves adjustments as it deems appropriate. On an annual basis, the Compensation Committee reviews and makes recommendations to the Board with respect to incentive compensation and equity-based plans that are subject to the Board’s approval.
Management Team
Our CEO (other than for himself) and the head of our People and Culture Department work with the Compensation Committee in establishing compensation levels and performance targets. Our CEO is responsible for reviewing the compensation and performance of executive officers other than himself and making recommendations to the Compensation Committee for adjustments to the annual total compensation of his direct reports. Final compensation determinations are made by the Compensation Committee or, from time to time, the Board. The Company’s People and Culture and Legal departments provide support in the preparation of materials and execution of the Compensation Committee’s responsibilities.
Stockholders and Other Key Stakeholders
The Company and the Compensation Committee value stockholders’ input and consider such input in establishing the type and level of compensation for our executives and setting performance metrics and targets. For more detail, see “Stockholder Engagement and Advisory Vote on Compensation” above. The Company has held advisory votes on named executive officer compensation at each of its annual meetings of stockholders beginning in 2014. At our 2017 annual meeting, our stockholders approved holding our Say-on-Pay vote annually.
22
Independent Compensation Consultant
To facilitate the formulation and administration of our compensation programs, the Compensation Committee continued the engagement of its prior independent compensation consultant, A&M through the fall of 2017, at which point, the Compensation Committee determined to retain Mercer as its independent compensation consultant. In general, A&M provided, and Mercer currently provides, executive and director compensation consulting services to the Compensation Committee, including information and market practices regarding compensation program designs and pay levels, regulatory updates and analyses, and related trends.
In general, at the direction of the Compensation Committee, the compensation consultant attends committee meetings, meets with the Compensation Committee in executive session, and provides advice and expertise on executive and director compensation programs and plan designs. The compensation consultant reports directly to, and takes its charge from, the Compensation Committee on executive compensation matters. Interactions between the compensation consultant and management are generally limited to discussions on behalf of the Compensation Committee or as required to compile information at the Compensation Committee’s direction.
During 2017, A&M also served as restructuring advisor in connection with the Company’s Chapter 11 reorganization. Accordingly, in 2017, the Company purchased $238,984 in non-compensation-related services in connection with the Company’s restructuring in addition to $237,054 in compensation-related services. During 2017, Mercer did not provide any non-compensation-related services to the Company.
The Compensation Committee reviewed the independence of A&M and Mercer pursuant to the requirements approved and adopted by the SEC and the NYSE and determined each is independent from management and that their engagement does not raise a conflict of interest.
Peer Group and Competitive Data
The Compensation Committee generally uses a peer group to compare the competitiveness of the Company’s executive compensation and to evaluate the Company’s performance. The Company updated its peer group for 2017, as detailed below.
SETTING 2017 TARGET COMPENSATION LEVELS
The Peer Group
For 2017, to assist with setting executive compensation levels, evaluating compensation programs and assessing performance relative to 2017 performance goals, the Board approved a new peer group of 12 companies operating in the oil and gas exploration and production industry based on the recommendation of the Compensation Committee and A&M, its independent compensation consultant at the time, and with input from management. In establishing the peer group, the Compensation Committee primarily considered industry, annual revenue, asset similarity, and market capitalization.
23
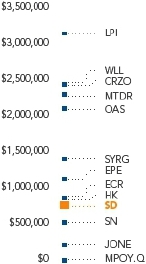
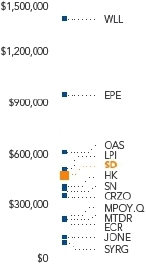
The 2017 peer group was comprised of the following companies:
| MARKET CAPITALIZATION as of 9/30/2016 |
REVENUE as of 9/30/2016 (LTM) |
ASSETS as of 9/30/2016 | ||
 |
 |
 |
| REVENUE SOURCE | RESERVES | |
 |
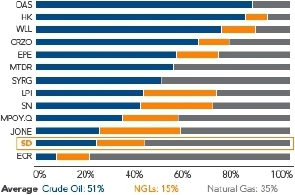 |
| MPOY.Q | Midstates Petroleum Company Inc. | Oasis Petroleum Inc. |
 | |||
| JONE | Jones Energy, Inc. | Matador Resources Company | ||||
| SN | Sanchez Energy Corporation | Carrizo Oil & Gas Inc. | ||||
| HK | Halcón Resources Corporation | Whiting Petroleum Corp. | ||||
| ECR | Eclipse Resources Corporation | Laredo Petroleum, Inc. | ||||
| EPE | EP Energy Corporation | SandRidge Energy, Inc. | ||||
| SYRG | Synergy Resources Corporation |
Employment Agreements
We currently maintain, or maintained, during their employment with the Company, employment agreements with our named executive officers, the material terms of which are described throughout this CD&A. The employment agreements in effect at the Company’s emergence from Chapter 11 bankruptcy on October 4, 2016 were assumed pursuant to the Plan of Reorganization, which was approved by substantial majorities of the Company’s creditors and confirmed by the Bankruptcy Court prior to the appointment of the Company’s Board. As previously described herein, the employment of Messrs. J. Bennett, Bott and S. Griffin terminated effective as of February 8, 2018, February 22, 2018, and March 1, 2018 respectively. As such, the discussion of the terms of their employment agreements herein reflects the terms of their employment agreements prior to their termination of employment.
24
The Company’s employment agreements, which have evergreen terms, provide, or provided, in respect of Messrs. J. Bennett, Bott and S. Griffin, for (i) an annual base salary of not less than $915,000 for Mr. J. Bennett, $425,000 for Mr. Bott, $420,000 for Mr. Suter, $225,000 for Mr. S. Griffin, $375,000 for Mr. Warman and $350,000 for Mr. Grubert; (ii) eligibility to participate in the annual incentive program; (iii) eligibility for equity awards under the Company’s incentive plan; and (iv) health and other employee benefits that are generally available to our employees.
In addition, the employment agreements include, or included, in respect of Messrs. J. Bennett, Bott and S. Griffin, provisions governing the payment of severance benefits payable to the named executive officers upon the occurrence of specified events, such as termination of their employment without cause or termination or resignation for good reason following a Change in Control of the Company. The employment agreements between us and our named executive officers and the related severance provisions are designed to meet the following objectives:
| ● | Change in Control. In certain scenarios, the potential to merge with or be acquired by another company may be in the best interest of our stockholders. We have agreed to provide severance compensation to our named executive officers if employment is terminated without cause or the executive resigns with good reason following a change in control transaction in recognition of the fact that our named executive officers may take actions in the best interest of our stockholders that ultimately lead to their departure from the Company. The Company’s emergence from Chapter 11 reorganization constituted a change in control under the terms of each outstanding employment agreement, which means that the terminations of each of Messrs. J. Bennett, Bott, S. Griffin and Grubert entitled him to Change in Control severance benefits. Mr. Warman will remain in a Change in Control period until October 4, 2018, during which time he will be entitled to Change in Control severance benefits in the event of his termination. Mr. Suter’s employment agreement with the Company, effective December 2016, is not currently in a Change in Control period. |
| ● | Termination without Cause. If we terminate any of our named executive officers’ employment without cause, we will pay certain compensation and other benefits to the terminated individual. We believe this arrangement is appropriate because it is consistent with the triggering events and associated payments found in employment agreements of companies that we compete against for executive-level talent. We also believe it is beneficial for us and our named executive officers to have a mutually agreed upon severance package in place prior to any termination event, which we believe provides us with more flexibility to make a change in senior management if such a change is in our and our stockholders’ best interest. |
The terms of our equity compensation plan also govern the payments and benefits named executive officers are entitled to in these situations. For a description of these payments, please read “—Potential Payments Upon Termination or Change in Control” below.
6. Actions Related to 2018 Executive Compensation
DEPARTURE OF PRESIDENT AND CHIEF EXECUTIVE OFFICER AND CHIEF FINANCIAL OFFICER
As discussed above, in light of our new strategic direction, discussions with large stockholders and robust deliberation among the independent members of the Board, the Company initiated a transition to a new leadership team, leading to the departure of Mr. J. Bennett, the Company’s President and CEO, effective February 8, 2018 and Mr. Bott, the Company’s Executive Vice President and Chief Financial Officer, effective at the closed of business on February 22, 2018. Messrs. J. Bennett and Bott were retained in their roles pursuant to the Plan of Reorganization, which was approved by substantial majorities of the Company’s creditors and confirmed by the Bankruptcy Court prior to the appointment of the current Board. The Plan of Reorganization required the assumption of their employment agreements, which provided for severance compensation in the event of termination without cause during the two year Change in Control period following the Company’s emergence from bankruptcy.
25
Pursuant to the terms of his employment agreement and the award agreements governing his outstanding equity awards, Mr. J. Bennett was entitled to severance compensation consisting of the following:
| ● |
a cash severance payment equal to $6,738,479 |
| ● |
the accelerated vesting of 343,085 shares of previously granted restricted stock |
| ● |
the accelerated vesting of 66,619 previously granted performance share units, which upon vesting, were converted into shares of common stock on a one-for-one basis (the “target” award quantity) |
| ● |
the accelerated vesting of 17,500 previously granted performance units, which were settled in cash at the “target” grant value of $100 per unit |
Pursuant to the terms of his employment agreement and the award agreements governing his outstanding equity awards, Mr. Bott was entitled to severance compensation consisting of the following:
| ● |
a cash severance payment equal to $2,840,234 |
| ● |
the accelerated vesting of 126,469 shares of previously granted restricted stock |
| ● |
the accelerated vesting of 18,418 previously granted performance share units, which upon vesting, were converted into shares of common stock on a one-for-one basis (the “target” award quantity) |
| ● |
the accelerated vesting of 6,167 previously granted performance units, which were settled in cash at the “target” grant value of $100 per unit |
APPOINTMENT OF INTERIM CHIEF EXECUTIVE OFFICER
Upon Mr. J. Bennett’s departure, Mr. B. Griffin, who at the time was serving as one of our independent directors, agreed to serve as President and CEO on an interim basis upon Mr. J. Bennett’s departure while the Company conducts a full review of internal and external candidates. Effective February 8, 2018, the Company entered into an Interim CEO Employment Agreement with Mr. B. Griffin (the “Interim CEO Employment Agreement”). The Interim CEO Employment Agreement has a term expiring five days after the date a successor President and CEO is appointed by the Board, unless terminated earlier by either party upon 30 days advance written notice (the “Employment Term”).
During the Employment Term, Mr. B. Griffin (i) will receive a monthly salary of $70,000, prorated for any partial month of service during the Employment Term; (ii) will be eligible to participate in a bonus program with a target bonus equal to 50% of Mr. B. Griffin’s salary with the amount of the bonus actually paid to Mr. B. Griffin being determined by the Compensation Committee based on performance objectives established by the Compensation Committee; provided, however, that in the event of a Change in Control as defined in the Interim CEO Employment Agreement, Mr. B. Griffin’s right to payments under the bonus program will vest for the duration of the Employment Term and such payments will be made for the duration of the Employment Term at the greater of the target bonus or the amount calculated by the Compensation Committee; (iii) will continue to receive an annual equity compensation award as granted to non-employee members of the Board, but will not receive an annual cash retainer or any other cash fees payable to non-employee members of the Board; (iv) will continue to vest in any outstanding equity awards as if he remained a non-employee director during the Employment Term; (v) will be eligible to participate in the employee benefit plans and programs available to senior executives of the Company; and (vi) will be reimbursed for expenses incurred in the performance of his duties, including (a) reasonable commuting costs incurred for travel from his residence in Dallas, Texas to the Company’s headquarters in Oklahoma City, Oklahoma, and (b) up to $2,500 monthly for the cost of housing in or near Oklahoma City, Oklahoma. Mr. B. Griffin will not be entitled to participate in any severance plan or otherwise receive any severance benefits or participate in the Company’s employee equity compensation program.
26
2018 ANNUAL INCENTIVE PLAN SCORECARD
For 2018, the Compensation Committee continued the use of an annual incentive program premised on balanced performance metrics. The Compensation Committee adopted a baseline annual incentive performance hurdle of $115 million in Adjusted EBITDA to serve as the prerequisite for funding the bonus pool and 2018 scorecard metrics tied to meeting specific base case performance targets with a discretionary component.
2018 LONG-TERM INCENTIVE AWARDS
For 2018, the Board intends to make long-term incentive grants comprised of at least 50% performance-based incentives in July.
PEER GROUP
In late 2017, the Compensation Committee reviewed the Company’s compensation peer group, with input from its independent compensation consultant and management. This review considered the following primary factors when assessing potential peer companies: industry, annual revenues, market value, total assets, business mix (crude oil vs. natural gas) as defined by revenues and proved reserves, operating regions, and complexity of operations. The goal was to position SandRidge near the middle of the group across these factors, while also considering companies against which the Company competes operationally and for executive talent. As a result of this review, the following 14 companies will comprise the peer group for 2018:
| Bill Barrett | Midstates Petroleum |
| Callon Petroleum | Oasis Petroleum |
| Carrizo Oil & Gas | PDC Energy |
| EP Energy | Sanchez Energy |
| Halcón Resources | SM Energy |
| Laredo Petroleum | SRC Energy |
| Matador Resources | Whiting Petroleum |
7. Other Executive Compensation Matters
CLAWBACK POLICY
The Company maintains a clawback policy that is administered by the Board. Under the policy, the Company, at the Board’s direction, will recover incentive compensation that has been erroneously paid in the event of a restatement or misconduct.
ROBUST STOCK OWNERSHIP GUIDELINES
The Company maintains stock ownership guidelines for executive officers and non-employee directors of the Company. The policy generally requires executives and non-employee directors to own stock in the Company equal to the following guidelines:
| PERCENTAGE OF SALARY REQUIRED |
|
|
Our executive officers and non-employee directors have five years from October 4, 2016 to fulfill this requirement or, if later, five years from the date of their appointment, promotion, or election to a role that is subject to the stock ownership guidelines. Until they are in compliance with the guidelines, our CEO is required to hold 50% of net shares issued (after tax and/or exercise) and other officers and non-employee directors are required to hold 60% of net shares issued.
27
ANTI-HEDGING AND ANTI-PLEDGING POLICIES
The Company maintains a policy that prohibits executives and non-employee directors from entering into agreements in which Company shares are pledged as security for a loan. It also prohibits executives and non-employee directors from engaging in hedging transactions involving Company stock.
RISK ASSESSMENT
Our compensation program for executives is not designed to encourage excessive risk taking. In that regard, payouts under the performance incentive program and performance unit plan are capped at 200% of target. In addition, all of our long-term incentives include extended vesting periods.
TAX TREATMENT OF EXECUTIVE COMPENSATION DECISIONS
Section 162(m) of the Internal Revenue Code (the “Code”), generally imposes a $1 million limit on the amount of compensation paid to certain executive officers that a public corporation may deduct for federal income tax purposes in any year. During 2017, the Code provided an exception to the Section 162(m) deduction limitation for compensation qualifying as “performance-based compensation” within the meaning of the Code and the applicable Treasury Regulations. During 2017, the Compensation Committee designed and administered our executive compensation program with the intent that certain portions of the compensation paid to our named executive officers would qualify as performance-based compensation under Section 162(m).
The “Tax Cuts and Jobs Act,” enacted in late 2017, repealed the performance-based compensation exception to the Section 162(m) deduction limitation for tax years beginning after December 31, 2017. While we will continue to monitor our compensation programs in light of the deduction limitation imposed by Section 162(m) of the Code, our Compensation Committee considers it important to retain the flexibility to design compensation programs that are in our best long-term interests and the long-term interests of our stockholders. As a result, the Compensation Committee may conclude that paying compensation at levels that are subject to limits under Section 162(m) of the Code is nevertheless in the best interests of the Company and our stockholders. Given changes made to Section 162(m) by the “Tax Cuts and Jobs Act,” which took effect in 2018, we may not be able to deduct for federal income tax purposes a portion of the compensation paid to our named executive officers in 2018.
COMPENSATION COMMITTEE REPORT
The Compensation Committee has reviewed and discussed the disclosure set forth above under the heading “Compensation Discussion and Analysis” with management and, based on this review and discussion, the Compensation Committee has recommended to the Board that the “Compensation Discussion and Analysis” be included in this CD&A.
By the members of the Compensation Committee:
Sylvia K. Barnes, Chair
Michael L. Bennett
28
EXECUTIVE COMPENSATION TABLES
Summary Compensation Table
| Name and Principal Position | Year | Salary | Bonus(d) | Stock Awards(e) |
Non-Equity Incentive Plan Compensation (f) |
All Other Compensation (g) |
Total | |||||||||||||
| James D. Bennett President and Chief Executive Officer |
2017 | $ | 915,000 | $ | — | $ | 5,328,874 | $ | 1,015,000 | $ | 18,300 | $ | 7,277,174 | |||||||
| 2016 | 918,519 | 500 | 9,279,077 | 8,482,027 | 144,727 | 18,824,850 | ||||||||||||||
| 2015 | 918,519 | 1,375,001 | 6,202,746 | 1,409,100 | 216,537 | 10,121,903 | ||||||||||||||
| Julian M. Bott Executive Vice President and Chief Financial Officer |
2017 | $ | 425,000 | $ | — | $ | 1,473,297 | $ | 357,628 | $ | 24,300 | $ | 2,280,225 | |||||||
| 2016 | 426,635 | — | 3,269,775 | 2,483,503 | 110,136 | 6,290,049 | ||||||||||||||
| 2015 | 161,827 | 300,000 | 800,001 | 535,500 | 21,326 | 1,818,654 | ||||||||||||||
| John P. Suter(a) Executive Vice President and Chief Operating Officer |
2017 | $ | 420,000 | $ | — | $ | 1,497,573 | $ | 680,572 | $ | 24,300 | $ | 2,622,445 | |||||||
| 2016 | 357,168 | — | 1,767,432 | 1,031,777 | 24,298 | 3,180,675 | ||||||||||||||
| 2015 | — | — | — | — | — | — | ||||||||||||||
| Philip T. Warman Executive Vice President, General Counsel and Corporate Secretary |
2017 | $ | 375,000 | $ | — | $ | 557,130 | $ | 471,250 | $ | 18,300 | $ | 1,421,680 | |||||||
| 2016 | 376,442 | — | 1,325,586 | 1,120,565 | 38,303 | 2,860,896 | ||||||||||||||
| 2015 | 376,442 | 275,000 | 725,812 | 366,125 | 71,361 | 1,814,740 | ||||||||||||||
| Scott Griffin(b) Senior Vice President, People and Culture |
2017 | $ | 250,000 | $ | — | $ | 309,502 | $ | 333,500 | $ | 24,300 | $ | 917,302 | |||||||
| 2016 | — | — | — | — | — | — | ||||||||||||||
| 2015 | — | — | — | — | — | — | ||||||||||||||
| Duane M. Grubert(c) Former Executive Vice President of Investor Relations and Strategy |
2017 | $ | 203,235 | $ | — | $ | 926,604 | $ | 193,372 | $ | 2,475,330 | $ | 3,798,541 | |||||||
| 2016 | 386,481 | — | 1,767,432 | 1,702,661 | 43,919 | 3,900,493 | ||||||||||||||
| 2015 | 352,558 | 225,001 | 870,406 | 421,400 | 71,904 | 1,941,269 | ||||||||||||||
| (a) |
Mr. Suter was appointed Executive Vice President and Chief Operating Officer in December 2016 and was first a named executive officer for 2016. |
| (b) |
Mr. S. Griffin was first a named executive officer for 2017. |
| (c) |
Mr. Grubert departed from his role as Executive Vice President of Investor Relations and Strategy, effective July 11th, 2017. |
| (d) |
The bonus amounts shown as earned in this column include (i) an award made to Mr. J. Bennett in 2016 under the Company’s service award program, which recognizes all eligible employees on the fifth anniversary of their employment and (ii) time-vested supplemental retention awards made to all named executive officers in 2015 comprised of fixed-value cash awards. |
| (e) |
The stock awards shown in this column reflect the aggregate grant date fair value of restricted stock and performance share units awarded in 2017 and restricted stock, restricted stock units, performance units and performance share units awarded in prior years calculated in accordance with Financial Accounting Standards Board Accounting Standards Codification Topic 718, Compensation-Stock Compensation. These amounts do not necessarily correspond to the actual value that will be realized by our named executive officers. On the Effective Date, all equity interests of the Company issued and outstanding immediately prior, including outstanding restricted stock, restricted stock units, performance units and performance share units shown in this column for 2015, were deemed cancelled, discharged and of no force or effect. Refer to the Grants of Plan-Based Awards Table for 2017 for additional information regarding awards of restricted stock made to the named executive officers in 2017. See “Compensation Discussion and Analysis- 2017 Executive Compensation” for a description of the material features of the awards granted in 2017. The assumptions used by the Company in calculating the amounts related to restricted stock, restricted stock units, performance units and performance share units are incorporated by reference to Note 17 of the consolidated financial statements included in the Original Report. |
| (f) |
For Messrs. J. Bennett and Bott, the amounts shown for 2017 represent the vesting of the 2017 tranche of performance units under the performance incentive program. For Messrs. S. Griffin, Suter and Warman the amounts shown represent the vesting of the 2017 tranche of performance units under the performance incentive program and the payment made under the annual incentive plan for 2017, but paid in 2018. For each year the amounts shown reflect payments made with respect to services rendered in the designated year and paid in the designated year or the following year under the Company’s performance-based incentive programs. See “Compensation Discussion and Analysis- 2017 Executive Compensation” for a description of the material features of the 2017 annual incentive plan. |
| (g) |
All Other Compensation provided to our named executive officers includes: |
29
| Name | Year | Life Insurance Premiums |
Company Matching Contributions to 401(k) Plan |
Company Matching Contributions to Deferred Comp Plan |
Certain Other(i) |
Perquisites(ii) | Total | |||||||||||||
| James D. Bennett | 2017 | $ | 300 | $ | 18,000 | $ | — | $ | — | $ | — | $ | 18,300 | |||||||
| 2016 | 298 | 18,000 | 126,429 | — | — | 144,727 | ||||||||||||||
| 2015 | 270 | 18,000 | 198,267 | — | — | 216,537 | ||||||||||||||
| Julian M. Bott | 2017 | $ | 300 | $ | 24,000 | $ | — | $ | — | $ | — | $ | 24,300 | |||||||
| 2016 | 298 | 8,113 | — | — | 101,725 | 110,136 | ||||||||||||||
| 2015 | 42 | 4,577 | — | — | 16,707 | 21,326 | ||||||||||||||
| John P. Suter | 2017 | $ | 300 | $ | 24,000 | $ | — | $ | — | $ | — | $ | 24,300 | |||||||
| 2016 | 298 | 24,000 | — | — | — | 24,298 | ||||||||||||||
| 2015 | — | — | — | — | — | — | ||||||||||||||
| Philip T. Warman | 2017 | $ | 300 | $ | 18,000 | $ | — | $ | — | $ | — | $ | 18,300 | |||||||
| 2016 | 298 | 18,000 | 20,005 | — | — | 38,303 | ||||||||||||||
| 2015 | 270 | 18,000 | 53,091 | — | — | 71,361 | ||||||||||||||
| Scott Griffin | 2017 | $ | 300 | $ | 24,000 | $ | — | $ | — | $ | — | $ | 24,300 | |||||||
| 2016 | — | |||||||||||||||||||
| 2015 | — | |||||||||||||||||||
| Duane M. Grubert | 2017 | $ | 173 | $ | 21,804 | $ | — | $ | 2,453,352 | $ | — | $ | 2,475,330 | |||||||
| 2016 | 298 | 24,000 | 19,621 | — | — | 43,919 | ||||||||||||||
| 2015 | 270 | 24,000 | 47,634 | — | — | 71,904 | ||||||||||||||
| (i) |
The amount reported in this column for Mr. Grubert in 2017 includes the amount paid or accrued in connection with his departure from the Company, effective July 11th, 2017, including (a) severance in the amount of $2,403,582, which equals three times the sum of his base salary plus the three-year average of annual incentive plan payments, (b) accrued but unused vacation pay in the amount of $44,423 and (c) reimbursement of $5,347 for aggregate monthly Consolidated Omnibus Budget Reconciliation Act premiums over five months. |
| (ii) |
The amount reported for Mr. Bott in 2016 includes relocation and temporary housing of $100,000, long-term disability premiums of $1,183 and the face value of tickets to sporting events of $542. The amount reported for Mr. Bott in 2015 includes $16,498 for temporary housing and $209 for long-term disability premiums. Perquisites and other personal benefits provided to each of the other named executive officers had an aggregate incremental value of less than $10,000 and accordingly have been omitted from the table in accordance with SEC rules. |
Grants of Plan-Based Awards
The following table sets forth information about each grant of an award made to our named executive officers in 2017.
| Estimated Possible or Future Payouts Under Non-Equity Incentive Plan Awards ($) |
Estimated Possible or Future Payouts Under Equity Incentive Plan Awards (#) |
All Other Stock Awards: Number of Shares of Stock or Units |
Grant Date Fair Value | |||||||||||||||||||||||
| Name | Type of Award(a) |
Grant Date | Approval Date |
Threshold (50%) |
Target (100%) |
Maximum (200%) |
Threshold (0%) |
Target (100%) |
Maximum (200%) | |||||||||||||||||
| James D. Bennett | AIP | — | — | $ | 503,250 | $ | 1,006,500 | $ | 2,013,000 | — | — | — | — | $ | — | |||||||||||
| RSA | 02/15/2017 | 02/06/2017 | — | — | — | — | — | — | 199,858 | 4,035,133 | ||||||||||||||||
| PSU | 02/15/2017 | 02/06/2017 | — | — | — | — | 66,619 | 133,238 | — | 1,293,741 | ||||||||||||||||
| Julian M. Bott | AIP | — | — | $ | 191,250 | $ | 382,500 | $ | 765,000 | — | — | — | — | $ | — | |||||||||||
| RSA | 02/15/2017 | 02/06/2017 | — | — | — | — | — | — | 55,256 | 1,115,619 | ||||||||||||||||
| PSU | 02/15/2017 | 02/06/2017 | — | — | — | — | 18,418 | 36,836 | — | 357,678 | ||||||||||||||||
| John P. Suter | AIP | — | — | $ | 210,000 | $ | 420,000 | $ | 840,000 | — | — | — | — | $ | — | |||||||||||
| RSA | 02/15/2017 | 02/06/2017 | — | — | — | — | — | — | 56,166 | 1,133,992 | ||||||||||||||||
| PSU | 02/15/2017 | 02/06/2017 | — | — | — | — | 18,722 | 37,444 | — | 363,581 | ||||||||||||||||
| Philip T. Warman | AIP | — | — | $ | 140,625 | $ | 281,250 | $ | 562,500 | — | — | — | — | $ | — | |||||||||||
| RSA | 02/15/2017 | 02/06/2017 | — | — | — | — | — | — | 20,895 | 421,870 | ||||||||||||||||
| PSU | 02/15/2017 | 02/06/2017 | — | — | — | — | 6,965 | 13,930 | — | 135,260 | ||||||||||||||||
| Scott Griffin | AIP | — | — | $ | 81,250 | $ | 162,500 | $ | 325,000 | — | — | — | — | $ | — | |||||||||||
| RSA | 02/15/2017 | 02/06/2017 | — | — | — | — | — | — | 11,608 | 234,366 | ||||||||||||||||
| PSU | 02/15/2017 | 02/06/2017 | — | — | — | — | 3,869 | 7,738 | — | 75,136 | ||||||||||||||||
| Duane M. Grubert | AIP | — | — | $ | 173,250 | $ | 346,500 | $ | 693,000 | — | — | — | — | $ | — | |||||||||||
| RSA | 02/15/2017 | 02/06/2017 | — | — | — | — | — | — | 34,752 | 701,643 | ||||||||||||||||
| PSU | 02/15/2017 | 02/06/2017 | — | — | — | — | 11,584 | 23,168 | — | 224,961 | ||||||||||||||||
| (a) |
AIP, RSA and PSU award types refer to the annual incentive plan, restricted stock awards and performance stock units, respectively. Amounts reported reflect estimated possible or future payouts under these plans and awards; however, no payments were made under the 2017 annual incentive plan awards to Messrs. Bennett, Bott and Grubert. |
30
For a description of the material terms of the awards detailed in the Grants of Plan-Based Awards table, please see “2017 Executive Compensation – Annual Incentive Program.”
Outstanding Equity Awards at Fiscal Year-End
The following table reflects all outstanding equity awards held by each of our named executive officers as of December 31, 2017:
| Stock Awards | PSU’s | ||||||||||||
| Name | Grant Date | Number of Shares or Units of Stock That Have Not Vested (#)(a) |
Market Value of Shares or Units of Stock That Have Not Vested ($)(b) |
Equity Incentive Plan Awards: Number of Unearned Units That Have Not Vested (#)(c) |
Equity Incentive Plan Awards: Value of Unearned Units That Have Not Vested ($)(b) |
||||||||
| James D. Bennett | 2/15/2017 | 133,238 | $ | 2,807,325 | 66,619 | $ | 1,403,662 | ||||||
| 10/19/2016 | 209,847 | $ | 4,421,476 | ||||||||||
| Julian M. Bott | 2/15/2017 | 36,837 | $ | 776,156 | 18,418 | $ | 388,067 | ||||||
| 10/19/2016 | 89,632 | $ | 1,888,546 | ||||||||||
| John P. Suter | 2/15/2017 | 37,444 | $ | 788,945 | 18,722 | $ | 394,473 | ||||||
| 10/19/2016 | 48,449 | $ | 1,020,820 | ||||||||||
| Philip T. Warman | 2/15/2017 | 13,930 | $ | 293,505 | 6,965 | $ | 146,753 | ||||||
| 10/19/2016 | 36,337 | $ | 765,621 | ||||||||||
| Scott Griffin | 2/15/2017 | 7,738 | $ | 163,040 | 3,869 | $ | 81,520 | ||||||
| 10/19/2016 | 36,337 | $ | 765,621 | ||||||||||
| Duane M. Grubert | 2/15/2017 | — | — | 11,584 | $ | 244,075 | (d) | ||||||
| 10/19/2016 | — | — | |||||||||||
| (a) |
Includes shares of restricted stock granted on February 15, 2017, which vest in one-third increments on June 30 of each of 2017, 2018 and 2019, and shares of restricted stock granted on October 19, 2016 following the Company’s emergence from Chapter 11 Reorganization, which vest in one-third increments on each of the first three anniversaries of the grant date. |
| (b) |
Valuations are based on $21.07 per share, which was the last trading price for a share of the Company’s common stock on the NYSE on December 29, 2017. |
| (c) |
Includes the number of performance stock units granted on February 15, 2017, which vest in one-third increments on June 30 of each of 2017, 2018 and 2019 and will be settled in the Company’s common stock in an amount based on the Company’s performance relative to pre-established objectives over the performance period from January 1, 2017 to June 30, 2019, provided that the grantee remains employed until the date of settlement. The disclosure is made at “target” performance level because the Company’s performance is not reasonably estimable as of December 31, 2017. |
| (d) |
Performance stock units granted to Mr. Grubert remained outstanding following his termination in July 2017 and will vest in accordance with the terms of the award agreement governing the performance stock units. |
Option Exercises and Stock Vested
The following table reflects the shares of restricted stock of each of our named executive officers that vested during 2017. No stock options were outstanding or exercised in 2017.
| Stock Awards | ||||
| Name | Number of Shares Acquired on Vesting(a) |
Value Realized on Vesting(b) | ||
| James D. Bennett | 238,314 | $ | 4,513,577 | |
| Julian M. Bott | 63,235 | $ | 1,172,977 | |
| John P. Suter | 42,947 | $ | 784,903 | |
| Philip T. Warman | 25,134 | $ | 466,896 | |
| Scott Griffin | 22,039 | $ | 413,631 | |
| Duane M. Grubert(c) | 107,426 | $ | 2,062,529 | |
31
| (a) |
Includes shares of restricted stock granted on February 15, 2017 which vested on June 30, 2017 and shares of emergence long-term incentive restricted stock granted on October 19, 2016 which vested on October 19, 2017. For Mr. J. Bennett, this number includes 57,231 shares of restricted stock transferred to Natasha Bennett pursuant to a domestic relations order, 44,513 of which remained outstanding at year end. |
| (b) |
The values realized upon vesting for restricted stock are based on the last trading price for a share of the company’s common stock on the applicable vesting date for such shares. For Mr. J. Bennet, this value also includes restricted stock transferred to Natasha Bennett that remained outstanding at year end based on $21.07 per share, which was this last trading price for a share of the Company’s common stock on the NYSE on December 29, 2017. |
| (c) |
For Mr. Grubert, 11,584 shares vested on June 30, 2017 pursuant to the terms of his restricted stock award and the remaining 95,842 shares vested on July 11, 2017 upon his termination of employment pursuant to the terms of employment agreement. |
Nonqualified Deferred Compensation
The Company resolved to terminate the NQDC Plan effective December 31, 2016 in a manner consistent with Section 14 of the Plan and Section 409A of the Code. In 2017, following the resolution to terminate the NQDC Plan, no additional deferrals or contributions were permitted into the NQDC Plan. However, account balances under the NQDC Plan continued to accrue earnings until the aggregate balances as of January 1, 2018 were distributed to participants on January 31, 2018.
Previously, we maintained the NQDC Plan for the benefit of eligible employees, including all of our named executive officers. Under the NQDC Plan, we made discretionary contributions to the deferred compensation account of each participant. The Board approved matching contributions for the NQDC Plan equal to 100% of employee contributions up to 10% of the employee’s annual cash compensation minus any matching contributions made under the 401(k) retirement plan.
During 2017, participant’s accounts under the NQDC Plan were held in a rabbi trust and were adjusted for earnings and losses based on deemed investment choices selected by the participant from the fund selections made available in the NQDC Plan. The available investment choices mirrored the investment choices available under our 401(k) retirement plan and did not provide guaranteed above-market or preferential earnings on deferred compensation.
The following table sets forth activity under the NQDC Plan for 2017:
| Name | Executive Contributions in Last Fiscal Year |
Registrant Contributions in Last Fiscal Year |
Aggregate Earnings in Last Fiscal Year |
Aggregate Withdrawals/ Distributions |
Aggregate Balance at Last Fiscal Year-End(a) | ||||||||||
| James D. Bennett | $ | — | $ | — | $ | 40,566 | $ | — | $ | 1,225,166 | |||||
| Julian M. Bott | $ | — | $ | — | $ | — | $ | — | $ | — | |||||
| John P. Suter | $ | — | $ | — | $ | — | $ | — | $ | — | |||||
| Philip T. Warman | $ | — | $ | — | $ | 30,806 | $ | — | $ | 482,342 | |||||
| Scott Griffin | $ | — | $ | — | $ | 9,733 | $ | — | $ | 63,718 | |||||
| Duane M. Grubert | $ | — | $ | — | $ | 5,714 | $ | — | $ | 150,438 | |||||
| (a) |
The aggregate balance for each named executive officer includes amounts reported as compensation in the Summary Compensation Table for previous years as follows: in 2016, $126,429 for Mr. J. Bennett, $20,005 for Mr. Warman and $19,621 for Mr. Grubert; in 2015, $198,267 for Mr. J. Bennett, $53,091 for Mr. Warman and $47,634 for Mr. Grubert; in 2014, $318,178 for Mr. J. Bennett; in 2013, $204,452 for Mr. J. Bennett; in 2012, $158,066 for Mr. J. Bennett. The aggregate balance for each named executive officer does not include amounts reported as compensation in the Summary Compensation Table for 2017, because no contributions we made by the registrant in that year. |
Potential Payments Upon Termination of Change in Control
The employment agreements we currently maintain with our named executive officers, together with our incentive and deferred compensation plans and the agreements governing equity and performance unit awards, provide for specified payments in the event of a termination under certain conditions or a Change in Control (as defined below). The following discussion describes these arrangements with current named executive officers. As noted above, Mr. Grubert departed from the Company effective July 1, 2017, Mr. J. Bennett departed the Company effective February 8, 2018, Mr. Bott departed the Company effective at the close of business on February 22, 2018 and Mr. S. Griffin departed the Company effective March 1, 2018.
32
Termination without Cause
The Company may terminate its employment arrangement with its named executive officers at any time without cause. Upon such a termination, the named executive officer is entitled to receive (i) a lump sum payment equal to twelve months base salary in effect on the termination date, (ii) accelerated vesting of all unvested restricted stock and (iii) accelerated vesting of all unvested performance units and performance share units, provided that the units shall only be payable subject to the attainment of the performance measures for the applicable performance period as provided under the terms of the applicable award agreement.
Change in Control
Other than restricted stock awards granted beginning in December 2017, upon a Change in Control, named executive officers are entitled to receive (i) accelerated vesting of all unvested restricted stock, (ii) accelerated vesting of all unvested performance units, with payment based on the unit’s target value, and (iii) accelerated vesting of all unvested performance share units at the target award quantity.
In the event that employment is terminated within two years of a Change in Control without cause, a named executive officer is entitled to receive a lump sum cash payment in an amount equal to a multiple of his base salary and average annual bonus calculated based on the bonuses paid over the preceding three years. If the foregoing lump sum cash amount is not paid within sixty days after the termination in connection with a Change in Control event, the unpaid amount will bear interest at a rate equal to 12% per annum.
The Company’s emergence from Chapter 11 reorganization, effective October 4, 2016, constituted a Change in Control under the terms of each outstanding employment agreement. Therefore, the terminations of Messrs. J. Bennett, Bott, S. Griffin and Grubert entitled them to Change in Control severance benefits of three times, in the case of Messrs. J. Bennett, Bott and Grubert, and two times, in the case of Mr. S. Griffin, his base salary and average annual bonus. Mr. Warman will remain in a Change in Control period until October 4, 2018, during which time he will be entitled to Change in Control severance benefits in the event of his termination, calculated using a two-times multiple. Mr. Suter executed a new employment agreement with the Company, effective December 2016, which contemplates a two-times multiple and is not currently in a Change in Control period.
In addition, in the event of a termination in connection with a Change in Control, notwithstanding any provision to the contrary in any option agreement, restricted stock agreement, plan or other agreement relating to equity based compensation, all of the named executive officer’s units, stock options, incentive stock options, performance units, performance share units, stock appreciation rights and restricted stock (collectively, “awards”) will immediately vest. In such event, the named executive officer will be entitled to payment in respect of the performance units made at the unit’s “target” value of $100 and the conversion of performance share units at the “target” award quantity of 100%. Further, the executive’s right to exercise any previously unexercised options will not terminate until the latest date on which such option would expire but for the executive’s termination. To the extent we are unable to provide for one or both of the foregoing rights, we will provide in lieu thereof a lump-sum cash payment equal to the difference between the total value of such awards with the foregoing rights and the total value without the foregoing rights.
In addition, the executive will be entitled to the above-described payments if, within two years of a Change in Control, he resigns for good reason which includes a material diminution in his authority, duties or responsibilities or a material reduction in his then current base salary or other benefits set forth in his employment agreement.
As used in the employment agreements, “Change in Control” means any one of the following:
(a) any “person,” as such term is used in Sections 13(d) and 14(d) of the Exchange Act (other than the Company, any trustee or other fiduciary holding securities under any employee benefit plan of the Company, or any company owned, directly or indirectly, by the stockholders of the Company in substantially the same proportions as their ownership of common stock of the Company), becoming the beneficial owner (as defined in Rule 13d 3 under the Exchange Act), directly or indirectly, of securities of the Company representing 50% or more of the combined voting power of the Company’s then outstanding securities;
33
(b) during any period of 24 consecutive calendar months, individuals who were directors of the Company on the first day of such period (the “Incumbent Directors”) cease for any reason to constitute a majority of the Board; provided, however, that any individual becoming a director subsequent to the first day of such period whose election, or nomination for election, by the Company’s stockholders was approved by a vote of at least two-thirds of the Incumbent Directors will be considered as though such individual were an Incumbent Director, but excluding, for purposes of this proviso, any such individual whose initial assumption of office occurs as a result of an actual or threatened proxy contest with respect to election or removal of directors or other actual or threatened solicitation of proxies or consents by or on behalf of a “person” (as used in Section 13(d) of the Exchange Act), in each case, other than the Board, which individual, for the avoidance of doubt, shall not be deemed to be an Incumbent Director for purposes of this Section 10.2(b), regardless of whether such individual was approved by a vote of at least two-thirds of the Incumbent Directors;
(c) consummation of a reorganization, merger, consolidation or other business combination (any of the foregoing, a “Business Combination”) of the Company or any direct or indirect subsidiary of the Company with any other corporation, in any case with respect to which the Company voting securities outstanding immediately prior to such Business Combination do not, immediately following such Business Combination, continue to represent (either by remaining outstanding or being converted into voting securities of the Company or any ultimate parent thereof) more than 50% of the then outstanding voting securities entitled to vote generally in the election of directors of the Company (or its successor) or any ultimate parent thereof after the Business Combination; or
(d) a complete liquidation or dissolution of the Company or the consummation of a sale or disposition by the Company of all or substantially all of the Company’s assets other than the sale or disposition of all or substantially all of the assets of the Company to a person or persons who beneficially own, directly or indirectly, 50% or more of the combined voting power of the outstanding voting securities of the Company at the time of the sale.
Termination for Cause
Pursuant to the employment agreements in effect on December 31, 2017, if a named executive officer is terminated for cause, neither the Company nor the executive has any further obligations except for those expressly surviving termination of employment. Upon such a termination after a named executive officer attains the age of 60, the executive will be eligible for immediate vesting of unvested Company matching contributions under our 401(k) retirement plan.
Voluntary Termination by Executive/Retirement
Pursuant to the employment agreements in effect on December 31, 2017, if a named executive officer voluntarily terminates his employment, neither the Company nor the executive has any further obligations except for those expressly surviving termination of employment. Upon retirement after the attainment of age 60, a named executive officer will be eligible for immediate vesting of unvested Company matching contributions under our 401(k) retirement plan.
Termination due to Death or Disability
Pursuant to the employment agreements in effect on December 31, 2017, if a named executive officer suffers from a continuous physical or mental condition for a period of six months that constitutes a disability under the Company’s Long Term Disability policy, the executive’s employment may be terminated by the Company. Upon a termination due to death or disability, the named executive officer or his estate is entitled to receive (i) a lump sum payment equal to twelve months base salary in effect on the termination date, reduced by benefits payable under disability plans provided by the Company, (ii) accelerated vesting of all unvested restricted stock, (iii) accelerated vesting of all unvested performance units, provided that such units shall only be payable subject to the attainment of the performance measures for the applicable performance period as provided under the terms of the applicable award agreement and (iv) immediate vesting of unvested Company matching contributions under our 401(k) retirement plan.
34
Payment Conditions
The right to severance compensation is subject to the named executive officer’s execution of a severance agreement and general release, which operates as a release of all legally waivable claims against the Company and its affiliates, employees and directors. The employment agreements in effect on December 31, 2017 also provide for a 12 month non-solicitation and non-interference period after termination of employment during which the executive agrees not to solicit employees and customers or conduct activities likely to be competitive with the business of the Company. The employment agreements also subject the executive to certain confidentiality obligations. Termination payments are further conditioned upon the executive’s compliance with all such post-employment obligations.
If any amount payable to a named executive officer under his employment agreement or otherwise would constitute a “parachute payment” within the meaning of Section 280G of the Code and, but for the terms of the agreement, would be subject to the excise tax imposed by Section 4999 of the Code (the “Excise Tax”), then the executive’s payments under the agreement will be reduced to the greatest amount that would not be subject to the Excise Tax if, after taking into account applicable federal, state, local and foreign income and employment taxes, the Excise Tax, and any other applicable taxes, the executive would retain a greater amount on an after-tax basis following such reduction.
Summary of Potential Payments upon Termination or Change in Control
The following table presents our reasonable estimate of the benefits that would have been payable to our named executive officers under their employment agreements assuming that each triggering event took place on December 31, 2017. While we have made reasonable assumptions regarding the amounts, there can be no assurance that the named executive officers would have received the amounts reflected below in the event of an actual termination of employment.
| Termination Other Than for Cause |
Termination by Executive/ Retirement |
Termination in Connection with Change in Control |
Termination Due to Death/Disability | |||||||||
| James D. Bennett | ||||||||||||
| Cash Severance(a) | $ | 915,000 | $ | 6,738,479 | $ | 915,000 | ||||||
| RSA & PSU Award(b) | $ | 8,632,463 | $ | 8,632,463 | $ | 8,632,463 | ||||||
| PU Award(c) | $ | 1,750,000 | $ | 1,750,000 | $ | 1,750,000 | ||||||
| TOTAL | $ | 11,297,463 | $ | — | $ | 17,120,942 | $ | 11,297,463 | ||||
| Julian M. Bott | ||||||||||||
| Cash Severance | $ | 425,000 | $ | 2,840,234 | $ | 425,000 | ||||||
| RSA & PSU Award | $ | 3,052,769 | $ | 3,052,769 | $ | 3,052,769 | ||||||
| PU Award | $ | 616,700 | $ | 616,700 | $ | 616,700 | ||||||
| TOTAL | $ | 4,094,469 | $ | — | $ | 6,509,703 | $ | 4,094,469 | ||||
| John P. Suter | ||||||||||||
| Cash Severance | $ | 420,000 | $ | 1,453,166 | $ | 420,000 | ||||||
| RSA & PSU Award | $ | 2,204,239 | $ | 2,204,239 | $ | 2,204,239 | ||||||
| PU Award | $ | 333,300 | $ | 333,300 | $ | 333,300 | ||||||
| TOTAL | $ | 2,957,539 | $ | — | $ | 3,990,705 | $ | 2,957,539 | ||||
| Philip T. Warman | ||||||||||||
| Cash Severance | $ | 375,000 | $ | 1,460,264 | $ | 375,000 | ||||||
| RSA & PSU Award | $ | 1,205,879 | $ | 1,205,879 | $ | 1,205,879 | ||||||
| PU Award | $ | 250,000 | $ | 250,000 | $ | 250,000 | ||||||
| TOTAL | $ | 1,830,879 | $ | — | $ | 2,916,143 | $ | 1,830,879 | ||||
| Scott Griffin | ||||||||||||
| Cash Severance | $ | 250,000 | $ | 910,375 | $ | 250,000 | ||||||
| RSA & PSU Award | $ | 1,010,180 | $ | 1,010,180 | $ | 1,010,180 | ||||||
| PU Award | $ | 250,000 | $ | 250,000 | $ | 250,000 | ||||||
| TOTAL | $ | 1,510,180 | $ | — | $ | 2,170,555 | $ | 1,510,180 | ||||
| (a) |
For the Termination Other Than For Cause and Termination Due to Death or Disability columns this amount includes each officer’s base salary for 12 months. For the Termination in Connection with a Change in Control column, this amount includes three times in the case of Messrs. J. Bennett and Bott, or two times in the case of Messrs. Suter, Warman and S. Griffin, the sum of their respective base salary and average bonus and performance incentive paid for the last three years. |
35
| (b) |
Includes the value of the officer’s unvested restricted stock and performance share units held as of December 31, 2017, based on the closing trading price on December 29, 2017 of $21.07 per share and the conversion to shares of common stock of the performance share units at the target award quantity. |
| (c) |
Includes the value of the unvested 2018 and 2019 tranches of the 2016 performance unit awards held as of December 31, 2017 at $100 per unit, which assumes target performance of 100% under the applicable annual performance scorecard for each tranche. |
Grubert Severance
As discussed above, Mr. Grubert departed the Company, effective July 11, 2017. Mr. Grubert was retained in his role following the Company’s emergence from Chapter 11 bankruptcy, pursuant to which the Plan of Reorganization required the assumption of his employment agreement. The Plan of Reorganization was approved by the Company’s creditors and the Bankruptcy Court prior to the appointment of the Company’s current board members.
Pursuant to the terms of his employment agreement, Mr. Grubert was entitled to Change in Control severance compensation consisting of the following: a cash severance payment equal to $2,403,582 (equal to three times the sum of his base salary and average bonus for the three years prior to his termination) and the accelerated vesting of 95,842 shares of restricted stock.
Director Compensation
Following the Company’s Annual Stockholders Meeting in June of 2017, our Board revisited the compensation program for non-employee directors in and determined to reduce the quarterly cash retainer payable to non-employee directors. For 2017, the compensation program for our non-employee directors consisted of (a) for the first six months of 2017, a quarterly cash retainer of $37,500 for the Chairman of the Board, $31,875 for the Chairman of the Audit Committee and $29,375 for all other non-employee directors, (b) for the final six months of 2017, a quarterly cash retainer of $30,000 for the Chairman of the Board, $25,500 for the Chairman of the Audit Committee and $23,500 for all other non-employee directors, (c) a grant of restricted stock with an aggregate grant date fair value, rounded up to the nearest whole share, of $180,000 for the Chairman of the Board, $153,000 for the Chairman of the Audit Committee and $141,000 for all other non-employee directors. Directors who also serve as employees receive no additional compensation for serving on our Board during 2017. Shares of restricted stock granted to non-employee directors vest in one-third increments on each of the first three anniversaries of the grant date, unless otherwise accelerated in the sole discretion of the Compensation Committee. Upon a Change in Control of the Company, a resignation following a failure to receive a majority of vote “for” in an uncontested election or a failure to receive the required votes “for” in a contested election, all outstanding restricted stock awards held by our non-employee directors will vest in full.
The following table sets forth the compensation of our non-employee directors for the fiscal year ended December 31, 2017.
| Name | Fees Earned or Paid in Cash |
Stock Awards(a) | Total | ||||||
| Michael L. Bennett | $ | 105,750 | $ | 141,002 | $ | 246,752 | |||
| John V. Genova | $ | 135,000 | $ | 180,017 | $ | 315,017 | |||
| Bill Griffin | $ | 105,750 | $ | 141,002 | $ | 246,752 | |||
| David J. Kornder | $ | 114,750 | $ | 153,014 | $ | 267,764 | |||
| (a) |
Reflects the aggregate grant date fair value of restricted stock granted on June 30, 2017 consisting of 8,193 shares granted to each serving non-employee director and, in respect of Mr. Genova, an additional 2,267 shares awarded for service as Chairman of the Board and, in respect of Mr. Kornder, an additional 698 shares awarded for service as Chairman of the Audit Committee. The value is calculated in accordance with Financial Standards Board Accounting Standards Codification Topic 718, Compensation-Stock Compensation. These amounts do not necessarily correspond to the actual value that will be recognized by our directors. The assumptions used by the Company in calculating the amounts related to restricted stock are incorporated by reference to Note 17 of the consolidated financial statements included in the Original Report. |
36
The following table reflects all outstanding equity awards held by our non-employee directors as of December 31, 2017.
| Name | Stock Awards | ||||
| Number of Shares or Units of Stock That Have Not Vested(a) |
Market Value of Shares or Units of Stock That Have Not Vested(b) | ||||
| Michael L. Bennett | 13,877 | $ | 292,388 | ||
| John V. Genova | 17,727 | $ | 373,508 | ||
| Bill Griffin | 13,877 | $ | 292,388 | ||
| David J. Kornder | 15,060 | $ | 317,314 | ||
| (a) |
Reflects shares of restricted stock granted to non-employee directors on October 19, 2016 and June 30, 2017 which vest in one-third increments on each of the first three anniversaries of the grant date. |
| (b) |
Valuations are based on $21.07 per share, which was the last trading price for a share of our common stock on the NYSE on December 29, 2017. |
Indemnification
We have entered into an indemnification agreement with each of our directors and executive officers (each an “indemnitee”), which is intended to permit indemnification to the fullest extent now or hereafter permitted by the Delaware General Corporate Law. It is possible that the applicable law could change the degree to which indemnification is expressly permitted.
Each indemnification agreement covers expenses (including attorneys’ fees), judgments, fines and amounts paid in settlement incurred by an indemnitee when, in his or her capacity as a director or officer, the indemnitee is made or threatened to be made a party to any suit or proceeding. Each indemnification agreement generally covers claims relating to the fact that the indemnitee is or was an officer, director, employee or agent of ours or any of our affiliates, or is or was serving at our request in such a position for another entity. Each indemnification agreement also obligates us to promptly advance all reasonable expenses incurred in connection with any claim. The indemnitee is, in turn, obligated to reimburse us for all amounts so advanced if it is later determined that the indemnitee is not entitled to indemnification. The indemnification provided under the indemnification agreements is not exclusive of any other indemnity rights of an indemnitee; however, double recovery by an indemnitee is prohibited. We are not obligated to indemnify the indemnitee with respect to claims brought by the indemnitee against:
| ● | the Company, except for: | |
| ● | claims regarding the indemnitee’s rights under the indemnification agreement; | |
| ● | claims to enforce a right to indemnification under any statute or law; and | |
| ● | counter-claims against us in a proceeding brought by us against the indemnitee; or | |
| ● | any other person, except for claims approved by our Board. | |
We have also agreed to obtain and maintain director and officer liability insurance for the benefit of each of our directors and executive officers. These policies include coverage for losses for wrongful acts and omissions and to ensure our performance under the indemnification agreements. Each of our directors and executive officers is named as an insured under the policies and provided with the same rights and benefits as the most favorably insured of our directors and officers.
37
CEO Pay Ratio
In accordance with the Dodd-Frank Wall Street Reform and Consumer Protection Act and applicable SEC rules, we are providing the following information about the relationship of our CEO’s compensation to the compensation of all our employees. For 2017:
| ● | the total compensation of our median employee was $100,610.44, as calculated pursuant to the same methodology as that used to determine pay for our CEO in the Summary Compensation Table | |
| ● | the total compensation of our CEO, as reported in the Summary Compensation Table, was $7,277,174 | |
| ● | the ratio of our CEO’s total compensation to the median employee total compensation was 72.3 to 1 | |
We believe this pay ratio is a reasonable estimate calculated in a manner consistent with SEC rules based on our internal records and the methodology used. To identify our median employee, we compared the year to date Federal Taxable Wages of our employees as of November 1, 2017. We did not exclude any of our employees or make any cost-of-living adjustments. We had 479 employees as of November 1, 2017, all of which were U.S. employees. Similar to our CEO, each of our employees enjoys a comprehensive compensation and benefit package that we determine by benchmarking to market practices.
Compensation Committee Interlocks and Insider Participation
During 2017, the Compensation Committee consisted of Messrs. M. Bennett and Genova, neither of whom was an employee of the Company during 2017 or has ever been an officer of the Company. None of our executive officers serves as a member of the board of directors or compensation committee of any entity that has one or more of its executive officers serving as a member of our Board.
Item 12. Security Ownership of Certain Beneficial Owners and Management and Related Stockholder Matters
Equity Compensation Plan Information
The following table provides information regarding securities authorized for issuance under our equity compensation plan as of December 31, 2017:
| Number of Securities to be issued upon exercise of outstanding options, warrants and rights (a) |
Weighted- average exercise price of outstanding options, warrants and rights (b) |
Number of securities remaining available for future issuance under equity compensation plans (excluding securities reflected in column (a)) (c) | ||||
| Equity compensation plans approved by security holders(1) | — | — | 3,004,728 |
|
(1) |
Includes shares available for issuance under the 2016 Omnibus Incentive Plan. |
Security Ownership of Certain Beneficial Owners and Management
The following table sets forth the number of shares of our common stock beneficially owned as of April 20, 2018, unless otherwise noted, by (1) those persons or any group (as that term is used in Section 13(d)(3) of the Exchange Act) known to beneficially own more than 5% of the outstanding shares of our common stock (the “5% beneficial owners”), (2) each named executive officer and director (including each Board nominee) of the Company, and (3) all directors and executive officers of the Company as a group. This information is based on information furnished by the 5% beneficial owners, directors and executive officers. For purposes of this table, beneficial ownership is determined in accordance with Rule 13d-3 under the Exchange Act. The following percentage information is calculated based on 35,402,981 shares of common stock that were outstanding as of April 20, 2018, plus any shares that may be acquired by each stockholder within 60 days of April 20, 2018. Except as indicated below, the stockholders listed possess sole voting and dispositive power with respect to the shares beneficially owned by that person. Unless otherwise noted, the mailing address of each person named below is SandRidge Energy, Inc., 123 Robert S. Kerr Avenue, Oklahoma City, Oklahoma 73102, Attention: Corporate Secretary.
38
| Number of Shares Beneficially Owned |
Percentage of Shares Beneficially Owned | |||
| James D. Bennett(1) | 244,061 | * | ||
| Julian M. Bott(2) | 111,800 | * | ||
| John P. Suter | 85,893 | * | ||
| Philip T. Warman | 50,267 | * | ||
| Robert S. Griffin(3) | 38,438 | * | ||
| Duane M. Grubert(4) | 63,024 | * | ||
| William M. Griffin, Jr. | 16,720 | |||
| Sylvia K. Barnes | 3,176 | * | ||
| Kenneth H. Beer(5) | 0 | * | ||
| Michael L. Bennett | 21,720 | * | ||
| David J. Kornder | 18,145 | * | ||
| All directors and executive officers as a group | 211,257 | * | ||
| Carl Icahn(6) | 4,818,832 | 13.6% | ||
| Guggenheim Capital(7) | 2,942,596 | 8.3% | ||
| BlackRock, Inc.(8) | 2,242,543 | 6.3% | ||
| Fir Tree Capital Management LP(9) | 2,053,613 | 5.7% |
| * | Less than 1% |
| (1) | Mr. J. Bennett was terminated from his position as President and CEO, effective February 8, 2018. In connection with such termination, on March 10, 2018, Mr. J. Bennett tendered his resignation from the Board, which the Board accepted. The figure listed in the table reflects the shares of common stock disclosed in Mr. J. Bennett’s most recent filing under Section 16 of the Exchange Act minus shares traded for taxes in connection with the acceleration of outstanding equity awards following his departure. |
| (2) | Mr. Bott was terminated from his position as Chief Financial Officer, effective February 22, 2018. The figure listed in the table reflects the shares of common stock disclosed in Mr. Bott’s most recent filing under Section 16 of the Exchange Act minus shares traded for taxes in connection with the acceleration of outstanding equity awards following his departure. |
| (3) | Mr. S. Griffin was terminated from his position as Senior Vice President, People and Culture, effective March 1, 2018. The figure listed in the table reflects the shares of common stock disclosed in Mr. S. Griffin’s most recent filing under Section 16 of the Exchange Act minus shares traded for taxes in connection with the acceleration of outstanding equity awards following his departure. |
| (4) | Mr. Grubert was terminated from his position as Executive Vice President, Investor Relations & Strategy, effective July 11, 2017. The figure listed in the table reflects the shares of common stock disclosed in Mr. S. Grubert’s most recent filing under Section 16 of the Exchange Act minus shares traded for taxes in connection with the acceleration of outstanding equity awards following his departure. |
| (5) | Mr. Beer was appointed to the Board, upon recommendation of its Nominating and Governance Committee, on April 18, 2018. |
| (6) | According to a Schedule 13D filed with the SEC on November 22, 2017, as amended by Amendments No. 1 - 6, the shares of common stock listed in the table above are beneficially owned by High River Limited Partnership (“High River”), Hopper Investments LLC (“Hopper”), Barberry Corp. (“Barberry”), Icahn Partners Master Fund LP (“Icahn Master”), Icahn Offshore LP (“Icahn Offshore”), Icahn Partners LP (“Icahn Partners”), Icahn Onshore LP (“Icahn Onshore”), Icahn Capital LP (“Icahn Capital”), IPH GP LLC (“IPH”), Icahn Enterprises Holdings L.P. (“Icahn Enterprises Holdings”), Icahn Enterprises G.P. Inc. (“Icahn Enterprises GP”), Beckton Corp. (“Beckton”), and Carl C. Icahn, a citizen of the United States of America (collectively, the “Icahn Reporting Persons”). Barberry is the sole member of Hopper, which is the general partner of High River. Icahn Offshore is the general partner of Icahn Master. Icahn Onshore is the general partner of Icahn Partners. Icahn Capital is the general partner of each of Icahn Offshore and Icahn Onshore. Icahn Enterprises Holdings is the sole member of IPH, which is the general partner of Icahn Capital. Beckton is the sole stockholder of Icahn Enterprises GP, which is the general partner of Icahn Enterprises Holdings. Carl C. Icahn is the sole stockholder of each of Barberry and Beckton. As such, Mr. Icahn is in a position indirectly to determine the investment and voting decisions Ownership of our Stock made by each of the Icahn Reporting Persons. The principal business address of each of (i) High River, Hopper, Barberry, Icahn Offshore, Icahn Partners, Icahn Master, Icahn Onshore, Icahn Capital, IPH, Icahn Enterprises Holdings, Icahn Enterprises GP and Beckton is White Plains Plaza, 445 Hamilton Avenue - Suite 1210, White Plains, NY 10601, and (ii) Mr. Icahn is c/o Icahn Associates Holding LLC, 767 Fifth Avenue, 47th Floor, New York, NY 10153. |
| (7) | According to a Schedule 13G/A filed with the SEC on February 14, 2018, the shares of common stock listed in the table above are beneficially owned by Guggenheim Capital, LLC, Guggenheim Partners, LLC, GI Holdco II LLC, GI Holdco LLC, Guggenheim Partners Investment Management Holdings, LLC, and Guggenheim Partners Investment Management, LLC (“GPIM”), each a Delaware limited liability company, which amount includes (i) 2,929,735 shares of common stock, 2,862,267 of which are directly beneficially owned by GPIM; (ii) 9,052 additional shares of common stock obtainable upon exercise of the Company’s Series A Warrants, 8,564 of which are directly beneficially owned by GPIM; and (iii) 3,809 additional shares of common stock obtainable upon exercise of the Company’s Series B Warrants, 3,604 of which are directly beneficially owned by GPIM. The address of each of Guggenheim Capital, LLC and Guggenheim Partners, LLC is 227 West Monroe Street, Chicago, IL 60606. The address of each of GI Holdco II LLC, GI Holdco LLC and Guggenheim Partners Investment Management Holdings, LLC is 330 Madison Avenue, New York, NY 10017. The address of GPIM is 100 Wilshire Boulevard, 5th Floor, Santa Monica, CA 90401. |
39
| (8) |
According to a Schedule 13G filed with the SEC on February 1, 2018, the shares of common stock listed in the table above are beneficially owned by BlackRock, Inc. BlackRock, Inc. has sole voting power with respect to 2,165,398 shares and sole dispositive power with respect to 2,242,543 shares. The principal business address of BlackRock, Inc. is 55 East 52nd Street, New York, NY 10055. |
| (9) |
According to a Schedule 13D/A filed with the SEC on April 25, 2018, the shares of common stock listed in the table above are beneficially owned by Fir Tree Capital Management LP, a Delaware limited partnership (“Fir Tree”), relating to shares of common stock purchased by certain private-pooled investment vehicles for which Fir Tree serves as the investment manager (the “Funds”). Such amount includes 460,658 shares which may be obtained upon exercise of warrants held by the Funds. Fir Tree is the investment manager of the Funds, and has been granted investment discretion over portfolio investments, including the shares of the Company’s common stock held by the Funds. The principal business address of Fir Tree is 55 West 46th Street, 29th Floor, New York, New York 10036. |
Item 13. Certain Relationships and Related Transactions and Director Independence
Related Party Transactions
We maintain a written policy that requires any related party transaction (as defined below) to be reviewed and approved by the disinterested members of our Board. A related party transaction is a transaction, proposed transaction, or series of similar transactions, in which (a) we are a participant, (b) the amount involved exceeds $120,000 and (c) a related person (as defined below) has or will have a direct or indirect material interest. A related person is (i) any person who is, or at any time since the beginning of our last fiscal year was, a director, executive officer, or nominee to become a director, (ii) a person known to be the 5% beneficial owner of any class of our voting securities, (iii) an immediate family member of any of the foregoing persons, which means any child, stepchild, parent, stepparent, spouse, sibling, mother-in-law, father-in-law, son-in-law, daughter-in-law, brother-in-law, or sister-in-law of such director, executive officer, nominee for director or more than 5% beneficial owner, and (iv) any person (other than a tenant or employee) sharing the household of such director, executive officer, nominee for director or more than 5% beneficial owner. The written policy includes factors to be considered by the disinterested members of our Board when determining whether to approve a proposed related party transaction. Factors to be considered include the terms of the transaction with the related party, availability of comparable products or services from unrelated third parties, terms available from unrelated third parties and benefits provided to us by the transaction. Based on SEC rules, the Board’s written policy, and the factors listed above, there were no related party transactions for the year ended December 31, 2017.
Director Independence
The Board has determined that Ms. Barnes and Messrs. Beer, M. Bennett, and Kornder have no material relationships with the Company other than as directors and stockholders of the Company, and each of such individuals is “independent” for purposes of the NYSE Listed Company Manual. Prior to his departure from the Board, Mr. Genova was determined to be “independent” for purposes of the NYSE listing standards as well. In making these determinations, the Board considered all relevant facts and circumstances that could affect such person’s exercise of independent judgment in carrying out the responsibilities of a director. The Board additionally has determined that all Audit Committee members meet the independence requirements for Audit Committee members set forth in Rule 10A-3 under the Exchange Act and as set forth in the 303A.02 of the NYSE Listed Company Manual and that all members of the Compensation Committee meet the independence requirements for compensation committee members set forth in the NYSE Listed Company Manual.
40
Item 14. Principal Accounting Fees and Services
Independent Registered Public Accounting Firm’s Fees
Set forth below is a summary of the fees earned by our independent registered public accounting firm, PricewaterhouseCoopers LLP (“PwC”), for fiscal years 2017 and 2016.
| 2017 | 2016 | |||||
| (In thousands) | ||||||
| Audit Fees | $ | 1,142 | $ | 1,160 | ||
| Audit-Related Fees | 102 | 664 | ||||
| Tax Fees | — | — | ||||
| All Other Fees | 1 | — | ||||
| Total | $ | 1,245 | $ | 1,824 | ||
Audit Fees. Audit fees consist primarily of fees billed for professional services rendered for the audit of our annual financial statements, review of the financial statements included in each of our quarterly reports on Form 10-Q, assistance with and review of documents filed with the SEC and/or used in conjunction with public and private securities offerings and work performed by tax professionals in connection with the audits and quarterly reviews.
Audit-Related Fees. In 2017, audit-related fees consist primarily of services related to consideration of new revenue accounting standards, the consent of PwC respecting the Form S-4 registration statement and assurance procedures respecting the Company’s 2017 annual incentive plan. In 2016, audit-related fees consist primarily of services related to bankruptcy, restructuring and fresh start accounting, due diligence, consultation regarding financial accounting and reporting standards and Form S-8 registration statement.
Tax Fees. Tax fees include all services performed by the firm’s tax division other than those related to the audit of financial statements.
All Other Fees. Other fees consist primarily of all fees billed for products and services provided by the firm other than those reported above.
The Audit Committee is responsible for approving in advance any services to be performed by the independent registered public accounting firm. The Audit Committee may delegate its pre-approval authority for these services to one or more members, whose decisions shall be presented to the full Audit Committee at its scheduled meetings. Each of these services must receive specific pre-approval by the Audit Committee or its delegate unless the Audit Committee has provided general pre-approval for such category of services in accordance with policies and procedures that comply with applicable laws and regulations. All of the services described above under audit fees, audit-related fees and all other fees for 2017 and 2016 were pre-approved by the Audit Committee. Specifically, the committee has pre-approved the use of PwC for detailed, specific types of tax advisory services related to compliance, technical interpretations, acquisition/disposition services, including due diligence, and federal and state audits.
41
Item 15. Exhibits and Financial Statement Schedule
The following documents are filed as a part of this Report or incorporated herein by reference:
| (1) |
Consolidated Financial Statements |
|
| |
|
Reference is made to the Index to Consolidated Financial Statements appearing on page F-1 the Original Report. | |
| (2) |
Financial Statement Schedules |
|
| |
|
All financial statement schedules have been omitted because they are not applicable or the required information is presented in the consolidated financial statements or notes thereto. | |
| (3) |
Exhibits |
|
| |
|
The following documents are included as exhibits to this Report: |
EXHIBIT INDEX
42
43
44
| Incorporated by Reference | ||||||||||
| Exhibit No. |
Exhibit Description | Form | SEC File No. | Exhibit | Filing Date | |||||
| 31.4** | Section 302 Certification-Chief Financial Officer | |||||||||
| 32.1* | Section 906 Certifications of Chief Executive Officer and Chief Financial Officer | |||||||||
| 99.1* | Report of Cawley, Gillespie & Associates | |||||||||
| 99.2* | Report of Netherland, Sewell & Associates, Inc. | |||||||||
| 99.3* | Report of Ryder Scott Company, L.P. | |||||||||
| 99.4** | Reconciliation of Non-GAAP Financial Measures | |||||||||
| 101.INS* | XBRL Instance Document - the instance document does not appear in the Interactive Data File because its XBRL tags are embedded within the Inline XBRL document. | |||||||||
| 101.SCH | XBRL Taxonomy Extension Schema Document | |||||||||
| 101.CAL | XBRL Taxonomy Extension Calculation Linkbase Document | |||||||||
| 101.DEF* | XBRL Taxonomy Extension Definition Document | |||||||||
| 101.LAB* | XBRL Taxonomy Extension Label Linkbase Document | |||||||||
| 101.PRE* | XBRL Taxonomy Extension Presentation Linkbase Document | |||||||||
| * | Filed Original Report |
| ** | Filed herewith |
| *** | Schedules have been omitted pursuant to Item 601(b)(2) of Regulation S-K. SandRidge Energy, Inc., Inc. hereby undertakes to furnish supplemental copies of any of the omitted schedules upon request by the U.S. Securities and Exchange Commission; provided, however, that SandRidge Energy, Inc. may request confidential treatment pursuant to Rule 24b-2 of the Securities Exchange Act of 1934, as amended, for any schedules so furnished. |
| † | Management contract or compensatory plan or arrangement |
45
SIGNATURES
Pursuant to the requirements of Section 13 or 15(d) of the Securities Exchange Act of 1934, the registrant has duly caused this report to be signed on its behalf by the undersigned, thereunto duly authorized.
| SANDRIDGE ENERGY, INC. | |
| By | /s/ WILLIAM M. GRIFFIN, Jr. |
| William M. Griffin, Jr. | |
| President and Chief Executive Officer | |
April 30, 2018
46