Attached files
| file | filename |
|---|---|
| EX-31.4 - EX-31.4 - HARTE HANKS INC | a18-10015_1ex31d4.htm |
| EX-31.3 - EX-31.3 - HARTE HANKS INC | a18-10015_1ex31d3.htm |
U.S.
SECURITIES AND EXCHANGE COMMISSION
Washington, D.C. 20549
FORM 10-K/A
(Amendment No. 1)
(Mark One)
x ANNUAL REPORT UNDER SECTION 13 OR 15(d) OF THE SECURITIES EXCHANGE ACT OF 1934
For the fiscal year ended December 31, 2017
or
o TRANSITION REPORT PURSUANT TO SECTION 13 OR 15(d) OF THE SECURITIES EXCHANGE ACT OF 1934
For the transition period from to .
Commission File Number: 001-07120

HARTE HANKS, INC.
(Exact name of registrant as specified in its charter)
|
Delaware |
|
74-1677284 |
|
(State or other jurisdiction of incorporation or |
|
(I.R.S. Employer Identification No.) |
9601 McAllister Freeway, Suite 610, San Antonio, Texas 78216
(Address of principal executive offices, including zipcode)
(210) 829-9000
(Registrant’s telephone number including area code)
Securities registered pursuant to Section 12(b) of the Act:
|
Title of each class |
|
Name of each exchange on which |
|
Common Stock |
|
New York Stock Exchange |
Securities registered pursuant to Section 12(g) of the Act: None
Indicate by check mark if the registrant is a well-known seasoned issuer, as defined in Rule 405 of the Securities Act. Yes o No x
Indicate by check mark if the registrant is not required to file reports pursuant to Section 13 or Section 15(d) of the Act. Yes o No x
Indicate by check mark whether the registrant (1) has filed all reports required to be filed by Section 13 or 15(d) of the Securities Exchange Act of 1934 during the preceding 12 months (or for such shorter period that the registrant was required to file such reports), and (2) has been subject to such filing requirements for the past 90 days. Yes x No o
Indicate by check mark whether the registrant has submitted electronically and posted on its corporate website, if any, every Interactive Data File required to be submitted and posted pursuant to Rule 405 of Regulation S-T (§ 232.405 of this chapter) during the preceding 12 months (or for such shorter period that the registrant was required to submit and post such files). Yes x No o
Indicate by check mark if disclosure of delinquent filers pursuant to Item 405 of Regulation S-K (§ 229.405 of this chapter) is not contained herein, and will not be contained, to the best of registrant’s knowledge, in definitive proxy or information statements incorporated by reference in Part III of this Form 10-K or any amendment to this Form 10-K. x
Indicate by check mark whether the registrant is a large accelerated filer, an accelerated filer, a non-accelerated filer, or a smaller reporting company. See definitions of “large accelerated filer,” “accelerated filer,” “smaller reporting company,” and “emerging growth company” in Rule 12b-2 of the Exchange Act.
|
Large accelerated filer |
o |
|
Accelerated filer |
x |
|
Non-accelerated filer |
o |
(Do not check if a smaller reporting company) |
Smaller reporting company |
o |
|
|
|
|
Emerging growth company |
o |
If an emerging growth company, indicate by check mark if the registrant has elected not to use the extended transition period for complying with any new or revised financial accounting standards provided pursuant to Section 13(a) of the Exchange Act. o
Indicate by check mark if the registrant is a shell company (as defined in Rule 12b-2 of the Act). Yes o No x
The aggregate market value of the voting and non-voting common equity held by non-affiliates computed by reference to the closing price ($10.30) as of the last business day of the registrant’s most recently completed second fiscal quarter (June 30, 2017), was approximately $50,200,128.
The number of shares outstanding of each of the registrant’s classes of common stock as of January 31, 2018 was 6,217,586 shares of common stock, all of one class.
Documents incorporated by reference:
None.
Harte Hanks, Inc. and Subsidiaries
Form 10-K/A Report
December 31, 2017
|
2 | ||
|
|
| |
|
3 | ||
|
7 | ||
|
Security Ownership of Certain Beneficial Owners and Management and Related Stockholder Matters |
38 | |
|
Certain Relationships and Related Transactions, and Director Independence |
40 | |
|
42 | ||
|
|
|
|
|
|
| |
|
43 | ||
|
|
50 | |
All common stock, equity, share, and per share amounts have been retroactively adjusted to reflect a one-for-ten reverse stock split which was effective January 31, 2018.
This Amendment No. 1 on Form 10-K/A contains “forward-looking statements” within the meaning of Section 27A of the Securities Act of 1933, as amended, and Section 21E of the Securities Exchange Act of 1934, as amended. The words “may,” “anticipate,” “believe,” “expect,” “estimate,” “project,” “suggest,” “intend” and similar expressions are intended to identify forward-looking statements. Such statements reflect our current views with respect to future events and financial performance and are subject to certain risks, uncertainties and assumptions, including those discussed in “Item 1A. Risk Factors.” in the Original Filing (as defined below). Should one or more of these risks or uncertainties materialize, or should underlying assumptions prove incorrect, actual results may vary materially from those anticipated, believed, expected, estimated, projected, suggested or intended.
This Amendment No. 1 on Form 10-K/A (“Amendment No. 1”) amends our Annual Report on Form 10-K for the fiscal year ended December 31, 2017 (the “Original Filing”), filed with the U.S. Securities and Exchange Commission (“SEC”) on March 15, 2018 (the “Original Filing Date”). The sole purpose of this Amendment No. 1 is to include the information required by Items 10 through 14 of Part III of Form 10-K. This information was previously omitted from the Original Filing in reliance on General Instruction G(3) to Form 10-K, which permits the information in the above referenced items to be incorporated in the Form 10-K by reference from our definitive proxy statement if such proxy statement is filed no later than 120 days after our fiscal year-end. The reference on the cover of the Original Filing to the incorporation by reference to portions of our definitive proxy statement into Part III of the Original Filing is hereby deleted.
In accordance with Rule 12b-15 under the Securities Exchange Act of 1934, as amended (“Exchange Act”), Part III, Items 10 through 14 of the Original Filing are hereby amended and restated in their entirety. In addition, new certifications by our principal executive officer and principal financial officer are filed as exhibits to this Amendment No. 1, as required by Rule 12b-15 under the Exchange Act. This Amendment No. 1 does not amend, modify, or otherwise update any other information in the Original Filing. Accordingly, this Amendment No. 1 should be read in conjunction with the Original Filing. In addition, this Amendment No. 1 does not reflect events that may have occurred subsequent to the Original Filing Date.
ITEM 10. DIRECTORS, EXECUTIVE OFFICERS AND CORPORATE GOVERNANCE
Section 16(a) Beneficial Ownership Reporting Compliance
Section 16(a) of the Exchange Act and related rules of the SEC require our directors and officers, and persons who own more than 10% of a registered class of our equity securities, to file initial reports of ownership and reports of changes in ownership with the SEC. These persons are required by SEC regulations to furnish us with copies of all Section 16(a) reports that they file. As with many public companies, we provide assistance to our directors and executive officers in making their Section 16(a) filings pursuant to powers of attorney granted by our insiders. To our knowledge, based solely on our review of the copies of Section 16(a) reports received by us with respect to 2017, including those reports that we have filed on behalf of our directors and executive officers pursuant to powers of attorney, or written representations from certain reporting persons, we believe that all filing requirements applicable to our directors, officers and persons who own more than 10% of a registered class of our equity securities have been satisfied on a timely basis.
Directors and Executive Officers
The following table sets forth certain information about our current directors and executive officers at April 30, 2018:
|
Name |
|
Age |
|
Position |
|
David L. Copeland |
|
62 |
|
Director (Class I) |
|
William F. Farley |
|
74 |
|
Director (Class II) |
|
Christopher M. Harte |
|
70 |
|
Director (Class I); Chairman of the Board |
|
Melvin L. Keating |
|
71 |
|
Director (Class II) |
|
Scott C. Key |
|
59 |
|
Director (Class I) |
|
Judy C. Odom |
|
65 |
|
Director (Class III) |
|
Karen A. Puckett |
|
57 |
|
Director (Class III); President & CEO |
|
Alfred V. Tobia, Jr. |
|
53 |
|
Director (Class II) |
|
Carlos M. Alvarado |
|
44 |
|
Vice President, Finance & Controller |
|
Jon C. Biro |
|
52 |
|
Executive Vice President & Chief Financial Officer |
|
Frank M. Grillo |
|
52 |
|
Executive Vice President, Sales & Chief Marketing Officer |
|
Andrew P. Harrison |
|
48 |
|
Executive Vice President, Contact Centers & CHRO |
|
Robert L. R. Munden |
|
49 |
|
Executive Vice President, General Counsel & Secretary |
Class I directors are to be elected at our 2018 annual meeting of stockholders. The term of Class II directors expires at the 2019 annual meeting of stockholders, and the term of Class III directors expires at the 2020 annual meeting of stockholders.
David L. Copeland has served on Harte Hanks’ Board of Directors (the “Board”) since 1996. He has been employed by SIPCO, Inc., the management and investment company for the Andrew B. Shelton family, since 1980, and currently serves as its President. Since 1998, he has served as a director of First Financial Bankshares, Inc., a financial holding company. Currently, he serves on First Financial Bankshares’ executive and nominating committees and is also the chairman of its audit committee.
We believe that Mr. Copeland’s qualifications for our Board include his experience serving on various committees for a publicly traded financial holding company. We also believe he offers us extensive knowledge of financial instruments, financial and economic trends and accounting expertise from serving as president of SIPCO, Inc. and on the audit committee of First Financial Bankshares. Mr. Copeland, a certified public accountant and a chartered financial analyst, would qualify as a financial expert for our audit committee.
William F. Farley has served as a director of Harte Hanks since 2003. Currently, he is a Principal with Livingston Capital, a private investment business he started in 2002. From 2005 - 2018 he served on the board of trustees for Blue Cross Blue Shield of Minnesota and was a member of its technology committee and business development committee, and was the chair of its investment committee. He served as Chairman and Chief Executive Officer of Science, Inc., a medical device company, from 2000 to 2002. He also served as Chairman and Chief Executive Officer of Kinnard Investments, a financial services holding company, from 1997 to 2000. From 1990 to 1996, he served as Vice Chairman of U.S. Bancorp, a financial services holding company.
We believe that Mr. Farley’s qualifications for our Board include his extensive leadership experience at various financial institutions serving in roles as chairman and chief executive officer. We believe he provides important perspectives on financial markets, complex securities and financial and economic trends, as well as a broad prospective on corporate governance and risk management issues facing businesses today. Mr. Farley qualifies as a financial expert on our audit committee.
Christopher M. Harte has served as a director of Harte Hanks since 1993. Serving as our Chairman since July 1, 2013, he is also a private investor. He was Chairman and publisher of the Minneapolis Star Tribune from March 2007 through September 2009. The Minneapolis Star Tribune entered bankruptcy in January 2009 and emerged from bankruptcy in September 2009. He had previously been President and publisher of Knight-Ridder newspapers in State College, Pennsylvania and Akron, Ohio, and later President of the newspaper in Portland, Maine. He was a director of Geokinetics, Inc. (from 1997 to 2013) and Crown Resources Corporation (from 2002 until its merger with Kinross Gold Corporation in 2006).
We believe that Mr. Harte’s qualifications for our Board include his extensive experience in managing, investing in and serving on the board of directors of a number of communications and other public and private companies. He offers the perspective of a seasoned board member, having served on our Board through several major transitions, both when the company was private as well as after its most recent public offering.
Melvin L. Keating has served as a director and Audit Committee member of Harte Hanks since July 2017. Mr. Keating is currently a consultant, and as such has provided investment advice and other services to private equity firms since November 2008. Since September 2015, he has been a Director of Agilysys Inc., a leading technology company that provides innovative software for point-of-sale (POS), property management, inventory and procurement, workforce management, analytics, document management and mobile and wireless solutions and services to the hospitality industry. Mr. Keating also currently serves as a Director of MagnaChip Semiconductor Corp., a designer and manufacturer of analog and mixed-signal semiconductor products for consumer, communication, computing, industrial, automotive and IoT applications. From 2005 to October 2008, he served as the President and Chief Executive Officer of Alliance Semiconductor Corp., a manufacturer and seller of semiconductors. During the course of his career, Mr. Keating also served as a director of the following public companies: Red Lion Hotels Corp, where he was Chairman of the Board; API Technologies Corp.; Integrated Silicon Solutions Inc.; Tower Jazz Semiconductor Ltd.; Integral Systems, Inc.; White Electronic Designs Corp.; Crown Crafts Inc.; Bitstream, a/k/a Marlborough Software Development; Plymouth Rubber Co.; Price Legacy Corp.; InfoLogix, Inc.; LCC International, Inc.; Aspect Medical Systems Inc.; and ModSys International Ltd.
We believe Mr. Keating’s extensive experience as an investment consultant, executive officer and board member provides a valuable perspective on our Board.
Scott C. Key joined the Harte Hanks Board on March 17, 2013. Through June 2015, Mr. Key served as President and Chief Executive Officer of IHS, Inc. Mr. Key also served on IHS’ board of directors. Mr. Key joined IHS in 2003, and served in a variety of roles of progressively greater responsibility, most recently as IHS’ Chief Operating Officer (in 2011), Senior Vice President, Global Products and Services (in 2010) and President and Chief Operating Officer of IHS Global Insight (September 2008 — December 2009). From 2007-2008, he served as President and Chief Operating Officer of IHS Jane’s and chairman of IHS Fairplay, and led an integrated sales team on a global basis. From 2003-2007, he served as IHS Senior Vice President of Corporate Strategy and Marketing, and led Energy Strategy, Products, Marketing and Software Development.
We believe Mr. Key’s extensive experience in global data- and analytics-intensive businesses brings a keen perspective as our company continues to develop more and different data-driven marketing offerings for our clients. In addition, his recent service as Chief Executive Officer of a fast growing company will provide a valuable perspective on our Board as we deploy our new strategy.
Judy C. Odom has served as a director of Harte Hanks since 2003. Since November 2002, Ms. Odom has served on the board of directors of Leggett & Platt, Incorporated, a diversified manufacturing company, where she also serves as chair of the audit committee and as a member of its compensation and nominating and governance committees. In March 2014, Ms. Odom joined the board of directors of Sabre Corporation, a leading technology solutions provider to the global travel and tourism industry; she also serves as the chair of Sabre’s Audit Committee. From 1985 until 2002, she held numerous positions, most recently chief executive officer and chairman of the board, at Software Spectrum, Inc., a global business to business software services company, which she co-founded in 1983. Prior to founding Software Spectrum, she was a partner with the international accounting firm, Grant Thornton.
We believe that Ms. Odom’s qualifications to serve on our Board include her board service with several companies allowing her to offer a broad leadership perspective on strategic and operating issues facing companies today. Her experience co-founding Software Spectrum, growing it to a large public company before selling it to another public company and serving as board chair provides the insight and perspective of a successful entrepreneur and long-serving chief executive officer with international operating experience. As a partner in an international accounting firm she supervised audits of many companies in various industries.
Karen A. Puckett has served as a director of Harte Hanks since 2009, and was appointed our President & Chief Executive Officer (CEO) in September 2015. Ms. Puckett served in several executive positions with CenturyLink, Inc. and its predecessor companies for over 15 years until her departure in June 2015, most recently as its President of Global Markets and Chief Operating Officer. CenturyLink is the third largest telecom communications company in the U.S. and a leader in network services as well as a global leader in cloud infrastructure and hosted IT solutions for enterprise customers. CenturyLink provides data voice and managed services in local, national and select international markets. Ms. Puckett also serves as a director (and member of the audit and personnel committees, and formerly the finance committee) of Entergy Corporation, an integrated energy company engaged primarily in electric power production and retail distribution operations.
We believe that Ms. Puckett’s qualifications for our Board include her essential perspective as our current President & CEO, and her extensive prior leadership and operating experience at CenturyLink. We believe her involvement in the transformation and expansion of CenturyLink will provide the Board with key insights on all aspects of challenging and rapidly-changing business situations.
Alfred V. Tobia, Jr. has served as a director and Compensation Committee member of Harte Hanks since July 2017. Mr. Tobia is a co-Founder and Portfolio Manager for Sidus Investment Management, LLC and its affiliates, in which capacity he oversees the management of the Sidus equity funds and provides analysis to the firm’s credit fund. Mr. Tobia was previously a Senior Managing Director and Supervisory Analyst (1996 to 2000) within the data networking and telecommunication equipment sectors at Banc of America Securities (formerly Montgomery). From 1992 to 1996, he was a Senior Analyst at Wertheim Schroeder & Co., focusing on PC and entertainment software, data networking and special situations. Prior to that, Mr. Tobia was an analyst at Mabon Nugent & Co. (1986 to 1992), covering various sectors of technology.
Mr. Tobia has extensive financial experience in both public and private companies and executive experience through the management of a small-cap investment fund. Mr. Tobia’s background and insights provide valuable expertise in corporate finance, strategic planning, and capital and credit markets. We believe Mr. Tobia’s extensive financial experience will provide a valuable perspective on our Board.
Carlos M. Alvarado has served as the Vice President, Finance and Controller since June 2013. Prior to joining Harte Hanks, he was Director of Accounting for Visionworks of America, Inc., a subsidiary of Highmark’s vision holding company, HVHC Inc. Prior to joining HVHC, Mr. Alvarado spent six years in public accounting with Ernst & Young and Arthur Andersen, and two years at a retail grocery company.
Jon C. Biro was appointed our Executive Vice President and Chief Financial Officer in November 2017. Mr. Biro previously served as chief financial officer for (and then consultant to) Exterran Corporation from October 2015 through January 2017, and served as chief financial officer of Archrock, Inc., (formerly Exterran Holdings, Inc.) from September 2014. Prior to joining Exterran, Mr. Biro served as chief financial officer, chief accounting officer, treasurer and secretary for Consolidated Graphics, Inc. from January 2008 through January 2014.
Frank M. Grillo was appointed our Chief Marketing Officer in October of 2015, and now serves as our Executive Vice President, Sales & CMO. Mr. Grillo previously worked for CenturyLink, Inc. as a vice president of
business marketing (beginning April 2012). Prior to CenturyLink, Mr. Grillo served in a variety of executive sales, operations and marketing roles for Cypress Communications (from September 2005 to January 2012) and Trinsic Communications (from March 2003 to August 2005).
Andrew P. Harrison is our Executive Vice President and Chief Human Resources Officer. Mr. Harrison also leads our contact center services. Mr. Harrison has worked in a variety of human resources and operational management and leadership roles for Harte Hanks for over 20 years.
Robert L. R. Munden joined the company in April 2010 as our General Counsel and Secretary, and also served as our Chief Financial Officer (in addition to his other roles) from January 2017 to November 2017. From April 2005 through March 2010, Mr. Munden served as Vice President and Corporate Counsel of Safeguard Scientifics, Inc. From June 2002 through April 2005, he served as Corporate Counsel, North America for Taylor Nelson Sofres, a market research company (now a division of WPP PLC). Prior to that, Mr. Munden served as General Counsel to an online marketing and database services firm, as an associate with a corporate law firm and as an armor and cavalry officer in the U.S. Army.
Code of Ethics and Other Governance Information
We have established a corporate compliance program as part of our commitment to responsible business practices in all of the communities in which we operate. The Board has adopted a Business Conduct Policy that applies to all of our directors, officers and employees, which promotes the fair, ethical, honest and lawful conduct in our business relationships with employees, customers, suppliers, competitors, government representatives, and all other business associates. In addition, we have adopted a Code of Ethics applicable to our CEO and all of our senior financial officers. The Business Conduct Policy and Code of Ethics form the foundation of a compliance program that includes policies and procedures covering a variety of specific areas of professional conduct, including compliance with laws, conflicts of interest, confidentiality, public corporate disclosures, insider trading, trade practices, protection and proper use of company assets, intellectual property, financial accounting, employment practices, health, safety and environment, and political contributions and payments. The Business Conduct Policy forbids employees and directors from engaging in hedging activities with respect to our securities.
Both our Business Conduct Policy and our Code of Ethics are available on our website at www.hartehanks.com, under the “Corporate Governance” subsection of our “Investors” section. In accordance with New York Stock Exchange (“NYSE”) and SEC rules, we intend to disclose any future amendments to our Code of Ethics, or waivers from our Code of Ethics for our CEO, Chief Financial Officer (“CFO”) and Controller, by posting such information on our website (www.hartehanks.com) within the time period required by applicable SEC and NYSE rules.
Audit Committee
The Board has a separately designated standing Audit Committee established in accordance with Section 3(a)(58)(A) of the Exchange Act. The Audit Committee is composed solely of directors who the Board has determined are independent. The current members of the Audit Committee are William F. Farley, Christopher M. Harte, Melvin L. Keating and Scott C. Key. The primary function of the Audit Committee is to assist the Board in fulfilling its oversight of (1) the integrity of our financial statements, including the financial reporting process and systems of internal controls regarding finance, accounting, and legal compliance, (2) the qualifications and independence of our independent auditors, (3) the performance of our internal audit function and independent auditors, and (4) our compliance with legal and regulatory requirements.
The Board has determined that Messrs. Farley, Harte, Keating and Key are financially literate, and that Messrs. Farley and Keating qualify as “audit committee financial experts” as such term is defined in the applicable SEC rules. The Board has also determined that Messrs. Farley, Harte, Keating and Key are independent under (1) applicable NYSE listing standards for purposes of serving on the Board and the Audit Committee and (2) additional audit committee independence standards under Rule 10A-3 of the SEC.
Management Certifications
In accordance with the Sarbanes-Oxley Act of 2002 and SEC rules thereunder, our CEO and CFO have signed certifications under Sarbanes-Oxley Section 302, which are filed as exhibits to this Form 10-K/A. In addition, our CEO most recently submitted an annual certification to the NYSE under Section 303A.12(a) of the NYSE listing standards on September 18, 2017.
ITEM 11. EXECUTIVE COMPENSATION
Compensation Discussion and Analysis
This Compensation Discussion and Analysis (“CD&A”) provides a discussion of the compensation philosophy and objectives that underlie our executive compensation program and how we evaluated and set our executives’ compensation for 2017. This CD&A provides qualitative information concerning how 2017 compensation was awarded to and earned by our executives, identifies the most significant factors relevant to our 2017 executive compensation decisions and gives context to the data presented in the tables included below in this Amendment No. 1. “Committee” within this CD&A means the Compensation Committee of the Board. Our “executive officers” are our senior executives who are listed above under the heading “Directors and Executive Officers.” Our “named executive officers” listed in the Summary Compensation Table and other compensation tables that follow are listed below, and are drawn from executive officers who served in 2017:
· Karen Puckett — President and Chief Executive Officer;
· Jon Biro — Executive Vice President and CFO (from November 9, 2017);
· Robert Munden — Executive Vice President, General Counsel & Secretary (and CFO from January 1, 2017 through November 9, 2017);
· Frank Grillo — Executive Vice President, Sales & CMO;
· Andrew Harrison — Executive Vice President, Contact Centers & Chief Human Resources Officer; and
· Shirish Lal — Executive Vice President, COO & CTO (resigned January 31, 2018).
Executive Summary
We seek to design and implement executive compensation programs that align our executives’ interests and motivations with those of our stockholders, while avoiding the encouragement of inappropriate risk-taking. In 2017, our total direct compensation program for our named executive officers consisted of base salary, annual cash incentives (based on pre-established financial goals), long-term equity incentives (stock appreciation rights (SARs), time-vesting restricted stock and performance units) and limited perquisites.
As further detailed below, 2017 presented challenges for our smaller leadership team as it focused on improving the company’s operating and financial performance. Factors and events most important to compensation matters were:
· Smaller Leadership Team: Through reorganized and consolidated roles, and in response to divestitures and other changes in our business, our senior leadership team in 2017 was about half the size of our 2016 team (five for most of the year, compared to nine at the beginning of 2016).
· Financial Reporting Delays: The company’s failure to file financial reports timely through the second fiscal quarter negatively affected our stock price and business, added to management’s workload, and caused the Compensation Committee to delay the issuance of annual equity awards.
· Compensation Constraints: The Committee sought to balance the need to motivate its key leadership team with the company’s cash and dilution limits, consistent with stockholder interests.
· Equity Program: In light of poor share performance and limitations to the shares available for issuance under the company’s equity incentive plan, the company reduced the value of grants
to mitigate dilution and used some cash-settled awards and weighted CEO awards heavily towards performance units.
· CFO Transition: Mr. Biro joined as the company’s CFO in November 2017, taking over from Mr. Munden (who thereafter remained as General Counsel & Secretary).
The company began 2017 with the objective of stemming revenue declines while improving profitability as it increased its focus on revitalizing its marketing technology, data and database offerings after divesting its Trillium Software business. Despite making progress on service capabilities, financial performance suffered as several clients (including some of our largest) substantially reduced volumes or eliminated programs, which presented significant obstacles to stability and growth. The company improved its cash position through the year and secured new debt financing, but revenues declined 5.1%. Although improved from 2016, the company nevertheless recorded an operating loss from continuing operations of $40.9 million, and earnings per share was a loss of $6.76—each reflecting the write-off of our remaining goodwill of $34.5 million. Our stock price declined significantly, decreasing 37%, and we obtained approval for a reverse stock split in order to maintain a $1.00 minimum average share price as required for compliance with NYSE continued listing standards. (We effected the 1-for-10 reverse stock split on January 31, 2018, and all share amounts herein have been proportionately adjusted.)
Based on the economic environment, the company’s recent performance, anticipated changes to the company and its leadership, and the Committee’s compensation philosophy and objectives, the Committee took the following annual compensation actions for the named executive officers for 2017:
· Established target compensation for officers which was largely consistent with market benchmarks.
· Established goals for our short term annual incentive plan (the “2017 AIP”) with a view to motivating our executives toward objectives fundamental to improving stockholder value.
· Due to company performance, made no payments under the 2017 AIP.
· Granted long-term equity awards with a lower value (compared to prior years)—
· comprised of performance units (88% by value) and restricted stock for the CEO, and
· comprised of restricted stock, performance units and SARs for other executives—
to align participants with the company’s achievement of long-term stockholder value creation.
· Due to the company’s low share price and the limited number of shares available for issuance under our 2013 Omnibus Incentive Plan (the “2013 Plan”), we included cash-settling awards, which also had the effect of decreasing the equity dilution of awards granted.
· Held base salaries constant for all executives except
· Mr. Grillo, who assumed responsibility for sales after the departure of our former Executive Vice President of Sales in early 2017 and led key initiatives with service offering development;
· Mr. Munden, who served as CFO through November 9, 2017 (and whose salary was reduced to its previous level effective January 1, 2018); and
· Ms. Puckett, who agreed to receive stock in lieu of 20% of her base salary for the last four months of 2017.
The Committee engaged Meridian Compensation Partners, LLC (“Meridian”) as its independent compensation advisor to assist with benchmarking of executive officer compensation, and Meridian performed a comprehensive analysis of the company’s executive compensation program for 2017.
The remainder of this CD&A provides further detail on the compensation philosophy, process, and decisions for 2017. Certain information regarding other periods’ compensation determinations and policies is also included to the extent we believe it provides helpful context for our discussion of 2017 executive compensation.
Executive Compensation Philosophy and Objectives
Our executive compensation program is designed to achieve a number of key objectives and thereby support our overall efforts to create long-term value for our stockholders:
· Attract and Retain Top Talent — Attract and retain high-performing individuals who will significantly contribute to our long-term success and the creation of long-term stockholder value by providing competitive compensation compared to peer companies, competitors or companies in the same market for executive talent.
· Pay for Performance — Motivate our executives to work in the best interests of our stockholders by closely tying compensation to company and individual performance on both a short-term and long-term basis.
· Place Significant Portion of Pay At Risk — Align executive compensation with stockholder interests by placing a significant portion of total direct compensation at risk, such that the executive will not realize value unless company performance goals are achieved (for example, annual bonuses and performance units with vesting dependent upon company performance) or our stock price appreciates (for example, SARs or restricted stock unit awards).
· Require Significant Ongoing Executive Stock Ownership — Align executive and stockholder interests by including a significant equity component in our total compensation awards and by requiring executives to accumulate and maintain a sizeable equity position through our stock ownership guidelines.
As an integral part of our compensation philosophy and objectives, we seek to design an executive compensation program that does not encourage inappropriate risks that would threaten the long-term value of our company. We believe our compensation philosophy has assisted in achieving our goals. The Committee reviews our compensation philosophy on a periodic basis to judge whether the goals and objectives are being met, and what, if any, changes may be needed to the philosophy. The Committee considered our compensation philosophy and objectives in establishing the elements and amounts of 2017 compensation for each of our named executive officers. Although a variety of modifications and alternatives were considered, our 2017 compensation philosophy was consistent for all of our executive officer positions, and was consistent with the philosophy for our 2016 compensation program.
Elements of 2017 Executive Compensation Program
The following table highlights the elements of our 2017 executive compensation program and the primary purpose of each element, which were consistent with our 2016 executive compensation program elements except that we eliminated our non-qualified deferred compensation program, which had not been used since 2013. The elements are also generally consistent for all of our executive officer positions. Each element is discussed in further detail below.
|
Element |
|
Objectives and Basis |
|
Form |
|
|
|
|
|
|
|
Base Salary |
|
Provide base compensation that is competitive for each role to reward and motivate individual performance |
|
Cash |
|
Annual Incentive |
|
Annual incentive or “bonus” to drive company performance consistent with immediate or short-term objectives |
|
Cash |
|
Bonus Restricted |
|
Encourage greater stock ownership by executive officers by allowing each to elect to receive up to 30% of annual incentive plan (AIP) payments in the form of restricted stock vesting on the first anniversary of the grant, with executive officers receiving 125% of the value of the forgone cash bonus in shares of restricted stock |
|
Restricted stock |
|
Element |
|
Objectives and Basis |
|
Form |
|
|
|
|
|
|
|
Long-Term |
|
Long-term incentive to drive company performance and align executives’ interests with stockholders’ interests, and to retain executives through long-term vesting and potential wealth accumulation |
|
Restricted stock, performance awards and cash-settled phantom stock |
|
Perquisites |
|
Enhance the competitiveness of our executive compensation program through limited additional benefits |
|
Health examination and death benefits |
|
Severance Policy and |
|
Attract and retain key talent by providing certain compensation in the event of a termination without cause or change in control |
|
Cash severance, equity vesting and COBRA reimbursement |
|
Other |
|
Offer other competitive benefits, such as 401(k) (with matching) medical, dental and other health and welfare benefits |
|
Same benefit made generally available to our employees |
Compensation Committee
The Committee began 2017 with Messrs. Carley and Copeland (Chair) and Ms. Odom comprising the Committee. In April 2017 Mr. Copeland resigned from the Committee after the Board determined he no longer met the independence requirements of the NYSE; see “Independence of Directors” below. In connection with Mr. Copeland’s departure from the Committee, the Board appointed Mr. Key as Committee Chair, and Mr. Harte joined as a Committee member. In July 2017 (after most compensation determinations for incumbent executive officers were made), Mr. Carley retired and was replaced by Mr. Tobia, resulting in the Committee’s current composition: Messrs. Key (Chair), Harte and Tobia and Ms. Odom.
The Board has determined that each member of the Committee meets the independence requirements of the rules of the NYSE. Each person serving on the Committee qualified as an “outside director” in accordance with §162(m) of the Internal Revenue Code (the “Code”) when such provision was applicable, and a “non-employee director” as defined in Rule 16b-3 under the Exchange Act with regard to compensation and benefit plans subject to SEC Rule 16b-3. Most members of the Committee either currently serve, or have served, as a director or senior executive of a large corporation, and have had significant experience with compensation matters relating to senior executives of these organizations.
The Committee’s purpose is to assist the Board in fulfilling its oversight responsibilities for compensation of executive officers and administration of the company’s equity incentive plans, with the goals of (1) supporting the company’s business objectives, (2) attracting, motivating and retaining high quality leadership, and (3) linking compensation with business objectives and performance. In accordance with its charter and NYSE rules, the Committee’s responsibilities include the following:
· reviewing and approving corporate goals and objectives relevant to CEO compensation, evaluating the CEO’s performance in light of those goals and objectives, and together with the other independent directors (as directed by the Board), determining and approving the CEO’s compensation level based on this evaluation;
· making recommendations to the Board with respect to non-CEO officer compensation, and incentive-compensation and equity-based plans that are subject to board approval;
· assisting the Board by (i) evaluating potential candidates for officer positions, (ii) recommending terms for the hiring, promotion and severance of officers, and (iii) overseeing the development of officer succession plans;
· participating with management in reviewing the annual goals and objectives with respect to compensation for the company’s officers and, to the extent the Committee deems necessary or appropriate, other key employees of the company or its subsidiaries (collectively, “Principal Executives”);
· periodically (but no less frequently than annually) evaluating the performance of the Principal Executives in light of established goals and objectives and, based upon this evaluation and any compensation recommendations for the Principal Executives made by the CEO, approving or (in
the case of officers, and as directed by the Board) making recommendations to the Board with respect to the compensation for the Principal Executives; and
· periodically (but no less frequently than annually) evaluating the competitiveness of the company’s executive compensation program in reference to its peers and broader trends, including consideration of base salaries, annual incentives, long-term incentives and equity-based compensation, considering (among other things) the company’s performance and relative stockholder return, the value of similar incentive awards to similarly situated executives at comparable companies, and the awards given to such person in prior years.
The Committee may appoint subcommittees for any purpose that it deems appropriate and may delegate to subcommittees such power and authority as it deems appropriate. However, no subcommittee may consist of fewer than two members, and no subcommittee may be delegated any power or authority required by any law, regulation or listing standard to be exercised by the Committee as a whole. No subcommittees were formed or met in 2017. The Committee has delegated to our CEO a limited authority to grant stock options and restricted stock to non-officers, and monitors grant activity through regular reports. The Committee also delegated to the CEO the limited authority to allocate non-officer annual equity awards amongst employees. You may view the Committee’s full charter in the “Investors” section of our website at www.hartehanks.com under the “Corporate Governance.”
The Committee meets in executive session at most of its meetings (as it deems appropriate) to review and consider executive compensation matters without the presence of our executive officers. These executive sessions may also include other non-employee directors and outside experts retained by the Committee. The Committee met in executive session with other non-employee directors at four of its six 2017 meetings.
Compensation Committee Interlocks and Insider Participation
None of the members of the Compensation Committee of our Board is or has been an officer or employee of the company. All members of the Compensation Committee participate in decisions related to compensation of our executive officers. No interlocking relationship exists between our Board and the board of directors or compensation committee of any other company.
Other Participants in the Executive Compensation Process
In addition to the Committee and other non-Committee members of the Board who also may be in attendance at the Committee’s meetings, our management and, when engaged by the Committee from time to time, outside compensation consultants also participate in and contribute to our executive compensation process. Ultimately, the Committee exercises its independent business judgment with respect to recommendations and opinions of these other participants and the Committee (or our independent directors as a group) makes final determinations about our executive officer compensation.
Management
Ms. Puckett, our CEO, participated in the Committee’s executive compensation processes and attended most Committee meetings; however, she did not attend sessions when elements of her compensation were being considered. The company’s Chief Human Resources Officer (Mr. Harrison) attended most meetings (as appropriate), and the General Counsel (Mr. Munden) also attended each meeting. Officers were excluded from executive sessions.
Working with Messrs. Harrison and Munden, Ms. Puckett presented recommendations to the Committee on the full range of annual executive compensation decisions made in March and May (other than with respect to herself), including (1) the company’s 2017 AIP structure and participants, (2) long-term incentive compensation strategy, (3) competitive positioning of our executive compensation program, and (4) total direct compensation for each executive officer, including base salary adjustments, 2017 AIP targets, equity grants and perquisites. The Committee made final decisions about each officer’s 2017 compensation without the applicable executive officer being present, taking into account Ms. Puckett’s recommendations and views.
Compensation Consultants
The Committee believes that engaging a consultant for comprehensive reviews on a periodic basis is more appropriate than having regular annual engagements. The Committee engaged Meridian to assist the Committee with its evaluations and determinations for our 2017 executive compensation program. In this review, Meridian performed a comprehensive evaluation of our compensation philosophy, policies and practices for executive officers
and other executive positions, and reviewed a new annual incentive plan design to be applied company-wide (including officers). The Committee also engaged Meridian to assist in the development of a new peer group, and to perform a comprehensive executive compensation analysis for its 2017 compensation determinations.
For the foregoing engagements, Meridian has been selected and retained by—and reported directly to—the Committee. Meridian has not been separately engaged by our management, but has provided to management corresponding evaluations of selected non-executive officer positions and compensation policy and practice matters. Harte Hanks has no relationship with Meridian (other than the relationship undertaken by the Committee), and the Committee re-evaluated and confirmed Meridian’s independence in accordance with its charter and NYSE requirements prior to engaging Meridian.
Principal Factors That Influenced 2017 Executive Compensation
When making its 2017 annual compensation decisions, the Committee considered the compensation philosophy and principles that underlie our executive compensation program, including the desire to link executive compensation to annual and long-term performance goals and to be able to retain (and as necessary, attract) high performing individuals who will significantly contribute to our long-term success and the creation of long-term stockholder value. The Committee did not use formulas to rigidly set the compensation of our executives based solely on market data or on any one factor in isolation, or assign a specific weighting or ranking to the various factors it considered. Rather, the Committee’s ultimate decisions were influenced by a number of factors that were collectively taken into consideration in the Committee’s business judgment and that included a number of subjective determinations in addition to the specific formula-based performance criteria established in our annual incentive plan and long term incentive performance awards. In establishing the individual elements and amounts of 2017 executive compensation, the principal factors taken into consideration by the Committee included the following:
· anticipated reorganization and consolidation of leadership roles, resulting in fewer leaders each with greater and/or broader responsibility;
· possible divestitures and other changes in our business;
· competitive market data to assess how our executive pay compared to other companies, considering the individual elements of our compensation program, the relative mix of those compensation elements and total direct compensation amounts, with then-current market data provided by Meridian (which included recommendations based on Meridian’s analysis of turnaround situations);
· input from non-Committee members of the Board (including our CEO) with regard to base salary proposals, long-term incentive awards, individual executive officer performance and related matters;
· recent company performance compared to (i) our financial and operational expectations for our company as a whole and (ii) our peers and other market indicators;
· the need to attract and retain a pool of highly-qualified leadership candidates for positions necessitated by our evolving service offerings, financial condition and organizational changes;
· ongoing and anticipated efforts to transform our business operations in line with our strategy, that were expected to result in continued significant additional work commitments by our executive officers;
· a general assessment of individual executive officer performance and contributions in support of our strategies, individual officer responsibilities, tenure and experience in his or her position and the overall financial performance of the businesses or functional areas for which an officer is responsible;
· providing competitive compensation to reflect new or expanded roles for some of our executives;
· retention considerations in light of a recent history of low bonus payouts to executive officers based on recent company performance and diminished equity compensation values because of declining stock price and earnings per share performance;
· individual officer compensation history, including the cumulative effect of equity awards granted in prior years and value realized from prior equity awards;
· internal pay equity (i.e., considering pay for similar jobs and jobs at different levels within the company and considering the relative importance of a particular position to us); and
· tax and regulatory considerations, including our policy to take reasonable and practical steps to maximize the tax deductibility of compensation payments to executives under §162(m) of the Code, the impact of expensing equity grants under Statement of Financial Accounting Standards (“SFAS”) No. 123(R) (“SFAS 123R”), and the impact of §409A of the Code relating to non-qualified deferred compensation.
The Committee also had to review compensation matters outside the usual annual compensation review and setting process. Compensation determinations for Mr. Biro (who was hired well after our annual determinations) were also affected by the numerous events cited above under the heading “Executive Summary” and:
· perceived advantages, disadvantages, strengths and weaknesses of other candidates considered;
· the scope and importance of the role, and Mr. Biro’s other skills and capabilities, to the company’s success;
· the compensation received by his immediate predecessors in the company;
· timing and geographic considerations (such as when he would be available to start); and
· the compensation he received in his recent employment.
Tally Sheets
To assist the Committee in making its 2017 annual executive compensation determinations, the Committee reviewed tally sheets for each executive officer, as it has done in prior years. Tally sheets are used as a reference to ensure that Committee members understand the total compensation provided to executives each year, over a multi-year period and in various change in control or other termination events. The Committee uses tally sheets to consider individual elements of our compensation program, the relative mix of those compensation elements and total annual and long-term compensation amounts provided to a particular executive. The tally sheets illustrate, for each executive officer:
· cash compensation (base pay, bonus and (until discontinued) automobile allowance) for the current year under consideration and each of the past two years;
· values of long-term equity compensation awards granted (options, restricted stock, phantom stock and performance awards) for the current year under consideration and each of the past two years;
· changes in value of vested and unvested equity holdings;
· salary continuation benefits (similar in effect to life insurance benefits);
· estimated pension benefits upon retirement;
· the value, and changes in value, of previous equity compensation awards;
· stock ownership guideline compliance; and
· estimated amounts the executive could realize upon a change in control or termination of employment.
For comparison purposes, the tally sheets also incorporate applicable competitive market compensation data for base salary, annual incentive awards and long-term incentive awards.
Setting the Pay Mix—Cash Versus Equity; Fixed Versus Variable
We believe a mixture of both long-term and short-term compensation elements provides the proper balance and incentives. The Committee reviews each of these elements separately and then all of the elements combined to determine the amount and mix of compensation for our executives. As has been our practice, in 2017 all short-term incentives were payable in cash. All 2017 long-term incentives were in the form of equity-based awards, and like 2016, some of these awards were linked to equity value but payable only in cash to reduce dilution. Due to insufficient shares available in the 2013 Plan and cash constraints, in 2017 the Committee was unable to award the targeted amount of equity awards (which were based on benchmarks), which caused lower actual equity award values (except for Ms. Puckett); see “Long-Term Incentive Awards” below for further details. The following chart and table show the split of 2017 target compensation for our named executive officers between equity (including equity-linked) and cash:
2017 Target Cash v. Target Equity Compensation for Named Executive Officer
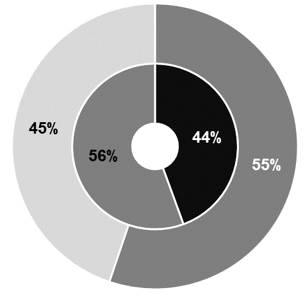
By Individual
|
Named Executive |
|
Target Cash (1) |
|
Target Equity (2) |
| ||
|
Karen Puckett (3) |
|
$ |
1,440,161 |
|
$ |
1,801,626 |
|
|
Jon Biro |
|
560,000 |
|
599,997 |
| ||
|
Robert Munden |
|
622,050 |
|
344,763 |
| ||
|
Frank Grillo |
|
622,050 |
|
250,733 |
| ||
|
Andrew Harrison |
|
497,805 |
|
188,051 |
| ||
|
Shirish Lal |
|
720,475 |
|
438,803 |
| ||
|
CEO |
|
Equity |
|
|
|
|
CEO |
|
Cash |
|
|
|
|
All NEOs |
|
Equity |
|
|
|
|
All NEOs |
|
Cash |
|
|
|
(1) Target Cash is the sum of base salary at December 31, 2016 plus column (d) (target annual incentive) from the Grants of Plan Based Awards table below, but also including a 60% target annual incentive award for Mr. Biro. No annual incentive award payments were made in respect of 2017.
(2) Target Equity is the sum of the amounts in column (l) (grant date fair value of stock and option awards) from the Grants of Plan Based Awards table below.
(3) Reflects $51,639 of base salary taken in the form of stock as “Target Equity.”
The Committee believes that a substantial portion of the potential cash compensation should be subject to meeting financial performance criteria, and thus “at risk” or variable. In 2017, 43% of the potential cash compensation (assuming target annual incentive payout) for the named executive officers was “at risk.” Over 60% of potential cash compensation was “at risk” assuming maximum annual incentive payout.
2017 Target Cash Compensation for Named Executive Officers: Fixed vs. Variable or “At Risk”
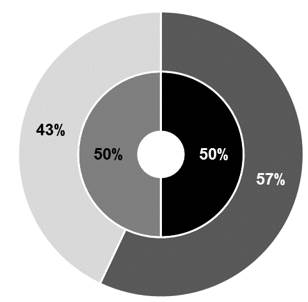
By Individual
|
Named Executive Officer |
|
Target |
|
Target |
| ||
|
Karen Puckett |
|
$ |
745,900 |
|
$ |
745,900 |
|
|
Jon Biro |
|
350,000 |
|
210,000 |
| ||
|
Robert Munden |
|
377,000 |
|
245,050 |
| ||
|
Frank Grillo |
|
377,000 |
|
245,050 |
| ||
|
Andrew Harrison |
|
301,700 |
|
196,105 |
| ||
|
Shirish Lal |
|
411,700 |
|
308,775 |
| ||
|
CEO |
|
Fixed |
|
|
|
|
CEO |
|
Variable |
|
|
|
|
All NEOs |
|
Fixed |
|
|
|
|
All NEOs |
|
Variable |
|
|
|
(1) Fixed is base salary at December 31, 2017; excludes any retention or signing bonuses.
(2) Target Variable is 2017 target potential annual incentive compensation (variable) for the named executive officers from column (d) in the Grants of Plan Based Awards Table (but also including a 60% target annual incentive award for Mr. Biro); excludes any retention or signing bonuses.
The Committee also reviewed the compensation risks associated with the pay mix of its executive officers, and in that context considers risk as well as motivation when establishing performance criteria and compensation structures. For 2017, the Committee reviewed the company’s incentive compensation plans to determine whether the company’s compensation policies and practices foster risk taking above the level of risk associated with the company’s business model. In the course of its examination, the Committee evaluated, among other things:
· whether any of our service offerings, operations or functions has much more inherent risk, a significantly different compensation structure, or different profitability basis or results;
· whether the compensation mix is appropriately balanced between annual and long-term incentive awards;
· the relationship between annual and long-term performance measures and payouts, and whether measures are aligned (or complementary) to ensure that they encourage consistent behaviors and sustainable results without conflict;
· whether long-term performance measures and equity vehicles encourage excessively risky behavior;
· whether targets require performance at such a high level that executives would take improper risks to achieve them;
· the overlap of performance criteria and vesting periods to reduce incentives to maximize performance in any one period;
· whether the mix of equity incentives serve the best interests of stockholders by rewarding the right measures;
· the effect of dilution on stockholders and the company’s equity burn rate; and
· the report of Meridian regarding the risks of our compensation program.
On the basis of this review, the Committee determined that the company’s incentive compensation plans are appropriately structured to not encourage executive officers to take unnecessary or excessive risks and do not create risks that are reasonably likely to have a material adverse effect on the company.
Market Benchmarking
As mentioned above, the Committee typically refers to executive compensation surveys and other benchmark data when it reviews and approves executive compensation. This market data is intended to reflect compensation levels and practices for executives holding comparable positions at comparable companies, which helps the Committee set compensation at levels designed to attract and retain high performing individuals. Market data typically consists of (1) publicly available data from a selected group of peer companies, and (2) more broad-based, aggregated survey data of a large number of companies of similar size or in similar industries.
In selecting the peer companies, the Committee considers a variety of criteria, including industry, revenues, market capitalization and assets. The Committee also believes that it is important to include a sufficient number of peer group companies to enhance the overall comparability of the peer company data for purposes of setting our executives’ compensation. Working with Meridian, the Committee conducted a comprehensive peer group review for 2017. The Committee selected from U.S.-listed companies based on those which have products or services which are competitive (or complementary) to our current and anticipated products and services, and represent a range of sizes (in terms of revenues, profits and employees) and history. Our 2017 peer group consisted of the following companies:
2017 Compensation Peer Group
|
Acxiom Corporation |
Hubspot, Inc. |
NCI, Inc. |
|
|
|
|
|
Advisory Board Co. |
Information Services Group |
Neustar, Inc. |
|
|
|
|
|
CIBER, Inc. |
Marin Software, Inc. |
Rocket Fuel, Inc. |
|
|
|
|
|
Forrester Research, Inc. |
MDC Partners, Inc. |
Sykes Enterprises, Incorporated |
|
|
|
|
|
Hackett Group, Inc. |
National Cinemedia, Inc. |
Teletech Holdings, Inc. |
The Committee compares each executive’s total direct compensation (comprised of salary, total potential bonus opportunity and estimated long-term incentive compensation value), both separately and in the aggregate, to amounts paid for similar positions based on the benchmark data. In looking at overall compensation for our executive officers, in general, and in response to the Meridian reports and current market practices, the Committee considers its philosophy of targeting each element of compensation (as well as target total direct compensation) to fall at approximately the 50th percentile of market compensation over time, but tolerating individual variations due to factors such as individual performance, company performance, tenure, promotion, market factors and internal pay equity.
As discussed above, however, benchmark data is merely a starting point; the Committee does not rigidly apply formulas to set the compensation of our executives based solely on market data or on any one factor in isolation. Rather, the Committee’s ultimate determinations are influenced by a number of factors that are collectively taken into consideration in the Committee’s business judgment, as further described above under the heading “Principal Factors That Influenced 2017 Executive Compensation.” Accordingly, the Committee retains discretion to set compensation levels using a combination of elements that it believes are appropriate, and the Committee is not required to set compensation levels at specific benchmark data percentiles.
Based on the total target direct annual compensation approved by the Committee’s for our incumbent named executive officers compared to the peer and market data reviewed by the Committee, Ms. Puckett and Mr. Grillo were above the 50th percentile, Messrs. Lal and Munden at the 50th percentile, and Mr. Harrison was below the 50th percentile. Mr. Biro’s initial compensation package (assessed by the Committee when he was hired) was targeted to be at approximately the 50th percentile.
Additional Analysis of Executive Compensation Elements
The following discussion provides additional information and analysis regarding the specific elements of our 2017 executive compensation program. This discussion should be read in conjunction with the remainder of this CD&A (including the section above, “Principal Factors That Influenced 2017 Executive Compensation”) and the compensation tables that follow.
Base Salary
We set executive base salaries at levels we believe are appropriate based on each individual executive’s roles, responsibilities and experience in his or her position. We believe that a competitive base salary, providing a fixed level of income over a certain period, is a necessary and important element to include in the compensation packages for our executives. We review base salaries for executive officers on an annual basis, and at the time of hire, promotion or other change in responsibilities. When hiring a new executive, the Committee conducts a benchmark analysis to assess market rates for compensation. Base salary changes also impact target bonus amounts and potential cash severance amounts, which are based on a percentage of base salary.
When reviewing each executive’s base salary in March 2017, the Committee considered, in addition to the other factors:
· the level of responsibility and complexity of the executive’s job;
· the relative importance of the executive’s role and responsibilities in and for Harte Hanks;
· whether, in the Committee’s business judgment and taking into account input from our CEO and other Board members, prior individual performance was particularly strong or weak;
· how the executive’s salary compares to the salaries of other company executives;
· how the executive’s salary compares to market salary information for the same or similar positions (making due consideration for how closely the benchmarked position matched the specific role of our executive);
· the combined potential total direct compensation value of an executive’s salary, annual bonus opportunity and long-term incentive awards;
· the economic environment; and
· recent company performance compared to (i) our financial and operational expectations for our company as a whole, (ii) performance of the functions or operations for which the executive is responsible and (iii) our peers and other market indicators.
Based upon these factors, especially financial performance, the Committee determined that only Mr. Grillo should have his salary increased (from 311,700 to $377,000) as he had assumed responsibility for sales in addition to his existing chief marketing officer responsibilities. For Mr. Biro (hired after the annual compensation determinations), base salary was negotiated based on market benchmarks, timing considerations, prior salary history, equity vs. cash mix, and the salary of other executive officers. The only change made to executive officer salaries subsequent to the annual compensation determinations was that in connection with Mr. Biro’s hiring, Mr. Munden’s salary was reduced to its prior level ($317,000) effective January 1, 2018. Although it did not affect her base salary rate, Ms. Puckett did agree to receive common stock in lieu of cash for 20% of her base salary for the last four months of 2017, and in February 2018, Ms. Puckett’s 2018 base salary was reduced by 35% to $485,000.
Annual Incentive Compensation
We provide an annual incentive opportunity for executive officers to drive company and, where appropriate, business line performance on a year-over-year basis. This annual short-term cash incentive opportunity provides an incentive for our executives to manage our businesses to achieve targeted financial results. Our 2017 AIP for executives was administered under the 2013 Plan, which was approved by our stockholders in May 2013. For the 2017 AIP, bonus opportunity amounts were expressed as a percentage of year-end base salary, as set forth below. Mr. Biro (who joined the company in November 2017) was not eligible for the 2017 AIP.
2017 AIP Opportunity (as % of Base Salary)
|
Named Executive Officer |
|
Threshold |
|
Target |
|
Maximum |
|
|
Karen Puckett |
|
25.00 |
% |
100 |
% |
200 |
% |
|
Robert Munden |
|
16.25 |
% |
65 |
% |
130 |
% |
|
Frank Grillo |
|
16.25 |
% |
65 |
% |
130 |
% |
|
Andrew Harrison |
|
16.25 |
% |
65 |
% |
130 |
% |
|
Shirish Lal |
|
18.75 |
% |
75 |
% |
150 |
% |
Actual annual incentive compensation awards for our executive officers are determined based on achievement against the Committee’s previously established financial performance goals, as certified by the Committee, typically at its regular February meeting. For 2017, the Committee also adopted individual non-financial goals to better align the leadership team’s incentives with short-term operational goals. The financial performance goals are based on the strategic financial and operating performance objectives for our company and those of our business segments. In setting the financial performance targets, the Committee considers target company performance under our annual operating plan, the potential payouts based on achievement at different levels and whether the portion of incremental earnings paid as bonuses rather than returned to stockholders or reinvested in our business is appropriate. The Committee reserves the right to adjust the financial performance targets during the year, but did not do so in 2017.
The 2017 AIP for executives continued the uniform approach to the annual incentive plan first adopted in 2014, with a goal of emphasizing the integration of the business and cross-functional/operational responsibilities (except as to the portion that was payable in respect of individual goals); the Committee viewed this as necessary to achieve the objectives of our strategic plan by providing a direct incentive to achieve optimal company-wide results. Additionally, the 2017 AIP had limitations that required that any payments made be affordable to the stockholders, i.e., that the incremental profit generated by achievement was not negated by payments under the incentive plan.
The determination of any amount ultimately payable to each executive under the 2017 AIP was based on the following performance levels relative to our Board-approved target revenue performance ($404.6 million) and EBITDA performance ($19.9 million), weighted evenly. Additionally, 10% of each executive’s potential 2017 AIP payment was based on non-financial performance objectives related to strategic goals and restructuring. In establishing the performance criteria and the incremental target performance levels for each performance criteria, the Committee anticipated that the executives would be likely to receive at least the threshold portion of their year-end cash bonuses, with higher levels of payout being progressively more difficult and less likely to occur. Achieving the maximum bonus award was anticipated, at the time of establishing the award, to be very difficult to achieve based on our company’s annual plan performance assumptions and outlook for the company.
Bonus: Financial Performance Measures/Levels
|
Revenue (45% weight) |
|
Operating Income (45% weight) |
|
|
| ||||
|
Performance |
|
Payout Level |
|
Performance |
|
Payout Level |
|
|
|
|
105 |
|
200 |
|
125 |
|
200 |
|
Maximum |
|
|
100 |
|
100 |
|
100 |
|
100 |
|
Target |
|
|
95 |
|
25 |
|
83 |
|
25 |
|
Threshold |
|
Bonus: Non-Financial Performance Measures
|
Objective |
|
Measure(s) |
|
Executives |
|
Wipro |
|
Expense reductions run rate improvement; $10 million sales funnel with $3 million in closed sales by end of 2017 |
|
Puckett, Grillo, Lal |
|
Opera/SignalHub Platform |
|
Two existing customers and two new customers on new platform generating revenue by year-end |
|
Puckett, Grillo, Lal |
|
Improve Liquidity |
|
New credit facility in place; reduce overhead $10-$20 million; improve revenue to expense ratio in operations |
|
all |
|
Objective |
|
Measure(s) |
|
Executives |
|
Build Agile Marketing Platform |
|
Produce leads (inbound requests to meet) that generate $15.5 million of closed 2017 sales |
|
Puckett, Grillo |
|
Divest 3Q Digital |
|
Initiate sales process, provided updates and recommendations, and made clear, prudent, and timely steps to bring sale to closure; signed term sheet for sale and/or extension of earnout obligation |
|
Puckett, Munden |
|
Assess Strategic Options (non-Engagement Agency) |
|
Assess strategic options and recommend a go-forward plan; provide updates and timely execution, as appropriate |
|
Puckett, Lal, Harrison |
|
Acqui-Hires |
|
Create acqui-hire approach and roadmap for board discussion; execute as liquidity/financial structure enables |
|
Puckett, Grillo, Lal, Munden |
Based on the company’s actual revenue performance and EBITDA performance, the Committee determined that no payments were earned under the 2017 AIP for the non-financial performance measures set forth above. Although all executives had achievements toward their non-financial performance goals, the Committee determined that due to the Company’s financial performance no payments would be made in respect of those measures (and no discretionary bonuses or stock awards made in respect of 2017 performance).
Bonus Restricted Stock Elections
As part of our executive compensation program, an executive officer may elect to receive up to 30% of his bonus in the form of restricted stock. An executive who so elects receives 125% of the value of the forgone cash portion of the bonus in shares of restricted stock. This program is considered by the Committee each year, and was approved again with respect to 2017 executive bonuses, which were potentially payable in early 2018. The Committee believes this program encourages the accumulation of executive stock ownership, and provides another avenue for our executive officers to reach compliance with our stock ownership guidelines. Because none of our named executive officers received an annual incentive plan payout for 2017, no grants were made under this program.
Long-Term Incentive Awards
We design our long-term incentive compensation program to drive company performance over a multi-year period, align the interests of executives with those of our stockholders and retain executives through long-term vesting and wealth accumulation. The Committee believes that a significant portion of executive compensation should be dependent on value created for our stockholders. The Committee reviews long-term incentive compensation strategy and vehicles as part of its annual executive compensation determinations. Under our 2013 Plan we may issue various equity securities to directors, officers, employees and consultants. The 2013 Plan forms the basis of our long-term incentive plan for executives. Under the 2013 Plan, the Committee has used the following long-term incentive vehicles:
|
Award Type |
|
Purpose/Description |
|
Vesting |
|
Settlement |
|
Stock Options |
|
align our executives’ interests with the interests of stockholders by having value only if our stock price increases over time |
|
4 years (25% per year) |
|
stock (Options) |
|
Performance Units |
|
motivate executives to achieve long-term performance by tying pay-out to a multi-year measurement period and specific, measurable goals that align with company plans and objectives |
|
performance (3-year cliff) |
|
stock and/or cash |
|
Restricted Stock Units |
|
retain key employees by providing awards that will have value if they vest even without stock price appreciation |
|
3 years (33% per year) |
|
stock (Restricted) |
The Committee has established standardized vesting terms for equity awards: stock options, SARs and phantom stock vest in four equal annual installments, restricted stock vests in three equal installments, and performance awards vest after a performance period spanning three calendar years. Stock options and SARs have an exercise price equal to the market value of our common stock on the date of grant, and have a term of ten years (assuming continued service). The Committee determined, in accordance with its discretion under the 2013 Plan, that equity awards granted before 2015 will vest in full upon a change of control (as defined in the 2013 Plan); however, in 2015 the Committee reconsidered this policy and no longer intends to grant awards which automatically accelerate upon a change in control. Stock option and restricted stock awards granted in or after 2014 also vest upon the death or permanent disability of the recipient.
Performance awards represent the right to receive one share of common stock or the cash equivalent (as provided in the award agreement) for each vested unit, with performance determined on a future date (currently set about three years after the grant date). The Committee chooses objective performance criteria intended to align executive’s interests with the company’s long-term interests. Based on the company’s performance for the three years ending 2017, none of the performance units issued in 2015 (with a 2017 operating income performance measure set by the Committee) vested.
Our Board previously adopted a policy of granting annual awards on a fixed date each year, April 15, but due to the delay in the filing of our Annual Report on Form 10-K for fiscal year 2016, in 2017 the Committee determined to delay issuance of annual equity awards until after the issuance of the Annual Report in June. We also grant interim awards from time to time in connection with mid-year hires, acquisitions, promotions or other reasons, based on a date selected by the Committee on or after the date of the Committee action at a meeting or by unanimous written consent. For employee hires, our practice has been to grant awards on the third business day of employment.
As a consequence of the company’s share price decline, for 2017 the Committee evaluated a variety of award types and combinations, trying to balance (i) the need for motivation that is best achieved with equity vehicles, (ii) stockholder dilution, (iii) share availability under the 2013 Plan, and (iv) decreasing cash liquidity. For 2017, the Committee approved a combination of SARs, restricted stock and performance awards for our executive officers. With the company’s share price at historic lows, the Committee believed granting SARs to executives would provide a meaningful incentive to achieve share price appreciation. The Committee also focused performance award objectives to address the company’s most pressing needs: a combination of organic revenue growth, organic EBITDA margin growth, and EBITDA margin for certain operations, and for Ms. Puckett, timely filing of required financial reports beginning with the Quarterly Report on Form 10-Q for the third quarter of 2017. The Committee determined that this combination of awards—weighted toward awards with some performance aspect—would be the best way to align our executive compensation program with the company’s needs and stockholders’ expectations for improved performance. The award structure and size adopted by the Committee also addressed the norms for such grants identified in the Meridian report, as well as other market data for how companies facing historically low stock prices have structured awards.
When reviewing each executive’s proposed equity awards for 2017, the Committee considered the level of responsibility and complexity of the executive’s job, how the executive’s target equity award value compares to the target equity award values of other Harte Hanks executives and to market benchmarks for the same or similar positions developed by Meridian. Specific target grant size was a rounded grant date value based on benchmark data provided by Meridian. The Committee set two other parameters for 2017, (i) a dilution limit of 1.5 million shares (so that any target award value above that amount would be granted in the form of cash-settling award vehicles), and (ii) an allocation of 55% (or 88% in the case of the CEO) of target award value to performance-based awards. For purposes of sizing the awards, target grant values were divided by the share price on the award date; however, due to the low share price on the grant dates, the dilution limit set by the Committee resulting in actual awards being approximately 65% of the target award level for executives other than the CEO.
The only exception to the foregoing was Mr. Biro, who joined the company as CFO in November of 2017: his initial equity awards were in lieu of an annual grant with the size being negotiated based on position benchmark data provided by Meridian, with some increase as a trade-off for reduction in other compensation elements. Mr. Biro’s awards were made as inducement grants outside the 2013 Plan, but otherwise on similar terms, and consisted of stock options, performance units (with the same performance measures as other officers) and restricted stock as reflected in the table below.
2017 Equity Awards
|
Named Executive Officer |
|
Restricted Stock |
|
Options / SARs |
|
Performance Awards |
|
Performance Awards |
|
|
Karen Puckett |
|
21,126 |
|
0 |
|
42,253 |
|
109,887 |
|
|
Jon Biro |
|
24,000 |
|
33,855 |
|
18,000 |
|
0 |
|
|
Robert Munden |
|
15,492 |
|
23,239 |
|
7,746 |
|
0 |
|
|
Frank Grillo |
|
11,267 |
|
16,901 |
|
5,633 |
|
0 |
|
|
Andrew Harrison |
|
8,450 |
|
12,676 |
|
4,225 |
|
0 |
|
|
Shirish Lal |
|
19,718 |
|
29,577 |
|
9,859 |
|
0 |
|
(1) SARs for all except Biro, who received stock options.
(2) Settling in shares of common stock.
(3) Settling in cash.
Perquisites
Consistent with previous years, our 2017 executive compensation program included limited executive perquisites. The aggregate incremental cost of providing perquisites and other benefits to our named executive officers is included in the amount shown in the All Other Compensation column of the Summary Compensation table below and detailed in the subsequent All Other Compensation table. We believe the limited perquisites we provide to our executives are representative of comparable benefits offered by companies with whom we compete for executive talent, and therefore offering these benefits serves the objective of attracting and retaining top executive talent by enhancing the competitiveness of our compensation program.
In establishing the elements and amounts of each executive’s 2017 compensation, the Committee took into consideration, as one of the relevant factors, the value of these perquisites to our executives. Tally sheets are used as a reference to ensure that Committee members understand the total compensation provided to executives each year and over a multi-year period, including the amount of each executive’s salary continuation death benefit. For 2017, our perquisites were:
· Salary Continuation Benefits — We provide salary continuation benefits (which are similar in effect to life insurance benefits) to our executive officers. This benefit provides the estates of our executive officers ten annual payments (of $90,000 for our CEO and $70,000 for Executive Vice Presidents) in the event of their death while employed by the company.
· Annual Health Examination — We reimburse the executive for an annual comprehensive health examination at the Cooper Clinic (or similar clinic) for our CEO, Executive Vice Presidents and Senior Vice Presidents (with a cost estimated to be $5,000).
The Annual Health Examination benefit was not used by any executive, and was terminated by the Committee in 2018. In addition, under Ms. Puckett’s employment agreement, we have agreed to reimburse:
· up to 12 months of temporary housing expenses (not to exceed $3,000 per month) at a location proximate to one of the company’s significant business operations;
· at her election, either (i) the reasonable moving and closing costs for the purchase of her new primary residence and sale of her current primary residence or (ii) half of the amount of any loss she incurs on the sale of her current primary personal residence, not to exceed $250,000, but only if she establishes a primary personal residence within 30 miles of one of the company’s primary business locations (or any other location mutually agreeable to the Committee and Ms. Puckett) during the first 24 months of her employment with the company; and
· up to $10,000 in legal fees incurred by her for review and negotiation of her employment agreement.
Ms. Puckett was reimbursed for her legal fees, but did not seek the other reimbursements described above.
Pension and Retirement
We have established an unfunded, non-qualified pension restoration plan (the “Restoration Pension Plan”), which we froze (as to new participants and benefit accrual based on continued service) on April 1, 2014. Executives holding office prior to the freeze date are the only designated participants in our Restoration Pension Plan. These pension benefits were designed to attract and retain key talent by providing our executives with a competitive retirement income program to supplement savings through our 401(k) plan.
The annual pension benefit under the Restoration Pension Plan is largely computed by multiplying the number of years of employment by a percentage of the participant’s final average earnings (earnings during the highest five consecutive years prior to April 1, 2014). All benefits payable under the Restoration Pension Plan are to be paid from our general assets, but we are not required to set aside any funds to discharge our obligations under the Restoration Pension Plan. There were no changes to the benefits provided to our named executive officers under our pension plans in 2017, although we amended the Restoration Pension Plan on October 11, 2016 to make discretionary the funding of a trust for the benefit of participants. Further details about our pension plans are shown in the “Pension Benefits” section below.
Severance Arrangements—Generally
In 2017 we had four types of severance arrangements with our executive officers, each addressing or intended to address different employment and/or termination circumstances:
· our executive severance policy (the “Executive Severance Policy”);
· “change in control” severance agreement (the “CIC Agreements”);
· severance agreements with Messrs. Harrison and Munden (the “Severance Agreements”); and
· an employment agreement with our CEO (the “CEO Agreement”).
Severance Arrangements—Executive Severance Policy
In January 2015, we adopted an Executive Severance Policy applicable to corporate officers and certain other executive employees designated by the Committee. The Executive Severance Policy applies only for executives in circumstances when they do not have a specific agreement that determines their rights to severance, such as the CIC Agreements, Severance Agreements and CEO Agreement described below. The Executive Severance Policy provides executives whose employment is terminated without “cause,” (i) severance payments equal to such executive’s then-current base salary for the applicable severance period (two years for our CEO and one year for all others) and (ii) subject to certain conditions, up to a year of contributions toward health care coverage. In exchange, executives are required to deliver a full release to the company, and adhere to non-competition and non-solicitation covenants. The Executive Severance Policy does not provide any acceleration of vesting for equity awards in the event of an executive’s termination. The Executive Severance Policy can be amended upon six months’ notice by the Committee, and it terminates immediately prior to a change of control of the company. The foregoing is merely a summary of the Executive Severance Policy, and is subject to the Severance Policy itself as filed January 30, 2015 on a Form 8-K with the SEC.
Severance Arrangements—CIC Agreements
The CIC Agreements are designed to allow us to attract and retain key talent by providing defined compensation in the event of a change in control. The payout levels and other terms of the severance agreements are based on the Committee’s review of publicly available market data regarding severance agreements and prior iterations of these agreements. Our current form of CIC Agreement has been accepted by all of our officers. The CIC Agreements provide that if, after a change in control, an executive (i) is terminated other than for “cause” (as defined in the agreement), death or disability or (ii) elects to terminate his employment for “good reason,” then such executive is entitled to severance compensation and a cash payment sufficient to cover health insurance premiums for a period of 24 months. The amount of severance compensation is the sum of (A) the executive’s annual base salary in effect immediately prior to the change in control or termination date, whichever is larger, plus (B) the executive’s target-level bonus or incentive compensation, multiplied by 1.0 for vice presidents, 2.0 for senior vice presidents and executive vice presidents, and 3.0 for the CEO. The foregoing severance multiples were reduced by 0.5 for levels below CEO as a result of changes made in the form of CIC Agreement in 2015, but incumbent officers retained their earlier-awarded higher multiples (as reflected in the “Potential Payments Upon Termination or Change in Control” section below). With respect to equity awards, the CIC Agreements provide that so long as such awards are assumed or replaced with equivalent awards by the acquirer, there will be no “single-trigger”
acceleration of equity awards. The foregoing is merely a summary of the most important changes to the CIC Agreements, and is subject to the revised CIC Agreement itself as filed March 19, 2015 on a Form 8-K with the SEC.
Pursuant to amendments dated February 1, 2018 (the “CIC Amendments”), the CIC Agreements with incumbent executive officers were amended to: (i) reduce to 2.0 the multiple of annual salary and bonus potentially payable as severance compensation to the president and any senior vice president or executive vice president, and (ii) reduce the acceleration of vesting (under applicable circumstances) of performance-based equity awards so that rather than full vesting acceleration on the applicable acceleration date, the awards vest pro-rata based on the period of employment from the grant date through the applicable acceleration date. The foregoing is merely a summary of the most important changes to the CIC Amendments, and is subject to the revised CIC Amendment itself as filed February 2, 2018 on a Form 8-K with the SEC.
Severance Arrangements—Severance Agreements
The Severance Agreements were designed to promote the retention of key executives during our 2013 CEO transition, to allow our new CEO at the time to be able to rely on a stable base of executive leaders familiar with our business. The Severance Agreements provide that if an officer is terminated other than (1) by reason of such officer’s death or disability, or (2) for cause, then:
· the company shall pay such officer a lump sum cash payment equal to 1.5 times such officer’s then-current annual base salary;
· for a period of up to 18 months, the company will reimburse such officer for healthcare coverage as then elected to the extent such costs exceed his or her employee contribution prior to the termination date; and
· all outstanding, unvested shares of time vesting restricted common stock held by such officer shall automatically become fully vested.
Severance Arrangements—CEO Agreement
Our CEO Agreement with Karen Puckett provides the following severance benefits in addition to the benefits Ms. Puckett has under the Executive Severance Policy and CIC Agreements:
· she is also entitled to severance compensation if employment is terminated by her for good reason (as defined in the employment agreement);
· the initial (inducement) restricted stock and option grants (but no subsequent grants) would vest one additional tranche upon a termination without cause or for good reason; and
· she would receive severance compensation equal to two times then-current base salary for most terminations not connected to a change in control.
Discretionary Bonuses and Equity Awards
We pay sign-on and other bonuses and grant new-hire equity awards when necessary or appropriate to attract executive talent. Executives we recruit may have a significant amount of unrealized value in the form of unvested equity and other forgone compensation opportunities. Sign-on bonuses and special equity awards are an effective means of offsetting the compensation opportunities executives lose when they leave a former company to join Harte Hanks. The value of these awards was generally determined by reference to market benchmarks for such positions, negotiation with the candidates, and pro-ration for the term of service. As discussed above, Mr. Biro received equity awards in connection with his hiring, with the grant being sized as (and made in lieu of) any additional annual award for 2017. The allocation for these awards among our typical award features generally followed the same allocation adopted by the Committee for executives of the same level. Although Mr. Biro did not receive a sign-on bonus, in 2016 we did pay Mr. Lal a $200,000 sign-on bonus to offset the value of equity awards he was forfeiting at his prior employer to take employment with the company.
We also may grant discretionary cash and equity awards from time to time when appropriate to retain key executives, to recognize expanded roles and responsibilities or for other reasons deemed appropriate by the Committee in its business judgment. The only such discretionary grant applicable to 2017 was the retention bonus of $125,000 granted to Mr. Munden by the Committee in 2016 (and paid in early 2018) in respect of his continued service to the company through December 31, 2017. Aside from this grant, no other discretionary retention or recognition grants were made to named executive officers in 2017. Previously, in connection with our 2015 CEO
transition, to ensure stability of senior leadership we offered retention bonuses to certain executive officers, including Messrs. Harrison and Munden, which provide for payment of a bonus of 25% of base salary if they remain employed by the company on July 1, 2016; payment of this bonus was made in 2016. The retention and sign-on bonuses described above are reflected in column (d) of the Summary Compensation Table below.
Internal Pay Equity
While comparisons to compensation levels at companies in our peer group are helpful in assessing the overall competitiveness of our compensation program, we believe that our executive compensation program also must be internally consistent and equitable to achieve our compensation objectives. Our compensation philosophy is consistent for all of our executive officer positions and, although the amounts vary, the elements of our executive compensation program are also consistent for our executives. In setting the various amounts and elements of 2017 compensation for our named executive officers, the Committee viewed each named executive officer’s compensation amounts and elements against those of the other named executive officers. The Committee did not establish any fixed formulas or ratios. Rather, the Committee’s ultimate compensation determinations were influenced by a number of factors, including internal pay equity, that were taken into consideration together in the Committee’s business judgment. We believe the total 2017 compensation we paid to each of our named executive officers was appropriate in relation to the other named executive officers, in light of their respective responsibilities, tenure and experience.
Stock Ownership Guidelines & Hedging Policies
The Committee believes that stock ownership requirements encourage officers to maintain a significant financial stake in our company, thus reinforcing the alignment of their interests with those of our stockholders. Consistent with this philosophy, we have stock ownership guidelines that require all officers to acquire and hold significant levels of our common stock. Under these guidelines (revised in February 2018), a corporate officer must reach the minimum required level of common stock ownership no later than five years from commencement of employment (and sooner in some cases). Officers promoted to a level with a higher minimum equity ownership level have three years to reach the higher level of ownership. The target ownership level (relative to base annual salary) is 500% for the CEO, 200% for executive vice presidents and senior vice presidents, and 100% for vice presidents.
The recent stock ownership of our executive officers is reflected in the section above entitled “Security Ownership of Management and Principal Stockholders.” For purposes of measuring compliance with these stock ownership guidelines, all common stock (including restricted stock units) owned by an executive officer is included. Compliance with the target ownership level is measured by the greater of (i) the aggregate of the consideration paid for qualifying shares (but for unvested awards, the grant date value), or (ii) the result of multiplying the number of qualifying shares by the average closing price of the Company’s Common Stock over the trailing 12 months. Neither options nor performance awards are included in the compliance calculation.
If an officer has not previously met the minimum equity ownership level, the officer must retain half of the “net shares” related to any option exercise or vesting of restricted stock or performance awards. “Net shares” means the number of shares remaining after the sale of shares to cover the exercise price of options and the sale of shares sufficient to pay taxes related to the exercise of options or vesting of restricted stock or performance awards. If an executive officer has previously met the applicable target ownership level, then so long as such officer maintains the number of shares needed for compliance at that time, the officer will be deemed to be in compliance notwithstanding any stock price fluctuations.
The ownership guidelines, and compliance by officers with the guidelines, are reviewed annually by the Committee. Any remedial action for failure to comply with the stock ownership guidelines is to be determined by the Committee on a case-by-case basis. Although none of our executive officers have sold shares of the company’s stock during their tenure as executive officers, currently, none of our officers have met the holding requirements under the guidelines. Ms. Puckett will have through September 2020, Mr. Grillo through October 2020, and Mr. Biro through November 2022 to establish compliance.
As part of our Business Conduct Policy, we have adopted an insider trading policy that, among other things, forbids officers from engaging in hedging activities with respect to our securities.
Clawback Policy
In February 2018, the Board adopted a clawback policy. This policy formalized the company’s long-standing practice of including in award agreements (or other applicable documents which provide the terms of incentive compensation) a provision that makes such incentive compensation subject to forfeiture, reimbursement and/or recoupment in the event the company is required to prepare an accounting restatement of its financial statements due to the company’s material noncompliance with any financial reporting requirement under the securities laws. Under the clawback policy, incentive compensation includes the following (provided that such compensation is granted, earned or vested based wholly or in part on the attainment of a financial reporting measure): annual bonuses/incentive plan awards and other short- and long-term cash incentives; stock options; stock appreciation rights; restricted stock awards and/or units; performance unit awards; and any other compensation designated as “Incentive Compensation” by the Compensation Committee at the time such compensation is made, granted or awarded.
Tax Deductibility of Executive Compensation
For tax years prior to 2018, §162(m) of the Code prevents us from taking a tax deduction for non-performance-based compensation over $1 million in any fiscal year paid to certain senior executive officers. In designing our executive compensation program, we consider the effect of §162(m) together with other factors relevant to our business needs. We seek to design our annual cash incentive and long-term performance unit awards and stock option awards to be tax-deductible to Harte Hanks, so long as preserving the tax deduction does not inhibit our ability to achieve our executive compensation or other objectives. The Committee does have discretion to design and use compensation elements that are not deductible under §162(m) if the Committee believes that paying non-deductible compensation is appropriate to achieve our executive compensation objectives. The inducement awards made to Mr. Biro (and in 2015 to Ms. Puckett and Mr. Grillo, and in 2016 to Mr. Lal) will not qualify as deductible compensation to the extent they (or they cause aggregate compensation in the applicable year to) exceed $1 million.
Review of and Conclusion Regarding All Components of Executive Compensation
The Compensation Committee has reviewed all components of the named executive officers’ 2017 compensation, including salary, bonus, long-term equity incentive compensation, accumulated realized and unrealized equity compensation gains (and losses), the value to the executive and the cost to the company of all perquisites and other personal benefits and any payments that may be payable under their respective severance agreements due to termination of their employment or a change in control of the company. The Committee also notes that company financial performance has been unsatisfactory for some time, and that performance is further reflected in the company’s stock price and stockholder value. Although the company’s compensation programs have not resulted in the desired improvements in company performance, the use of performance-based compensation has had the intended effect of reducing compensation for executive officers when stockholders suffer: no equity-based performance awards have vested in the past six years, nor have any significant annual incentive plan bonuses been paid (and none in the past four years). Likewise, the use of equity awards for a significant portion of executive officer compensation has subjected them to the same diminished value felt by stockholders.
The Committee, like the company’s executive officers, are challenged by the steep declines faced by the business. Nevertheless, the company operates in an environment where there is competition for talent, and when executive officers take on additional responsibilities as they navigate a turn-around, providing meaningful compensation that serves to reward their efforts, if successful, is essential. Based upon the Compensation Committee’s review, the Committee believes the compensation for our executive officers is competitive and that our compensation practices have enabled Harte Hanks to attract and retain the executive talent needed for the challenging turn-around the company is facing. The Committee also finds the named executive officers’ total compensation to be fair and reasonable for our circumstances, and consistent with the Committee’s and the company’s executive compensation philosophy.
Compensation Committee Report
The material in this report is not “soliciting material,” is not deemed “filed” with the SEC, and is not to be incorporated by reference into any filing under the Securities Act or the Exchange Act, whether made before or after the date hereof and irrespective of any general incorporation language in such filing.
The Compensation Committee of the Board of Directors has reviewed and discussed with management the Compensation Discussion and Analysis required by Item 402(b) of Regulation S-K and contained in this Amendment No. 1. Based on such review and discussions, the Compensation Committee recommended to the Board that the Compensation Discussion and Analysis be included in this Amendment No. 1.
|
|
Compensation Committee |
|
|
Scott C. Key, Chair |
|
|
Christopher M. Harte |
|
|
Judy C. Odom |
|
|
Alfred V. Tobia, Jr. |
Important Note Regarding Compensation Tables
The following compensation tables in this Amendment No. 1 have been prepared pursuant to SEC rules. Although some amounts (e.g., salary and non-equity incentive plan compensation) represent actual dollars paid to an executive, other amounts are estimates based on certain assumptions about future circumstances (e.g., payments upon termination of an executive’s employment) or they may represent dollar amounts recognized for financial statement reporting purposes in accordance with SFAS 123R, but do not represent actual dollars received by the executive (e.g., dollar values of stock awards and option awards). The footnotes and other explanations to the Summary Compensation table and the other tables herein contain important estimates, assumptions and other information regarding the amounts set forth in the tables and should be considered together with the quantitative information in the tables.
Summary Compensation Table
The following table sets forth information regarding compensation earned for 2017, 2016 and 2015 by our named executive officers. The amounts in column (i) are further described in the All Other Compensation table included below. None of the named executive officers received non-equity plan incentive compensation during the reporting period.
|
|
|
|
|
Salary |
|
Bonus (1) |
|
Stock |
|
Option |
|
Change in Pension |
|
All Other |
|
Total |
| |||||||
|
Name and Principal Position |
|
Year |
|
($) |
|
($) |
|
($) |
|
($) |
|
($) |
|
($) |
|
($) |
| |||||||
|
(a) |
|
(b) |
|
(c) |
|
(d) |
|
(e) |
|
(f) |
|
(h) |
|
(i) |
|
(j) |
| |||||||
|
Karen Puckett (4) |
|
2017 |
|
$ |
694,261 |
|
$ |
— |
|
$ |
1,749,987 |
|
$ |
— |
|
$ |
— |
|
$ |
1,149 |
|
$ |
2,445,396 |
|
|
President and |
|
2016 |
|
$ |
741,986 |
|
$ |
— |
|
$ |
1,502,509 |
|
$ |
— |
|
$ |
— |
|
$ |
23,860 |
|
$ |
2,268,355 |
|
|
Chief Executive Officer |
|
2015 |
|
$ |
234,615 |
|
$ |
— |
|
$ |
1,610,086 |
|
$ |
577,115 |
|
$ |
— |
|
$ |
88,657 |
|
$ |
2,510,473 |
|
|
|
|
|
|
|
|
|
|
|
|
|
|
|
|
|
|
|
| |||||||
|
Jon Biro |
|
2017 |
|
$ |
49,808 |
|
$ |
— |
|
$ |
420,000 |
|
$ |
179,997 |
|
$ |
— |
|
$ |
— |
|
$ |
649,805 |
|
|
Executive Vice President |
|
2016 |
|
$ |
— |
|
$ |
— |
|
$ |
— |
|
$ |
— |
|
$ |
— |
|
$ |
— |
|
$ |
— |
|
|
and Chief Financial Officer |
|
2015 |
|
$ |
— |
|
$ |
— |
|
$ |
— |
|
$ |
— |
|
$ |
— |
|
$ |
— |
|
$ |
— |
|
|
|
|
|
|
|
|
|
|
|
|
|
|
|
|
|
|
|
| |||||||
|
Robert Munden |
|
2017 |
|
$ |
374,635 |
|
$ |
125,000 |
|
$ |
225,409 |
|
$ |
119,355 |
|
$ |
22,590 |
|
$ |
11,275 |
|
$ |
878,263 |
|
|
Executive Vice President, CFO (1/17 to 11/17) |
|
2016 |
|
$ |
313,820 |
|
$ |
79,175 |
|
$ |
298,028 |
|
$ |
— |
|
$ |
11,768 |
|
$ |
17,088 |
|
$ |
719,879 |
|
|
General Counsel & Secretary |
|
2015 |
|
$ |
316,731 |
|
$ |
— |
|
$ |
296,803 |
|
$ |
98,936 |
|
$ |
— |
|
$ |
36,549 |
|
$ |
749,019 |
|
|
|
|
|
|
|
|
|
|
|
|
|
|
|
|
|
|
|
| |||||||
|
Frank Grillo |
|
2017 |
|
$ |
361,931 |
|
$ |
— |
|
$ |
163,930 |
|
$ |
86,803 |
|
$ |
— |
|
$ |
1,247 |
|
$ |
613,910 |
|
|
Executive Vice President, |
|
2016 |
|
$ |
308,550 |
|
$ |
— |
|
$ |
273,892 |
|
$ |
— |
|
$ |
— |
|
$ |
13,433 |
|
$ |
595,875 |
|
|
Chief Marketing Officer |
|
2015 |
|
$ |
51,923 |
|
$ |
— |
|
$ |
55,976 |
|
$ |
83,472 |
|
$ |
— |
|
$ |
11,826 |
|
$ |
203,197 |
|
|
|
|
|
|
|
|
|
|
|
|
|
|
|
|
|
|
|
| |||||||
|
Andrew Harrison |
|
2017 |
|
$ |
301,700 |
|
$ |
— |
|
$ |
122,948 |
|
$ |
65,103 |
|
$ |
56,840 |
|
$ |
11,714 |
|
$ |
558,305 |
|
|
Executive Vice President, Human |
|
2016 |
|
$ |
298,595 |
|
$ |
75,425 |
|
$ |
298,028 |
|
$ |
— |
|
$ |
29,200 |
|
$ |
17,527 |
|
$ |
718,775 |
|
|
Resources and Contact Centers |
|
2015 |
|
$ |
301,154 |
|
$ |
2,000 |
|
$ |
296,803 |
|
$ |
98,936 |
|
$ |
— |
|
$ |
38,001 |
|
$ |
736,894 |
|
|
|
|
|
|
|
|
|
|
|
|
|
|
|
|
|
|
|
| |||||||
|
Shirish Lal (5) |
|
2017 |
|
$ |
411,700 |
|
$ |
— |
|
$ |
286,897 |
|
$ |
151,906 |
|
$ |
— |
|
$ |
1,054 |
|
$ |
851,557 |
|
|
Executive Vice President, Chief |
|
2016 |
|
$ |
323,980 |
|
$ |
200,000 |
|
$ |
338,759 |
|
$ |
149,999 |
|
$ |
— |
|
$ |
1,620 |
|
$ |
1,014,358 |
|
|
Operating Officer & Chief Technology Officer |
|
2015 |
|
$ |
— |
|
$ |
— |
|
$ |
— |
|
$ |
— |
|
$ |
— |
|
$ |
— |
|
$ |
— |
|
(1) For Mr. Harrison in 2015, represents divisional anniversary bonus. For 2016, represents a signing bonus for Mr. Lal, and retention bonuses for Messrs. Harrison and Munden. For 2017, represents retention bonus for Mr. Munden (paid in 2018).
(2) The amounts in columns (e) and (f) reflect the full grant date fair value of the awards calculated in accordance with FASB ASC Topic 718. For a discussion of valuation assumptions, see note H of our audited financial statements for the fiscal year ended December 31, 2017 included in the Original Filing. For performance based stock units the fair value assumed such awards vested based on probable outcome of the performance conditions as of the grant date. For Ms. Puckett, 2014 amount reflects stock award made in respect of her service as an independent director, and in 2015 includes $59,993 for similar stock grants.
(3) The amounts in column (h) reflect an estimate of the actuarial increase in the present value of the named executive officer’s benefits under the Restoration Pension Plan, determined using interest rate and mortality rate assumptions consistent with those used in our audited financial statements and described in note H of our audited financial statements for the fiscal year ended December 31, 2017 included in the Original Filing. There can be no assurance that the amounts shown will ever be realized by the named executive officers.
(4) Ms. Puckett served as a director before her appointment as President and CEO effective September 14, 2015.
(5) Mr. Lal resigned from the company effective January 31, 2018.
All Other Compensation
|
Name |
|
Year |
|
Insurance |
|
Auto |
|
Company |
|
Restricted |
|
Other (3) |
|
Total |
| ||||||
|
Karen Puckett |
|
2017 |
|
$ |
1,149 |
|
$ |
— |
|
$ |
— |
|
$ |
— |
|
$ |
— |
|
$ |
1,149 |
|
|
|
|
2016 |
|
$ |
1,150 |
|
$ |
3,975 |
|
$ |
— |
|
$ |
18,735 |
|
$ |
— |
|
$ |
23,860 |
|
|
|
|
2015 |
|
$ |
— |
|
$ |
5,300 |
|
$ |
— |
|
$ |
23,357 |
|
$ |
60,000 |
|
$ |
88,657 |
|
|
|
|
|
|
|
|
|
|
|
|
|
|
|
|
|
| ||||||
|
Robert Munden |
|
2017 |
|
$ |
475 |
|
$ |
— |
|
$ |
10,800 |
|
$ |
— |
|
$ |
— |
|
$ |
11,275 |
|
|
|
|
2016 |
|
$ |
475 |
|
$ |
2,925 |
|
$ |
10,600 |
|
$ |
3,088 |
|
$ |
— |
|
$ |
17,088 |
|
|
|
|
2015 |
|
$ |
475 |
|
$ |
11,700 |
|
$ |
10,600 |
|
$ |
13,774 |
|
$ |
— |
|
$ |
36,549 |
|
|
|
|
|
|
|
|
|
|
|
|
|
|
|
|
|
| ||||||
|
Frank Grillo |
|
2017 |
|
$ |
767 |
|
$ |
— |
|
$ |
480 |
|
$ |
— |
|
$ |
— |
|
$ |
1,247 |
|
|
|
|
2016 |
|
$ |
767 |
|
$ |
2,925 |
|
$ |
8,624 |
|
$ |
1,117 |
|
$ |
— |
|
$ |
13,433 |
|
|
|
|
2015 |
|
$ |
— |
|
$ |
1,950 |
|
$ |
8,759 |
|
$ |
1,117 |
|
$ |
— |
|
$ |
11,826 |
|
|
|
|
|
|
|
|
|
|
|
|
|
|
|
|
|
| ||||||
|
Andrew Harrison |
|
2017 |
|
$ |
914 |
|
$ |
— |
|
$ |
10,800 |
|
$ |
— |
|
$ |
— |
|
$ |
11,714 |
|
|
|
|
2016 |
|
$ |
914 |
|
$ |
2,925 |
|
$ |
10,600 |
|
$ |
3,088 |
|
$ |
— |
|
$ |
17,527 |
|
|
|
|
2015 |
|
$ |
914 |
|
$ |
11,700 |
|
$ |
10,600 |
|
$ |
14,787 |
|
$ |
— |
|
$ |
38,001 |
|
|
|
|
|
|
|
|
|
|
|
|
|
|
|
|
|
| ||||||
|
Shirish Lal |
|
2017 |
|
$ |
1,054 |
|
$ |
— |
|
$ |
— |
|
$ |
— |
|
$ |
— |
|
$ |
1,054 |
|
|
|
|
2016 |
|
$ |
1,054 |
|
$ |
566 |
|
$ |
— |
|
$ |
— |
|
$ |
— |
|
$ |
1,620 |
|
|
|
|
2015 |
|
$ |
— |
|
$ |
— |
|
$ |
— |
|
$ |
— |
|
$ |
— |
|
$ |
— |
|
(1) Reflects annual premium paid by Harte Hanks for life insurance policies obtained in connection with providing salary continuation benefits to each of the named executive officers; see “Perquisites” included above in the CD&A.
(2) Reflects dividends paid by Harte Hanks during the year on shares of restricted stock held by each of the named executive officers; such dividends are paid at the same rate as paid on other shares of common stock.
(3) Amounts for Ms. Puckett board service fees of $50,000 earned during her tenure as an independent director, and reimbursement of $10,000 in legal fees incurred in connection with the negotiation of her employment agreement.
Grants of Plan Based Awards
The following table sets forth information regarding grants of equity-based awards during 2017 to our named executive officers. All equity awards described below were granted pursuant to our 2013 Plan, except for inducement awards made to Ms. Puckett and Messrs. Biro, Grillo and Lal in connection with their hiring. Dividends are not paid in respect of restricted stock units, performance awards or stock options. See “Potential Payments Upon Termination or Change in Control” below for other circumstance in which equity awards may vest. Other than the amounts reported in the Summary Compensation table above, there were no non-equity incentive plan awards granted in 2017.
|
|
|
|
|
|
|
Estimated Future Payouts Under |
|
Estimated Future Payouts Under |
|
All Other |
|
All Other |
|
Exercise |
|
Grant Date |
| |||||||||||||
|
|
|
|
|
Grant |
|
Threshold |
|
Target |
|
Maximum |
|
Threshold |
|
Target |
|
Maximum |
|
or Units |
|
Options |
|
Awards |
|
Awards |
| |||||
|
Name |
|
Award |
|
Date |
|
($) |
|
($) |
|
($) |
|
(#) |
|
(#) |
|
(#) |
|
(#) |
|
(#) |
|
($/Sh) (2) |
|
($) (3) |
| |||||
|
(a) |
|
Type (1) |
|
(b) |
|
(c) |
|
(d) |
|
(e) |
|
(f) |
|
(g) |
|
(h) |
|
(i) |
|
(j) |
|
(k) |
|
(l) |
| |||||
|
Karen Puckett |
|
AIP |
|
7/13/17 |
|
$ |
186,475 |
|
$ |
745,900 |
|
$ |
1,491,800 |
|
|
|
|
|
|
|
|
|
|
|
|
|
|
| ||
|
|
|
PSU(S) |
|
7/14/17 |
|
|
|
|
|
|
|
21,127 |
|
|
|
42,253 |
|
|
|
|
|
$ |
10.10 |
|
$ |
426,755 |
| |||
|
|
|
PSU(C) |
|
7/14/17 |
|
|
|
|
|
|
|
109,887 |
|
|
|
109,887 |
|
— |
|
|
|
$ |
10.10 |
|
$ |
1,109,859 |
| |||
|
|
|
RSU |
|
7/14/17 |
|
|
|
|
|
|
|
|
|
|
|
|
|
21,126 |
|
|
|
$ |
10.10 |
|
$ |
213,373 |
| |||
|
|
|
|
|
|
|
|
|
|
|
|
|
|
|
|
|
|
|
|
|
|
|
|
|
|
| |||||
|
Jon Biro |
|
Option |
|
11/13/17 |
|
|
|
|
|
|
|
|
|
|
|
|
|
|
|
33,855 |
(4) |
$ |
10.00 |
|
$ |
179,997 |
| |||
|
|
|
RSU |
|
11/13/17 |
|
|
|
|
|
|
|
|
|
|
|
|
|
24,000 |
|
|
|
$ |
10.00 |
|
$ |
240,000 |
| |||
|
|
|
PSU(S) |
|
11/13/17 |
|
|
|
|
|
|
|
7,200 |
|
7,200 |
|
18,000 |
|
|
|
|
|
$ |
10.00 |
|
$ |
180,000 |
| |||
|
|
|
|
|
|
|
|
|
|
|
|
|
|
|
|
|
|
|
|
|
|
|
|
|
|
| |||||
|
Robert Munden |
|
AIP |
|
2/16/17 |
|
$ |
61,263 |
|
$ |
245,050 |
|
$ |
490,100 |
|
|
|
|
|
|
|
|
|
|
|
— |
|
— |
| ||
|
|
|
PSU(S) |
|
6/23/17 |
|
|
|
|
|
|
|
3,098 |
|
3,098 |
|
7,746 |
|
|
|
|
|
$ |
9.70 |
|
$ |
75,136 |
| |||
|
|
|
CSAR |
|
6/23/17 |
|
|
|
|
|
|
|
|
|
|
|
|
|
|
|
23,239 |
(4) |
$ |
9.70 |
|
$ |
119,355 |
| |||
|
|
|
RSU |
|
6/23/17 |
|
|
|
|
|
|
|
|
|
|
|
|
|
15,492 |
|
|
|
$ |
9.70 |
|
$ |
150,272 |
| |||
|
|
|
|
|
|
|
|
|
|
|
|
|
|
|
|
|
|
|
|
|
|
|
|
|
|
| |||||
|
Frank Grillo |
|
AIP |
|
2/16/17 |
|
$ |
61,263 |
|
$ |
245,050 |
|
$ |
490,100 |
|
|
|
|
|
|
|
|
|
|
|
— |
|
— |
| ||
|
|
|
PSU(S) |
|
6/23/17 |
|
|
|
|
|
|
|
2,253 |
|
2,253 |
|
5,633 |
|
|
|
|
|
$ |
9.70 |
|
$ |
54,640 |
| |||
|
|
|
CSAR |
|
6/23/17 |
|
|
|
|
|
|
|
|
|
|
|
|
|
|
|
16,901 |
(4) |
$ |
9.70 |
|
$ |
86,803 |
| |||
|
|
|
RSU |
|
6/23/17 |
|
|
|
|
|
|
|
|
|
|
|
|
|
11,267 |
|
|
|
$ |
9.70 |
|
$ |
109,290 |
| |||
|
|
|
|
|
|
|
|
|
|
|
|
|
|
|
|
|
|
|
|
|
|
|
|
|
|
| |||||
|
Andrew Harrison |
|
AIP |
|
2/16/17 |
|
$ |
49,026 |
|
$ |
196,105 |
|
$ |
392,210 |
|
|
|
|
|
|
|
|
|
|
|
|
|
|
| ||
|
|
|
PSU(S) |
|
6/23/17 |
|
|
|
|
|
|
|
1,690 |
|
1,690 |
|
4,225 |
|
|
|
|
|
$ |
9.70 |
|
$ |
40,983 |
| |||
|
|
|
CSAR |
|
6/23/17 |
|
|
|
|
|
|
|
|
|
|
|
|
|
|
|
12,676 |
(4) |
$ |
9.70 |
|
$ |
65,103 |
| |||
|
|
|
RSU |
|
6/23/17 |
|
|
|
|
|
|
|
|
|
|
|
|
|
8,450 |
|
|
|
$ |
9.70 |
|
$ |
81,965 |
| |||
|
|
|
|
|
|
|
|
|
|
|
|
|
|
|
|
|
|
|
|
|
|
|
|
|
|
| |||||
|
Shirish Lal |
|
AIP |
|
2/16/17 |
|
$ |
77,194 |
|
$ |
308,775 |
|
$ |
617,550 |
|
|
|
|
|
|
|
|
|
|
|
— |
|
— |
| ||
|
|
|
PSU(S) |
|
6/23/17 |
|
|
|
|
|
|
|
3,944 |
|
3,944 |
|
9,859 |
|
|
|
|
|
$ |
9.70 |
|
$ |
95,632 |
| |||
|
|
|
CSAR |
|
6/23/17 |
|
|
|
|
|
|
|
|
|
|
|
|
|
|
|
29,577 |
(4) |
$ |
9.70 |
|
$ |
151,906 |
| |||
|
|
|
RSU |
|
6/23/17 |
|
|
|
|
|
|
|
|
|
|
|
|
|
19,718 |
|
|
|
$ |
9.70 |
|
$ |
191,265 |
| |||
(1) Type of Award: AIP = Annual Incentive Plan (cash); PSU(S) = Performance Award (unit settling in stock); RSU = Restricted Stock Unit Award (settling in stock); PSU(C) = Performance Award (unit settling in cash); Option = Stock Option; CSAR = Stock Appreciation Right (unit settling in cash); see Additional Analysis of Executive Compensation Elements—Long Term Incentive Awards above for more details.
(2) The amount shown in column (k) is based upon the closing market price of our common stock on the grant date, as reported on the NYSE.
(3) The amounts shown in column (l) represent the full grant date fair value of the options and awards calculated in accordance with FASB ASC Topic 718. For a discussion of valuation assumptions, see note H of our audited financial statements for the fiscal year ended December 31, 2017 included in the Original Filing.
(4) Options and CSARs were granted at exercise prices equal to the market value of our common stock on the grant date. Options and CSARs expire on the tenth anniversary of the grant date and vest in four equal annual installments, one on each of the first four anniversary of the grant date.
Outstanding Equity Awards at Year End
The following table sets forth information regarding outstanding equity awards held at the end of 2017 by our named executive officers. Most of these equity awards were issued pursuant to the 2013 Plan, except for the initial grants made to Ms. Puckett and Messrs. Grillo and Lal, which were issued as inducement awards outside our stockholder-approved plans as permitted by NYSE regulations. The 2013 Plan is filed as an exhibit to the Original Filing, as are the award documents for the inducement awards.
|
|
|
Option Awards |
|
Stock Awards |
| |||||||||||||||
|
Name |
|
Number of |
|
Number of |
|
Option |
|
Option |
|
Number of |
|
Market |
|
Equity Incentive |
|
Equity |
| |||
|
(a) |
|
(b) |
|
(c) |
|
(e) |
|
(f) |
|
(g) |
|
(h) |
|
(i) |
|
(j) |
| |||
|
Karen Puckett |
|
43,368 |
|
43,368 |
(3) |
$ |
37.90 |
|
9/17/2025 |
|
258 |
(10) |
$ |
2,451 |
|
34,980 |
(19) |
$ |
332,310 |
|
|
|
|
|
|
|
|
|
|
|
|
7,080 |
(11) |
$ |
67,260 |
|
26,109 |
(20) |
$ |
248,036 |
| |
|
|
|
|
|
|
|
|
|
|
|
12,334 |
(12) |
$ |
117,173 |
|
18,500 |
(21) |
$ |
175,750 |
| |
|
|
|
|
|
|
|
|
|
|
|
8,430 |
(13) |
$ |
80,085 |
|
42,253 |
(22) |
$ |
401,404 |
| |
|
|
|
|
|
|
|
|
|
|
|
21,126 |
(14) |
$ |
200,697 |
|
109,887 |
(23) |
$ |
1,043,927 |
| |
|
Jon Biro |
|
— |
|
33,855 |
(4) |
$ |
10.00 |
|
11/13/2027 |
|
24,000 |
(15) |
$ |
228,000 |
|
18,000 |
(22) |
$ |
171,000 |
|
|
Robert Munden |
|
4,000 |
|
— |
|
$ |
131.90 |
|
4/9/2020 |
|
773 |
(16) |
$ |
7,344 |
|
1,778 |
(24) |
$ |
16,891 |
|
|
|
|
1,200 |
|
— |
|
$ |
123.10 |
|
2/5/2021 |
|
2,934 |
(12) |
$ |
27,873 |
|
3,778 |
(20) |
$ |
35,891 |
|
|
|
|
2,800 |
|
— |
|
$ |
99.10 |
|
2/5/2022 |
|
1,719 |
(13) |
$ |
16,331 |
|
4,400 |
(21) |
$ |
41,800 |
|
|
|
|
6,000 |
|
— |
|
$ |
72.50 |
|
9/18/2022 |
|
15,492 |
(14) |
$ |
147,174 |
|
7,746 |
(22) |
$ |
73,587 |
|
|
|
|
3,455 |
|
1,152 |
(5) |
$ |
82.30 |
|
4/15/2024 |
|
|
|
|
|
|
|
|
| ||
|
|
|
2,396 |
|
2,396 |
(6) |
$ |
76.80 |
|
4/15/2025 |
|
|
|
|
|
|
|
|
| ||
|
|
|
— |
|
23,239 |
(7) |
$ |
9.70 |
|
6/23/2027 |
|
|
|
|
|
|
|
|
| ||
|
Frank Grillo |
|
5,065 |
|
5,065 |
(8) |
$ |
42.60 |
|
10/28/2025 |
|
438 |
(17) |
$ |
4,161 |
|
2,833 |
(20) |
$ |
26,914 |
|
|
|
|
— |
|
16,901 |
(7) |
$ |
9.70 |
|
6/23/2027 |
|
2,200 |
(12) |
$ |
20,900 |
|
3,300 |
(21) |
$ |
31,350 |
|
|
|
|
|
|
|
|
|
|
|
|
1,289 |
(13) |
$ |
12,246 |
|
5,633 |
(22) |
$ |
53,514 |
| |
|
|
|
|
|
|
|
|
|
|
|
11,267 |
(14) |
$ |
107,037 |
|
|
|
$ |
— |
| |
|
Andrew Harrison |
|
400 |
|
— |
|
$ |
159.00 |
|
2/5/2018 |
|
773 |
(16) |
$ |
7,344 |
|
1,778 |
(24) |
$ |
16,891 |
|
|
|
|
1,125 |
|
— |
|
$ |
60.40 |
|
2/5/2019 |
|
2,934 |
(12) |
$ |
27,873 |
|
3,778 |
(20) |
$ |
35,891 |
|
|
|
|
1,200 |
|
— |
|
$ |
119.00 |
|
2/5/2020 |
|
1,719 |
(13) |
$ |
16,331 |
|
4,400 |
(21) |
$ |
41,800 |
|
|
|
|
400 |
|
— |
|
$ |
123.10 |
|
2/5/2021 |
|
8,450 |
(14) |
$ |
80,275 |
|
4,225 |
(22) |
$ |
40,138 |
|
|
|
|
800 |
|
— |
|
$ |
99.10 |
|
2/5/2022 |
|
|
|
|
|
|
|
|
| ||
|
|
|
4,000 |
|
— |
|
$ |
72.50 |
|
9/18/2022 |
|
|
|
|
|
|
|
|
| ||
|
|
|
3,455 |
|
1,152 |
(5) |
$ |
82.30 |
|
4/15/2024 |
|
|
|
|
|
|
|
|
| ||
|
|
|
570 |
|
— |
|
$ |
77.60 |
|
2/5/2025 |
|
|
|
|
|
|
|
|
| ||
|
|
|
2,396 |
|
2,396 |
(6) |
$ |
76.80 |
|
4/15/2025 |
|
|
|
|
|
|
|
|
| ||
|
|
|
— |
|
12,676 |
(7) |
$ |
9.70 |
|
6/23/2027 |
|
|
|
|
|
|
|
|
| ||
|
Shirish Lal |
|
3,009 |
|
9,028 |
(9) |
$ |
28.50 |
|
3/16/2016 |
|
4,912 |
(18) |
$ |
46,664 |
|
4,121 |
(20) |
$ |
39,150 |
|
|
|
|
— |
|
29,577 |
(7) |
$ |
9.70 |
|
6/23/2027 |
|
19,718 |
(14) |
$ |
187,321 |
|
4,800 |
(21) |
$ |
45,600 |
|
|
|
|
— |
|
— |
|
$ |
— |
|
|
|
— |
|
$ |
— |
|
9,859 |
(22) |
$ |
93,661 |
|
(1) Based upon the closing market price of our common stock as of December 31, 2017 ($9.50), as reported on the NYSE.
(2) In 2015, 2016 and 2017, our Compensation Committee awarded our executives performance-based stock units which are payable, if earned, in shares of common stock or cash. The payout levels range from 0% to a maximum of 100% of the performance units granted.
(3) These options vest in two equal annual installments on September 17 of 2018 - 2019.
(4) These options vest in four equal annual installments on November 13 of 2018 - 2021.
(5) These options vested on April 15 of 2018.
(6) Half of these options vest on April 15, 2018; the remainder vest on April 15, 2019.
(7) These SARs vest in four equal annual installments on June 23 of 2018 - 2021.
(8) These options vest in two equal annual installments on October 28 of 2019 - 2020.
(9) These options would have vested in three equal annual installments on March 16 of 2018 — 2020.
(10) Restricted stock vested on February 5, 2018.
(11) Restricted stock vests on September 17, 2018.
(12) Half of this restricted stock vested on April 15, 2018; the remainder vests April 15, 2019.
(13) One third of this phantom stock vested on April 15, 2018; the remainder vests in two equal annual installments on April 15 of 2019 — 2020.
(14) Restricted stock unit vests in three equal annual installments on July 14 of 2018 — 2020.
(15) Restricted unit stock vests in three equal annual installments on November 13 of 2018 — 2020.
(16) Restricted stock vested on April 15, 2018.
(17) Restricted stock vests on October 28, 2018.
(18) Restricted stock would have vested in two installments on March 16 of 2018 — 2019.
(19) Performance stock unit vests (payable in stock) February 15, 2019, subject to relative TSR performance conditions.
(20) Performance stock unit vests (payable in cash) February 15, 2019, subject to revenue performance conditions.
(21) Performance stock unit vests (payable in stock) February 15, 2018, subject to operating income performance conditions.
(22) Performance stock unit would vest (payable in stock) February 15, 2020, subject to revenue and EBITDA performance conditions.
(23) Performance stock unit would vest (payable in cash) February 15, 2020, subject to timely financial reporting performance conditions.
(24) Performance stock unit would vest (payable in stock) February 15, 2018, subject to operating income performance conditions; conditions were not met, so no units vested.
Option Exercises and Stock Vested
The following table sets forth information for our named executive officers regarding option exercises and equity vesting during 2017, calculated as the aggregate market value of the vested shares based on the closing price of our common stock on the vesting date. Awards indicated as restricted stock are settled in shares, and awards indicated as phantom stock are settled in cash.
|
|
|
|
|
Stock Awards |
| |||
|
Name |
|
|
|
Number of |
|
Value Realized |
| |
|
(a) |
|
|
|
(d) |
|
(e) |
| |
|
Karen Puckett |
|
Restricted Stock |
|
13,789 |
|
$ |
149,284 |
|
|
|
|
Phantom Stock |
|
2,809 |
|
35,955 |
| |
|
|
|
|
|
|
|
|
| |
|
Jon Biro |
|
Restricted Stock |
|
— |
|
— |
| |
|
|
|
Phantom Stock |
|
— |
|
— |
| |
|
|
|
|
|
|
|
|
| |
|
Robert Munden |
|
Restricted Stock |
|
2,896 |
|
37,069 |
| |
|
|
|
Phantom Stock |
|
572 |
|
7,322 |
| |
|
|
|
|
|
|
|
|
| |
|
Frank Grillo |
|
Restricted Stock |
|
1,538 |
|
18,504 |
| |
|
|
|
Phantom Stock |
|
429 |
|
5,491 |
| |
|
|
|
|
|
|
|
|
| |
|
Andrew Harrison |
|
Restricted Stock |
|
2,896 |
|
37,069 |
| |
|
|
|
Phantom Stock |
|
572 |
|
7,322 |
| |
|
|
|
|
|
|
|
|
| |
|
Shirish Lal |
|
Restricted Stock |
|
2,456 |
|
35,612 |
| |
|
|
|
Phantom Stock |
|
— |
|
— |
| |
Pension Benefits—Restoration Pension Plan
The table below under this heading sets forth information regarding estimated payments or other benefits payable at, following or in connection with retirement to which our named executive officers are entitled under our Restoration Pension Plan. The Restoration Pension Plan is administered by a committee comprised of Messrs. Biro, Copeland, Harrison and Munden.
The purpose of this unfunded, non-qualified pension plan is to provide executives with the benefits they would receive if our qualified defined benefit plan (in which no current named executive participates) were not subject to the benefit and compensation limits imposed by Section 415 and Section 401(a)(17) of the Code and had benefit accruals under such plan not been frozen at December 31, 1998. The Restoration Pension Plan was itself frozen to participation and benefit accruals as of April 1, 2014; all current participants—current or former executive officers—are fully vested. Benefits accrued and vested after December 31, 2004 under the Restoration Pension Plan are subject to non-qualified deferred compensation rules under Section 409A of the Code. The Restoration Pension Plan provides benefits based on a formula that takes into account the executive’s earnings for each fiscal year. For purposes of the calculation of the monthly amount payable starting after retirement under the Restoration Pension Plan, the following definitions apply:
“Average Monthly Compensation” means the monthly average of the five consecutive years’ compensation out of the last ten complete years on April 1, 2014 that gives the highest average. For purposes of determining the gross benefit under the Restoration Pension Plan, compensation includes W-2 compensation (subject to certain exclusions) plus any compensation deferred under a Section 125 or Section 401(k) plan, but only recognizes up to 100% of the target bonus amount for years prior to 2001 and up to 50% of the target bonus amount for years after 2000. The compensation for the gross Restoration Pension Plan benefit is not limited by the Code Section 401(a)(17) pay limit.
“Normal Retirement Date” means the date upon which a participant reaches age 65.
“Covered Compensation” means a 35-year average of the Maximum Taxable Wages (MTW) under social security. The MTW is the annual limit on wages subject to the FICA tax for social security. The 35-year period ends with the year the employee reaches eligibility for an unreduced social security benefit (age 65, 66, or 67 depending on the year the employee was born). For years after 2014 (the year of the Restoration Pension Plan freeze) and prior to the end of the 35-year period, the MTW from 2014 is used.
The monthly amount is the lesser of the sum of A and B multiplied by C and D as defined below:
A = 1.0 percent of the Average Monthly Compensation multiplied by the projected number of years of credited service at the Normal Retirement Date.
B = 0.65 percent of the Average Monthly Compensation in excess of 1/12 of Covered Compensation multiplied by the number of years of projected credited service at the Normal Retirement Date up to 35 years.
C = Ratio of credited service at April 1, 2014 to projected credited service at the Normal Retirement Date.
D = 50 percent of Average Monthly Compensation.
Participants are eligible for early retirement upon attainment of age 55 if they are vested (as all current participants are). The monthly amount payable upon early retirement is equal to the monthly accrued benefit at the date of termination multiplied by an early retirement factor as decreased by certain plan and Internal Revenue Service-prescribed early retirement factors. We do not have a policy for granting extra years of credited service. In the event of a change of control (as defined in the Restoration Benefit Plan), our then-current obligations may, in our discretion, be funded through the establishment of a trust fund.
The amounts reported in the following table equal the present value of the accumulated benefit through December 31, 2017 for our named executive officers under the Restoration Pension Plan based on the assumptions described in note (1); only Messrs. Harrison and Munden are participants in the Restoration Pension Plan. No executive officer received payments under the Restoration Pension Plan in 2017.
|
|
|
|
|
Number of Years of |
|
Present Value of |
| |
|
Name |
|
Plan Name |
|
(#) |
|
($) |
| |
|
(a) |
|
(b) |
|
(c) |
|
(d) |
| |
|
Robert Munden |
|
Restoration Benefit Plan |
|
4.000 |
|
$ |
145,449 |
|
|
Andrew Harrison |
|
Restoration Benefit Plan |
|
18.583 |
|
$ |
347,493 |
|
(1) The accumulated benefit is based on service and earnings, as described above, considered by the plans for the period through December 31, 2016. The present value has been calculated using a discount rate of 3.67% and assuming the named executive officers will live and retire at the normal retirement age of 65 years. For purposes of calculating the actuarial present value, no pre-retirement decrements are factored into the calculations. The mortality assumption is based on the RP2006 generational mortality tables projected using Scale MP2016.
Potential Payments Upon Termination or Change in Control
Payments Pursuant to Severance Agreements
In 2017 we had four types of severance arrangements with our executive officers, each addressing or intended to address different employment and/or termination circumstances:
· the Executive Severance Policy;
· the CIC Agreements;
· Severance Agreements with Messrs. Harrison and Munden; and
· CEO Agreement with Ms. Puckett.
Please see the descriptions of these arrangements under the heading “Severance Arrangements—Generally” above.
Payments Made Upon Retirement
For a description of the pension plans in which the named executive officers participate, see the Pension Benefits table above under the heading “Pension Benefits — Restoration Pension Plan”. The tables below provide the estimated pension benefits that would have become payable if the named executive officer had ceased to be employed as of December 31, 2016. None of our current named executive officers is eligible for early retirement.
Payments Made Upon Death or Disability
For a discussion of the supplemental life insurance benefits for the named executive officers, see the section above entitled “Perquisites” and the All Other Compensation table above. The tables below provide the amounts the beneficiaries of each named executive officer would have received had such officer died on December 31, 2016. The company pays for long-term disability insurance for all salaried employees, and the table below provides the estimated amounts payable to our named executive officers (or their guardians) if they had become eligible for payments under such policy on December 31, 2016.
Potential Termination and Change in Control Benefits
The following table illustrates an estimated amount of compensation potentially payable to each named executive officer upon termination of such executive’s employment under various scenarios. Any amount ultimately received will vary based on a variety of factors, including the reason for such executive’s termination of employment, the date of such executive’s termination of employment, and the executive’s age upon termination of employment. The amounts shown assume that such event occurred as of December 31, 2017, and, therefore are estimates of the amounts that would have been paid to such executives upon such event. Actual amounts to be paid can only be determined at the time of the event triggering the payment obligations. No additional payments are required in the event of a termination for cause in connection with a change in control. Mr. Lal resigned effective January 31, 2018, and no payments (other than for wages and benefits accrued prior to termination) were made.
The following table does not reflect the reduced amounts payable as a result of the CIC Amendments effected in February 2018; see “Severance Arrangements—CIC Agreements” above.
|
|
|
No Change in Control |
|
Change in Control |
| |||||||||||
|
|
|
Disability |
|
Death |
|
Termination |
|
No |
|
Termination |
| |||||
|
Karen Puckett |
|
|
|
|
|
|
|
|
|
|
| |||||
|
Retirement Benefits |
|
$ |
— |
|
$ |
— |
|
$ |
— |
|
$ |
— |
|
$ |
— |
|
|
Disability Benefits |
|
1,242,998 |
|
— |
|
— |
|
— |
|
— |
| |||||
|
Salary Continuation (2) |
|
— |
|
900,000 |
|
— |
|
— |
|
— |
| |||||
|
Cash Severance (3) |
|
— |
|
— |
|
1,491,800 |
|
— |
|
4,475,400 |
| |||||
|
Health Benefits (3) (4) |
|
— |
|
— |
|
29,294 |
|
— |
|
42,576 |
| |||||
|
Equity Vesting Acceleration (3) (5) |
|
467,666 |
|
467,666 |
|
67,260 |
|
— |
|
2,669,092 |
| |||||
|
Estimated Total |
|
$ |
1,710,664 |
|
$ |
1,367,666 |
|
$ |
1,588,354 |
|
$ |
— |
|
$ |
7,187,068 |
|
|
Jon Biro |
|
|
|
|
|
|
|
|
|
|
| |||||
|
Retirement Benefits |
|
$ |
— |
|
$ |
— |
|
$ |
— |
|
$ |
— |
|
$ |
— |
|
|
Disability Benefits |
|
2,239,494 |
|
— |
|
— |
|
— |
|
— |
| |||||
|
Salary Continuation (2) |
|
— |
|
700,000 |
|
— |
|
— |
|
— |
| |||||
|
Cash Severance |
|
— |
|
— |
|
350,000 |
|
— |
|
700,000 |
| |||||
|
Health Benefits (4) |
|
— |
|
— |
|
19,422 |
|
— |
|
52,127 |
| |||||
|
Equity Vesting Acceleration (5) |
|
228,000 |
|
228,000 |
|
— |
|
— |
|
399,000 |
| |||||
|
Estimated Total |
|
$ |
2,467,494 |
|
$ |
928,000 |
|
$ |
369,422 |
|
$ |
— |
|
$ |
1,151,127 |
|
|
Robert Munden |
|
|
|
|
|
|
|
|
|
|
| |||||
|
Retirement Benefits (6) |
|
$ |
145,449 |
|
$ |
145,449 |
|
$ |
145,449 |
|
$ |
145,449 |
|
$ |
145,449 |
|
|
Disability Benefits |
|
2,379,827 |
|
— |
|
— |
|
— |
|
— |
| |||||
|
Salary Continuation (2) |
|
— |
|
700,000 |
|
— |
|
— |
|
— |
| |||||
|
Cash Severance |
|
— |
|
— |
|
565,500 |
|
— |
|
1,555,125 |
| |||||
|
Health Benefits (4) |
|
— |
|
— |
|
22,834 |
|
— |
|
42,576 |
| |||||
|
Equity Vesting Acceleration (5) |
|
198,721 |
|
198,721 |
|
198,721 |
|
— |
|
366,890 |
| |||||
|
Estimated Total |
|
$ |
2,723,997 |
|
$ |
1,044,170 |
|
$ |
932,504 |
|
$ |
145,449 |
|
$ |
2,110,040 |
|
|
Frank Grillo |
|
|
|
|
|
|
|
|
|
|
| |||||
|
Retirement Benefits |
|
$ |
— |
|
$ |
— |
|
$ |
— |
|
$ |
— |
|
$ |
— |
|
|
Disability Benefits |
|
2,171,458 |
|
— |
|
— |
|
— |
|
— |
| |||||
|
Salary Continuation (2) |
|
— |
|
700,000 |
|
— |
|
— |
|
— |
| |||||
|
Cash Severance |
|
— |
|
— |
|
377,000 |
|
— |
|
1,244,100 |
| |||||
|
Health Benefits (4) |
|
— |
|
— |
|
4,525 |
|
— |
|
22,332 |
| |||||
|
Equity Vesting Acceleration (5) |
|
144,343 |
|
144,343 |
|
— |
|
— |
|
256,120 |
| |||||
|
Estimated Total |
|
$ |
2,315,801 |
|
$ |
844,343 |
|
$ |
381,525 |
|
$ |
— |
|
$ |
1,522,552 |
|
|
Andrew Harrison |
|
|
|
|
|
|
|
|
|
|
| |||||
|
Retirement Benefits (6) |
|
$ |
347,493 |
|
$ |
347,493 |
|
$ |
347,493 |
|
$ |
347,493 |
|
$ |
347,493 |
|
|
Disability Benefits |
|
2,542,805 |
|
— |
|
— |
|
— |
|
— |
| |||||
|
Salary Continuation (2) |
|
— |
|
700,000 |
|
— |
|
— |
|
— |
| |||||
|
Cash Severance |
|
— |
|
— |
|
452,550 |
|
— |
|
1,244,513 |
| |||||
|
Health Benefits (4) |
|
— |
|
— |
|
21,965 |
|
— |
|
42,468 |
| |||||
|
Equity Vesting Acceleration (5) |
|
131,822 |
|
131,822 |
|
131,822 |
|
— |
|
395,314 |
| |||||
|
Estimated Total |
|
$ |
3,022,120 |
|
$ |
1,179,315 |
|
$ |
953,830 |
|
$ |
347,493 |
|
$ |
2,029,788 |
|
|
Shirish Lal |
|
|
|
|
|
|
|
|
|
|
| |||||
|
Retirement Benefits |
|
$ |
— |
|
$ |
— |
|
$ |
— |
|
$ |
— |
|
$ |
— |
|
|
Disability Benefits |
|
2,449,405 |
|
— |
|
— |
|
— |
|
— |
| |||||
|
Salary Continuation (2) |
|
— |
|
700,000 |
|
— |
|
— |
|
— |
| |||||
|
Cash Severance |
|
— |
|
— |
|
411,700 |
|
— |
|
1,440,950 |
| |||||
|
Health Benefits (4) |
|
— |
|
— |
|
14,647 |
|
— |
|
42,576 |
| |||||
|
Equity Vesting Acceleration (5) |
|
233,985 |
|
233,985 |
|
— |
|
— |
|
412,395 |
| |||||
|
Estimated Total |
|
$ |
2,683,390 |
|
$ |
933,985 |
|
$ |
426,347 |
|
$ |
— |
|
$ |
1,895,921 |
|
(1) Assumes equity awards are assumed or replaced with equivalents, as described under the terms of the CIC Agreements.
(2) Sum of 10 annual payments payable to the executive’s estate in the event of such executive’s death while employed.
(3) The non-change in control amounts are also payable if Ms. Puckett terminates for “good reason” as defined in her employment agreement.
(4) Reflects the estimated payments to (i) partially offset the cost of 12-24 months (no change in control) or (ii) entirely offset the cost of 24 months of future premiums (change in control) under our health and welfare benefit plans.
(5) Values are calculated based on the closing price of our common stock of $9.50 on December 31, 2017.
(6) Reflects the estimated single sum present value of Restoration Pension Plan accumulated benefit as of December 31, 2017, which the officer would be entitled to receive upon reaching age 65. Actual payments are made over time, not in a lump sum. None of our named executive officers with this benefit have reached normal retirement age. These amounts would also be payable in the event of termination with or without cause or voluntary resignation, provided that some or all of this amount is subject to clawback if, in the event of a “for cause” termination related to dishonest conduct, the Compensation Committee elects to deny vested retirement benefits under the Restoration Pension Plan.
Risk Oversight
Our Board is responsible for overseeing the risk management process. The Board focuses on our general risk management strategy and the most significant risks we face, and ensures that appropriate risk mitigation strategies are implemented by management. The Board is also apprised of particular risk management matters in connection with its general oversight and approval of corporate matters.
In performing the risk management process, the Board reviews with management (1) our policies with respect to risk assessment and management of risks that may be material to us, (2) our system of disclosure controls and system of internal controls over financial reporting, and (3) our compliance with legal and regulatory requirements. The Board also reviews major legislative and regulatory developments that could materially impact our contingent liabilities and risks. Our other Board committees also consider and address risk as they perform their respective committee responsibilities. For example, our Compensation Committee evaluates the risks associated with our compensation plans and policies, and our Audit Committee monitors risks relating to our financial controls and reporting. All committees report to the full Board as appropriate, including when a matter rises to the level of a material or enterprise level risk. The leadership structure of our Board described above in the “Board Leadership Structure” section also ensures that management is properly overseen by independent directors.
Management is responsible for day-to-day risk management. Our finance, treasury, general counsel and internal audit functions serve as the primary monitoring and testing groups for company-wide policies and procedures, and manage the day-to-day oversight of the risk management strategy for our ongoing business. This oversight includes identifying, evaluating and addressing potential risks that may exist at the enterprise, strategic, financial and operational levels, as well as compliance and reporting.
We believe the division of risk management responsibilities described above is an effective approach for addressing the risks facing the company with respect to the company’s compensation policies and practices and that our Board leadership structure supports this approach.
Pay Ratio Disclosure
The SEC adopted a rule requiring annual disclosure of the ratio of our median employee’s (not including our principal executive officer (“PEO”)) annual total compensation to the total annual compensation of the PEO, in our case Karen Puckett. We employ people of all skills and education levels across multiple continents and economic regions. Our employee population comprises, among others, strategists and consultants with advanced degrees, marketing and technology experts, experienced managers, back-office operations staff, and mail production and distribution staff. Seventy percent of our employees worked in contact centers in the U.S. and the Philippines during 2017. The composition of the employee population requires a broad variance of market-driven compensation rates and, accordingly, yields a wide ratio of PEO pay to that of the median employee.
The Company is presenting the following information for 2017 as follows:
· Median employee (other than PEO) total annual compensation: $16,819.
· Ms. Puckett (PEO) total annual compensation: $2,445,396.
· Based on this information, for 2017, the ratio of the annual total compensation of our PEO to the median employee’s annual total compensation was reasonably estimated to be 145.4 to 1.0.
In determining the median employee, we prepared a listing of all employees as of December 31, 2017, and total compensation for each employee for the annual period then ended. Wages and salaries were annualized for those employees who were not employed for the full year of 2017. We selected the median employee from the annualized list by ranking the annual total compensation of all employees except for the PEO from lowest to highest and determining the median employee. Once we identified the median employee, we aggregated the following 2017 compensation elements to determine comparative wages for the pay ratio: salaries/wages, overtime, paid time off, bonus, and vesting equity awards. For simplicity, the value of our 401(k) plan and medical benefits provided was excluded, as the median employee and the PEO were offered the same benefits, and we utilized the Internal Revenue Service safe harbor provision for 401(k) discrimination testing in 2017. As of December 31, 2017, we employed 4,971 persons of which 3,483 were in our contact center operations.
DIRECTOR COMPENSATION
Elements of Current Director Compensation Program
Directors’ compensation includes cash and stock-based incentives. Employee directors are not paid additional compensation for their services as directors. Currently, non-employee directors receive the following compensation for their services on the Board and its committees. Directors’ compensation is subject to change from time to time, and the Board has acted to change certain elements of director compensation as noted in “Establishing Director Compensation” below the table.
|
Element |
|
Description |
|
Amount |
|
|
Annual Cash Retainer |
|
Payable to “independent” Board members, as determined by the Board in accordance with applicable rules |
|
$40,000 |
|
|
Annual Equity Awards |
|
· For each calendar year, each independent director receives restricted stock units which vest in three equal annual installments beginning the first anniversary of the grant date |
|
Shares equal to $70,000 |
|
|
|
|
· The number of shares of restricted stock delivered was based on the market value of one share of the company’s common stock on the NYSE on the grant date, in accordance with the 2013 Plan |
|
|
|
|
|
|
· These shares of restricted stock were granted pursuant to the 2013 Plan and the other terms and conditions set forth in the applicable form of award agreement under the 2013 Plan |
|
|
|
|
Annual Retainer for Independent Chairman |
|
Payable to the Chairman if the Chairman is an independent director; consists of a grant of restricted stock units on July 1 of each year, vesting in one year but otherwise consistent with Annual Equity Awards (below); in addition to other amounts payable for service as a director |
|
Shares equal to $50,000 |
|
|
Annual Cash |
|
· Audit Committee Chair |
|
$12,500 |
|
|
Retainer for Committee Chairs |
|
· Compensation Committee Chair |
|
$7,500 |
|
|
|
|
· Nominating and Corporate Governance Committee Chair |
|
$5,500 |
|
|
Annual Equity Election In Lieu of Cash Fees |
|
· Each independent director may elect, annually or in connection with such director’s appointment to the Board, to receive all or a portion of such director’s cash compensation otherwise payable for such director’s services in shares of the company’s common stock |
|
Up to 100% of a director’s cash compensation |
|
|
|
|
· These shares of common stock are granted as soon as administratively practicable following the end of each of the company’s fiscal quarters; the number of shares delivered is based on the market value of one share of the company’s common stock on the NYSE as of the last day of the immediately preceding quarter, in accordance with the 2013 Plan |
|
|
|
|
Other |
|
· Non-management directors may also receive compensation from time to time for any service on special Board committees |
|
As applicable |
|
|
|
|
· All directors are reimbursed for their out-of-pocket expenses incurred in connection with their service on the Board or any of its committees |
|
|
|
Establishing Director Compensation
The Compensation Committee has the responsibility for recommending to the Board the form and amount of compensation for non-employee directors. The Compensation Committee may appoint subcommittees and
delegate to a subcommittee such power and authority as it deems appropriate, subject to certain limitations set forth in its charter and discussed above in the CD&A. The Compensation Committee did not appoint any subcommittees during 2017.
The Compensation Committee has the sole authority to retain or terminate a consulting firm engaged to assist in the evaluation of director compensation. From time to time, the Compensation Committee reviews surveys and other information provided by outside consultants to provide insights on director compensation matters. Our director compensation is structured predominantly based upon the results of such reviews, company performance, and the amount of time devoted to Board and committee meetings. The Committee believes that engaging a consultant on a periodic basis is more appropriate than having annual engagements.
In connection with Meridian’s 2017 engagement to review the company’s executive compensation programs, the Committee also requested that Meridian conduct a review and analysis of our compensation of non-employee directors and related policies, practices and trends. The Committee made its 2017 annual non-employee director compensation determinations, taking into account the results of Meridian’s review, analysis and recommendations, among other factors, and no changes were initially made from the then-current compensation program. However, in August 2017, seven directors unilaterally waived all compensation for the remainder of the year. In February 2018, the Committee considered ways to reduce and simplify target non-employee director compensation, and the Board adopted the new compensation structure reflected in the table above, which:
· eliminated meeting fees (which had been a material driver of increased compensation in recent years);
· reduced the cash retainer by $5,000;
· increased the annual equity award by $10,000 to weight director compensation more heavily toward stock; and
· reduced committee chair retainers by $2,500 each.
The Board believes this overall compensation level is appropriate for the company’s circumstances and its need to attract and retain highly qualified board candidates.
Director Stock Ownership Guidelines & Hedging Policy
We recently revised our Corporate Governance Principles and Stock Ownership Guidelines to increase the stock holding requirement expected of non-employee directors. Non-employee directors are expected to hold five times the annual cash retainer amount (or $200,000) in company stock (an increase from three times the annual cash retainer amount, or $135,000, under prior compensation programs). Employee directors are likewise subject to the Stock Ownership Guidelines, but as applicable to their management level rather than directorship. Currently, each of our directors other than Mr. Keating is in compliance with this policy(Mr. Keating has through 2022 to come into compliance). As part of our Business Conduct Policy, we have adopted an insider trading policy that, among other things, forbids directors from engaging in hedging activities with respect to our securities.
2017 Director Compensation for Non-Employee Directors
The following table shows 2017 compensation recognized for financial statement reporting purposes of our non-employee directors. Consequently, the amounts reflected in the “Stock Awards” column below also include compensation expense amounts from awards granted in prior years. All fees were paid in cash, unless otherwise designated.
|
|
|
Fees Earned or Paid in Cash |
|
Stock Awards |
|
Total |
| |||
|
Name |
|
($) |
|
($) (1) |
|
($) |
| |||
|
(a) |
|
(b) |
|
(c) |
|
(f) |
| |||
|
Stephen E. Carley (2) |
|
$ |
37,000 |
|
$ |
59,995 |
|
$ |
96,995 |
|
|
David L. Copeland |
|
$ |
51,917 |
|
$ |
59,995 |
|
$ |
111,912 |
|
|
William F. Farley (3) |
|
$ |
62,252 |
|
$ |
59,995 |
|
$ |
122,247 |
|
|
Christopher M. Harte (4) |
|
$ |
52,003 |
|
$ |
109,991 |
|
$ |
161,994 |
|
|
Melvin L. Keating |
|
$ |
31,125 |
|
$ |
59,991 |
|
$ |
91,116 |
|
|
Scott C. Key |
|
$ |
56,501 |
|
$ |
59,995 |
|
$ |
116,496 |
|
|
Judy C. Odom |
|
$ |
55,083 |
|
$ |
59,995 |
|
$ |
115,078 |
|
|
Alfred V. Tobia, Jr. (4) |
|
$ |
8,625 |
|
$ |
59,991 |
|
$ |
68,616 |
|
(1) Each of the independent directors was granted shares of restricted stock in 2016 with a grant date fair value of $60,000 (rounded down to the nearest whole share), computed in accordance with FASB ASC Topic 718. For a discussion of valuation assumptions, see note
H of our audited financial statements for the fiscal year ended December 31, 2017 included in the Original Filing. Restricted stock awards are granted without consideration and vest in three equal annual installments beginning the first anniversary of the date of grant.
(2) Mr. Carley retired from the Board July 18, 2018; Mr. Carley’s unvested restricted stock was forfeited in connection with his retirement.
(3) Elected to receive 75% of all fees in the form of stock.
(4) Elected to receive all fees in the form of stock.
Equity Awards Outstanding at Year End
The following table shows the number of outstanding equity awards held by our non-employee directors as of December 31, 2017; none of our non-employee directors held stock options.
|
Name |
|
Number of Outstanding |
|
Total (#) |
|
|
David L. Copeland |
|
7,930 |
|
7,930 |
|
|
William F. Farley |
|
7,930 |
|
7,930 |
|
|
Christopher M. Harte |
|
12,784 |
|
12,784 |
|
|
Melvin L. Keating |
|
6,382 |
|
6,382 |
|
|
Scott C. Key |
|
7,930 |
|
7,930 |
|
|
Judy C. Odom |
|
7,930 |
|
7,930 |
|
|
Alfred V. Tobia Jr. |
|
6,382 |
|
6,382 |
|
ITEM 12. SECURITY OWNERSHIP OF CERTAIN BENEFICIAL OWNERS AND MANAGEMENT AND RELATED STOCKHOLDER MATTERS
Equity Compensation Plan Information at Year-End 2017
The following table provides information as of the end of 2017 regarding total shares subject to outstanding stock options and rights and total additional shares available for issuance under our 2013 Plan and 2005 Omnibus Incentive Plan (“2005 Plan”), as well as the inducement awards granted to Ms. Puckett and Messrs. Biro, Grillo and Lal in connection with their hiring:
|
Plan Category |
|
Number of securities to be |
|
Weighted-average exercise |
|
Number of securities |
| |
|
Equity compensation plans approved by security holders |
|
407,066 |
|
$ |
86.54 |
|
82,083 |
|
|
Equity compensation plans not approved by security holders (4) |
|
219,738 |
|
$ |
30.82 |
|
0 |
|
|
Total |
|
626,804 |
|
$ |
60.80 |
|
82,083 |
|
(1) Consisting of outstanding options, restricted stock units and stock-denominated performance units.
(2) The weighted-average exercise price does not take into account any shares issuable upon vesting of outstanding restricted stock or performance restricted stock units, which have no exercise price.
(3) Represents shares available under our 2013 Plan; shares available for issuance under our 2013 Plan may be issued pursuant to stock options, restricted stock, performance restricted stock units, common stock and other awards that may be established pursuant to the 2013 Plan. No new options or securities may be granted under the 2005 Plan.
(4) Consists of inducement awards made to Ms. Puckett and Messrs. Biro, Grillo and Lal in connection with their employment; the terms of these grants are consistent with the 2013 Plan.
Beneficial Ownership
SECURITY OWNERSHIP OF MANAGEMENT AND PRINCIPAL STOCKHOLDERS
The following table sets forth the number of shares of our common stock beneficially owned by (1) our “named executive officers” included in the Summary Compensation Table above, (2) each current Harte Hanks director, (3) each person known by Harte Hanks to beneficially own more than 5% of the outstanding shares of our common stock, and (4) all current Harte Hanks directors and executive officers as a group. Except as otherwise noted, (a) the persons named in the table have sole voting and investment power with respect to all shares beneficially owned by them, and (b) ownership is as of April 20, 2018, when 6,254,276 shares of our common stock were outstanding.
|
Name and Address of Beneficial Owner (1) |
|
Number of Shares |
|
Percent of |
|
|
Named Executive Officers |
|
|
|
|
|
|
Karen A. Puckett (2) |
|
87,870 |
|
1.4 |
% |
|
Jon C. Biro |
|
0 |
|
* |
|
|
Robert L. R. Munden (3) |
|
32,251 |
|
* |
|
|
Frank M. Grillo (4) |
|
8,610 |
|
* |
|
|
Andrew P. Harrison (5) |
|
25,003 |
|
* |
|
|
Shirish R. Lal |
|
30,553 |
|
* |
|
|
Directors |
|
|
|
|
|
|
David L. Copeland (6) |
|
465,189 |
|
7.4 |
% |
|
William F. Farley (7) |
|
20,291 |
|
* |
|
|
Christopher M. Harte (8) |
|
121,507 |
|
1.9 |
% |
|
Melvin L. Keating |
|
272 |
|
* |
|
|
Scott C. Key |
|
11,507 |
|
* |
|
|
Judy C. Odom |
|
14,200 |
|
* |
|
|
Karen A. Puckett (2) |
|
87,870 |
|
1.4 |
% |
|
Alfred V. Tobia, Jr. (9) |
|
156,895 |
|
2.5 |
% |
|
Other Known 5% Holders |
|
|
|
|
|
|
Wipro, LLC (10) |
|
1,001,658 |
|
13.8 |
% |
|
Houston H. Harte (11) |
|
736,956 |
|
11.8 |
% |
|
Fondren Management LP (12) |
|
447,290 |
|
7.2 |
% |
|
Dimensional Fund Advisors, Inc. (13) |
|
339,487 |
|
5.4 |
% |
|
|
|
|
|
|
|
|
All Current Executive Officers and Directors as a Group (14 persons) (14) |
|
974,148 |
|
15.6 |
% |
* Less than 1%.
(1) The address of (a) Houston H. Harte is P.O. Box 17424, San Antonio, TX 78217, (b) Dimensional Fund Advisors, Inc. is 6300 Bee Cave Road, Building One, Austin, TX 78746, (c) Fondren Management LP is 1177 West Loop South, Suite 1625, Houston, Texas 770275, (d) Wipro LLC is 2 Tower Center Blvd, Suite 2200, East Brunswick, NJ 08816, and (e) each other beneficial owner is c/o Harte Hanks, Inc., 9601 McAllister Freeway, Suite 610, San Antonio, TX 78216.
(2) Includes 43,368 shares that may be acquired upon the exercise of options exercisable within the next 60 days.
(3) Includes 22,201 shares that may be acquired upon the exercise of options exercisable within the next 60 days.
(4) Includes 5,065 shares that may be acquired upon the exercise of options exercisable within the next 60 days.
(5) Includes 16,154 shares that may be acquired upon the exercise of options exercisable within the next 60 days.
(6) Includes the following shares to which Mr. Copeland disclaims beneficial ownership: (a) 3,800 shares held as custodian for unrelated minors, (b) 118,228 shares that are owned by various trusts for which he serves as trustee or co-trustee, (c) 306,246 shares owned by the Shelton Family Foundation, of which he is one of nine directors and an employee, and (d) 21,050 shares in an testamentary estate for which Mr Copeland is serving as sole executor.
(7) Includes (i) 12 shares owned indirectly by Mr. Farley via a trust in which his spouse is a beneficiary, as to which beneficial ownership is disclaimed, and (ii) 8,144 shares held in a trust for which Mr. Farley is a beneficiary.
(8) Includes 76,893 shares held by Spicewood Family Partners, Ltd., of which Mr. Harte is the sole member and manager of the limited liability company that is the sole general partner, with exclusive voting and dispositive power over all the partnership’s shares, and the following shares to which Mr. Harte disclaims beneficial ownership: (a) 30 shares held as custodian for Mr. Harte’s step-children and child, (b) 5,885 shares held by trusts for which Mr. Harte serves as trustee, and (c) 12,000 shares held by other trusts for which Mr. Harte serves as a co-trustee.
(9) 155,000 shares of Common Stock owned beneficially. (Mr. Tobia, as a Managing Partner of Sidus Investment Management, LLC, may be deemed to beneficially own (i) 25,555 shares of Common Stock owned directly by Sidus Investment Partners, L.P., (ii) 65,244 shares of Common Stock owned directly by Sidus Double Alpha Fund, L.P., (iii) 31,530 shares of Common Stock owned directly by Sidus Double Alpha, Ltd. and (iv) 32,669 shares of Common Stock held in a certain account managed by Sidus Investment Management, LLC.)
(10) Wipro, LLC owns 9,926 shares of Series A Convertible Preferred Stock, which shares are convertible into shares of the company’s common stock at Wipro, LLC’s election.
(11) 660,816 shares are held in the Harte Management Trust, as to which Houston H. Harte, Carolyn Harte and Sarah Harte share voting and dispositive power. 76,140 shares are beneficially owned by Larry D. Franklin, of which (i) 1,100 shares are held by the Franklin Family Foundation, of which Mr. Franklin is the President, and consequently has the sole power to vote and dispose (or direct the disposition) of such shares, and (ii) 75,040 shares are held by Mr. Franklin and his spouse as community property and as to which shares Mr. Franklin has the sole power to vote and dispose (or direct the disposition), subject to applicable community property laws. Information relating to this stockholder group is based on such group’s Schedule 13D/A filed with the SEC on March 5, 2018.
(12) Represents shares held by investment advisory clients of Dimensional Fund Advisors LP (“Dimensional”) for whom Dimensional serves as investment manager or sub-adviser to certain other commingled funds, group trusts and separate accounts (such investment companies, trusts and accounts, collectively referred to as the “Funds”). In its role as investment advisor, sub-adviser and/or manager, Dimensional or its subsidiaries possess sole voting power over 329,797 such shares and sole investment power over all such shares that are owned by the Funds, and may be deemed to be the beneficial owner of the shares of the Issuer held by the Funds. However, all securities reflected are owned by the Funds. Dimensional disclaims beneficial ownership of such securities. The Funds have the right to receive or the power to direct the receipt of dividends from, or the proceeds from the sale of the securities held in their respective accounts. To the knowledge of Dimensional, the interest of no one such Fund exceeds 5% of the company’s common stock. Information relating to this stockholder is based on the stockholder’s Schedule 13G, filed with the SEC on February 9, 2018.
(13) Includes 429,290 shares held by BLR Partners LP and 18,000 share held by the Radoff Family Foundation. Information relating to this stockholder is based on the stockholder’s Schedule 13D/A, filed with the SEC on February 15, 2018.
(14) Includes 89,505 shares that may be acquired upon the exercise of options exercisable within the next 60 days.
ITEM 13. CERTAIN RELATIONSHIPS AND RELATED TRANSACTIONS, AND DIRECTOR INDEPENDENCE
Independence of Directors
Questionnaires are used on an annual basis (or when a new director is added) to gather input to assist the Governance Committee and the Board in their determinations of the independence of the non-employee directors. Based on the foregoing and on such other due consideration and diligence as it deemed appropriate, the Governance Committee presented its 2017 findings to the Board on the independence of each of its non-employee directors, in each case in accordance with applicable federal securities laws and the rules of the NYSE. The Board determined that, other than in their capacity as directors, none of these non-employee directors had a material relationship with Harte Hanks, either directly or as a partner, stockholder or officer of an organization that has a relationship with Harte Hanks. The Board further determined that (i) each such non-employee director is otherwise independent under applicable NYSE listing standards for purposes of serving on the Board, the Audit Committee, the Compensation Committee and the Governance Committee, (ii) each such non-employee director satisfied the additional audit committee independence standards under Rule 10A-3 of the SEC and (iii) for purposes of serving on the Audit Committee, each such non-employee director is financially literate and, where applicable, certain of such directors are “audit committee financial experts” as such term is defined in the applicable SEC rules.
However, in April of 2017 (and subsequent to its usual 2017 independence determinations), the Board reconsidered Mr. Copeland’s independence due to his service as sole manager of the guarantor of the company’s credit facility with Texas Capital Bank (the “TCB Facility”). After a review, the Board determined such role as constituting a material relationship disqualifying his independence. Mr. Copeland promptly resigned from the Audit Committee and Compensation Committee in connection with the Board’s determination. For more information regarding the TCB Facility and the guarantee, please refer to the relevant description in our Current Report on Form 8-K filed with the SEC on April 21, 2017.
The Governance Committee likewise assessed the independence of Messrs. Keating and Tobia when they joined the Board in July 2017, using the same standards and process it applies to incumbents as described above. The Board determined that, other than in their capacity as directors, neither of these new non-employee directors had a material relationship with Harte Hanks, either directly or as a partner, stockholder or officer of an organization that has a relationship with Harte Hanks. The Board further determined that (i) Messrs. Keating and Tobia are independent under applicable NYSE listing standards for purposes of serving on the Board, the Audit Committee, the Compensation Committee and the Governance Committee, (ii) Messrs. Keating and Tobia satisfied the additional audit committee independence standards under Rule 10A-3 of the SEC and (iii) for purposes of serving on the Audit Committee, Messrs. Keating and Tobia are financially literate and Mr. Keating qualified as an “audit committee financial expert” as such term is defined in the applicable SEC rules.
When assessing the materiality of a director’s relationship with us, if any, the Board considers all known relevant facts and circumstances, not merely from the director’s standpoint, but from that of the persons or organizations with which the director has an affiliation, the frequency or regularity of the services, whether the services are being carried out at arm’s length in the ordinary course of business and whether the services are being provided substantially on the same terms to us as those prevailing at the time from unrelated parties for comparable transactions. Material relationships can include commercial, banking, industrial, consulting, legal, accounting, charitable and familial relationships.
In making its initial independence determinations in early 2017, the Board considered the following matters with respect to Mr. Copeland, and determined that they did not constitute material relationships with Harte Hanks or otherwise impair his independence as a director or a member any of its committees, including the Audit Committee:
· As previously disclosed in our 2017 proxy statement, Mr. Copeland’s son is a member of the transaction services group of KPMG LLP, the independent registered public accounting firm we used in 2015 and prior fiscal years. This issue was previously reviewed and discussed by the Board in connection with assessing the continued independence of Mr. Copeland. This review process included discussing with KPMG the nature of its transaction services group and whether there was any relation to KPMG’s audit or tax compliance groups. As a result of this diligence and discussions with KPMG, it was determined that KPMG’s transaction services group is a separate and distinct group from KPMG’s audit and tax compliance practice groups. Accordingly, based on the nature of the services provided by the transaction services group and the fact that Harte Hanks has not purchased such transaction services from KPMG, this matter was not deemed to constitute a material relationship with Harte Hanks. We selected Deloitte & Touche LLP as our independent registered public accounting firm for 2016 and 2017.
· As disclosed in our 2017 proxy statement and further in this Amendment No. 1, in accordance with SEC rules, Mr. Copeland has reported, but disclaimed, “beneficial ownership” of approximately 7.4% of the outstanding shares of our common stock that are owned by (1) various trusts for which Mr. Copeland serves as trustee or co-trustee, (2) a limited partnership of which he is an officer of the general partner, and (3) the Shelton Family Foundation, of which he is one of nine directors and an employee. Based on the nature of Mr. Copeland’s role with these entities, his absence of any pecuniary interest in these shares and his disclaimer of any beneficial ownership in these shares, this matter is not deemed to constitute a material relationship with Harte Hanks.
Certain Relationships and Related Transactions
The Board has adopted certain policies and procedures relating to its review, approval or ratification of any transaction in which Harte Hanks is a participant and that is required to be reported by the SEC’s rules and regulations regarding transactions with related persons. As set forth in the Governance Committee’s charter, except
for matters delegated by the Board to the Audit Committee, all proposed related transactions and conflicts of interest should be presented to the Governance Committee for its consideration. If required by law, NYSE rules or SEC regulations, such transactions must obtain Governance Committee approval. In reviewing any such transactions and potential transactions, the Governance Committee may take into account a variety of factors that it deems appropriate, which may include, for example, whether the transaction is on terms comparable to those that could be obtained in arm’s length dealings with an unrelated third party, the value and materiality of such transaction, any affiliate transaction restrictions that may be included in our debt agreements, any impact on the Board’s evaluation of a non-employee director’s independence or on such director’s eligibility to serve on one of the Board’s committees and any required public disclosures by Harte Hanks.
ITEM 14. PRINCIPAL ACCOUNTANT FEES AND SERVICES
Report of the Audit Committee
The Audit Committee has the authority and responsibility to select, determine the compensation of, evaluate and, when appropriate, replace the company’s independent registered public accounting firm (independent auditors). The Audit Committee is comprised of four directors, currently Messrs. Farley (Chair), Harte, Keating and Key. The Board has determined that (i) each of its members is independent under the standards of director independence established under our Corporate Governance Principles and the NYSE listing requirements, and is also independent under applicable federal securities laws, including Section 10A(m)(3) of the Exchange Act, and (ii) that Messrs. Farley and Keating qualify as an audit committee financial expert under applicable federal securities laws.
The Audit Committee meets with management periodically to consider the scope and adequacy of the company’s internal controls and the objectivity of its financial reporting and discusses these matters with the company’s independent registered public accounting firm (or “independent auditors”), the company’s internal auditors and appropriate company financial personnel. The Audit Committee also meets privately with the company’s independent auditors, and the company’s internal auditors. The company’s independent auditors and its internal auditors have unrestricted access to the Audit Committee and can meet with the Audit Committee upon request. In addition, the Audit Committee reviews the company’s financial statements and reports its recommendations to the full Board as required for approval and to authorize action.
Management is responsible for the financial reporting process, including the system of internal controls, for the preparation of consolidated financial statements in accordance with GAAP and for the report on the company’s internal control over financial reporting. The company’s independent auditors are responsible for auditing those financial statements and expressing an opinion as to their conformity with GAAP. The Audit Committee’s responsibility is to oversee and review the financial reporting process and to review and discuss management’s report on the company’s internal control over financial reporting.
The Audit Committee reviewed and discussed (i) the company’s compliance with Section 404 of the Sarbanes-Oxley Act of 2002, including the Public Company Accounting Oversight Board’s (PCAOB) Auditing Standard No. 5 regarding the audit of internal control over financial reporting, (ii) the company’s guidelines, policies and procedures for financial risk assessment and management and the major financial risk exposures of the company and its business units, as appropriate, (iii) the audited consolidated financial statements for the fiscal year ended December 31, 2017 (and the audit related thereto) with management, the company’s internal auditors and Deloitte & Touche LLP (“Deloitte”), and (iv) with management, the company’s internal auditors and Deloitte, management’s annual report on the company’s internal control over financial reporting and Deloitte’s audit report.
The Audit Committee has also discussed with Deloitte (and as appropriate KPMG LLP (“KPMG”), the company’s independent auditor for 2015 and prior periods), all matters that the independent registered public accounting firm was required to communicate and discuss with the audit committee, including the matters required to be discussed by Auditing Standard No. 1301 (Communications with Audit Committees) as adopted by the PCAOB.
Deloitte provided to the Audit Committee the written disclosures and the letter provided by applicable requirements of the PCAOB concerning independence. The Audit Committee discussed with Deloitte its independence from the company. When considering Deloitte’s independence, the Audit Committee reviewed the services Deloitte provided to the company that were not in connection with its audit of the company’s consolidated financial statements. These services included reviews of the company’s interim condensed consolidated financial statements included in its Quarterly Reports on Form 10-Q. The Audit Committee also reviewed the audit, audit-
related and tax services performed by, and the amount of fees paid for such services to, Deloitte. In addition, when considering Deloitte’s independence, the Audit Committee considered any fees received by the company from Deloitte.
Based on these activities, the Audit Committee recommended to the Board that the company’s audited consolidated financial statements for the fiscal year ended December 31, 2017 be included in its Annual Report on Form 10-K.
|
|
Audit Committee |
|
|
William F. Farley, Chair |
|
|
Christopher M. Harte |
|
|
Melvin L. Keating |
|
|
Scott C. Key |
Independent Auditor Fees and Services
The following table sets forth the aggregate fees billed by our independent auditors or fees payable for professional services in or related to 2016 and 2017.
|
|
|
2016 |
|
2017 |
| ||
|
Audit Fees (1) |
|
$ |
2,000,000 |
|
$ |
1,600,000 |
|
|
Audit-Related Fees (2) |
|
17,500 |
|
0 |
| ||
|
Tax Fees (relating to state, federal and international tax matters) |
|
171,226 |
|
66,686 |
| ||
|
All Other Fees |
|
2,132 |
|
1,875 |
| ||
|
Total |
|
$ |
2,190,858 |
|
$ |
1,668,561 |
|
(1) Fees for the annual financial statement audit, quarterly financial statement reviews and audit of internal control over financial reporting.
(2) Includes fees for assurance and related services other than those included in Audit Fees. Includes charges for statutory audits of certain of the company’s foreign subsidiaries required by countries in which they are domiciled in 2016 and 2017.
Pre-Approval for Non-Audit Services
Pursuant to its charter, the Audit Committee pre-approves all permitted non-audit services to be performed for Harte Hanks by its independent auditors. The Audit Committee may form and delegate authority to subcommittees consisting of one or more members when appropriate, including the authority to grant preapprovals of non-audit services, provided that such subcommittee’s preapproval decisions are presented to the full Audit Committee at its next scheduled meeting.
EXHIBITS AND FINANCIAL STATEMENT SCHEDULES
15(a)(1)
Financial Statements
The information required by this item is set forth in Part IV, Item 15(a)(1) of the Original Filing.
15(a)(2)
Financial Statement Schedules
The information required by this item is set forth in Part IV, Item 15(a)(2) of the Original Filing.
15(a)(3)
Exhibits
The Exhibit Index lists the exhibits that are filed or furnished, as applicable, as part of this Form 10-K/A.
INDEX TO EXHIBITS
We are incorporating certain exhibits listed below by reference to other Harte Hanks filings with the Securities and Exchange Commission, which we have identified in parentheses after each applicable exhibit.
|
Exhibit No. |
|
Description of Exhibit |
|
|
|
|
|
Acquisition and Dispositions | ||
|
| ||
|
2.1 |
|
|
|
|
|
|
|
2.2 |
|
|
|
|
|
|
|
2.3 |
|
|
|
|
|
|
|
2.4 |
|
|
|
|
|
|
|
2.5 |
|
|
|
|
|
|
|
2.6 |
|
|
Charter Documents
|
|
|
|
|
3(a) |
|
|
|
|
|
|
|
3(b) |
|
|
|
|
|
|
|
3(c) |
|
|
|
|
|
|
|
3(d) |
|
Credit Agreements
|
|
|
|
|
|
10.1(a) |
|
| |
|
|
|
|
|
|
10.1(b) |
|
| |
|
|
|
|
|
|
10.1(c) |
|
| |
|
|
|
|
|
|
10.1(d) |
|
| |
|
|
|
|
|
|
10.1(e) |
|
| |
|
|
|
|
|
|
10.1(f) |
|
| |
|
|
|
|
|
|
10.1(g) |
|
| |
|
|
|
| |
|
10.1(h) |
|
||
|
|
|
| |
|
10.1(i) |
|
||
Management and Director Compensatory Plans and Forms of Award Agreements
|
|
|
|
|
10.2(a) |
|
|
|
|
|
|
|
10.2(b) |
|
|
|
|
|
|
|
10.2(c) |
|
|
|
|
|
|
|
10.2(d) |
|
|
|
|
|
|
|
10.2(e) |
|
|
|
|
|
|
|
10.2(f) |
|
|
|
|
|
|
|
10.2(g) |
|
|
10.2(h) |
|
|
|
|
|
|
|
10.2(i) |
|
|
|
|
|
|
|
10.2(j) |
|
|
|
|
|
|
|
10.2(k) |
|
|
|
|
|
|
|
10.2(l) |
|
|
|
|
|
|
|
10.2(m) |
|
|
|
|
|
|
|
10.2(n) |
|
|
|
|
|
|
|
10.2(o) |
|
|
|
|
|
|
|
10.2(p) |
|
|
|
|
|
|
|
10.2(q) |
|
|
|
|
|
|
|
10.2(r) |
|
|
|
|
|
|
|
10.2(s) |
|
|
|
|
|
|
|
10.2(t) |
|
|
|
|
|
|
|
10.2(u) |
|
|
|
|
|
|
|
10.2(v) |
|
|
|
|
|
|
|
10.2(w) |
|
|
|
|
|
|
|
10.2(x) |
|
|
|
|
|
|
|
10.2(y) |
|
|
|
|
|
|
|
10.2(z) |
|
Executive Officer Employment-Related and Separation Agreements
|
|
|
|
|
10.3(a) |
|
|
|
|
|
|
|
10.3(b) |
|
|
|
|
|
|
|
10.3 (c) |
|
|
|
|
|
|
|
10.3 (d) |
|
|
|
|
|
|
|
10.3 (e) |
|
|
|
|
|
|
|
10.3 (f) |
|
|
|
|
|
|
|
10.3 (g) |
|
|
|
|
|
|
|
10.3 (h) |
|
|
|
|
|
|
|
10.3(i) |
|
|
|
|
|
|
|
10.3(j) |
|
|
|
|
|
|
|
10.3(k) |
|
|
|
|
|
|
|
10.3(l) |
|
|
|
|
|
|
|
10.3(m) |
|
|
|
|
|
|
|
10.3(n) |
|
|
|
|
|
|
|
10.3(o) |
|
|
|
|
|
|
|
10.3(p) |
|
|
|
|
|
|
|
10.3(q) |
|
Material Agreements
|
|
|
|
|
10.4(a) |
|
Other Exhibits
*Filed or furnished herewith, as applicable
† Filed or furnished with the Original Filing, as applicable
Pursuant to the requirements of Section 13 or 15(d) of the Securities Exchange Act of 1934, Harte Hanks, Inc. has duly caused this report to be signed on its behalf by the undersigned, thereunto duly authorized.
|
HARTE HANKS, INC. |
| |
|
|
| |
|
By: |
/s/ Karen A. Puckett |
|
|
|
Karen A. Puckett |
|
|
|
President and Chief Executive Officer |
|
|
|
|
|
|
Date: |
April 30, 2018 |
|
|
By: |
/s/ Jon C. Biro |
|
|
|
Jon C. Biro |
|
|
|
Executive Vice President and Chief Financial Officer |
|
|
|
|
|
|
Date: |
April 30, 2018 |
|