Attached files
| file | filename |
|---|---|
| 8-K - 8-K - CTS CORP | q12018investorpresentation.htm |

April 2018
April 2018

Safe Harbor Statement
This presentation contains statements that are, or may be deemed to be, forward-looking statements within the
meaning of the Private Securities Litigation Reform Act of 1995. These forward-looking statements include, but
are not limited to, any financial or other guidance, statements that reflect our current expectations concerning
future results and events, and any other statements that are not based solely on historical fact. Forward-looking
statements are based on management's expectations, certain assumptions and currently available information.
Readers are cautioned not to place undue reliance on these forward-looking statements, which speak only as of
the date hereof and are based on various assumptions as to future events, the occurrence of which necessarily
are subject to uncertainties. These forward-looking statements are made subject to certain risks, uncertainties
and other factors, which could cause our actual results, performance or achievements to differ materially from
those presented in the forward-looking statements. Examples of factors that may affect future operating results
and financial condition include, but are not limited to: changes in the economy generally and in respect to the
businesses in which CTS operates; unanticipated issues in integrating acquisitions; the results of actions to
reposition our businesses; rapid technological change; general market conditions in the automotive,
communications, and computer industries, as well as conditions in the industrial, defense and aerospace, and
medical markets; reliance on key customers; unanticipated natural disasters or other events; the ability to protect
our intellectual property; pricing pressures and demand for our products; unanticipated developments that could
occur with respect to contingencies such as litigation and environmental matters as well as any product liability
claims; and risks associated with our international operations, including trade and tariff barriers, exchange rates
and political and geopolitical risks. Many of these, and other, risks and uncertainties are discussed in further detail
in Item 1A. of CTS’ Annual Report on Form 10-K. We undertake no obligation to publicly update our forward-
looking statements to reflect new information or events or circumstances that arise after the date hereof,
including market or industry changes.
2

2017 Sales: $423 Million
Sales by Market:
▪ Transportation – 65%
▪ Industrial – 18%
▪ Medical – 9%
▪ Aero & Defense – 4%
▪ Telecom & IT – 4%
Sales by Region:
▪ Americas – 54%
▪ Asia – 31%
▪ Europe – 15%
Our Company
Ticker: CTS (NYSE)
Founded: 1896
Business: CTS is a leading designer
and manufacturer of sensors,
actuators and electronic components.
Locations: 15 manufacturing locations
throughout North America, Asia and
Europe.
Number of Employees: ~3,200
Globally
Note: Sales by market and region based on trailing twelve months
sales as of March 31, 2018
3

Our History - 120 Years of Innovation
4

Our Vision and Value Proposition
We aim to be a leading provider of sensing and motion devices as well as
connectivity components, enabling an intelligent and seamless world.
5

Product Applications in Transportation
Engine Efficiency
▪ Accelerator Pedal Module
▪ Current Sensor
▪ Gear Position Sensor
▪ Throttle Position Sensor
▪ Turbo Actuator
▪ Turbo Position Sensor
▪ Variable Valve Lift Sensor
Key Customers
6
Fuel Handling
▪ Contacting Fuel Level Card
Chassis / Driveline
▪ Brake Pedal Sensor
▪ Chassis Height Sensor
▪ Transmission Speed
Sensor
▪ Transmission Range
Sensor
▪ Wheel Speed Sensor
Occupant Safety
▪ Seat Belt Buckle Switch
▪ Seat Belt Tension Sensor
▪ Seat Track Position Sensor
Exhaust Management /
Aftertreatment
▪ EGR Position Sensor
▪ DPF RF SensorAutonomous Drive
▪ PLL Module

Key Customers
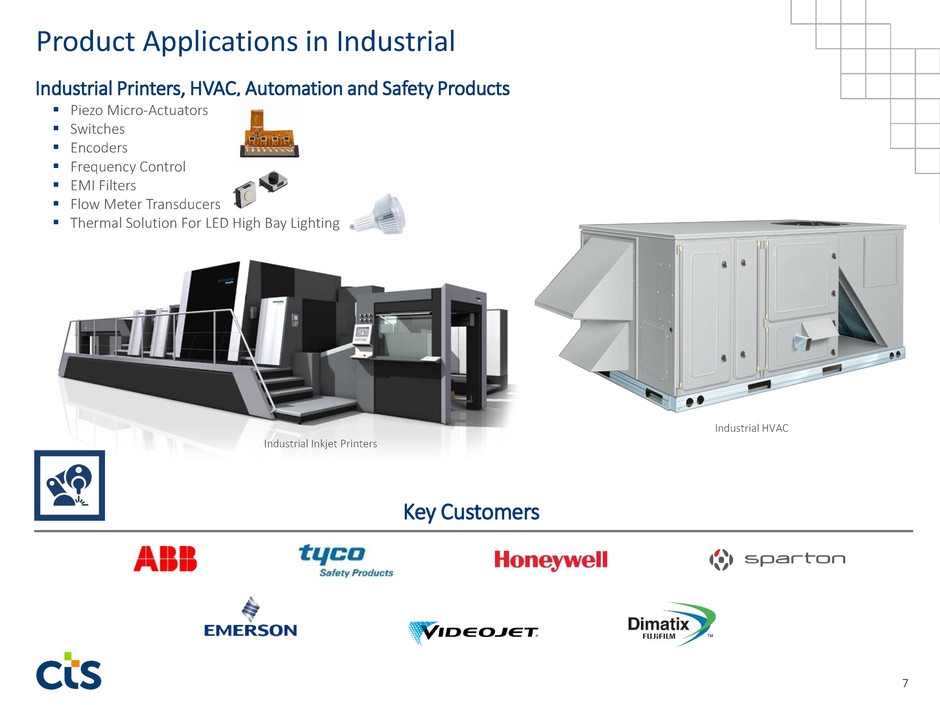
Industrial Printers, HVAC, Automation and Safety Products
▪ Piezo Micro-Actuators
▪ Switches
▪ Encoders
▪ Frequency Control
▪ EMI Filters
▪ Flow Meter Transducers
▪ Thermal Solution For LED High Bay Lighting
Product Applications in Industrial
7
Industrial Inkjet Printers
Industrial HVAC

Product Applications in Medical
Key Customers
Ultrasound / IVUS, Infusion Pumps, CPAPs and other medical devices
▪ Single Crystal Piezo
▪ Bulk Piezo
▪ Encoders
▪ Frequency Control
▪ Piezo Micro-Valves
▪ Switches
▪ Joysticks
8
Infusion Pumps
CPAP Machines
Ultrasound Equipment
Dental Equipment

Key Customers
Military Sonar and Communication Products
▪ Piezo Hydrophones
▪ Piezo Sonar Arrays
▪ Frequency Control
▪ EMI Filters
Product Applications in Aero & Defense
9
Unmanned Aerial
Vehicles (UAV)
Maritime Applications

Communications Products
▪ RF Filters
▪ EMI/RFI Filters
▪ Frequency Control
▪ Timing Modules
▪ Thermal Products
▪ Multilayer Piezo
▪ Bulk Piezo
Product Applications in Telecom & IT
10
Key Customers
Macro Cell Base Stations
Small Cell Base Stations
Mobile Devices
Backhaul CommunicationsWireless Infrastructure
Wireline Infrastructure

Positioning for Growth with Fundamental Market Trends
11
Autonomous
Vehicle
SMART
Smart Home/
Building
Unmanned
Aerial Vehicles
(Drones)
Improved
Medical
Diagnosis
Fuel Efficiency/
Vehicle
Electrification
Miniaturization
Energy
Harvesting
EFFICIENT
Green Buildings
Diagnos
Remote
Monitoring
Industry 4.0
Internet of
Things
5G & Small
Cells
CONNECTED
Elec ifi io
Communications
Information
Technology
Transportation
IndustrialMedical
Defense &
Aerospace
Moni or
5G mall
emote

CTS Addressable Markets Expected to Grow Mid-Single Digits
12
▪ Hydrophones for sonar applications
▪ Military communication
Organic Growth Drivers
▪ 100GB & 400GB wireline networks
▪ Small cell deployment
▪ Security and haptics for mobile devices
▪ 3D and textile printing
▪ New products for industrial controls
▪ Actuators for harsh environments
▪ RF Sensing for particulate filters
▪ Autonomous drive
▪ Medical 3D/4D ultrasound
▪ HMI control for medical devices
▪ Wireless pacemakers
Aero & Defense
Telecom & IT
Industrial
Transportation
Market
Medical
SAM in $ Billions
$2.9
$1.1
$0.9
$0.3
$1.1

Organic Growth
13
Investments to Grow
Technologies and Products that
Sense, Connect and Move
Total Booked Business
Note: Total Booked Business represents open purchase orders, contractual commitments, and the total expected lifetime revenue from business
awarded to CTS in multi-year platform awards.
($ Millions)
Dec 2017 Mar 2018
$351
$1,762
Expected to ship in 2018
▪ Improve Customer Intimacy
▪ R&D Investments at ~6% of Sales
▪ Enhance Sales Force Capabilities
▪ Improvements to Cost Structure
▪ Continuous Improvement
$1,737
$295

Targeted Acquisitions
14
Disciplined approach to acquisitions:
▪ Returns in excess of cost of capital
▪ Accretive to earnings
▪ Maintain balance sheet strength
▪ Synergy opportunities
▪ Targeting 10% growth (both inorganic and organic)
Expand
Product
Range
Broaden
Geographic
Reach
Enhance
Technology
Portfolio
Strengthen
Customer
Relationships

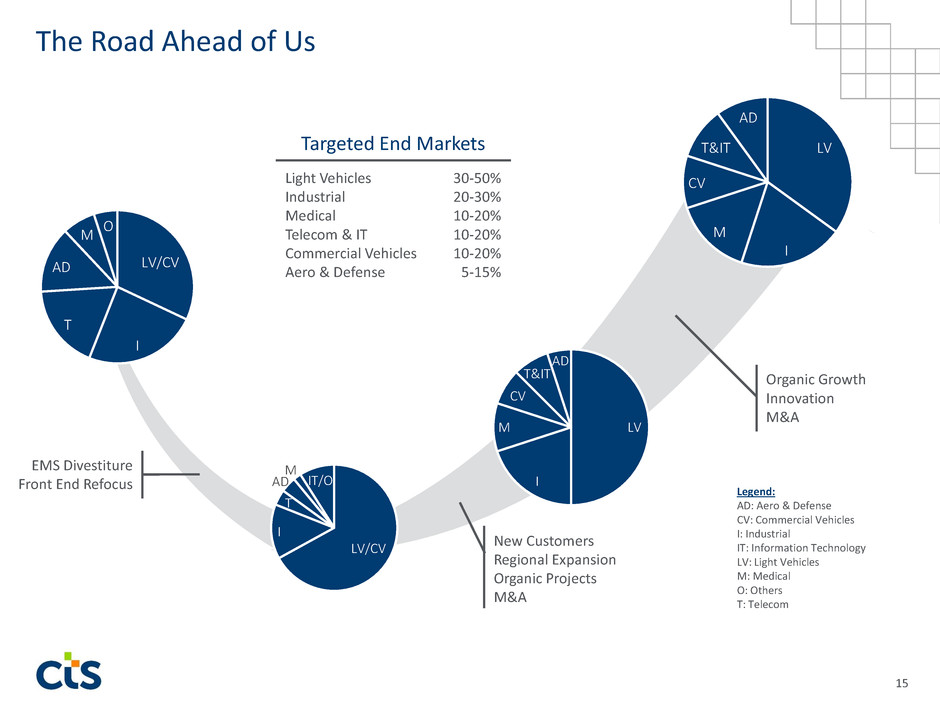
The Road Ahead of Us
LV
I
M
CV
T&IT
AD
LV/CV
I
T
AD
M
IT/O
LV
I
M
CV
T&IT
AD
30-50%
20-30%
10-20%
10-20%
10-20%
5-15%
Targeted End Markets
Light Vehicles
Industrial
Medical
Telecom & IT
Commercial Vehicles
Aero & Defense
EMS Divestiture
Front End Refocus
New Customers
Regional Expansion
Organic Projects
M&A
Legend:
AD: Aero & Defense
CV: Commercial Vehicles
I: Industrial
IT: Information Technology
LV: Light Vehicles
M: Medical
O: Others
T: Telecom
Organic Growth
Innovation
M&A
LV/CV
I
T
AD
M
O
15

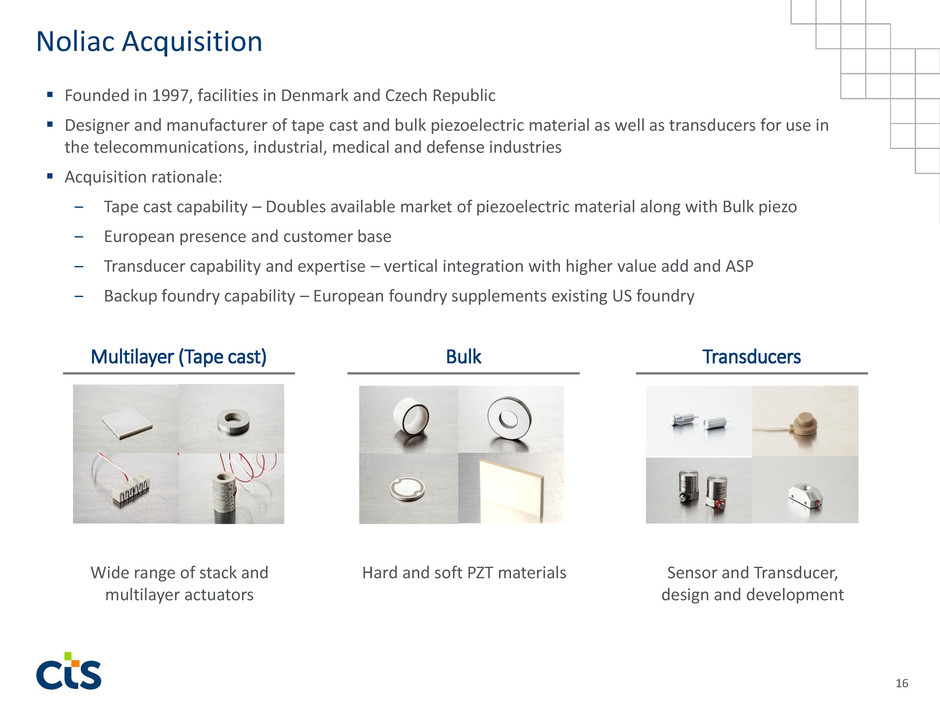
Noliac Acquisition
Multilayer (Tape cast)
▪ Founded in 1997, facilities in Denmark and Czech Republic
▪ Designer and manufacturer of tape cast and bulk piezoelectric material as well as transducers for use in
the telecommunications, industrial, medical and defense industries
▪ Acquisition rationale:
‒ Tape cast capability – Doubles available market of piezoelectric material along with Bulk piezo
‒ European presence and customer base
‒ Transducer capability and expertise – vertical integration with higher value add and ASP
‒ Backup foundry capability – European foundry supplements existing US foundry
Wide range of stack and
multilayer actuators
16
Bulk
Hard and soft PZT materials
Transducers
Sensor and Transducer,
design and development

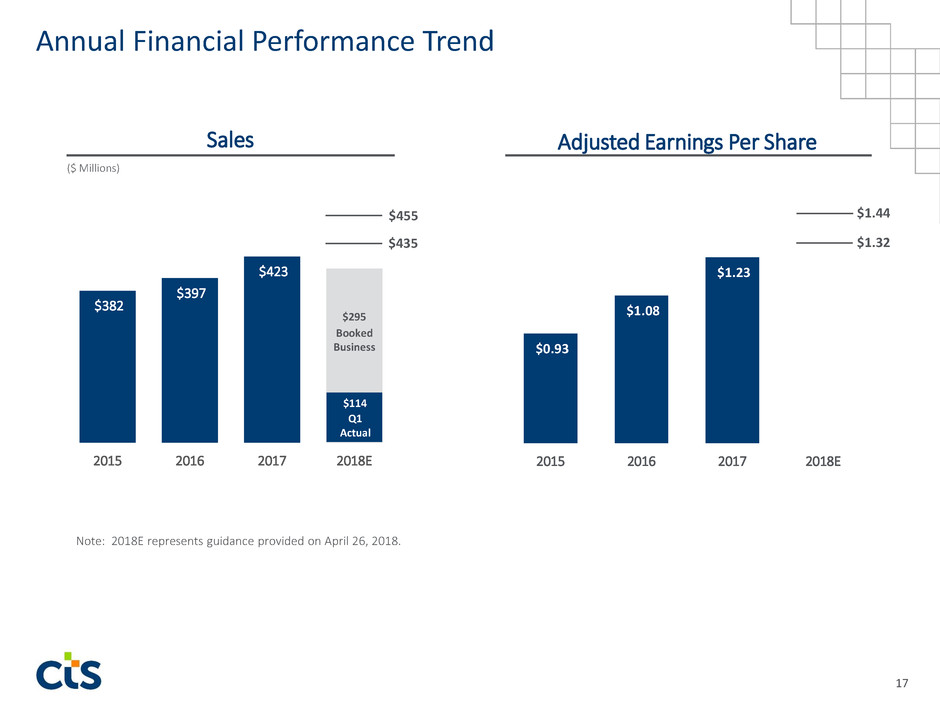
$382
$397
$423
2015 2016 2017 2018E
Sales
$0.93
$1.08
$1.23
2015 2016 2017 2018E
Adjusted Earnings Per Share
$455
Note: 2018E represents guidance provided on April 26, 2018.
Annual Financial Performance Trend
17
$435
$1.44
$1.32
($ Millions)
Q3 YTD
Actual
$0.84
Booked
Business
$295
Q1
Actual
$114

Equity
83%
Debt 17%
$157
$114 $114
$121
$91 $90
$76 $74
2015 2016 2017 Q1 2018
Note 1: Change in Cash/Debt in 2016 due to Single Crystal Acquisition
Note 2: Total available credit increased from $200M to $300M in 2Q 2016
Capital Structure
Cash and Debt
Net
Debt
$(66)
Current Capital Structure
DebtCash
$(24) $(38)
18
($ Millions)
$(47)

Capital Structure
Leverage = 1.0x - 2.5x EBITDA
Operating Cash Flow
Return Capital to
Shareholders
~4% of Sales*
20-40% of Free Cash Flow
12-14% of Sales
60-80% of
Free Cash Flow
Target Capital Deployment – Disciplined Approach
Growth
AcquisitionsInvestment
Dividends & Buybacks
19
*7-9% in 2018

Financial Framework
20
2012 2017
Long-Term
Target Range
Gross Margin 30.0% 34.3% 34-37%
SG&A Expense 20.7% 15.5% 13-15%
R&D Expense 6.9% 5.4% 5-7%
CapEx 2.6% 4.3% ~4%*
Targeting 10% Annual Growth (Organic + Inorganic)
*7-9% in 20181 Excludes the impact of the pension settlement charge recorded in Q4 2017 which reduced gross margin
by $4.8M or 1.1%, increased SG&A by $6.5M or 1.5%, and increased R&D by $2.1M or 0.5%.
1
1
1

Appendix
21

CTS Core Values
22

Financial Summary
Note 1: See Regulation G reconciliations from GAAP to Non-GAAP measures and adjustments.
Note 2: All figures are from continuing operations except for Adjusted Diluted EPS (As Reported),
Operating Cash Flow and Total Debt / Capitalization
($ Millions, except percentages and Adjusted Diluted EPS)
Net Sales
Adjusted Diluted EPS (As Reported)
Operating Cash Flow
Total Debt / Capitalization
Depreciation and Amortization
2015
$382.3
$0.93
$39.2
24.4%
$16.3
Adjusted EBITDA
Adjusted EBITDA % of Sales
$60.9
15.9%
2016
$396.7
$1.08
$47.2
22.1%
$19.0
$77.4
19.5%
23
Adjusted Gross Margin
Adjusted Gross Margin % of Sales
$127.1
33.2%
$140.4
35.4%
2017
$423.0
$1.23
$58.0
18.2%
$20.7
$80.0
18.9%
$145.2
34.3%
Q1 2018
$113.5
$0.34
$20.2
17.2%
$5.5
$20.8
18.4%
$38.4
33.9%

Regulation G Schedules
($ Millions, except percentages)
Adjusted Gross Margin
24
2018 2017 2017 2016 2015
Gross margin 38.4$ 34.2$ 140.4$ 140.4$ 127.1$
Adjustments to reported gross margin:
Pension settlement charge - - 4.8 - -
Adjusted gross margin 38.4$ 34.2$ 145.2$ 140.4$ 127.1$
Sales 113.5$ 100.2$ 423.0$ 396.7$ 382.3$
Adjusted gross margin as a % of sales 33.9% 34.2% 34.3% 35.4% 33.2%
Full YearQ1

Regulation G Schedules
($ Millions, except percentages)
Adjusted EBITDA
25
2018 2017 2017 2016 2015
Net earnings 11.5$ 8.5$ 14.4$ 34.4$ 7.0$
Depreciation and amortization expense 5.5 4.7 20.7 19.0 16.3
Interest expense 0.5 0.7 3.3 3.7 2.6
Tax expense 3.8 3.7 25.8 22.9 5.3
EBITDA 21.3 17.6 64.2 80.0 31.2
Adjustments to EBITDA:
Restructuring charges 1.2 0.8 4.1 3.0 15.2
Loss on sale-leaseback - - - 0.1 -
Loss (gain) on sale of facilities, net of expenses - - 0.7 (11.1) -
Non-recurring environmental charge - - - - 14.5
Pension settlement charge - 13.4 - -
Transaction costs and other one-time costs - - 0.5 0.8 -
Lease termination charge - - 0.1 0.8 -
Foreign currency (gain) loss (2.0) (0.4) (3.0) 3.8 -
Non-recurring costs of tax improvement initiatives 0.3 - - - -
Total adjustments to reported operating earnings (0.5) 0.4 15.8 (2.6) 29.7
Adjusted EBITDA 20.8$ 18.0$ 80.0$ 77.4$ 60.9$
Sales 113.5$ 100.2$ 423.0$ 396.7$ 382.3$
Adjusted EBITDA as a % of sales 18.4% 18.0% 18.9% 19.5% 15.9%
Full YearQ1

Regulation G Schedules
Adjusted Diluted EPS
($ Millions, except percentages)
Total Debt to Capitalization
26
2018 2017 2017 2016 2015
Diluted earnings per share 0.34$ 0.25$ 0.43$ 1.03$ 0.21$
Tax affected adjustments to reported diluted earnings per share:
Restructuring charges 0.03 0.02 0.08 0.06 0.40
Increase in valuation allowance and revaluation of deferred taxes as a
result of restructuring activities - - - 0.07 -
Loss (gain) on sale of facilities, net of expenses - - 0.01 (0.22) -
Non-recurring environmental charge - - - - 0.27
Pension settlement charge - - 0.26 - -
Transaction costs and other one-time costs - - 0.01 0.02 -
Lease termination charge - - - 0.02 -
Foreign currency (gain) loss (0.04) (0.01) (0.07) 0.09 -
Tax impact of cash repatriation - - - - 0.26
(Decrease) increase in recognition of valuation allowances - - (0.05) 0.03 0.10
Tax impact of non-recurring stock compensation charge - - - (0.02) -
Increase in reserve on uncertain tax benefits - - - - 0.17
Tax impact of U.S. tax reform - - 0.54 - -
Tax impact of other foreign taxes - - 0.02 - (0.48)
Non-recurring costs of tax improvement initiatives 0.01 - - - -
Adjusted diluted earnings per share 0.34$ 0.26$ 1.23$ 1.08$ 0.93$
Full YearQ1
2018 2017 2017 2016 2015
Total debt (A) 74.0$ 95.0$ 76.3$ 90.1$ 90.7$
Total shareholders' equity (B) 355.7$ 326.1$ 343.8$ 317.9$ 281.7$
Total capitalization (A+B) 429.7$ 421.1$ 420.1$ 408.0$ 372.4$
Total debt to capitalization 17.2% 22.6% 18.2% 22.1% 24.4%
As of December 31Q1
