Attached files
| file | filename |
|---|---|
| EX-99.1 - EXHIBIT 99.1 - BENCHMARK ELECTRONICS INC | ex991.htm |
| 8-K - FORM 8-K - BENCHMARK ELECTRONICS INC | form8k1.htm |
Exhibit 99.2

© 2018 Benchmark Electronics, Inc. Benchmark Electronics, Inc. Q1 2018 Earnings April 25, 2018
| 2 © 2018 Benchmark Electronics, Inc. Forward - Looking Statements This document contains forward - looking statements within the meaning of Section 27A of the Securities Act of 1933 and Section 21 E of the Securities Exchange Act of 1934. The words “expect,” “estimate,” “anticipate,” “predict” and similar expressions, and the n egatives thereof, often identify forward - looking statements, which are not limited to historical facts. Forward - looking statements inclu de, among other things: guidance for 2018 results; statements, express or implied, concerning future operating results or margins, the abi lity to generate sales and income or cash flow; and Benchmark’s business and growth strategies and expected growth and performance. Although Benchmark believes these statements are based upon reasonable assumptions, they involve risks and uncertainties relating to operations, markets and the business environment generally. If one or more of these risks or uncertai nties materializes, or underlying assumptions prove incorrect, actual outcomes may vary materially from those indicated. Readers are advised to consult further disclosures on these risks and uncertainties, particularly in Item 1A, “Risk Factors”, of the Comp any ’s Annual Report on Form 10 - K for the year ended December 31, 2017 and in its subsequent filings with the Securities and Exchange Commission. All forward - looking statements included in this document are based upon information available to the Company as of the date of this document, and it assumes no obligation to update them. Non - GAAP Financial Information This document includes certain financial measures that exclude items and therefore are not in accordance with U.S. generally accepted accounting principles (“GAAP”). A detailed reconciliation between GAAP results and results excluding special items (“n on - GAAP”) is included in the Appendix of this document. Management discloses non - GAAP information to provide investors with additional information to analyze the Company’s performance and underlying trends. Management uses non - GAAP measures that exclude certain items in order to better assess operating performance and help investors compare results with our previous guidance. This document also references “free cash flow”, which the Company defines as cash flow from operations less additions to property, plant and equipment and purchased software. The Company’s non - GAAP information is not necessarily comparable to the non - GAAP information used by other companies. Non - GAAP information should not be viewed as a substitute for, or superior to, net income or other data prepared in accordance with GAAP as a measure of the Company’s profitability or liquidity. Readers should consider the types of events and transactions for which adjustments have been made.

| 3 © 2018 Benchmark Electronics, Inc. Implementation of ASC 606 – Revenue from Contracts with Customers Effective January 1, 2018, the Company implemented ASC 606 the accounting standard governing “Revenue from Contracts with Customers” using the full retrospective transition method. Under ASC 606, revenue is recognized as or when the customer obta ins control of the goods or services promised in a contract. Given the nature of the terms and conditions in substantially all o f t he Company’s customer contracts, the Company now recognizes revenue over time (beginning at work - in - process (“WIP”)) for the majori ty of its contracts. This is a change in the timing of revenue recognition from a historical perspective. The effect of impleme nti ng ASC 606, is a reduction in revenue by less than $500K for Q1 2018 . All historical financial information represented in this presentation have been adjusted to reflect the retrospective implementation of ASC 606. As part of ASC 606, we are also required to reclassify finished goods and WIP meeting “the over time criteria” from inventory to a new line item called contract assets on the face of the balance sheet. Contract assets are defined as the Company’s right to cons ide ration for work completed but not billed.

| 4 © 2018 Benchmark Electronics, Inc. CEO Update

© 2018 Benchmark Electronics, Inc. | 5 First Quarter 2018 Summary O perational p erformance ► Revenue and non - GAAP EPS exceeded the high end of Q1 guidance ► Year - over - year revenue growth of 9% driven by higher - value markets ► Non - GAAP gross margins expanded for the quarter to 9.5% ► Delivered $0.41 non - GAAP EPS for the quarter Working capital ► Cash conversion cycle of 68 days ending Q1 ► At the low end of the target range of 73 to 68 days Cash flow and improving ROIC ► Operating cash flow of $25 million in the quarter ► ROIC of 11.2%, up 90 bps quarter - over - quarter and 230 bps year - over - year
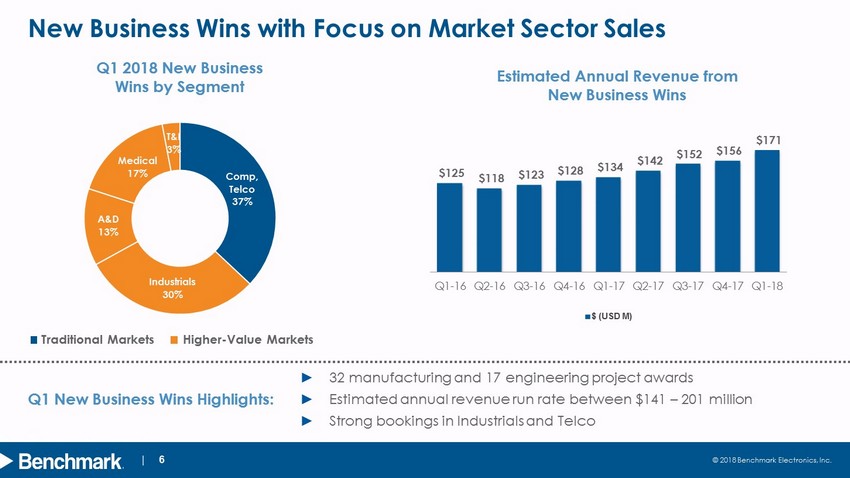
© 2018 Benchmark Electronics, Inc. | 6 New Business Wins with Focus on Market Sector Sales Q1 2018 New Business Wins by Segment Estimated Annual Revenue from New Business Wins Comp, Telco 37% Industrials 30% A&D 13% Medical 17% T&I 3% Traditional Markets Higher - Value Markets ► 32 manufacturing and 17 engineering project awards ► Estimated annual revenue run rate between $141 – 201 million ► Strong bookings in Industrials and Telco Q1 New Business Wins Highlights: $125 $118 $123 $128 $134 $142 $152 $156 $171 $- $10 $20 $30 $40 $50 $60 $70 $80 $90 $100 $110 $120 $130 $140 $150 $160 $170 $180 $190 Q1-16 Q2-16 Q3-16 Q4-16 Q1-17 Q2-17 Q3-17 Q4-17 Q1-18 $ (USD M)

© 2018 Benchmark Electronics, Inc. | 7 2018 Optimization Year: Leverage Investments Extend value proposition for customers ► Expanding microelectronics ► Investing in RF components ► Developing high - speed circuits Expand engineering and technology investments ► Defense solutions ► RF module design ► Surveillance systems ► IoT front - end architecture Elevate operational execution ► Lean and Six S igma ► Standard processes ► Equipment and tools

© 2018 Benchmark Electronics, Inc. | 8 Q2 Guidance – Convergence of Timing Dynamics Impacting Financials * The above guidance excludes the impact of amortization of intangible assets and estimated restructuring charges Guidance Net Sales (in millions) $590 – $630 Diluted EPS – non - GAAP* $0.26 – $0.34 ► Mix shifts primarily in the Medical sector due to product transition timing ► New customer ramp headwinds impacting execution ► Planned investments in engineering and solutions
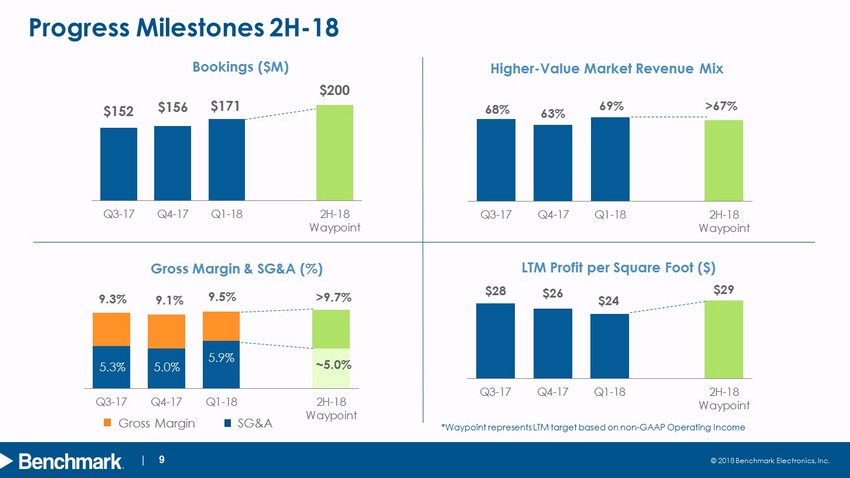
© 2018 Benchmark Electronics, Inc. | 9 $152 $156 $171 $200 Q3-17 Q4-17 Q1-18 2H-18 Waypoint 68% 63% 69% >67 % 0% 10% 20% 30% 40% 50% 60% 70% 80% 90% 100% Q3-17 Q4-17 Q1-18 2H-18 Waypoint $28 $26 $24 $29 $- $5 $10 $15 $20 $25 $30 $35 $40 $45 Q3-17 Q4-17 Q1-18 2H-18 Waypoint 5.3% 5.0% 5.9% ~5.0 % 9.3% 9.1% 9.5% >9.7 % 0.0% 2.0% 4.0% 6.0% 8.0% 10.0% 12.0% 14.0% Q3-17 Q4-17 Q1-18 2H-18 Waypoint Progress Milestones 2H - 18 LTM Profit per Square Foot ( $ ) Gross Margin & SG&A (%) Higher - Value Market Revenue Mix Bookings ($ M ) Gross Margin SG&A * Waypoint represents LTM target based on non - GAAP Operating Income

| 10 © 2018 Benchmark Electronics, Inc. Q1 2018 Financial Highlights

© 2018 Benchmark Electronics, Inc. | 11 First Quarter 2018 Financial Summary For the Three Months Ended (In millions, except EPS) Mar. 31 , 2018 Dec. 31 , 2017 Q/Q Mar. 31 , 2017 Y/Y Net Sales $608 $666 (9%) $558 9% GAAP Operating Margin 3.0% 3.3% (30 bps) 2.0% 100 bps GAAP Diluted EPS ($0.49) ($1.54) 68% $0.17 (388%) Non - GAAP Operating Margin 3.7% 4.1% (40 bps) 3.6% 10 bps Non - GAAP Diluted EPS $0.41 $0.49 (16%) $0.32 28% GAAP ROIC 9.1% 8.1% 100 bps 7.3% 180 bps Non - GAAP ROIC 11.2% 10.3% 90 bps 8.9% 230 bps See APPENDIX 1 for a reconciliation of GAAP to non - GAAP Financial Results Our Guidance for the First Quarter: ► Revenue (in millions) $585 – $605 ► Diluted EPS – non - GAAP $0.34 – $0.38
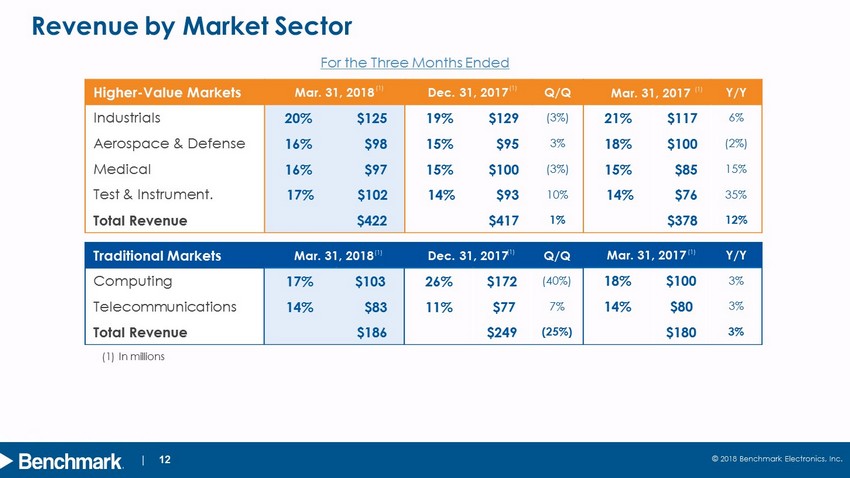
© 2018 Benchmark Electronics, Inc. | 12 Higher - Value Markets Mar. 31 , 2018 Dec. 31 , 2017 Q/Q Industrials 20% $125 19% $129 (3%) Aerospace & Defense 16% $98 15% $95 3% Medical 16% $97 15% $100 (3%) Test & Instrument. 17% $102 14% $93 10% Total Revenue $422 $417 1% Revenue by Market Sector (1) In millions Traditional Markets Mar. 31 , 2018 Dec. 31 , 2017 Q/Q Computing 17% $103 26% $172 (40%) Telecommunication s 14% $83 11% $77 7% Total Revenue $186 $249 (25%) Mar. 31 , 2017 Y/Y 18% $100 3% 14% $80 3% $180 3% For the Three Months Ended Mar. 31 , 2017 Y/Y 21% $117 6% 18% $100 (2%) 15% $85 15% 14% $76 35% $378 12% (1) (1) (1) (1) (1) (1)

© 2018 Benchmark Electronics, Inc. | 13 GAAP Key Business Trends Return on Invested Capital (LTM) Operating Margin ($M) SG&A ($M) Revenue & Gross Margin ($ M ) NOPAT Inv. Capital 10.9 23.1 20.9 21.9 18.0 2.0% 3.7% 3.4% 3.3% 3.0% 0.0% 1.0% 2.0% 3.0% 4.0% 5.0% 6.0% 7.0% 0.0 10.0 20.0 30.0 40.0 50.0 60.0 Q1-17 Q2-17 Q3-17 Q4-17 Q1-18 32.7 32.3 32.1 33.3 35.7 5.9% 5.2% 5.3% 5.0% 5.9% 0.0% 1.0% 2.0% 3.0% 4.0% 5.0% 6.0% 7.0% 8.0% 0.0 10.0 20.0 30.0 40.0 50.0 60.0 70.0 Q1-17 Q2-17 Q3-17 Q4-17 Q1-18 558 620 611 666 608 8.5% 9.6% 9.5% 9.1% 9.6% 1.0% 3.0% 5.0% 7.0% 9.0% 11.0% 13.0% 15.0% 0 200 400 600 800 1,000 1,200 1,400 Q1-17 Q2-17 Q3-17 Q4-17 Q1-18 GAAP ROIC = ( GAAP income from operations – GAAP Tax Impact ) · (Average Invested Capital for last 5 quarters) 947 916 903 878 850 69 75 69 71 77 7.3% 8.2% 7.6% 8.1% 9.1% 0.0% 2.0% 4.0% 6.0% 8.0% 10.0% 0 200 400 600 800 1000 1200 1400 1600 1800 2000 Q1-17 Q2-17 Q3-17 Q4-17 Q1-18
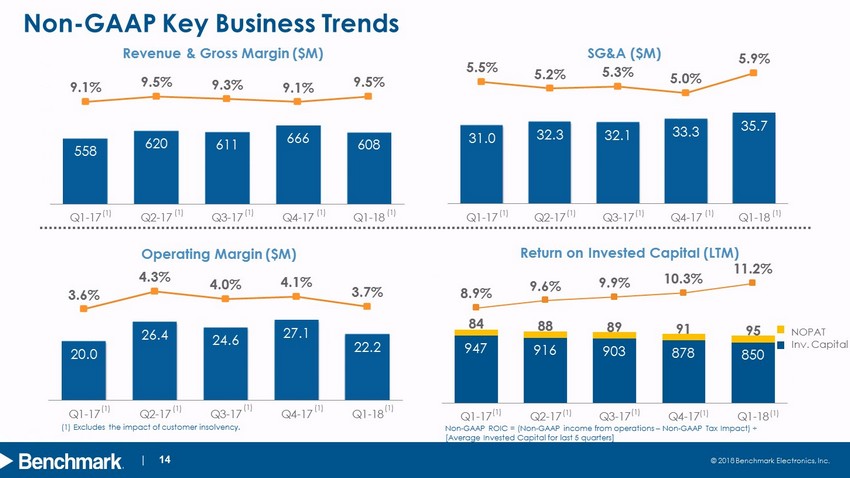
© 2018 Benchmark Electronics, Inc. | 14 Non - GAAP Key Business Trends Operating Margin ($M) SG&A ($M) Revenue & Gross Margin ($ M ) NOPAT Inv. Capital Non - GAAP ROIC = (Non - GAAP income from operations – Non - GAAP Tax Impact) · [Average Invested Capital for last 5 quarters] (1) Excludes the impact of customer insolvency. 31.0 32.3 32.1 33.3 35.7 5.5% 5.2% 5.3% 5.0% 5.9% 0.0% 1.0% 2.0% 3.0% 4.0% 5.0% 6.0% 7.0% 8.0% 0.0 10.0 20.0 30.0 40.0 50.0 60.0 70.0 Q1-17 Q2-17 Q3-17 Q4-17 Q1-18 (1) (1) 558 620 611 666 608 9.1% 9.5% 9.3% 9.1% 9.5% 1.0% 3.0% 5.0% 7.0% 9.0% 11.0% 13.0% 15.0% 0 200 400 600 800 1,000 1,200 1,400 Q1-17 Q2-17 Q3-17 Q4-17 Q1-18 (1) (1) 20.0 26.4 24.6 27.1 22.2 3.6% 4.3% 4.0% 4.1% 3.7% 0.0% 1.0% 2.0% 3.0% 4.0% 5.0% 6.0% 7.0% 0.0 10.0 20.0 30.0 40.0 50.0 60.0 Q1-17 Q2-17 Q3-17 Q4-17 Q1-18 (1) (1) 947 916 903 878 850 84 88 89 91 95 8.9% 9.6% 9.9% 10.3% 11.2% 0.0% 2.0% 4.0% 6.0% 8.0% 10.0% 12.0% 0 200 400 600 800 1000 1200 1400 1600 1800 Q1-17 Q2-17 Q3-17 Q4-17 Q1-18 Return on Invested Capital (LTM) (1) (1) (1) (1) (1) (1) (1) (1) (1) (1) (1) (1) (1) (1)
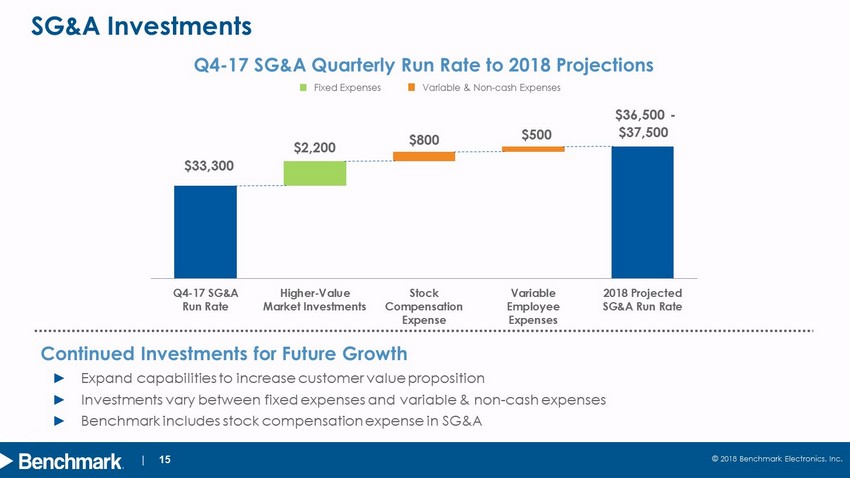
© 2018 Benchmark Electronics, Inc. | 15 SG&A Investments Continued Investments for Future Growth ► Expand capabilities to increase customer value proposition ► Investments vary between fixed expenses and variable & non - cash expenses ► Benchmark includes stock compensation expense in SG&A Q4 - 17 SG&A Quarterly Run Rate to 2018 Projections Fixed Expenses Variable & Non - cash Expenses $33,300 $36,500 - $37,500 $2,200 $800 $500 Q4-17 SG&A Run Rate Higher-Value Market Investments Stock Compensation Expense Variable Employee Expenses 2018 Projected SG&A Run Rate
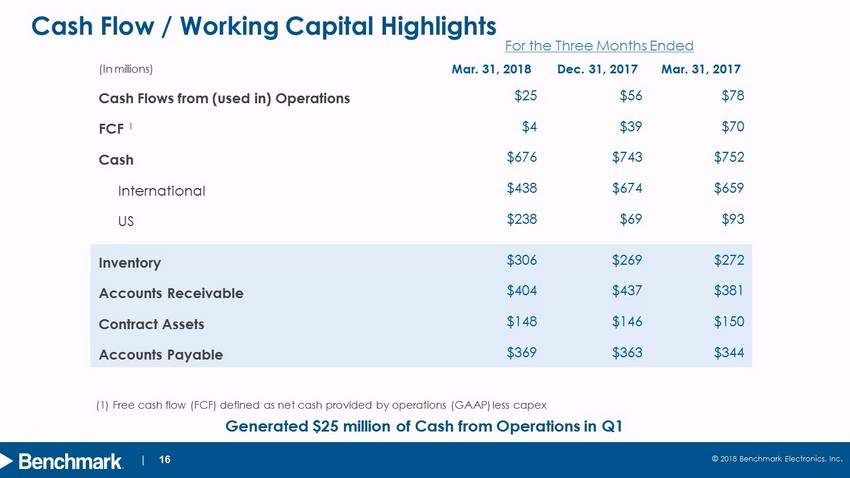
© 2018 Benchmark Electronics, Inc. | 16 (In millions) Mar. 31 , 2018 Dec. 31 , 2017 Mar. 31 , 2017 Cash Flows from (used in) Operations $25 $56 $78 FCF $4 $39 $70 Cash $676 $743 $752 International $438 $674 $659 US $238 $69 $93 Inventory $306 $269 $272 Accounts Receivable $404 $437 $381 Contract Assets $148 $146 $150 Accounts Payable $369 $363 $344 Cash Flow / Working Capital Highlights Generated $ 25 million of Cash from Operations in Q1 (1) Free cash flow (FCF) defined as net cash provided by operations (GAAP) less capex For the Three Months Ended 1

© 2018 Benchmark Electronics, Inc. | 17 Working Capital Update Ongoing Cash Conversion Cycle Days will Range between 73 and 68 Days Q1 - 16 Q2 - 16 Q3 - 16 Q4 - 16 Q1 - 17 Q2 - 17 Q3 - 17 Q4 - 17 Q1 - 18 Accounts Receivable Days 69 66 64 63 62 57 61 59 59 Contract Asset Days 22 21 22 23 24 22 24 20 22 Inventory Days 51 44 45 39 48 45 46 40 50 Deposits 3 2 3 4 4 4 4 3 3 Accounts Payable Days 40 47 52 52 61 55 55 54 60 Cash Conversion Cycle 99 82 76 69 69 65 72 62 68 99 82 76 69 69 65 72 62 68 0 20 40 60 80 100 120 Q1-16 Q2-16 Q3-16 Q4-16 Q1-17 Q2-17 Q3-17 Q4-17 Q1-18

design develop deliver advanced technology 18 © 2018 Benchmark Electronics, Inc. | 18 U.S. Tax Reform: Benchmark Impacts Repatriation and tax expenses ► Decision in Q1 - 18 to change historical repatriation strategy ► Repatriation of $277 million to the U.S. in Q1 - 18 ► Applicable foreign withholding and U.S. state taxes recorded due to decision to repatriate foreign earnings Q1 - 18 tax expense of $40 million ► Estimated $31 million tax expense for foreign withholding taxes ► Estimated $ 9 million tax expense for applicable state taxes for foreign cash distributions Effective Tax Rate for 2018 ► Global Intangible Low - Taxed Income (GILTI) impacts tax rate by 3 - 4 % ► Expected to range from 16 - 18%

design develop deliver advanced technology 19 © 2018 Benchmark Electronics, Inc. | 19 Capital Allocation update New dividend ► Announced first quarterly cash dividend of $0.15 per share to shareholders of record as of March 29, 2018 ► Dividend was paid on April 11, 2018 Stock repurchase authorization ► Board approved stock repurchase of up to an additional $250 million of common stock Accelerated Stock Repurchase (ASR) agreement ► $50 million accelerated stock repurchase agreement signed in Q1 - 18 ► Initial delivery of 1,288,245 shares for $40 million ► Remaining $10 million expected to settle at contract closure Open Market R epurchases (OMR) for Q1 - 18 ► Repurchase of 623,133 shares for $18 million

design develop deliver advanced technology 20 © 2018 Benchmark Electronics, Inc. | 20 Second Quarter 2018 Guidance * The above guidance excludes the impact of amortization of intangible assets and estimated restructuring charges Guidance Net Sales (in millions) $590 – $630 Diluted EPS – non - GAAP* $0.26 – $0.34

design develop deliver advanced technology 21 © 2018 Benchmark Electronics, Inc. | 21 Sequential Modeling Information Higher - Value Markets Q2 - 18 Outlook (%) Industrials Up Mid - Singles Aerospace & Defense Down Mid - Singles Medical Down Low Teens Test & Instrumentation Up Mid - Singles Traditional Markets Q2 - 18 Outlook (%) Computing Up High Singles Telecommunication s Flat Q2 - 18 Guidance Operating Margin - non - GAAP * 2.7% – 3.2% Interest Expense (in millions) $2.3 Effective Tax Rate 18% Weighted Average Shares (m) 47.6 * The above guidance excludes the impact of amortization of intangible assets and estimated restructuring charges

| 22 © 2018 Benchmark Electronics, Inc. Appendix

design develop deliver advanced technology 23 © 2018 Benchmark Electronics, Inc. | 23 APPENDIX 1 - Reconciliation of GAAP to non - GAAP Financial Results (Amounts in Thousands, Except Per Share Data) – (UNAUDITED) March 31, December 31, March 31, 2018 2017 2017 $ 17,967 $ 21,910 $ 10,889 2,235 3,062 1,511 (341) (239) 5,120 2,366 2,367 2,481 $ 22,227 $ 27,100 $ 20,001 $ (23,641) $ (76,361) $ 8,555 2,235 3,062 1,511 (341) (239) 5,120 2,366 2,367 2,481 (818) (1,793) (1,580) 40,114 97,633 - $ 19,915 $ 24,669 $ 16,087 Diluted (GAAP) $ (0.49) $ (1.54) $ 0.17 Diluted (Non-GAAP) $ 0.41 $ 0.49 $ 0.32 *CS (1) This amount represents the tax impact of the non-GAAP adjustments using the applicable effective tax rates. *CE (2) This amount represents the estimated impact of the U.S. Tax Reform and the impact of repatriating foreign earnings from our foreign jurisdictions to the U.S. as allowed under the U.S. Tax Reform. For the three months ended March 31, 2018, this includes estimated foreign withholding taxes applicable to historical earnings prior to December 31, 2017 and for the applicable state tax impact of foreign cash distributions into the U.S. For the three months ended December 31, 2017, this includes the impact of a one-time mandatory tax on the deemed repatriation of undistributed foreign earnings and the re- measurement of U.S. deferred tax assets and liabilities for the decrease in the U.S. federal tax rate from 35% to 21%. Three Months Ended (as adjusted) Income from operations (GAAP) Net income (loss) (GAAP) Non-GAAP income from operations Income tax adjustments (1) Non-GAAP net income Diluted earnings (loss) per share: Restructuring charges and other costs Restructuring charges and other costs Amortization of intangible assets Amortization of intangible assets Customer insolvency (recovery) Customer insolvency (recovery) Tax Cuts and Jobs Act (2)
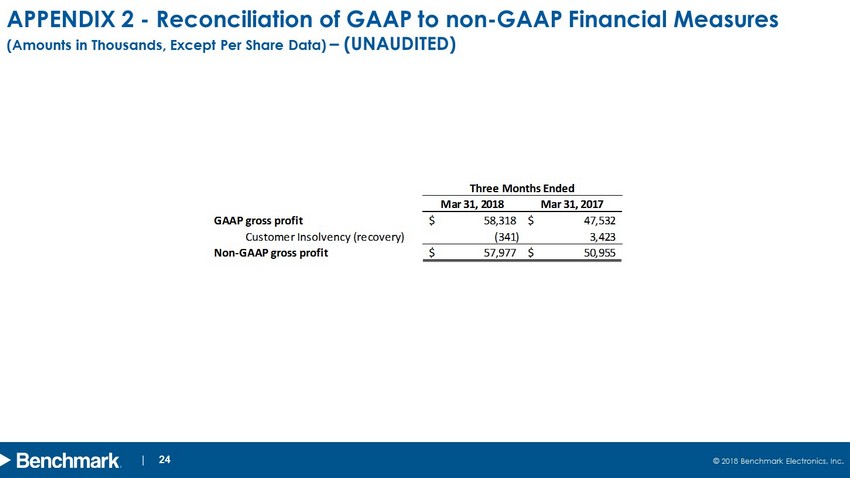
design develop deliver advanced technology 24 © 2018 Benchmark Electronics, Inc. | 24 APPENDIX 2 - Reconciliation of GAAP to non - GAAP Financial Measures (Amounts in Thousands, Except Per Share Data) – (UNAUDITED) Mar 31, 2018 Mar 31, 2017 GAAP gross profit 58,318$ 47,532$ Customer Insolvency (recovery) (341) 3,423 Non-GAAP gross profit 57,977$ 50,955$ Three Months Ended