Attached files
| file | filename |
|---|---|
| 8-K - 8-K - SunCoke Energy Partners, L.P. | d578132d8k.htm |
| EX-99.3 - EX-99.3 - SunCoke Energy Partners, L.P. | d578132dex993.htm |
| EX-99.1 - EX-99.1 - SunCoke Energy Partners, L.P. | d578132dex991.htm |
 Q1 2018 Earnings Conference Call April 26, 2018 Exhibit 99.2 Partners, L.P. SunCoke Energy |
 Forward-Looking Statements
This slide presentation should be reviewed in conjunction with the First
Quarter 2018 earnings release of SunCoke Energy Partners, L.P. (SXCP) and conference call held on April 26, 2018 at 10:00 a.m. ET. Some of the information included in this presentation constitutes “forward-looking statements.” All statements in
this presentation that express opinions, expectations, beliefs,
plans, objectives, assumptions or projections with respect to anticipated future performance of SunCoke Energy, Inc. (SXC) or SXCP, in contrast with statements of historical facts, are forward-looking statements. Such forward-looking statements
are based on management’s beliefs and assumptions and on
information currently available. Forward-looking statements include information concerning possible or assumed future results of operations, business strategies, financing plans, competitive position, potential growth opportunities, potential operating
performance improvements, the effects of competition and the
effects of future legislation or regulations. Forward-looking statements include all statements that are not historical facts and may be identified by the use of forward-looking terminology such as the words “believe,”
“expect,” “plan,” “intend,” “anticipate,” “estimate,” “predict,” “potential,” “continue,” “may,” “will,”
“should” or the negative of these terms or similar expressions. Although management believes that its plans, intentions and expectations reflected in or suggested by the forward-looking statements
made in this presentation are reasonable, no assurance can be
given that these plans, intentions or expectations will be achieved when anticipated or at all. Moreover, such statements are subject to a number of assumptions, risks and uncertainties. Many of these risks are beyond the
control of SXC and SXCP, and may cause actual results to differ
materially from those implied or expressed by the forward-looking statements. Each of SXC and SXCP has included in its filings with the Securities and Exchange Commission cautionary language identifying important factors (but not necessarily all the
important factors) that could cause actual results to differ
materially from those expressed in any forward-looking statement. For more information concerning these factors, see the Securities and Exchange Commission filings of SXC and SXCP.
All forward-looking statements included in this presentation are expressly
qualified in their entirety by such cautionary statements.
Although forward-looking statements are based on current beliefs and expectations, caution should be taken not to place undue reliance on any such forward-looking statements because such statements speak only as of the date
hereof. SXC and SXCP do not have any intention or
obligation to update publicly any forward-looking statement (or its associated cautionary language) whether as a result of new information or future events or after the date of this presentation, except as required by applicable law.
This presentation includes certain non-GAAP financial measures intended to
supplement, not substitute for, comparable GAAP measures. Reconciliations of non-GAAP financial measures to GAAP financial measures are provided in the Appendix at the end of the presentation.
Investors are urged to consider
carefully the comparable GAAP measures and the reconciliations to those
measures provided in the Appendix. 2
SXCP Q1 2018 Earnings Call |
 Q1 2018 Highlights
3 Achieved solid safety and operating performance across coke and logistics fleet Delivered solid Q1 2018 Adj. EBITDA of $49.5M; remain well positioned to achieve FY guidance Handled record coal export volumes at CMT; Increasing 2018 CMT total throughput expectation to 10.0Mt - 10.5Mt Declared quarterly distribution of $0.40/unit; reallocating capital towards paying down debt to enable us to reach our stated leverage target of 3.5x or lower debt to EBITDA SXCP Q1 2018 Earnings Call |
 Q1 2018 Overview
Q1 2018 net income attributable to SXCP
of $12.2M • Absence of deferred income tax expense of $145.6M related to change in IRS regs. on qualifying income, partially offset by higher interest expense Q1 2018 Adj. EBITDA of $49.5M down $2.2M from prior year quarter Distributable Cash Flow of $27.5M and cash coverage of 1.46x (2) Q1 2018 OCF of $66.1M Q1 ‘18 and Q1 ‘17 OCF coverage ratio of 3.50x and 1.34x, respectively (3) (1) For a definition and reconciliation of Adjusted EBITDA, Distributable Cash Flow and Distribution Cash Coverage Ratio, please
see appendix.
(2) Reflects the Q1 2018 declared distribution of $0.40/unit; cash coverage at 0.93x under Q1 2017 distribution of $0.594
(3) Operating cash flow coverage ratio is net cash provided by operating activities divided by total estimated distributions to the
limited and general partners. Includes a $32 million
benefit in Q1 2018 from changes in working capital primarily
driven by timing of inventory and interest payments.
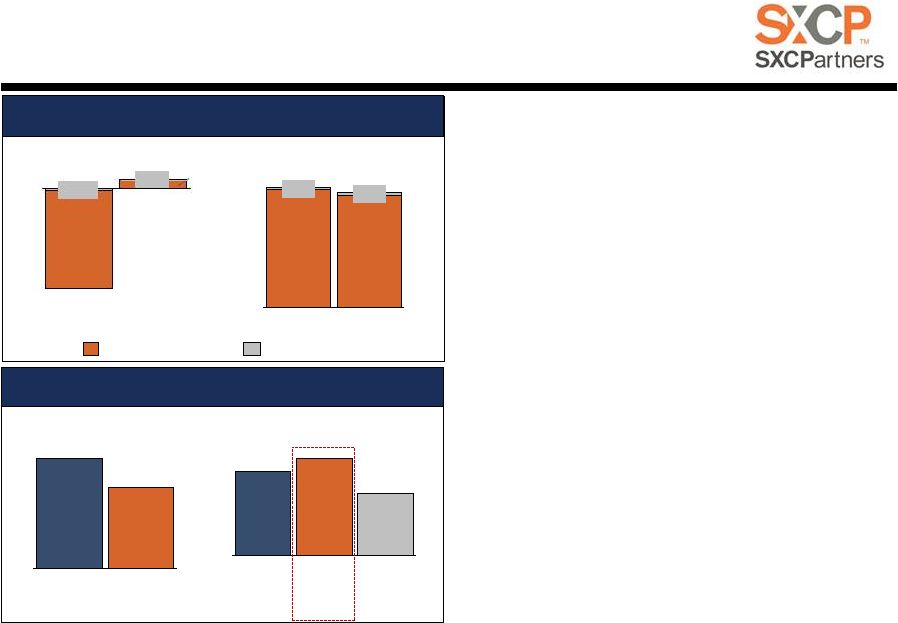
4 SXCP Q1 2018 Earnings Call ($ in millions, except coverage ratio) $37.1 $27.5 Q1 ‘17 Q1 ‘18 Distributable Cash Flow Distribution Cash Coverage Ratio ($ in millions) Net Income/(Loss) Attrib. to NCI Attrib. to SXCP ($2.4) $0.5 Q1 ‘17 $12.7 Q1 ‘18 ($131.7) Adjusted EBITDA $0.8 Q1 ‘17 $0.8 Q1 ‘18 $50.9 $48.7 $51.7 $49.5 1.26x 1.46x 0.93x Actual Q1 ‘17 ($0.594) Actual Q1 ‘18 ($0.40) Proforma Q1 ‘18 ($0.594) $12.2 ($129.3) Net Income/(Loss) & Adjusted EBITDA (1) Distributable Cash Flow & Coverage Ratio (1) |
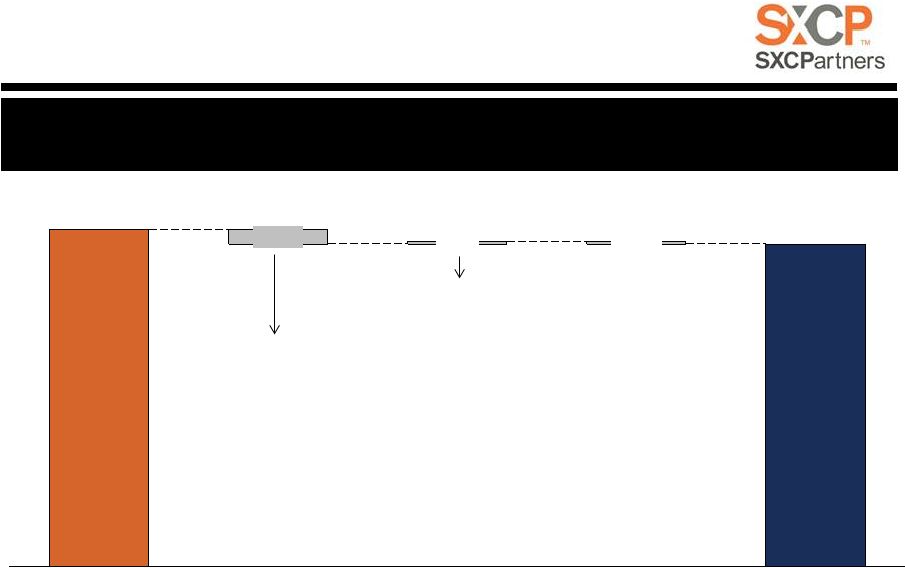 Adj. EBITDA (1) – Q1 ‘17 to Q1 ‘18 $49.5 $51.7 ($2.2) Domestic Coke $0.4 Q1 2017 Adj. EBITDA Q1 2018 Adj. EBITDA Corporate & Other ($0.4) Logistics ($ in millions) (1) For a definition and reconciliation of Adjusted EBITDA, please see appendix.
(1) (1) • ($1.7M) - Primarily due to timing of planned outage and maintenance costs • ($0.8M) - Higher coal moisture from adverse weather and logistics conditions resulted in lower production and energy revenue at Granite City • $1.9M - Higher throughput volume at CMT • ($0.7M) - Impact of high water conditions • ($0.4M) - Net lower volumes at domestic terminals Solid Q1 2018 Adjusted EBITDA driven by strong CMT throughput offset by higher costs from timing of planned outage and adverse weather conditions
5 SXCP Q1 2018 Earnings Call |
 Coke Business Summary
Delivered solid Q1 2018 cokemaking
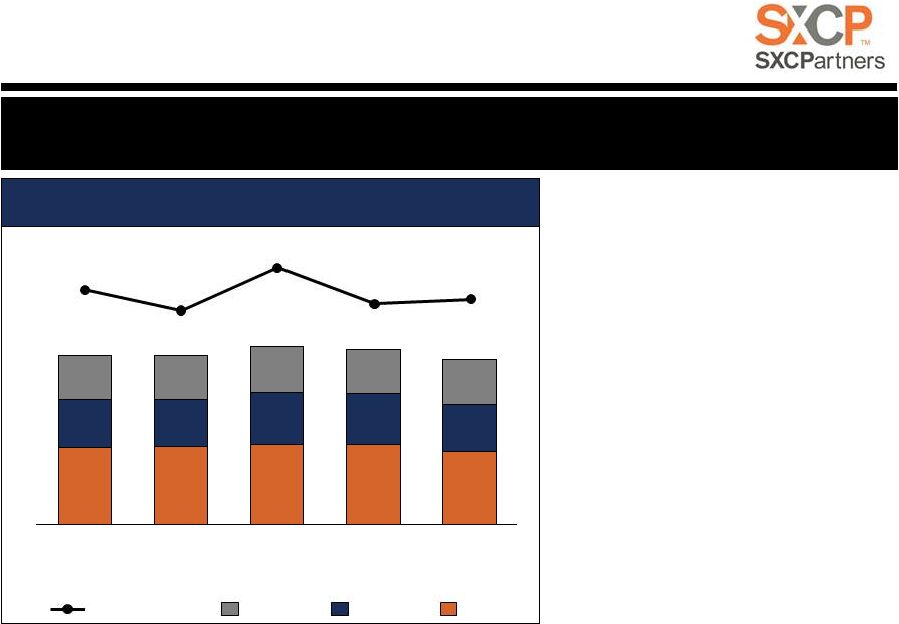
results Cokemaking Performance (100% Basis) (1,2) 259 260 267 267 245 159 158 174 171 156 149 148 154 148 153 $75/ton Q2 ‘17 Q3 ‘17 Q1 ‘17 566 $85/ton $66/ton Q4 ‘17 $69/ton $71/ton Q1 ‘18 567 595 586 554 Adjusted EBITDA/ton Granite City Middletown Haverhill 564K 569K 585K 580K Sales Tons 568K (1) Represents Haverhill, Middletown and Granite City on a 100% basis. (2) For a definition and reconciliation of Adjusted EBITDA and Adjusted EBITDA per ton, please see appendix.
Achieved solid Q1 ‘18 Adj.
EBITDA/ton (1,2) of ~$71 Q1 ‘18 Cokemaking Adj. EBITDA (1,2) of $40.3M down $2.2M vs Q1 2017 • Timing of planned outage and maintenance costs and lower yields from coal blends at Haverhill • Higher coal moisture from adverse weather conditions impacted production at Granite City (2) 6 SXCP Q1 2018 Earnings Call (Coke Production, Kt) |
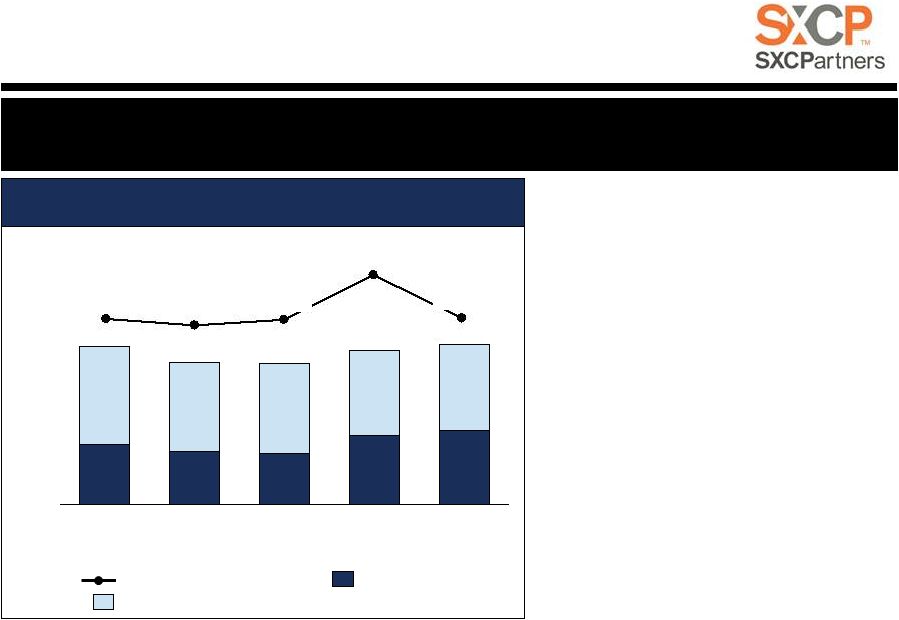 Logistics Business Summary
7 SXCP Q1 2018 Earnings Call Improved Q1 ‘18 performance driven primarily by significant increase in CMT volumes 2,075 1,827 1,762 2,384 2,528 3,374 3,082 3,100 2,942 3,003 Q2 ‘17 $12.3M $9.6M 4,909 Q1 ‘17 5,326 $34.8M Q3 ‘17 Q4 ‘17 $13.4M 5,531 4,862 5,449 $13.0M Q1 ‘18 Total Logistics Adj. EBITDA ($M) Logistics (ex. CMT) CMT (coal & liquids) (Tons Handled, Kt) (1) Adjusted EBITDA includes Logistics deferred revenue when it is recognized as GAAP revenue. For a
definition and reconciliation of Adjusted EBITDA, please see
appendix. (2)
Q4 2017 Adjusted EBITDA includes $16.4M recognition of previously deferred
revenue related to take-or- pay shortfalls throughout
2017. $10.9M
$7.2M $9.7M $29.5M CMT Adj. EBITDA $12.0M (1) (1) Logistics Performance (2) Delivered Q1 ‘18 Adj. EBITDA of $13.4M • Solid volumes due to continued favorable coal export market dynamics • Increase CMT 2018 base take-or-pay volumes to 8.5Mt - 9.0Mt from 6.5Mt; total throughput up to 10.0Mt - 10.5Mt Convent contributed $12.0M to Q1 ‘18 Adjusted EBITDA • Highest quarterly volume despite near- historic water levels adversely impacting operations • Adj. EBITDA does not include $1.2M of deferred revenue in Q1 volume shortfall to be recognized in Q4 ‘18 |
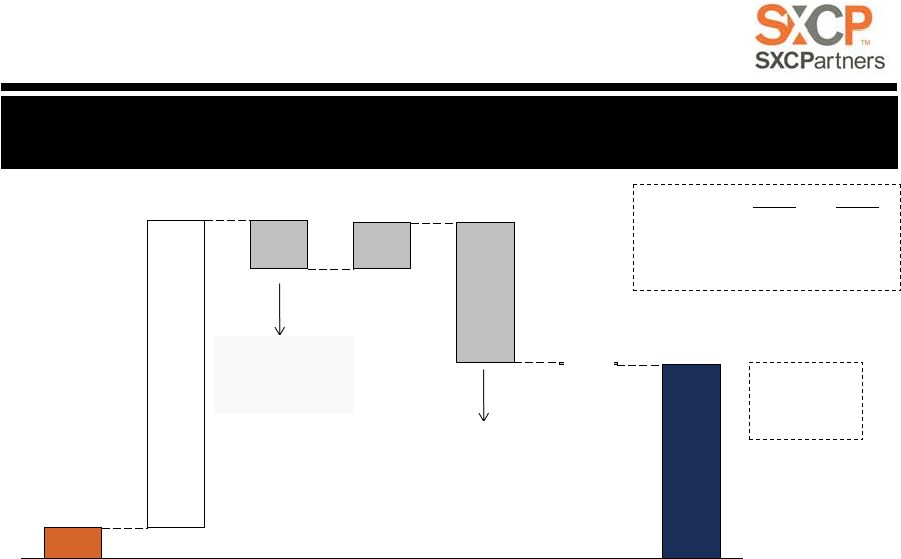  Q1
2018 Liquidity $6.6
$41.5 $66.1 $10.0 ($0.6) Capital Contribution Cash Distributions to Unitholders and NCI ($30.0) ($10.6) Consol. Cash @ YE 2017 CapEx Net Cash Provided by Ops. Activities Other Consol. Cash @ Q1 2018 ($ in millions) Revolver Availability: $153M Maintain sufficient SXCP liquidity of ~$195M 8 SXCP Q1 2018 Earnings Call (Consolidated) Q1 ’18 Q4 ‘17 Total Debt $842M $843M Gross Leverage (1) 3.83x 3.81x (1) Gross leverage for Q1 2018 calculated using midpoint of FY 2018E Adjusted EBITDA attributable to SXCP guidance; Q4 2017 based on 2017
actuals. Max leverage covenant currently at 4.5x and
steps-down to 4.0x debt to EBITDA in June 2020.
(2) Includes a $32 million benefit from changes in working capital primarily driven by timing of inventory and interest payments
(SXCP note payments are in
2 nd and 4 th quarter) (3) SunCoke Energy, Inc. made a $10 million capital contribution during the first quarter 2018 to reimburse a portion of the Consent
Decree capex; anticipate incremental ~$10M in
by YE 2018 • Distribution of $0.5940/unit paid in Q1 ‘18 (3) (2) • $7.3M Granite City Remediation Capex |
 SXCP Distribution
9 Believe modifying distribution policy prudent to strengthen SXCP balance sheet and increase long-term financial flexibility SXCP’s BoD recently announced modified distribution policy • Declared Q1 ‘18 distribution of $0.40/unit, or $1.60/unit annually New distribution policy established to re-deploy cash towards paying down
debt and strengthening our balance sheet
• Provides desired cushion for anticipated maximum leverage covenant step-down from 4.5x debt
to EBITDA to 4.0x in June 2020
• Committed to maintaining strong liquidity and increasing cash balance to historical norms
• Greater flexibility to reduce debt while meeting CapEx needs • Decision is not a result of deteriorating operating performance or changes in future expectations
Modified distribution policy will enable SXCP to achieve its stated leverage
target
of 3.5x or lower by YE 2019; targeting leverage of ~3.7x (1) by YE 2018 (1) Assumes mid-point of EBITDA guidance ($220M) and ~$25M of cash used to pay down debt; assumes incremental cashflow
after debt repayment used to build cash balance to
more normalized level vs. ~$7M at YE 2017
SXCP Q1 2018 Earnings Call |
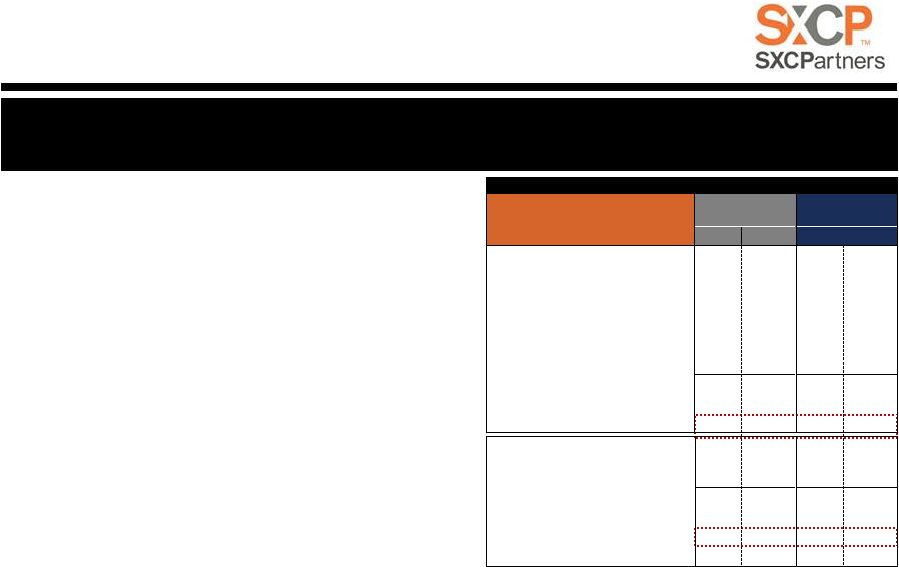 Revised 2018 Distribution Outlook
(1) Represents savings from 3 quarters of cash distributions at a revised $0.40/unit quarterly rate in 2018. Paid distributions during Q1
2018 at $0.5940/unit. (2)
Cash tax impact from the operations of Gateway Cogeneration Company LLC, which
is an entity subject to income taxes for federal and state purposes at the corporate level. (3) Does not include reduction of interest expense related to potential debt reduction
(4) Reflects 4 quarters of declared distributions in 2018 at a revised $0.40/unit quarterly rate.
(5) Total distribution cash coverage ratio is estimated distributable cash flow divided by estimated distributions. (6) Represents estimated distributable cash flow plus replacement capex accrual less environmental gas sharing capex, net of SXC’s $20M
reimbursement. (7)
Represents estimated distributable cash flow, net less estimated
distributions. (8)
Total excess cash coverage ratio is total excess cash after distributions
divided by estimated distributions. Intend to deploy meaningful cash
savings in 2018 and 2019 to de-lever SXCP balance sheet and
build cash Expect modified distribution policy will
generate $75M total cash savings in 2018
and 2019 • Includes ~$32M (1) savings in 2018 and ~$42M savings in 2019 • Expect to deploy excess cash towards revolver paydown Expect FY ‘18 distribution cash coverage ratio of 1.62x to 1.75x 10 SXCP Q1 2018 Earnings Call ($ in millions) Low High Low High Adjusted EBITDA attributable to SXCP $215 $225 $215 $225 Less: CMT Deferred Revenue 0 0 0 0 Ongoing capex (SXCP share) 25 25 25 25 Replacement capex accrual 8 8 8 8 Cash tax accrual (2) 3 3 3 3 Cash interest accrual (3) 57 57 57 57 Estimated distributable cash flow $122 $132 $122 $132 Estimated distributions (4) $118 $118 $76 $76 Total distribution cash coverage ratio (5) 1.03x 1.12x 1.62x 1.75x Estimated distributable cash flow $122 $132 $122 $132 + Replacement capex accrual $8 $8 $8 $8 - GCO Environmental CapEx, net (6) (15) (15) ($15) ($15) Estimated distributable cash flow, net $115 $125 $115 $125 Estimated distributions (4) $118 $118 $76 $76 Total excess cash after distributions (7) ($3) $7 $39 $49 Excess cash coverage after distributions (8) 0.97x 1.06x 1.52x 1.66x Annual Distribution at $2.38/Unit Annual Distribution at $1.60/Unit FY 2018 |
 2018 Key Initiatives
11 SXCP Q1 2018 Earnings Call • Drive strong operational & safety performance while optimizing asset utilization
Deliver Operations Excellence and Optimize Asset Base
• Implement gas sharing technology project to drive improved environmental performance
Complete Execution of Granite City Gas Sharing Project
• Secure further new business to contribute towards $5M – $10M EBITDA target in next 2 years Leverage CMT Capabilities to Diversify Customer & Product Mix • Achieve $215M – $225M Adj. EBITDA attrib. to SXCP and $122M – $132M DCF guidance Accomplish 2018 Financial Objectives |
 QUESTIONS |
 Investor Relations
630-824-1987
www.suncoke.com |
 APPENDIX |
 Definitions • Adjusted EBITDA represents earnings before interest, taxes, depreciation and amortization (“EBITDA”), adjusted for any loss (gain) on extinguishment of debt and/or changes to our contingent consideration liability related to our acquisition of the CMT. Adjusted
EBITDA does not represent and should not be considered an
alternative to net income or operating income under GAAP and may not be comparable to other similarly titled measures in other businesses. Management believes Adjusted EBITDA is an important measure of the operating
performance and liquidity of the Partnership's net assets and its
ability to incur and service debt, fund capital expenditures and make distributions. Adjusted EBITDA provides useful information to investors because it highlights trends in our business that may not otherwise be apparent when
relying solely on GAAP measures and because it eliminates items
that have less bearing on our operating performance and liquidity. EBITDA and Adjusted EBITDA are not measures calculated in accordance with GAAP, and they should not be considered an alternative to net income,
operating cash flow or any other measure of financial performance
presented in accordance with GAAP. •
EBITDA represents earnings before interest, taxes, depreciation and amortization. • Adjusted EBITDA attributable to SXC/SXCP represents Adjusted EBITDA less Adjusted EBITDA attributable to noncontrolling interests. • Adjusted EBITDA/Ton represents Adjusted EBITDA divided by tons sold/handled. 15 SXCP Q1 2018 Earnings Call |
 Definitions • Distributable Cash Flow equals Adjusted EBITDA plus sponsor support and Logistics deferred revenue; less net cash paid for interest expense,
ongoing capital expenditures, accruals for replacement capital expenditures and
cash distributions to noncontrolling interests; plus amounts
received under the Omnibus Agreement and acquisition expenses deemed to be
Expansion Capital under our Partnership Agreement. Distributable
Cash Flow is a non-GAAP supplemental financial measure that management and external users of SXCP's financial statements, such as industry analysts, investors, lenders and rating agencies use to assess:
• SXCP's operating performance as compared to other publicly traded partnerships, without regard to historical cost basis;
• the ability of SXCP's assets to generate sufficient cash flow to make distributions to SXCP's unitholders;
• SXCP's ability to incur and service debt and fund capital expenditures; and
• the viability of acquisitions and other capital expenditure projects and the returns on investment of various investment
opportunities. •
Ongoing capital expenditures (“capex”) are capital expenditures made to maintain the existing operating capacity of our assets and/or to extend
their useful lives. Ongoing capex also includes new equipment that improves the
efficiency, reliability or effectiveness of existing assets. Ongoing capex does not include normal repairs and maintenance, which are expensed as incurred, or significant capital expenditures. For purposes
of calculating distributable cash flow, the portion of ongoing
capex attributable to SXCP is used. •
Replacement capital expenditures (“capex”) represents an annual accrual necessary to fund SXCP’s share of the estimated costs to replace or
rebuild our facilities at the end of their working lives. This accrual is
estimated based on the average quarterly anticipated replacement capital that we expect to incur over the long term to replace our major capital assets at the end of their working lives. The replacement capex
accrual estimate will be subject to review and prospective change
by SXCP’s general partner at least annually and whenever an event occurs that causes a material adjustment of replacement capex, provided such change is approved by our conflicts committee.
16 SXCP Q1 2018 Earnings Call We believe that
Distributable Cash Flow provides useful
information to investors in assessing
SXCP's financial condition and results
of operations. Distributable Cash Flow should not be considered an alternative to net income, operating income, cash flows from operating
activities, or any
other measure of financial performance or liquidity
presented in accordance with GAAP.
Distributable Cash Flow has
important limitations as an analytical tool because it excludes some, but not all, items that affect net income and net cash provided by
operating activities and used in investing activities. Additionally,
because Distributable Cash Flow may be defined differently by other
companies in the industry, our definition of Distributable Cash Flow may not be
comparable to similarly titled measures of other companies,
thereby diminishing its utility.
|
 Q1 2018 Adj. EBITDA Reconciliation
17 SXCP Q1 2018 Earnings Call (1) The Partnership recorded a loss on extinguishment of debt as a result of its debt refinancing activities which occurred during the second
quarter of 2017.
(2) As a result of changes in the fair value of the contingent consideration liability, the Partnership recognized a gain of $1.7 million
during the fiscal year ended December 31, 2017.
(3) Reflects net income attributable to noncontrolling interest adjusted for noncontrolling interest's share of interest, taxes, income, and
depreciation and amortization.
($ in millions)
Q1 '17 Q2 '17 Q3 '17 Q4 '17 FY '17 Q1 '18 Net income (loss) (131.7) $ (12.5) $ 23.3 $ 103.4 $ (17.5) $ 12.7 $ Add: Depreciation, depletion and amortization expense 21.6 21.5 20.2 20.3 83.6 21.5 Interest expense, net 12.6 14.0 15.1 14.7 56.4 15.0 Loss on extinguishment of debt (1) - 19.9 0.1 - 20.0 - Income tax (benefit) / expense 149.2 (0.2) 1.7 (66.8) 83.9 0.3 Contingent consideration adjustments (2) - 0.3 (2.0) - (1.7) - Adjusted EBITDA (Consolidated) 51.7 $ 43.0 $ 58.4 $ 71.6 $ 224.7 $ 49.5 $ Subtract: Adjusted EBITDA attributable to noncontrolling interest (3) (0.8) (0.8) (1.0) (0.8) (3.4) (0.8) Adjusted EBITDA attributable to SXCP 50.9 $ 42.2 $ 57.4 $ 70.8 $ 221.3 $ 48.7 $ |
 Q1 2018 Adj. EBITDA Reconciliation
18 SXCP Q1 2018 Earnings Call (1) Changes in working capital exclude those items not impacting Adjusted EBITDA, such as changes in interest payable and income taxes
payable.
(2) As a result of changes in the fair value of the contingent consideration liability, the Partnership recognized a gain of $1.7 million
during the fiscal year ended December 31, 2017.
(3) Reflects net income attributable to noncontrolling interest adjusted for noncontrolling interest's share of interest, taxes, income, and depreciation and amortization. ($ in millions) Q1 '17 Q2 '17 Q3 '17 Q4 '17 FY '17 Q1 '18 Net cash provided by operating activities 39.4 $ 12.2 $ 61.1 $ 24.0 $ 136.7 $ 66.1 $ Add: Cash interest paid 20.9 14.6 2.8 27.3 65.6 2.0 Cash taxes paid 0.3 0.3 - 0.8 1.4 1.3 Changes in working capital (1) (11.3) 17.3 (8.9) 23.1 20.2 (19.6) Contingent consideration adjustments (2) - 0.3 (2.0) - (1.7) - Other adjustments to reconcile cash provided by operating activities to Adjusted EBITDA 2.4 (1.7) 5.4 (3.6) 2.5 (0.3) Adjusted EBITDA (3) 51.7 $ 43.0 $ 58.4 $ 71.6 $ 224.7 $ 49.5 $ Subtract: Adjusted EBITDA attributable to noncontrolling interest (3) 0.8 0.8 1.0 0.8 3.4 0.8 Adjusted EBITDA attributable to SXCP 50.9 $ 42.2 $ 57.4 $ 70.8 $ 221.3 $ 48.7 $ |
 Q1 2018 Distributable Cash Flow
Reconciliation
19 SXCP Q1 2018 Earnings Call (1) The Partnership recorded a loss on extinguishment of debt as a result of its debt refinancing activities which occurred during the second
quarter of 2017.
(2) As a result of changes in the fair value of the contingent consideration liability, the Partnership recognized a gain of $1.7 million
during the fiscal year ended December 31, 2017.
(3) Logistics volume shortfall billings adjusts to include ton minimums billed throughout the year in Distributable Cash Flow to better align
with cash collection. Volume shortfall billings on
take-or-pay contracts are recorded as deferred revenue and are recognized into GAAP income based on the terms of the contract, at which time they will be excluded from Distributable Cash Flow.
(4) Represents SXC corporate cost reimbursement holiday/deferral. (5) Reflects net income attributable to noncontrolling interest adjusted for noncontrolling interest's share of interest, taxes, income, and
depreciation and amortization.
($ in millions)
Q1 '17 Q2 '17 Q3 '17 Q4 '17 FY '17 Q1 '18 Net Income (loss) ($131.7) ($12.5) $23.3 $103.4 ($17.5) $12.7 Add: Depreciation, depletion and amortization expense 21.6 21.5 20.2 20.3 83.6 21.5 Interest expense, net 12.6 14.0 15.1 14.7 56.4 15.0 Loss on extinguishment of debt (1) - 19.9 0.1 - 20.0 - Income tax (benefit) / expense 149.2 (0.2) 1.7 (66.8) 83.9 0.3 Contingent consideration adjustments (2) - 0.3 (2.0) - (1.7) - Logistics deferred revenue (3) 3.2 5.5 4.2 (13.8) (0.9) 1.2 Corporate cost holiday/deferral (4) - (8.4) - - (8.4) - Subtract: Ongoing capex (SXCP share) 2.7 5.1 4.7 6.9 19.4 5.0 Replacement capex accrual 1.9 1.9 1.9 2.0 7.7 1.9 Cash interest accrual 11.8 13.7 14.7 14.5 54.7 14.9 Cash tax accrual 0.6 0.6 0.6 0.8 2.6 0.6 Adjusted EBITDA attributable to noncontrolling interest (5) 0.8 0.8 1.0 0.8 3.4 0.8 Distributable Cash Flow $37.1 $18.0 $39.7 $32.8 $127.6 $27.5 |
 Q1 2018 Distributable Cash Flow
Reconciliation
20 SXCP Q1 2018 Earnings Call (1) Changes in working capital exclude those items not impacting Adjusted EBITDA, such as changes in interest payable and income taxes
payable. (2)
As a result of changes in the fair value of the contingent consideration liability, the Partnership recognized a gain of $1.7 million during the fiscal year ended December 31, 2017. (3) Logistics volume shortfall billings adjusts to include ton minimums billed throughout the year in Distributable Cash Flow to better align
with cash collection. Volume
shortfall billings on take-or-pay contracts are recorded as deferred revenue and are recognized into GAAP income based on the terms of the contract, at which time they will be excluded from Distributable Cash Flow.
(4) Represents SXC corporate cost reimbursement holiday/deferral. (5) Reflects net income attributable to noncontrolling interest adjusted for noncontrolling interest's share of interest, taxes, income, and
depreciation and amortization.
(6) Operating cash flow coverage ratio is net cash provided by operating activities divided by total estimated distributions to the limited
and general partners. Operating cash flow is generally
expected to be higher than Distributable Cash Flow as Distributable Cash Flow is further reduced by certain cash reserves including capital expenditures, an investing cash flow item. Additionally, Distributable Cash Flow represents only the
Partnership’s share of available cash by
excluding Adjusted EBITDA attributable to noncontrolling interest, while operating cash flow is reported on a consolidated basis. (7) Distribution cash coverage ratio is distributable cash flow divided by total estimated distributions to the limited and general
partners. ($ in millions)
Q1 '17 Q2 '17 Q3 '17 Q4 '17 FY '17 Q1 '18 Net cash provided by operating activities 39.4 $ 12.2 $ 61.1 $ 24.0 $ 136.7 $ 66.1 $ Add: Cash interest paid 20.9 14.6 2.8 27.3 65.6 2.0 Cash taxes paid 0.3 0.3 - 0.8 1.4 1.3 Changes in working capital (1) (11.3) 17.3 (8.9) 23.1 20.2 (19.6) Contingent consideration adjustments (2) - 0.3 (2.0) - (1.7) - Logistics volume shortfall billings (3) 3.2 5.5 4.2 (13.8) (0.9) 1.2 Corporate cost holiday/deferral (4) - (8.4) - - (8.4) - Other adjustments to reconcile cash provided by operating activities to Adjusted EBITDA 2.4 (1.7) 5.4 (3.6) 2.5 (0.3) Subtract: Ongoing capex (SXCP share) 2.7 5.1 4.7 6.9 19.4 5.0 Replacement capex accrual 1.9 1.9 1.9 2.0 7.7 1.9 Cash interest accrual 11.8 13.7 14.7 14.5 54.7 14.9 Cash tax accrual 0.6 0.6 0.6 0.8 2.6 0.6 Adjusted EBITDA attributable to noncontrolling interest (5) 0.8 0.8 1.0 0.8 3.4 0.8 Distributable Cash Flow 37.1 $ 18.0 $ 39.7 $ 32.8 $ 127.6 $ 27.5 $ Quarterly Cash Distribution 29.5 29.5 29.5 29.5 118.0 18.9 Operating Cash Flow Coverage Ratio (6) 1.34x 0.41x 2.07x 0.82x 1.16x 3.50x Distribution Cash Coverage Ratio (7) 1.26x 0.61x 1.35x 1.11x 1.08x 1.46x |
  ($ in millions)
Attributable to SXCP Cash 42 Available Revolver Capacity 153 Total Liquidity 195 Gross Debt (Long and Short-term) 842 Net Debt (Total Debt less Cash) 801 FY 2018E Adj. EBITDA Guidance (1) 220.0 Gross Debt / FY 2017E Adj. EBITDA 3.83x Net Debt / FY 2017E Adj. EBITDA 3.64x As of 03/31/2018 Balance Sheet & Debt Metrics 21 SXCP Q1 2018 Earnings Call (1) Represents mid-point of FY 2018 guidance for Adj. EBITDA attributable to SXCP.
2018 2019 2020 2021 2022 2023 2024 2025 Consolidated Total SXCP Revolver - - - - 130.0 - - - 130.0 SXCP Sr. Notes - - - - - - - 700.0 700.0 SXCP Sale Leaseback 2.0 2.8 7.3 - - - - - 12.1 Total 2.0 $ 2.8 $ 7.3 $ - $ 130.0 $ - $ - $ 700.0 $ 842.1 $ As of Q1 2018 ($ in millions) SXCP Debt Maturities Schedule Max Gross Debt / EBITDA Covenant: May 2017 – June 2020: 4.5x June 2020 – May 2022: 4.0x |
 2018E Guidance Reconciliation
22 (1) Reflects net income attributable to noncontrolling interest adjusted for noncontrolling interest's share of interest,
taxes, income, and depreciation and amortization.
SXCP Q1 2018 Earnings Call
Low High Net income (loss) 68 $
83 $
Add: Depreciation and amortization expense 88 83 Interest expense, net 60 60 Income tax expense 2 3 Adjusted EBITDA 218 $ 229 $ Subtract: Adjusted EBITDA attributable to noncontrolling interest (1) 3 4 Adjusted EBITDA attributable to SunCoke Energy Partners, L.P. 215 $ 225 $ ($ in millions) FY 2018E |
 2018E Guidance Reconciliation
23 (1) Changes in working capital exclude those items not impacting Adjusted EBITDA, such as changes in interest
payable and income taxes payable.
(2) Reflects net income attributable to noncontrolling interest adjusted for noncontrolling interest's share of interest,
taxes, income, and depreciation and amortization.
SXCP Q1 2018 Earnings Call
Low High Net cash provided by operating activities 145 $ 160 $ Add: Cash interest paid 60 60 Cash income taxes paid 2 3 Changes in working capital and other (1) 11 6 Adjusted EBITDA 218 $ 229 $ Subtract: Adjusted EBITDA attributable to noncontrolling interest (2) 3 4 Adjusted EBITDA attributable to SunCoke Energy Partners, L.P. 215 $ 225 $ ($ in millions) FY 2018E |
 2018E Guidance Reconciliation
24 (1) Cash tax impact from operations of Gateway Cogeneration Company LLC, which is an entity subject to income taxes
for federal and state purposes at the corporate level.
(2) Reflects net income attributable to noncontrolling interest adjusted for noncontrolling interest's share of interest,
taxes, income, and depreciation and amortization.
SXCP Q1 2018 Earnings Call
Low High Net income (loss) 68 $
83 $
Add: Depreciation and amortization expense 88 83 Interest expense, net 60 60 Income tax expense 2 3 Subtract: Ongoing capex (SXCP share) 25 25 Replacement capex accrual 8 8 Cash interest accrual 57 57 Cash tax accrual (1) 3 3 Adjusted EBITDA attributable to noncontrolling interest (2) 3 4 Distributable Cash Flow 122 $ 132 $ ($ in millions) FY 2018E |
 Low High Net cash provided by operating activities 145 $ 160 $ Add: Cash interest paid 60 60 Cash income tax paid 2 3 Changes in working capital (1) 11 6 Subtract: Ongoing capex (SXCP share) 25 25 Replacement capex accrual 8 8 Cash interest accrual 57 57 Cash tax accrual (2) 3 3 Adjusted EBITDA attributable to noncontrolling interest (3) 3 4 Distributable Cash Flow 122 $ 132 $ Estimated distributions (4) 76 $
76 $
Operating cash flow coverage ratio (5) 1.92x 2.12x Distribution cash coverage ratio (6) 1.62x 1.75x ($ in millions) FY 2018E 2018E Guidance Reconciliation 25 (1) Changes in working capital exclude those items not impacting Adjusted EBITDA, such as changes in interest payable and income
taxes payable.
(2) Cash tax impact from operations of Gateway Cogeneration Company LLC, which is an entity subject to income taxes for federal and
state purposes at the corporate level.
(3) Reflects net income attributable to noncontrolling interest adjusted for noncontrolling interest's share of interest, taxes, income, and depreciation and amortization. (4) Estimated distributions assumes distributions are held constant at $0.40 per unit each quarter.
(5) Operating cash flow coverage ratio is net cash provided by operating activities divided by total estimated distributions to the limited
and
general partners. Operating cash flow is generally expected to be higher than Distributable Cash Flow as Distributable Cash Flow is further reduced by certain cash reserves including capital expenditures, an investing cash flow item. Additionally,
Distributable Cash Flow represents only the Partnership’s
share of available cash by excluding Adjusted EBITDA attributable to noncontrolling interest, while operating cash flow is reported on a consolidated basis.
(6) Distribution cash coverage ratio is distributable cash flow divided by total estimated distributions to the limited and general
partners. SXCP Q1 2018 Earnings Call
|
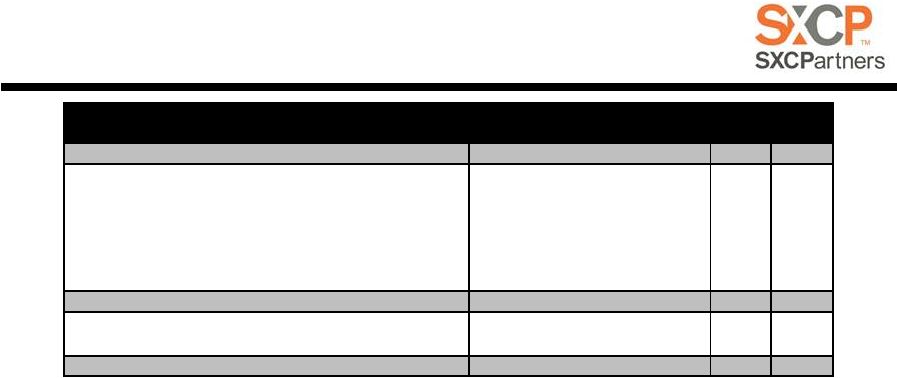
 2018 Capital Expenditures
(1) Environmental Remediation cost at Granite City, which was pre-funded from dropdown proceeds. FY 2017 results exclude $1.1M of
capitalized interest. 26
Continued execution of Granite City Gas Sharing project in 2018
• Anticipate ~$35M of CapEx in 2018 to complete project (~$55M
in total in ‘17 & ‘18) Anticipate additional ongoing expenditures for one-time coke improvement
projects SXCP Q1 2018 Earnings Call 100% Basis ($ in millions) FY 2017 FY 2018E Ongoing $19 $25 Other / Expansion $1 $1 Environmental Project (Gas Sharing) (1) $18 $35 Total CapEx $38 $61 |
 Thermal Coal Export Profitability
API 2 Benchmark ($13) BTU Premium Sulfur Penalty Ocean Freight Metric to Short Conversion ($8) ($21) Inland Freight Mine Netback $5 ($8) (in $ per metric tonne) Solid API2 benchmark price should continue to support CMT ILB producers’ competitiveness in maintaining viable exports (1) Netback calculation example assuming $86 per metric tonne prompt API 2 benchmark (Q1 2018 average). (2) Ocean Freight for 70,000 metric tonne US Gulf/ARA Coal Panamax freight. (3) Consists of CN rail transportation from ILB coal mines to CMT and terminal transloading costs.
(1) (2) Believe ILB export thermal solidly profitable at Q1 ‘18 API2 benchmark pricing of ~$86/t • Based on average ILB cash cost, netback calculation implies attractive margins CMT well-positioned to serve existing ILB thermal coal producers (in $ per short ton) (3) 27 SXCP Q1 2018 Earnings Call $86 $41 |