Attached files
| file | filename |
|---|---|
| EX-32.2 - EX-32.2 - NovoCure Ltd | nvcr-ex322_6.htm |
| EX-32.1 - EX-32.1 - NovoCure Ltd | nvcr-ex321_9.htm |
| EX-31.2 - EX-31.2 - NovoCure Ltd | nvcr-ex312_7.htm |
| EX-31.1 - EX-31.1 - NovoCure Ltd | nvcr-ex311_8.htm |
| EX-10.1 - EX-10.1 LOAN AND SECURITY AGREEMENT - NovoCure Ltd | nvcr-ex101_177.htm |
UNITED STATES
SECURITIES AND EXCHANGE COMMISSION
(Mark One)
|
☒ |
QUARTERLY REPORT PURSUANT TO SECTION 13 OR 15(d) OF THE SECURITIES EXCHANGE ACT OF 1934 |
For the quarterly period ended March 31, 2018
or
|
☐ |
TRANSITION REPORT PURSUANT TO SECTION 13 OR 15(d) OF THE SECURITIES EXCHANGE ACT OF 1934 |
For the transition period from to
Commission File Number 001-37565
(Exact Name of Registrant as Specified in Its Charter)
|
Jersey |
|
98-1057807 |
|
(State or Other Jurisdiction of |
|
(I.R.S. Employer |
|
Incorporation or Organization) |
|
Identification No.) |
No. 4 The Forum
Grenville Street
St. Helier, Jersey JE2 4UF
(Address of principal executive offices)
+44 (0) 15 3475 6700
(Registrant’s Telephone Number, Including Area Code)
(Former Name, Former Address and Former Fiscal Year, If Changed Since Last Report)
Indicate by check mark whether the registrant (1) has filed all reports required to be filed by Section 13 or 15(d) of the Securities Exchange Act of 1934 during the preceding 12 months (or for such shorter period that the registrant was required to file such reports) and (2) has been subject to such filing requirements for the past 90 days. Yes ☒ No ☐.
Indicate by check mark whether the registrant has submitted electronically and posted on its corporate Web site, if any, every Interactive Data File required to be submitted and posted pursuant to Rule 405 of Regulation S-T (§232.405 of this chapter) during the preceding 12 months (or for such shorter period that the registrant was required to submit and post such files). Yes ☒ No ☐.
Indicate by check mark whether the registrant is a large accelerated filer, an accelerated filer, a non-accelerated filer, a smaller reporting company or an emerging growth company. See definitions of “large accelerated filer,” “accelerated filer,” “smaller reporting company” and “emerging growth company” in Rule 12b-2 of the Exchange Act. (Check one):
|
Large accelerated filer |
|
☒ |
|
Accelerated filer |
|
☐ |
|
|
|
|
|
|||
|
Non-accelerated filer |
|
☐ (Do not check if a smaller reporting company) |
|
Smaller reporting company |
|
☐ |
|
|
|
|
|
|
|
|
|
|
|
|
|
Emerging growth company |
|
☐ |
If an emerging growth company, indicate by check mark if the registrant has elected not to use the extended transition period for complying with any new or revised financial accounting standards provided pursuant to Section 13(a) of the Exchange Act. ☐
Indicate by check mark whether the registrant is a shell company (as defined in Rule 12b-2 of the Exchange Act). Yes ☐ No ☒.
Indicate the number of shares outstanding of each of the registrant’s classes of common stock, as of the latest practicable date.
|
Class |
|
Outstanding as of April 19, 2018 |
|
Ordinary shares, no par value |
|
90,699,068 Shares |
CAUTIONARY NOTE REGARDING FORWARD-LOOKING STATEMENTS
In addition to historical facts or statements of current condition, this report contains forward-looking statements within the meaning of Section 27A of the Securities Act of 1933, as amended, and Section 21E of the Securities Exchange Act of 1934, as amended. Forward-looking statements contained in this report are based on our current plans, expectations, hopes, beliefs, intentions or strategies concerning future developments and their impact on us. Forward-looking statements contained in this report constitute our expectations or forecasts of future events as of the date this report was filed with the Securities and Exchange Commission and are not statements of historical fact. You can identify these statements by the fact that they do not relate strictly to historical or current facts. Such statements may include words such as “anticipate,” “will,” “estimate,” “expect,” “project,” “intend,” “should,” “plan,” “believe,” “hope,” and other words and terms of similar meaning in connection with any discussion of, among other things, future operating or financial performance, strategic initiatives and business strategies, regulatory or competitive environments, our intellectual property and delivery system research and development. In particular, these forward-looking statements include, among others, statements about:
|
|
• |
our research and development, clinical trial and commercialization activities and projected expenditures; |
|
|
• |
the further commercialization of Optune®, our first Tumor Treating Fields delivery system, and our other Tumor Treating Fields delivery system candidates; |
|
|
• |
our business strategies and the expansion of our sales and marketing efforts in the United States and in other countries; |
|
|
• |
the market acceptance of Optune and our other Tumor Treating Fields delivery systems by patients, physicians, third-party payers and others in the healthcare and scientific community; |
|
|
• |
our plans to pursue the use of Tumor Treating Fields for the treatment of solid tumor cancers other than glioblastoma (“GBM”); |
|
|
• |
our estimates regarding revenues, expenses, capital requirements and needs for additional financing; |
|
|
• |
our ability to obtain regulatory approvals for the use of Tumor Treating Fields in cancers other than GBM and any future delivery systems; |
|
|
• |
our ability to acquire the supplies needed to manufacture our delivery systems from third-party suppliers; |
|
|
• |
our ability to manufacture adequate supply; |
|
|
• |
our ability to secure adequate coverage from third-party payers to reimburse us for our delivery systems; |
|
|
• |
our ability to receive reimbursement from third-party payers for use of our delivery systems; |
|
|
• |
our ability to maintain and develop our intellectual property position; |
|
|
• |
the impact of acts of terrorism, cybersecurity attacks or intrusions; |
|
|
• |
our cash needs; |
|
|
• |
our ongoing legal proceedings and tax audits; and |
|
|
• |
our prospects, financial condition and results of operations. |
These forward-looking statements involve a number of risks and uncertainties (some of which are beyond our control) or other assumptions that may cause actual results or performance to be materially different from those expressed or implied by these forward-looking statements. Should one or more of these risks or uncertainties materialize, or should any of our assumptions prove incorrect, actual results may vary in material respects from those projected in these forward-looking statements. Factors which may cause such differences to occur include those risks and uncertainties set forth under Part I, Item 1A., “Risk Factors” of our Annual Report on Form 10-K for the fiscal year ended December 31, 2017, as well as other risks and uncertainties set forth from time to time in the reports we file with the U.S. Securities and Exchange Commission. We do not intend to update publicly any forward-looking statement, whether as a result of new information, future events or otherwise, except as required by law.
This Quarterly Report on Form 10-Q includes trademarks of NovoCure Limited and other persons. All trademarks or trade names referred to herein are the property of their respective owners.
ii
Quarterly Report on Form 10-Q
|
|
|
|
|
Page |
||
|
|
ii |
|||||
|
|
ii |
|||||
|
|
||||||
|
|
||||||
|
Item 1. |
|
|
2 |
|||
|
Item 2. |
|
Management’s Discussion and Analysis of Financial Condition and Results of Operations |
|
13 |
||
|
Item 3. |
|
|
19 |
|||
|
Item 4. |
|
|
19 |
|||
|
|
||||||
|
|
||||||
|
Item 1. |
|
|
20 |
|||
|
Item 1A. |
|
|
20 |
|||
|
Item 2. |
|
|
20 |
|||
|
Item 3. |
|
|
20 |
|||
|
Item 4. |
|
|
20 |
|||
|
Item 5. |
|
|
20 |
|||
|
Item 6. |
|
|
21 |
|||
|
|
||||||
|
|
|
|
22 |
|||
- 1 -
NOVOCURE LIMITED AND SUBSIDIARIES
U.S. dollars in thousands
|
|
|
March 31, |
|
|
December 31, |
|
||
|
|
|
2018 |
|
|
2017 |
|
||
|
|
|
Unaudited |
|
|
Audited |
|
||
|
ASSETS |
|
|
|
|
|
|
|
|
|
|
|
|
|
|
|
|
|
|
|
CURRENT ASSETS: |
|
|
|
|
|
|
|
|
|
Cash and cash equivalents |
|
$ |
111,603 |
|
|
$ |
78,592 |
|
|
Short-term investments |
|
|
104,712 |
|
|
|
104,719 |
|
|
Restricted cash |
|
|
2,158 |
|
|
|
2,126 |
|
|
Trade receivables |
|
|
34,044 |
|
|
|
29,567 |
|
|
Receivables and prepaid expenses |
|
|
9,939 |
|
|
|
8,105 |
|
|
Inventories |
|
|
20,386 |
|
|
|
22,025 |
|
|
Total current assets |
|
|
282,842 |
|
|
|
245,134 |
|
|
|
|
|
|
|
|
|
|
|
|
LONG-TERM ASSETS: |
|
|
|
|
|
|
|
|
|
Property and equipment, net |
|
|
8,902 |
|
|
|
9,031 |
|
|
Field equipment, net |
|
|
9,020 |
|
|
|
9,036 |
|
|
Severance pay fund |
|
|
113 |
|
|
|
111 |
|
|
Other long-term assets |
|
|
2,602 |
|
|
|
1,986 |
|
|
Total long-term assets |
|
|
20,637 |
|
|
|
20,164 |
|
|
|
|
|
|
|
|
|
|
|
|
TOTAL ASSETS |
|
$ |
303,479 |
|
|
$ |
265,298 |
|
The accompanying notes are an integral part of these unaudited consolidated financial statements.
- 2 -
NOVOCURE LIMITED AND SUBSIDIARIES
CONSOLIDATED BALANCE SHEETS
U.S. dollars in thousands (except share data)
|
|
|
March 31, |
|
|
December 31, |
|
||
|
|
|
2018 |
|
|
2017 |
|
||
|
|
|
Unaudited |
|
|
Audited |
|
||
|
LIABILITIES AND SHAREHOLDERS' EQUITY |
|
|
|
|
|
|
|
|
|
|
|
|
|
|
|
|
|
|
|
CURRENT LIABILITIES: |
|
|
|
|
|
|
|
|
|
Trade payables |
|
$ |
19,419 |
|
|
$ |
17,206 |
|
|
Other payables and accrued expenses |
|
|
25,340 |
|
|
|
32,996 |
|
|
Total current liabilities |
|
|
44,759 |
|
|
|
50,202 |
|
|
|
|
|
|
|
|
|
|
|
|
LONG-TERM LIABILITIES: |
|
|
|
|
|
|
|
|
|
Long-term loan, net of discount and issuance costs |
|
|
149,160 |
|
|
|
97,342 |
|
|
Employee benefit liabilities |
|
|
2,522 |
|
|
|
2,453 |
|
|
Other long-term liabilities |
|
|
920 |
|
|
|
1,737 |
|
|
Total long-term liabilities |
|
|
152,602 |
|
|
|
101,532 |
|
|
|
|
|
|
|
|
|
|
|
|
TOTAL LIABILITIES |
|
|
197,361 |
|
|
|
151,734 |
|
|
|
|
|
|
|
|
|
|
|
|
COMMITMENTS AND CONTINGENCIES |
|
|
|
|
|
|
|
|
|
|
|
|
|
|
|
|
|
|
|
SHAREHOLDERS' EQUITY: |
|
|
|
|
|
|
|
|
|
Share capital - |
|
|
|
|
|
|
|
|
|
Ordinary shares no par value, unlimited shares authorized; issued and outstanding: 90,398,901 shares and 89,478,032 shares at March 31, 2018 (unaudited) and December 31, 2017, respectively |
|
|
- |
|
|
|
- |
|
|
Additional paid-in capital |
|
|
708,266 |
|
|
|
697,165 |
|
|
Accumulated other comprehensive loss |
|
|
(1,328 |
) |
|
|
(1,343 |
) |
|
Accumulated deficit |
|
|
(600,820 |
) |
|
|
(582,258 |
) |
|
Total shareholders' equity |
|
|
106,118 |
|
|
|
113,564 |
|
|
|
|
|
|
|
|
|
|
|
|
TOTAL LIABILITIES AND SHAREHOLDERS' EQUITY |
|
$ |
303,479 |
|
|
$ |
265,298 |
|
The accompanying notes are an integral part of these unaudited consolidated financial statements.
- 3 -
NOVOCURE LIMITED AND SUBSIDIARIES
CONSOLIDATED STATEMENTS OF OPERATIONS
U.S. dollars in thousands (except share and per share data)
|
|
|
Three months ended March 31, |
|
|
Year ended December 31, |
|
||||||
|
|
|
2018 |
|
|
2017 |
|
|
2017 |
|
|||
|
|
|
Unaudited |
|
|
Audited |
|
||||||
|
Net revenues |
|
$ |
52,125 |
|
|
$ |
34,880 |
|
|
$ |
177,026 |
|
|
Cost of revenues |
|
|
18,238 |
|
|
|
11,664 |
|
|
|
55,609 |
|
|
|
|
|
|
|
|
|
|
|
|
|
|
|
|
Gross profit |
|
|
33,887 |
|
|
|
23,216 |
|
|
|
121,417 |
|
|
|
|
|
|
|
|
|
|
|
|
|
|
|
|
Operating costs and expenses: |
|
|
|
|
|
|
|
|
|
|
|
|
|
Research, development and clinical trials |
|
|
11,104 |
|
|
|
9,411 |
|
|
|
38,103 |
|
|
Sales and marketing |
|
|
18,135 |
|
|
|
14,756 |
|
|
|
63,528 |
|
|
General and administrative |
|
|
17,325 |
|
|
|
12,422 |
|
|
|
59,114 |
|
|
|
|
|
|
|
|
|
|
|
|
|
|
|
|
Total operating costs and expenses |
|
|
46,564 |
|
|
|
36,589 |
|
|
|
160,745 |
|
|
|
|
|
|
|
|
|
|
|
|
|
|
|
|
Operating loss |
|
|
(12,677 |
) |
|
|
(13,373 |
) |
|
|
(39,328 |
) |
|
Financial expenses, net |
|
|
4,853 |
|
|
|
2,446 |
|
|
|
9,169 |
|
|
|
|
|
|
|
|
|
|
|
|
|
|
|
|
Loss before income taxes |
|
|
(17,530 |
) |
|
|
(15,819 |
) |
|
|
(48,497 |
) |
|
Income taxes |
|
|
3,194 |
|
|
|
2,226 |
|
|
|
13,165 |
|
|
|
|
|
|
|
|
|
|
|
|
|
|
|
|
Net loss |
|
$ |
(20,724 |
) |
|
$ |
(18,045 |
) |
|
$ |
(61,662 |
) |
|
|
|
|
|
|
|
|
|
|
|
|
|
|
|
Basic and diluted net loss per ordinary share |
|
$ |
(0.23 |
) |
|
$ |
(0.21 |
) |
|
$ |
(0.70 |
) |
|
|
|
|
|
|
|
|
|
|
|
|
|
|
|
Weighted average number of ordinary shares used in computing basic and diluted net loss per share |
|
|
89,985,612 |
|
|
|
87,452,983 |
|
|
|
88,546,719 |
|
CONSOLIDATED STATEMENTS OF COMPREHENSIVE INCOME (LOSS)
U.S. dollars in thousands
|
|
|
Three months ended March 31, |
|
|
Year ended December 31, |
|
||||||
|
|
|
2018 |
|
|
2017 |
|
|
2017 |
|
|||
|
|
|
Unaudited |
|
|
Audited |
|
||||||
|
Net loss |
|
$ |
(20,724 |
) |
|
$ |
(18,045 |
) |
|
$ |
(61,662 |
) |
|
Other comprehensive income (loss), net of tax: |
|
|
|
|
|
|
|
|
|
|
|
|
|
Change in foreign currency translation adjustments |
|
|
10 |
|
|
|
11 |
|
|
|
8 |
|
|
Pension benefit plan |
|
|
5 |
|
|
|
(49 |
) |
|
|
532 |
|
|
Total comprehensive loss |
|
$ |
(20,709 |
) |
|
$ |
(18,083 |
) |
|
$ |
(61,122 |
) |
The accompanying notes are an integral part of these unaudited consolidated financial statements.
- 4 -
NOVOCURE LIMITED AND SUBSIDIARIES
CONSOLIDATED STATEMENTS OF CHANGES IN SHAREHOLDERS’ EQUITY
U.S. dollars in thousands (except share data)
|
|
|
Ordinary shares |
|
|
Additional paid-in |
|
|
Accumulated other comprehensive |
|
|
Accumulated |
|
|
Total shareholders' |
|
|||||
|
|
|
Shares |
|
|
capital |
|
|
loss |
|
|
deficit |
|
|
equity |
|
|||||
|
Balance as of December 31, 2017 (audited) |
|
|
89,478,032 |
|
|
$ |
697,165 |
|
|
$ |
(1,343 |
) |
|
$ |
(582,258 |
) |
|
$ |
113,564 |
|
|
|
|
|
|
|
|
|
|
|
|
|
|
|
|
|
|
|
|
|
|
|
|
Share-based compensation to employees |
|
|
- |
|
|
|
8,520 |
|
|
|
- |
|
|
|
- |
|
|
|
8,520 |
|
|
Exercise of options and warrants |
|
|
920,869 |
|
|
|
2,581 |
|
|
|
- |
|
|
|
- |
|
|
|
2,581 |
|
|
Cumulative effect adjustment on retained earnings (*) |
|
|
- |
|
|
|
|
|
|
|
- |
|
|
|
2,162 |
|
|
|
2,162 |
|
|
Other comprehensive income, net of tax benefit of $5 |
|
|
- |
|
|
|
- |
|
|
|
15 |
|
|
|
- |
|
|
|
15 |
|
|
Net loss |
|
|
- |
|
|
|
- |
|
|
|
- |
|
|
|
(20,724 |
) |
|
|
(20,724 |
) |
|
Balance as of March 31, 2018 (Unaudited) |
|
|
90,398,901 |
|
|
$ |
708,266 |
|
|
$ |
(1,328 |
) |
|
$ |
(600,820 |
) |
|
$ |
106,118 |
|
|
|
|
|
|
|
|
|
|
|
|
|
|
|
|
|
|
|
|
|
|
|
|
(*) |
Resulting from the adoption of ASC 606. |
The accompanying notes are an integral part of these unaudited consolidated financial statements.
- 5 -
NOVOCURE LIMITED AND SUBSIDIARIES
CONSOLIDATED STATEMENTS OF CASH FLOWS
U.S. dollars in thousands
|
|
|
Three months ended March 31, |
|
|
Year ended December 31, |
|
||||||
|
|
|
2018 |
|
|
2017 |
|
|
2017 |
|
|||
|
|
|
Unaudited |
|
|
Audited |
|
||||||
|
Cash flows from operating activities: |
|
|
|
|
|
|
|
|
|
|
|
|
|
Net loss |
|
$ |
(20,724 |
) |
|
$ |
(18,045 |
) |
|
$ |
(61,662 |
) |
|
Adjustments to reconcile net loss to net cash provided by (used in) operating activities: |
|
|
|
|
|
|
|
|
|
|
|
|
|
Depreciation and amortization |
|
|
2,203 |
|
|
|
1,660 |
|
|
|
7,677 |
|
|
Asset write-downs and impairment of field equipment |
|
|
49 |
|
|
|
75 |
|
|
|
241 |
|
|
Share-based compensation to employees |
|
|
8,520 |
|
|
|
4,561 |
|
|
|
27,116 |
|
|
Increase in trade receivables |
|
|
(1,672 |
) |
|
|
(5,486 |
) |
|
|
(23,228 |
) |
|
Amortization of discount |
|
|
2,427 |
|
|
|
106 |
|
|
|
252 |
|
|
Decrease (increase) in receivables and prepaid expenses |
|
|
(1,834 |
) |
|
|
(4,815 |
) |
|
|
1,979 |
|
|
Decrease (increase) in inventories |
|
|
1,638 |
|
|
|
(400 |
) |
|
|
3,524 |
|
|
Increase in other long-term assets |
|
|
(620 |
) |
|
|
(256 |
) |
|
|
(554 |
) |
|
Increase (decrease) in trade payables |
|
|
2,213 |
|
|
|
(3,557 |
) |
|
|
(1,150 |
) |
|
Increase (decrease) in other payables and accrued expenses |
|
|
(8,300 |
) |
|
|
(1,410 |
) |
|
|
14,460 |
|
|
Increase in employee benefit liabilities, net |
|
|
76 |
|
|
|
109 |
|
|
|
440 |
|
|
Increase (decrease) in other long-term liabilities |
|
|
(800 |
) |
|
|
550 |
|
|
|
(2,229 |
) |
|
Net cash used in operating activities |
|
$ |
(16,824 |
) |
|
$ |
(26,908 |
) |
|
$ |
(33,134 |
) |
|
|
|
|
|
|
|
|
|
|
|
|
|
|
|
Cash flows from investing activities: |
|
|
|
|
|
|
|
|
|
|
|
|
|
Purchase of property and equipment |
|
$ |
(737 |
) |
|
$ |
(1,031 |
) |
|
$ |
(2,459 |
) |
|
Purchase of field equipment |
|
|
(1,370 |
) |
|
|
(1,402 |
) |
|
|
(4,907 |
) |
|
Proceeds from maturity of short-term investments |
|
|
45,000 |
|
|
|
60,000 |
|
|
|
120,000 |
|
|
Purchase of short-term investments |
|
|
(44,750 |
) |
|
|
(44,654 |
) |
|
|
(104,006 |
) |
|
Net cash provided by (used in) investing activities |
|
$ |
(1,857 |
) |
|
$ |
12,913 |
|
|
$ |
8,628 |
|
|
|
|
|
|
|
|
|
|
|
|
|
|
|
|
Cash flows from financing activities: |
|
|
|
|
|
|
|
|
|
|
|
|
|
Proceeds from issuance of shares, net |
|
$ |
- |
|
|
$ |
- |
|
|
$ |
1,540 |
|
|
Proceeds from long-term loan, net |
|
|
149,150 |
|
|
|
- |
|
|
|
- |
|
|
Proceeds from other long-term loans |
|
|
- |
|
|
|
- |
|
|
|
19 |
|
|
Repayment of long-term loan |
|
|
(100,000 |
) |
|
|
- |
|
|
|
- |
|
|
Repayment of other long-term loan |
|
|
(17 |
) |
|
|
(18 |
) |
|
|
(76 |
) |
|
Exercise of options and warrants |
|
|
2,581 |
|
|
|
77 |
|
|
|
3,685 |
|
|
Net cash provided by financing activities |
|
$ |
51,714 |
|
|
$ |
59 |
|
|
$ |
5,168 |
|
|
|
|
|
|
|
|
|
|
|
|
|
|
|
|
Effect of exchange rate changes on cash and cash equivalents |
|
$ |
10 |
|
|
$ |
11 |
|
|
$ |
8 |
|
|
|
|
|
|
|
|
|
|
|
|
|
|
|
|
Increase (decrease) in cash, cash equivalents and restricted cash |
|
|
33,043 |
|
|
|
(13,925 |
) |
|
|
(19,330 |
) |
|
Cash, cash equivalents and restricted cash at beginning of period |
|
|
80,718 |
|
|
|
100,048 |
|
|
|
100,048 |
|
|
|
|
|
|
|
|
|
|
|
|
|
|
|
|
Cash, cash equivalents and restricted cash at the end of the period |
|
$ |
113,761 |
|
|
$ |
86,123 |
|
|
$ |
80,718 |
|
|
|
|
|
|
|
|
|
|
|
|
|
|
|
|
Supplemental cash flow activities: |
|
|
|
|
|
|
|
|
|
|
|
|
|
Cash paid during the period for: |
|
|
|
|
|
|
|
|
|
|
|
|
|
Income taxes |
|
$ |
3,758 |
|
|
$ |
3,402 |
|
|
$ |
10,286 |
|
|
Interest |
|
$ |
3,009 |
|
|
$ |
2,508 |
|
|
$ |
10,162 |
|
The accompanying notes are an integral part of these unaudited consolidated financial statements.
- 6 -
NOVOCURE LIMITED AND SUBSIDIARIES
NOTES TO UNAUDITED CONSOLIDATED FINANCIAL STATEMENTS
U.S. dollars in thousands (except share data)
NOTE 1: ORGANIZATION AND BASIS OF PRESENTATION
Organization. NovoCure Limited (including its consolidated subsidiaries, the “Company”) was incorporated in the Bailiwick of Jersey and is principally engaged in the development, manufacture and commercialization of Tumor Treating Fields for the treatment of solid tumors. The Company has regulatory approvals and clearances in certain countries for Optune, its first Tumor Treating Fields delivery system, to treat adult patients with glioblastoma (“GBM”).
Financial statement preparation. The accompanying consolidated financial statements include the accounts of the Company and its consolidated subsidiaries, and intercompany accounts and transactions have been eliminated. In the opinion of the Company’s management, the consolidated financial statements reflect all adjustments, which are normal and recurring in nature, necessary for fair financial statement presentation. The preparation of these consolidated financial statements in conformity with U.S. generally accepted accounting principles (“GAAP”) requires management to make estimates and assumptions that affect the amounts reported in these consolidated financial statements and accompanying notes. Actual results could differ materially from those estimates. These consolidated financial statements and accompanying notes should be read in conjunction with the Company’s annual consolidated financial statements and the notes thereto included in the Company’s Annual Report on Form 10-K for the fiscal year ended December 31, 2017 (the “2017 10-K”) filed with the Securities and Exchange Commission (the “SEC”) on February 22, 2018.
The significant accounting policies applied in the audited annual consolidated financial statements of the Company as disclosed in the 2017 10-K are applied consistently in these unaudited interim consolidated financial statements, except as noted below:
Recently Adopted Accounting Pronouncements. In May 2014, FASB issued ASU 2014-09, Revenue from Contracts with Customers (Topic 606) (ASU 2014-09), an updated standard on revenue recognition and issued subsequent amendments to the initial guidance in March 2016, April 2016, May 2016 and December 2016 within ASU 2016-08, 2016-10, 2016-12 and 2016-20, respectively (collectively, “ASC 606”). The core principle of the new standard is for companies to recognize revenue to depict the transfer of goods and services to patients in amounts that reflect the consideration to which the company expects to be entitled in exchange for those goods and services. In addition, the new standard requires expanded disclosures. The Company has adopted the standard effective January 1, 2018 using the modified retrospective method for all contracts. The reported results for 2018 reflect the application of ASC 606 guidance while the reported results for 2017 were prepared under the guidance of ASC 605, Revenue Recognition (ASC 605). The amount of revenue recognized in 2018 reflects the consideration to which the Company expects to be entitled to receive in exchange for Optune.
In preparation for adoption of the standard, the Company has implemented internal controls and key system functionality to enable the preparation of financial information, including the assessment of the impact of the standard. The Company uses the portfolio approach to apply the standard to portfolios of contracts with similar characteristics. Adoption of the standard resulted in an increase to trade receivables of $2,807, deferred revenues of $645 and a cumulative impact to the Company's accumulated deficit as of January 1, 2018 of $2,162.
Optune is comprised of two main components: (1) an electric field generator and (2) transducer arrays and related accessories. We retain title to the electric field generator, and the patient is provided replacement transducer arrays and technical support for the device during the term of treatment. The electric field generator and transducer arrays are always supplied and function together and are not sold on a standalone basis.
To recognize revenue under ASC 606, the Company applies the following five steps:
1. Identify the contract with a patient. A contract with a patient exists when (i) the Company enters into an enforceable contract with a patient that defines each party’s rights regarding delivery of and payment for Optune, (ii) the contract has commercial substance and (iii) the Company determines that collection of substantially all consideration for Optune is probable based on the payer’s intent and ability to pay the promised consideration. The evidence of a contract generally consists of a prescription, a patient service agreement and the verification of the assigned payer (“Payer”) for the contract and intention to collect.
2. Identify the performance obligations in the contract. Optune contracts include the lease of the device, the supply obligation of disposable transducer arrays and technical support for the term of treatment. To the extent a contract includes multiple promised products and/or services, the Company must apply judgment to determine whether those products and/or services are capable of being distinct in the context of the contract. If these criteria are not met the promised products and/or services are accounted for as
- 7 -
a combined performance obligation. In the Company’s case, Optune’s device, support, and disposables are provided as one inseparable package of monthly treatment for a single monthly fee.
3. Determine the transaction price. The transaction price is determined based on the consideration to which the Company will be entitled in exchange for providing Optune to the patient. To the extent the transaction price includes variable consideration, the Company estimates the amount of variable consideration that should be included in the transaction price utilizing either the expected value method or the most likely amount method depending on the nature of the variable consideration. Variable consideration is included in the transaction price if, in the Company’s judgment, it is probable that a significant future reversal of cumulative revenue under the contract will not occur. The Company has agreements with many payers that define explicit discounts off the gross transaction price. In addition to the explicit discounts negotiated with each payer, the Company expects to receive, in aggregate for a given portfolio, less than the gross revenue net of explicit discounts. ASC 606 requires that the Company recognize this variable consideration as an implicit discount in the billing period. The implicit discount includes both an estimate of claims that will pay at an amount less than billed and an estimate of claims that will not pay within a given time horizon. The implicit discount adjustments to the transaction price are due to concessions, not collectability concerns driven by payer credit risk.
4. Allocate the transaction price to performance obligations in the contract. If a contract contains a single performance obligation, the entire transaction price is allocated to the single performance obligation. As discussed above, there is one performance obligation under the Company’s contracts and, therefore, the monthly transaction price determined for the performance obligation will be recognized over time ratably over the monthly term of the treatment.
5. Recognize revenue when or as the Company satisfies a performance obligation. The Company satisfies performance obligations over time as discussed above. Revenue is recognized at the time the related performance obligation is satisfied by transferring a promised service to a patient. The patient consumes the benefits of Optune treatment on a daily basis over the monthly term. As this criterion is met, the revenues will be recognized over the monthly term.
In accordance with ASC 606, the impact of our adoption of ASC 606 on our condensed consolidated statements of income for the three months ended March 31, 2018 was a decrease in net revenues of $3,538, a decrease in tax expenses of $202, an increase in net loss of $3,336 and a decrease in our basic and diluted net loss per ordinary share of $0.04. The impact of our adoption of Topic 606 on our balance sheet as of March 31, 2018 was a decrease in trade receivables of $1,172, an increase to other payables and accrued expenses (deferred revenues net of tax provision) of $884 and an accumulated deficit as of March 31, 2018 of $1,174.
In August 2016, FASB issued ASU 2016-15, Statement of Cash Flows (Topic 230) Classification of Certain Cash Receipts and Cash Payments. ASU 2016-15 eliminates the diversity in practice related to the classification of certain cash receipts and payments for debt prepayment or extinguishment costs, the maturing of a zero coupon bond, the settlement of contingent liabilities arising from a business combination, proceeds from insurance settlements, distributions from certain equity method investees and beneficial interests obtained in a financial asset securitization. ASU 2016-15 designates the appropriate cash flow classification, including requirements to allocate certain components of these cash receipts and payments among operating, investing and financing activities. The retrospective transition method, requiring adjustment to all comparative periods presented, is required unless it is impracticable for some of the amendments, in which case those amendments would be prospectively as of the earliest date practicable. The Company adopted the standard effective as of January 1, 2018, and the adoption of this standard did not have an impact on the Company's consolidated financial statements.
In November 2016, FASB issued ASU 2016-18, Statement of Cash Flows (Topic 230): Restricted Cash. This standard requires the presentation of the statement of cash flows to show the changes in the total of cash, cash equivalents, restricted cash and restricted cash equivalents. The standard is effective for fiscal years and the interim periods within those fiscal years beginning after December 15, 2017. The Company adopted the standard retrospectively to all periods presented effective as of January 1, 2018.
Recent Accounting Pronouncements. In February 2016, FASB issued ASU 2016-02-Leases (ASC 842), which sets out the principles for the recognition, measurement, presentation and disclosure of leases for both parties to a contract (i.e. lessees and lessors). The new standard requires lessees to apply a dual approach, classifying leases as either finance or operating leases based on the principle of whether or not the lease is effectively a financed purchase by the lessee. This classification will determine whether lease expense is recognized based on an effective interest method or on a straight line basis over the term of the lease, respectively. A lessee is also required to record a right-of-use asset and a lease liability for all leases with a term of greater than twelve months regardless of their classification. Leases with a term of twelve months or less will be accounted for similar to existing guidance for operating leases. The new standard requires lessors to account for leases using an approach that is substantially equivalent to existing guidance for sales-type leases, direct financing leases and operating leases. ASC 842 supersedes the previous leases standard, ASC 840. The standard is effective on January 1, 2019, with early adoption permitted. The Company currently anticipates adopting the new standard effective January 1, 2019 and is evaluating the impact of the adoption of this standard on its consolidated financial statements.
- 8 -
In June 2016, FASB issued ASU 2016-13, Financial Instruments - Credit Losses (Topic 326): Measurement of Credit Losses on Financial Instruments. ASU 2016-13 amends the impairment model to utilize an expected loss methodology in place of the currently used incurred loss methodology, which will result in the more timely recognition of losses. ASU 2016-13 also applies to employee benefit plan accounting, with an effective date of the first quarter of fiscal 2020. The amendments in this update are effective for fiscal years beginning after December 31, 2019, including interim periods within those fiscal years. The Company is currently assessing the impact of the adoption of this standard on its consolidated financial statements, footnote disclosures and employee benefit plans’ accounting.
NOTE 2: SHORT-TERM INVESTMENTS
The Company invests in marketable U.S. Treasury Bills (“T-bills”) that are classified as held-to-maturity securities. The amortized cost and recorded basis of the T-bills are presented as short-term investments in the amount of $104,712 and $104,719 as of March 31, 2018 and December 31, 2017, respectively, and their estimated fair value as of March 31, 2018 and December 31, 2017 was $104,658 and $104,655, respectively.
NOTE 3: INVENTORIES
Inventories are stated at the lower of cost or market. The weighted average methodology is applied to determine cost. As of March 31, 2018 and December 31, 2017, the Company’s inventories were composed of:
|
|
|
March 31, |
|
|
December 31, |
|
||
|
|
|
2018 |
|
|
2017 |
|
||
|
|
|
Unaudited |
|
|
Audited |
|
||
|
Raw materials |
|
$ |
3,705 |
|
|
$ |
4,276 |
|
|
Work in progress |
|
|
6,161 |
|
|
|
8,435 |
|
|
Finished products |
|
|
10,520 |
|
|
|
9,314 |
|
|
Total |
|
$ |
20,386 |
|
|
$ |
22,025 |
|
NOTE 4: COMMITMENTS AND CONTINGENT LIABILITIES
The facilities of the Company are leased under various operating lease agreements for periods ending no later than 2024. The Company also leases motor vehicles under various operating leases, which expire on various dates, the latest of which is in 2021.
As of March 31, 2018 and December 31, 2017, the Company pledged bank deposits of $1,043 and $1,038, respectively, to cover bank guarantees in respect of its leases of operating facilities and obtained bank guarantees for the fulfillment of the Company’s lease and other contractual commitments of $1,208 and $1,202, respectively.
In the first quarter of 2018, the Company made a milestone payment of $5.5 million (the “Milestone Payment”) to the Technion Research and Development Foundation (“Technion”) pursuant to the settlement agreement dated February 10, 2015 (the “Settlement Agreement”). Pursuant to the Settlement Agreement, and in exchange for a release of potential disputes regarding intellectual property developed by our founder and previously assigned to us, the Company was obligated to pay the Milestone Payment to Technion in the quarter following the quarter in which the Company achieved $250.0 million of cumulative net sales (as defined in the Settlement Agreement) (the “Net Sales Milestone”). The Company achieved the Net Sales Milestone in the fourth quarter of 2017.
NOTE 5: LONG TERM LOAN
On February 7, 2018, the Company and certain of its subsidiaries entered into a Loan and Security Agreement (“2018 Loan Agreement”) with BioPharma Credit PLC pursuant to which such lender made a term loan to the Company in the principal amount of $150 million (the “2018 Credit Facility”). The term loan, which was drawn in full upon execution of the 2018 Loan Agreement, bears interest at 9.0% per annum, payable quarterly in arrears. The Company used a portion of the proceeds of the 2018 Credit Facility to repay in full the Company’s obligations under its existing term loan credit facility and will use the remaining proceeds to fund general corporate purposes.
The 2018 Credit Facility will mature on February 7, 2023, at which time any unpaid principal and accrued unpaid interest in respect of the term loan will be due and payable. The Company may prepay the term loan, in full, at any time. The Company must prepay the term loan (i) in full or in part upon the entry into certain licensing arrangements and (ii) in full in the event of a change of control. In each case, any prepayment (whether permitted or mandatory) is subject to a prepayment premium and/or make-whole payment. The
- 9 -
pre-payment fee if the Company prepays outstanding loan amounts prior to February 7, 2021 is 2.0% and is 1.0% if made after the February 7, 2021 but prior to February 7, 2022.
All obligations under the 2018 Credit Facility are guaranteed by the Company’s current and future direct and indirect subsidiaries. In addition, the obligations under the 2018 Credit Facility are secured by a first-priority security interest in substantially all of the property and assets of, as well as the equity interests owned by, the Company and certain of the other guarantors. The 2018 Credit Facility contains other customary covenants.
Total issuance costs of the 2018 Credit Facility, which were $840 as of March 31, 2018, are presented net of the 2018 Credit Facility proceeds and are amortized to interest expense over the five year term of the loan using the effective interest method.
On February 7, 2018, the Company’s 2015 term loan credit facility was terminated upon the Company’s repayment in full of the term loan issued thereunder. The un-amortized discount in the amount of $1,160 and issuance costs in the amount of $1,399 were fully amortized and the amortization is included in finance expenses.
NOTE 6: SHARE CAPITAL
For the three months ended March 31, 2018, warrants to purchase 201,692 ordinary shares with an exercise price of $3.59 per share were cashlessly exercised, resulting in the issuance of 167,212 ordinary shares. Also, warrants to purchase 1,549 ordinary shares with an exercise price of $3.59 per share were exercised for cash. For the three months ended March 31, 2018, options to purchase 500,166 ordinary shares were exercised, resulting in the issuance of 495,530 ordinary shares.
NOTE 7: EQUITY INCENTIVE PLANS
In September 2015, the Company adopted the 2015 Omnibus Incentive Plan (the “2015 Plan”). Under the 2015 Plan, the Company can issue various types of equity compensation awards such as share options, restricted shares, performance shares, restricted stock units (“RSUs”), performance units, long-term cash awards and other share-based awards.
Options granted under the 2015 Plan generally have a four-year vesting period and expire ten years after the date of grant. Options granted under the 2015 Plan that are cancelled or forfeited before expiration become available for future grants. RSUs granted under the 2015 Plan vest in equal installments over a three-year period. As of March 31, 2018, 10,706,475 ordinary shares were available for grant under the 2015 Plan.
A summary of the status of the Company’s option plans as of March 31, 2018 and changes during the period then ended is presented below:
|
|
|
Three months ended March 31, 2018 |
|
|||||
|
|
|
Unaudited |
|
|||||
|
|
|
Number of options |
|
|
Weighted average exercise price |
|
||
|
Outstanding at beginning of year |
|
|
14,806,027 |
|
|
$ |
10.64 |
|
|
Granted |
|
|
1,904,634 |
|
|
|
21.15 |
|
|
Exercised |
|
|
(500,166 |
) |
|
|
5.27 |
|
|
Forfeited and cancelled |
|
|
(71,307 |
) |
|
|
11.86 |
|
|
Outstanding as of March 31, 2018 |
|
|
16,139,188 |
|
|
$ |
12.04 |
|
|
|
|
|
|
|
|
|
|
|
|
Exercisable options |
|
|
7,375,692 |
|
|
$ |
9.31 |
|
|
|
|
|
|
|
|
|
|
|
- 10 -
A summary of the status of the Company’s RSUs as of March 31, 2018 and changes during the period then ended is presented below:
|
|
|
Three months ended March 31, 2018 |
|
|||||
|
|
|
Unaudited |
|
|||||
|
|
|
Number of RSUs |
|
|
Weighted average grant date fair value price |
|
||
|
Unvested at beginning of year |
|
|
1,651,219 |
|
|
$ |
9.66 |
|
|
Granted |
|
|
427,518 |
|
|
|
21.15 |
|
|
Vested |
|
|
(256,578 |
) |
|
|
7.15 |
|
|
Forfeited and cancelled |
|
|
(7,669 |
) |
|
|
8.49 |
|
|
Unvested as of March 31, 2018 |
|
|
1,814,490 |
|
|
$ |
12.73 |
|
In September 2015, the Company adopted an employee share purchase plan (“ESPP”) to encourage and enable eligible employees to acquire ownership of the Company’s ordinary shares purchased through accumulated payroll deductions on an after-tax basis. In the United States, the ESPP is intended to be an “employee stock purchase plan” within the meaning of Section 423 of the Internal Revenue Code and the provisions of the ESPP will be construed in a manner consistent with the requirements of such section. The Company began its offerings under the ESPP on August 1, 2016. As of March 31, 2018, 2,277,705 ordinary shares were available to be purchased by eligible employees under the ESPP and 259,281 shares had been issued under the ESPP.
The fair value of share-based awards was estimated using the Black-Scholes model for all equity grants. For market condition awards, the Company also applied the Monte-Carlo simulation model, with the following underlying assumptions:
|
|
|
Three months ended March 31, |
|
|
Year ended December 31, |
|||||
|
|
|
2018 |
|
|
2017 |
|
|
2017 |
||
|
|
|
Unaudited |
|
|
Audited |
|||||
|
Stock Option Plans |
|
|
|
|
|
|
|
|
|
|
|
Expected term (years) |
|
6.25 |
|
|
6.25 |
|
|
5.5-6.25 |
||
|
Expected volatility |
|
|
55.04 |
% |
|
|
59.15 |
% |
|
56.74%-59.45% |
|
Risk-free interest rate |
|
|
2.77 |
% |
|
|
2.23 |
% |
|
1.97%-2.23% |
|
Dividend yield |
|
0.00% |
|
|
0.00% |
|
|
0.00% |
||
|
ESPP |
|
|
|
|
|
|
|
|
|
|
|
Expected term (years) |
|
0.50 |
|
|
0.50 |
|
|
0.50 |
||
|
Expected volatility |
|
|
52.58 |
% |
|
82.00% |
|
|
76.37%-82.00% |
|
|
Risk-free interest rate |
|
|
1.61 |
% |
|
0.62% |
|
|
0.62%-1.13% |
|
|
Dividend yield |
|
0.00% |
|
|
0.00% |
|
|
0.00% |
||
The total non-cash share-based compensation expense related to all of the Company’s equity-based awards recognized for the three months ended March 31, 2018 and 2017 and the year ended December 31, 2017 was:
|
|
|
Three months ended March 31, |
|
|
Year ended December 31, |
|
||||||
|
|
|
2018 |
|
|
2017 |
|
|
2017 |
|
|||
|
|
|
Unaudited |
|
|
Audited |
|
||||||
|
Cost of revenues |
|
$ |
164 |
|
|
$ |
143 |
|
|
$ |
467 |
|
|
Research, development and clinical trials |
|
|
906 |
|
|
|
862 |
|
|
|
3,587 |
|
|
Sales and marketing |
|
|
1,436 |
|
|
|
655 |
|
|
|
3,784 |
|
|
General and administrative |
|
|
6,014 |
|
|
|
2,901 |
|
|
|
19,278 |
|
|
Total share-based compensation expense |
|
$ |
8,520 |
|
|
$ |
4,561 |
|
|
$ |
27,116 |
|
- 11 -
NOTE 8: SUPPLEMENTAL INFORMATION
The Company operates in a single reportable segment.
The following table presents long-lived assets by location:
|
|
|
March 31, |
|
|
December 31, |
|
||
|
|
|
2018 |
|
|
2017 |
|
||
|
|
|
Unaudited |
|
|
Audited |
|
||
|
United States |
|
$ |
9,950 |
|
|
$ |
10,372 |
|
|
Switzerland |
|
|
5,178 |
|
|
|
5,114 |
|
|
Israel |
|
|
2,112 |
|
|
|
2,081 |
|
|
Others |
|
|
682 |
|
|
|
500 |
|
|
Total |
|
$ |
17,922 |
|
|
$ |
18,067 |
|
The Company’s revenues by geographic region, based on the customer’s location, are summarized as follows:
|
|
|
Three months ended March 31, |
|
|
Year ended December 31, |
|
||||||
|
|
|
2018 |
|
|
2017 |
|
|
2017 |
|
|||
|
|
|
Unaudited |
|
|
Audited |
|
||||||
|
United States |
|
$ |
37,802 |
|
|
$ |
29,160 |
|
|
$ |
134,688 |
|
|
EMEA (*) |
|
|
13,874 |
|
|
|
5,667 |
|
|
|
42,035 |
|
|
Japan |
|
|
449 |
|
|
|
53 |
|
|
|
303 |
|
|
Total |
|
$ |
52,125 |
|
|
$ |
34,880 |
|
|
$ |
177,026 |
|
|
|
|
|
|
|
|
|
|
|
|
|
|
|
|
(*) including Germany |
|
$ |
13,358 |
|
|
$ |
5,400 |
|
|
$ |
40,215 |
|
- 12 -
Item 2. Management’s Discussion and Analysis of Financial Condition and Results of Operations
Management’s Discussion and Analysis of Financial Condition and Results of Operations (“MD&A”) is intended to provide information to assist you in better understanding and evaluating our financial condition and results of operations. We encourage you to read this MD&A in conjunction with our consolidated financial statements and the notes thereto for the period ended March 31, 2018 included in Part I, Item 1 of this Quarterly Report on Form 10-Q. This discussion contains forward-looking statements that involve risks and uncertainties. As a result of many factors, such as those set forth under Part I, Item 1A, “Risk Factors”, of our Annual Report on Form 10-K for the fiscal year ended December 31, 2017 (the “2017 10-K”), our actual results may differ materially from those anticipated in these forward-looking statements. References to the words “we,” “our,” “us,” and the “Company” in this report refer to NovoCure Limited, including its consolidated subsidiaries.
Overview
We are a global oncology company developing a proprietary platform technology called Tumor Treating Fields, the use of electric fields tuned to specific frequencies to disrupt solid tumor cancer cell division. Our key priorities are to drive commercial adoption of Optune, our first commercial Tumor Treating Fields delivery system, for the treatment of glioblastoma (“GBM”) and to advance programs testing the efficacy and safety of Tumor Treating Fields in multiple solid tumor indications through our clinical pipeline.
We were founded in 2000 and operated as a development stage company through December 31, 2011. We initially received U.S. Food and Drug Administration (“FDA”) approval for Optune in 2011 for use as a monotherapy treatment for adult patients with GBM following confirmed recurrence after chemotherapy. In October 2015, we received FDA approval to market Optune for the treatment of adult patients with newly diagnosed GBM in combination with temozolomide, a chemotherapy drug. We have also received approval to market Optune in the European Union (“EU”), Switzerland, Japan and certain other countries. We have built a commercial organization and launched Optune in the United States, Germany, Austria, Switzerland, Israel and Japan, which we refer to as our currently active markets.
In March 2018, the National Comprehensive Cancer Network Clinical Practice Guidelines in Oncology® (NCCN Guidelines®) for Central Nervous Systems Cancers were updated to include alternating electric field therapy as a Category 1 treatment for patients with newly diagnosed GBM in conjunction with temozolomide after maximal safe resection and completion of radiation therapy. The updated recommendation follows the publication of Novocure’s EF-14 phase 3 pivotal trial five-year survival results in the Journal of the American Medical Association (JAMA) in December 2017. The EF-14 five-year survival results demonstrated Optune plus temozolomide significantly improved survival outcomes in patients with newly diagnosed GBM compared to temozolomide alone. A category 1 recommendation indicates, based upon high-level evidence, that there is uniform NCCN consensus that the intervention is appropriate.
We continue to work with payers to expand access to Optune for patients with newly diagnosed and recurrent GBM. As of March 31, 2018, we estimate that more than 217 million Americans had coverage of Optune for newly diagnosed and/or recurrent GBM. Additionally, we had signed contracts to establish Optune as an in-network benefit for more than 187 million American lives. The percentage of our U.S. active patient population who are beneficiaries of the Medicare fee-for-service program, which has denied coverage for our claims to date, continues to range from 20 to 25 percent. In Germany, we are able to bill healthcare payers for individual cases and have started the formal process to secure national reimbursement through a clinical trial. We have received national reimbursement for Optune in Japan and Austria, and we are pursuing reimbursement for Optune in Switzerland and Israel.
We have researched the biological effects of Tumor Treating Fields extensively. Tumor Treating Fields uses electric fields tuned to specific frequencies to disrupt cancer cell division, inhibiting tumor growth and causing affected cancer cells to die. Because Tumor Treating Fields is delivered regionally, acts only on dividing cells (a biological process known as mitosis) and is frequency-tuned to target cancer cells of a specific size, we believe there is minimal damage to healthy cells. We believe our pre-clinical and clinical research demonstrates that Tumor Treating Fields’ mechanism of action affects fundamental aspects of cell division and may have broad applicability across a variety of solid tumors. We have demonstrated in preclinical studies that Tumor Treating Fields can offer additive or synergistic benefits in combination with other anti-cancer agents, which may lead to greater efficacy without significantly increasing the side effects.
We believe we have a robust global patent and intellectual property portfolio, with numerous patent applications pending worldwide. We believe we will maintain exclusive rights to market Tumor Treating Fields for all solid tumor indications in our key markets through the life of our patents.
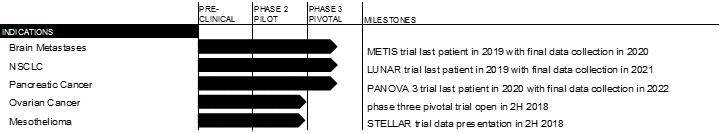
We are currently planning or conducting clinical trials evaluating the use of Tumor Treating Fields in brain metastases, non-small-cell lung cancer (“NSCLC”), pancreatic cancer, ovarian cancer and mesothelioma. We are also planning a single-arm, phase 2 pilot clinical trial in liver cancer which will study Tumor Treating Fields in combination with sorafenib, a chemotherapy drug, as a
- 13 -
treatment in 25 patients with advanced liver cancer. We anticipate expanding our clinical pipeline over time to study the safety and efficacy of Tumor Treating Fields for additional solid tumor indications.
In April 2018, we reported positive top-line results from our STELLAR phase 2 pilot trial in mesothelioma. These results exceeded the results of the interim analysis for all efficacy endpoints and demonstrated clinically meaningful improvements in overall survival and progression free survival among patients who received Tumor Treating Fields plus standard of care chemotherapy, pemetrexed and cisplatin or carboplatin, compared to historical control data of patients who received standard of care chemotherapy alone. Based upon the final STELLAR data, we plan to submit a Humanitarian Device Exemption application to the FDA for approval in upcoming months.
The table below presents the current status of the ongoing or completed clinical trials in our pipeline and our expected next milestone for each.
Financial Overview. We view our operations and manage our business in one operating segment. For the three months ended March 31, 2018, our net revenues were $52.1 million and our net loss was $20.7 million. Our net loss for the three months ended March 31, 2018 includes $8.5 million in non-cash share-based compensation expense. As of March 31, 2018, we had an accumulated deficit of $600.8 million.
Critical Accounting Policies and Estimates
In accordance with U.S. GAAP, in preparing our financial statements, we must make estimates and assumptions that affect the reported amounts of assets and liabilities, the disclosure of contingent assets and liabilities as of the date of the financial statements and the reported amounts of net revenues and expenses during the reporting period. We develop and periodically change these estimates and assumptions based on historical experience and on various other factors that we believe are reasonable under the circumstances. Actual results may differ from these estimates.
The critical accounting policies requiring estimates, assumptions and judgments that we believe have the most significant impact on our consolidated financial statements can be found in our 2017 10-K. We adopted ASU 2016-10, Revenue from Contracts with Customers (Topic 606): Identifying Performance Obligations and Licensing, and ASU No. 2015-14, Revenue from Contracts with Customers (Topic 606): Deferral of the Effective Date as of January 1, 2018. For additional information, see Note 1 to our Unaudited Consolidated Financial Statements. There were no other material changes to our critical accounting policies and estimates as compared to the critical accounting policies and estimates described in our 2017 10-K.
Commentary on Results of Operations
Net revenues. Substantially all of our revenues are derived from patients using Optune in our currently active markets. We charge patients or their third-party healthcare payers on a monthly basis. Our potential net revenues per patient are determined by our ability to secure payment from payers, the monthly fee we collect and the number of months that the patient remains on therapy.
Cost of revenues. We contract with third-party manufacturers that manufacture Optune. Our cost of revenues is primarily comprised of the following:
|
|
• |
disposable transducer arrays; |
|
|
• |
depreciation expense for the field equipment, including the electric field generator used by patients; and |
|
|
• |
personnel, warranty and overhead costs such as facilities, freight and depreciation of property, plant and equipment associated with managing our inventory, warehousing and order fulfillment functions. |
- 14 -
Operating expenses. Our operating expenses consist of research, development and clinical trials, sales and marketing and general and administrative expenses. Personnel costs are a significant component for each category of operating expenses and consist of wages, benefits and bonuses. Personnel costs also include share-based compensation.
Financial expenses, net. Financial expenses, net primarily consists of credit facility interest expense and related debt issuance costs, interest income from cash balances and short-term investments and gains (losses) from foreign currency transactions. Our reporting currency is the U.S. dollar. We have historically held substantially all of our cash balances in U.S. dollar denominated accounts to minimize the risk of translational currency exposure.
Results of Operations
The following table includes certain commercial patient operating statistics for and as of the end of the periods presented.
|
|
|
March 31, |
|
|||||
|
Operating statistics |
|
2018 |
|
|
2017 |
|
||
|
Active patients at period end (1) |
|
|
|
|
|
|
|
|
|
United States |
|
|
1,445 |
|
|
|
933 |
|
|
EMEA (*) |
|
|
544 |
|
|
|
331 |
|
|
Japan |
|
|
20 |
|
|
|
2 |
|
|
|
|
|
2,009 |
|
|
|
1,266 |
|
|
|
|
|
|
|
|
|
|
|
|
(*) including Germany |
|
|
377 |
|
|
|
246 |
|
|
|
|
|
|
|
|
|
|
|
|
|
|
Three months ended March 31, |
|
|||||
|
|
|
2018 |
|
|
2017 |
|
||
|
Gross billings (in millions) |
|
$ |
126.3 |
|
|
$ |
73.2 |
|
|
|
|
|
|
|
|
|
|
|
|
Prescriptions received in period (2) |
|
|
|
|
|
|
|
|
|
United States |
|
|
946 |
|
|
|
685 |
|
|
EMEA (*) |
|
|
282 |
|
|
|
206 |
|
|
Japan |
|
|
30 |
|
|
|
3 |
|
|
|
|
|
1,258 |
|
|
|
894 |
|
|
|
|
|
|
|
|
|
|
|
|
(*) including Germany |
|
|
210 |
|
|
|
162 |
|
|
(1) |
An “active patient” is a patient who is on Optune under a commercial prescription order as of the measurement date, including patients who may be on a temporary break from treatment and who plan to resume treatment in less than 60 days. |
|
(2) |
A “prescription received” is a commercial order for Optune that is received from a physician certified to treat patients with Optune for a patient not previously on Optune. Orders to renew or extend treatment are not included in this total. |
For the first quarter 2018, we estimate a global penetration rate of 26% in our currently active markets, 29% in the United States and 23% in Germany. Newly diagnosed GBM continues to represent approximately two-thirds of our total prescription volume.
Three months ended March 31, 2018 compared to three months ended March 31, 2017
(All dollar figures in tables are in thousands unless otherwise indicated)
|
|
|
Three months ended March 31, |
|
|
|
|
|
|
|
|
|
|||||
|
|
|
2018 |
|
|
2017 |
|
|
Change |
|
|
% Change |
|
||||
|
Net revenues |
|
$ |
52,125 |
|
|
$ |
34,880 |
|
|
$ |
17,245 |
|
|
|
49 |
% |
Net revenues. Net revenues increased $17.2 million, or 49%, to $52.1 million for the three months ended March 31, 2018 from $34.9 million for the three months ended March 31, 2017. Revenue growth was driven by increased Optune adoption in the United States and Germany and initial launch efforts in Japan, partially offset by the absence of one-time benefits from the 2017 cash to accrual revenue recognition transition.
- 15 -
|
|
Three months ended March 31, |
|
|
|
|
|
|
|
|
|
||||||
|
|
|
2018 |
|
|
2017 |
|
|
Change |
|
|
% Change |
|
||||
|
Cost of revenues |
|
$ |
18,238 |
|
|
$ |
11,664 |
|
|
$ |
6,574 |
|
|
|
56 |
% |
|
|
|
|
|
|
|
|
|
|
|
|
|
|
|
|
|
|
|
Non-cash expenses: |
|
|
|
|
|
|
|
|
|
|
|
|
|
|
|
|
|
Share-based compensation expense |
|
$ |
164 |
|
|
$ |
143 |
|
|
$ |
21 |
|
|
|
15 |
% |
|
Depreciation |
|
|
1,516 |
|
|
|
1,084 |
|
|
|
432 |
|
|
|
40 |
% |
|
Total non-cash expenses |
|
$ |
1,680 |
|
|
$ |
1,227 |
|
|
$ |
453 |
|
|
|
37 |
% |
|
|
|
|
|
|
|
|
|
|
|
|
|
|
|
|
|
|
|
Total cost of revenues, net of non-cash expenses * |
|
$ |
16,558 |
|
|
$ |
10,437 |
|
|
$ |
6,121 |
|
|
|
59 |
% |
|
* |
This non-GAAP metric has been included because management believes that it provides for a more accurate year to year comparison of our operating expenses without the impact of non-cash items. This measure allows investors to better understand and evaluate our operating results in the same manner as management, to compare financial results across accounting periods and to better understand the long-term performance of our core business in future periods. In addition, management finds it useful to exclude certain non-cash expenses to assist in budgeting, planning and forecasting future periods. Management discusses this measure with the Audit Committee of our Board of Directors, when appropriate, for the purposes of reviewing our performance and the use of our cash resources. |
Cost of revenues. Our cost of revenues increased by $6.6 million, or 56%, to $18.2 million for the three months ended March 31, 2018 from $11.7 million for the three months ended March 31, 2017. The increase resulted primarily from the cost of shipping transducer arrays to a higher volume of commercial patients, as well as an increase in field equipment depreciation. Cost of revenues includes $0.2 million of non-cash share-based compensation.
Operating Expenses.
|
|
|
Three months ended March 31, |
|
|
|
|
|
|
|
|
|
|||||
|
|
|
2018 |
|
|
2017 |
|
|
Change |
|
|
% Change |
|
||||
|
Research, development and clinical trials |
|
$ |
11,104 |
|
|
$ |
9,411 |
|
|
$ |
1,693 |
|
|
|
18 |
% |
|
Sales and marketing |
|
|
18,135 |
|
|
|
14,756 |
|
|
|
3,379 |
|
|
|
23 |
% |
|
General and administrative |
|
|
17,325 |
|
|
|
12,422 |
|
|
|
4,903 |
|
|
|
39 |
% |
|
Total operating expenses |
|
$ |
46,564 |
|
|
$ |
36,589 |
|
|
$ |
9,975 |
|
|
|
27 |
% |
|
|
|
|
|
|
|
|
|
|
|
|
|
|
|
|
|
|
|
Non-cash expenses: |
|
|
|
|
|
|
|
|
|
|
|
|
|
|
|
|
|
Share-based compensation expense |
|
$ |
8,356 |
|
|
$ |
4,418 |
|
|
$ |
3,938 |
|
|
|
89 |
% |
|
Other non-cash expenses |
|
|
687 |
|
|
|
577 |
|
|
|
110 |
|
|
|
19 |
% |
|
Total non-cash expenses |
|
$ |
9,043 |
|
|
$ |
4,995 |
|
|
$ |
4,048 |
|
|
|
81 |
% |
|
|
|
|
|
|
|
|
|
|
|
|
|
|
|
|
|
|
|
Total operating expenses, net of non-cash expenses * |
|
$ |
37,521 |
|
|
$ |
31,594 |
|
|
$ |
5,927 |
|
|
|
19 |
% |
|
* |
This non-GAAP metric has been included because management believes that it provides for a more accurate year to year comparison of our operating expenses without the impact of non-cash items. This measure allows investors to better understand and evaluate our operating results in the same manner as management, to compare financial results across accounting periods and to better understand the long-term performance of our core business in future periods. In addition, management finds it useful to exclude certain non-cash expenses to assist in budgeting, planning and forecasting future periods. Management discusses this measure with the Audit Committee of our Board of Directors, when appropriate, for the purposes of reviewing our performance and the use of our cash resources. |
Research, development and clinical trials expenses. Research, development and clinical trials expenses increased $1.7 million, or 18%, to $11.1 million for the three months ended March 31, 2018 from $9.4 million for the three months ended March 31, 2017. The change is primarily due to an increase in clinical trial and personnel expenses for our LUNAR, METIS, and PANOVA trials and an increase in investigator sponsored trial costs. These expenses include $0.9 million of non-cash share-based compensation.
Sales and marketing expenses. Sales and marketing expenses increased $3.4 million, or 23%, to $18.1 million for the three months ended March 31, 2018 from $14.8 million for the three months ended March 31, 2017. The change was primarily due to increased marketing expenses, increased personnel and facility expenses to support our geographical expansion in Japan and Austria and an increase in share-based compensation. These expenses include $1.4 million of non-cash share-based compensation.
- 16 -
General and administrative expenses. General and administrative expenses increased $4.9 million, or 39%, to $17.3 million for the three months ended March 31, 2018 from $12.4 million for the three months ended March 31, 2017. The change was primarily due to an increase in share based compensation and an increase in in professional services. These expenses included $6.0 million of non-cash share-based compensation expense.
|
|
|
Three months ended March 31, |
|
|
|
|
|
|
|
|
|
|||||
|
|
|
2018 |
|
|
2017 |
|
|
Change |
|
|
% Change |
|
||||
|
Financial expenses, net |
|
$ |
4,853 |
|
|
$ |
2,446 |
|
|
$ |
2,407 |
|
|
|
98 |
% |
Financial expenses, net. Financial expenses increased $2.4 million, or 98%, to $4.9 million for the three months ended March 31, 2018 from $2.4 million for the three months ended March 31, 2017. The change was primarily due to accelerated amortization costs triggered by the repayment of our 2015 term loan credit facility and interest expenses on our new $150 million term loan credit facility. For additional information, see Note 5 to our Unaudited Consolidated Financial Statements.
|
|
|
Three months ended March 31, |
|
|
|
|
|
|
|
|
|
|||||
|
|
|
2018 |
|
|
2017 |
|
|
Change |
|
|
% Change |
|
||||
|
Income tax expenses |
|
$ |
3,194 |
|
|
$ |
2,226 |
|
|
$ |
968 |
|
|
|
43 |
% |
Income taxes. Income taxes increased $1.0 million, or 43%, to $3.2 million for the three months ended March 31, 2018 from $2.2 million for the three months ended March 31, 2017. The increase was primarily a result of a higher number of active patients, partially offset by a change in the mix of applicable statutory tax rates in certain active jurisdictions.
Liquidity and Capital Resources
We have incurred significant losses and cumulative negative cash flows from operations since our founding in 2000. We were operated as a development stage company through December 31, 2011. Since that time, we have been actively engaged in the commercializing and global marketing of Optune, as well as the research and development of other applications of Tumor Treating Fields. We anticipate continuing to incur significant costs associated with commercializing our delivery systems for approved indications. We expect our research, development and clinical trials expenses to increase in connection with our ongoing activities and as additional indications enter late-stage clinical development. Please refer to the risk factor “To date, we have incurred substantial operating losses,” in our 2017 10-K for additional information. We expect to continue to incur significant expenses and operating losses for at least the next several years. Until we can generate substantial revenues (which may not occur), we expect to finance our cash needs through our existing cash, cash equivalents, short-term investments, equity issuances or additional debt, and possibly also from collaborations, strategic alliances, licensing arrangements and other marketing and distribution arrangements. We will need to generate significant revenues to achieve profitability, and we may never do so.
Sources of Liquidity
Since inception, we have financed our operations primarily through the issuance and sale of equity and the proceeds from long-term loans. As of March 31, 2018, we had received a total of $768.9 million from these activities. As of March 31, 2018, we had an accumulated deficit of $600.8 million.
Our net losses were $20.7 million for the three months ended March 31, 2018 and $61.7 million for the year ended December 31, 2017. Our net losses primarily resulted from costs incurred in connection with our pre-clinical and clinical trial programs, costs incurred in our commercial efforts, and general and administrative costs necessary to operate as a multi-national oncology business.
In the first quarter of 2018, we made a milestone payment of $5.5 million (the “Milestone Payment”) to the Technion Research and Development Foundation (“Technion”) pursuant to the settlement agreement dated February 10, 2015 (the “Settlement Agreement”). Pursuant to the Settlement Agreement, and in exchange for a release of potential disputes regarding intellectual property developed by our founder and previously assigned to us, we were obligated to pay the Milestone Payment to Technion in the quarter following the quarter in which we achieve $250.0 million of cumulative net sales (as defined in the Settlement Agreement) (the “Net Sales Milestone”). We achieved the Net Sales Milestone in the fourth quarter of 2017. We previously accrued for the anticipated Milestone Payment in the fourth quarter of 2016. We have no further financial obligations to Technion under the Settlement Agreement.
As of March 31, 2018, we had $111.6 million of cash and cash equivalents and $104.7 million of short-term investments. We believe our cash and cash equivalents and short-term investments as of March 31, 2018, are sufficient for our operations for at least the next twelve months, based upon our existing business plan and our ability to control the timing of significant expense commitments.
- 17 -
We expect that our research, development and clinical trials expenses, sales and marketing expenses and general and administrative expenses will continue to increase over the next several years and may outpace our gross profits. As a result, we may need to raise additional capital to fund our operations.
|
|
|
Three months ended March 31, |
|
|||||
|
|
|
2018 |
|
|
2017 |
|
||
|
Net cash used in operating activities |
|
$ |
(16,824 |
) |
|
$ |
(26,908 |
) |
|
Net cash provided by (used in) investing activities |
|
|
(1,857 |
) |
|
|
12,913 |
|
|
Net cash provided by financing activities |
|
|
51,714 |
|
|
|
59 |
|
|
Net increase (decrease) in cash, cash equivalents and restricted cash |
|
|
33,033 |
|
|
|
(13,936 |
) |
|
Effect of exchange rates on cash, cash equivalents and restricted cash |
|
|
10 |
|
|
|
11 |
|
|
Changes in short-term investments |
|
|
(7 |
) |
|
|
(15,190 |
) |
|
Net increase (decrease) in cash, cash equivalents, short-term investments and restricted cash |
|
$ |
33,036 |
|
|
$ |
(29,115 |
) |
Operating activities
Net cash used in operating activities primarily represents our net loss for the periods presented. Adjustments to net loss for non-cash items include share-based compensation, depreciation and amortization, accrued interest and impairments. Operating cash flows are also impacted by changes in operating assets and liabilities, principally trade receivables, prepaid expenses, inventories, trade payables and accrued expenses.
Net cash used in operating activities was $16.8 million for the three months ended March 31, 2018, as compared to $26.9 million for the three months ended March 31, 2017, reflecting a net loss of $20.7 million and a change of $9.3 million in our net operating assets and liabilities, partially offset by non-cash charges of $13.2 million.
The change in our net operating assets and liabilities was primarily the result of an increase in trade payables of $2.2 million and a decrease in inventories of $1.6 million offset by a decrease in other payables of $8.3 million, an increase in other receivables of $1.8 million, an increase in trade receivables of $1.7 million, a decrease in other long term liabilities of $0.8 million, and an increase in other long-term assets of $0.6 million. Non-cash charges included $8.5 million of share-based compensation, $2.4 million of amortization of discount, and $2.2 million of depreciation and amortization.
Investing activities
Our investing activities consist primarily of capital expenditures to purchase property and equipment and field equipment, as well as investments in and redemptions of our short-term investments.
Net cash used in investing activities was $1.9 million for the three months ended March 31, 2018, compared to $12.9 million provided by investing activities for the three months ended March 31, 2017, reflecting an increase attributable to our receipt of $45.0 million from the maturity of short-term investments, offset by the purchase of $44.8 million of new short-term investments, purchases of $1.4 million of field equipment, and purchases of $0.7 million of property and equipment.
Financing activities
To date, our primary financing activities have been the sale of equity and the proceeds from long-term loans.
Net cash provided by financing activities was $51.7 million for the three months ended March 31, 2018, as compared to $0.1 million for the three months ended March 31, 2017, reflecting net proceeds from long-term loan of $149.2 million and proceeds received from the exercise of warrants and options, partially offset by the repayment of long-term loan of $100.0 million.
Our material outstanding indebtedness consists of our term loan credit facility. As of March 31, 2018, the aggregate principal balance of amounts outstanding under the term loan credit facility was $150.0 million. We may prepay the term loan, in full, at any time. We must prepay the term loan (i) in full or in part upon the entry into certain licensing arrangements and (ii) in full in the event of a change of control. In each case, any prepayment (whether permitted or mandatory) is subject to a prepayment premium and/or make-whole payment. The pre-payment fee if we prepay outstanding loan amounts prior to February 7, 2021 is 2.0% and is 1.0% if made after the February 7, 2021 but prior to February 7, 2022.
- 18 -
All obligations under the term loan credit facility are guaranteed by certain of our current and future domestic direct and indirect subsidiaries. In addition, the obligations under the term loan credit facility are secured by a first-priority security interest in substantially all of the property and assets of, as well as the equity interests owned by, us and the other guarantors. The term loan credit facility contains other customary covenants.
Contractual Obligations and Commitments
There were no material changes in our commitments under contractual obligations during the three months ended March 31, 2018.
The total amount of unrecognized tax benefits for uncertain tax positions was $0.1 million and $2.8 million at March 31, 2018 and December 31, 2017, respectively. Payment of these obligations would result from settlements with taxing authorities. Discussions with the taxing authorities were completed in the first quarter of 2018 and the amounts shown above reflect the results of these discussions. We paid these settled positions in the second quarter.
Off-Balance Sheet Arrangements
We did not have during the periods presented, and we do not currently have, any off-balance sheet arrangements as defined under SEC rules.
Item 3. Quantitative and Qualitative Disclosures About Market Risk
There have been no material changes from the information disclosed in our Annual Report on Form 10-K for the year ended December 31, 2017.
Item 4. Controls and Procedures
Evaluation of Disclosure Controls and Procedures
As required by Rule 13a-15(b) under the Securities Exchange Act of 1934, as amended (the “Exchange Act”), our management, under the supervision and with the participation of our Chief Executive Officer and Chief Financial Officer, has evaluated the effectiveness of the design and operation of our disclosure controls and procedures as of March 31, 2018. The term “disclosure controls and procedures,” as defined in Rules 13a-15(e) and 15d-15(e) under the Exchange Act, means controls and other procedures of a company that are designed to ensure that information required to be disclosed by a company in the reports that it files or submits under the Exchange Act is recorded, processed, summarized and reported within the time periods specified in the SEC’s rules and forms. Disclosure controls and procedures include, without limitation, controls and procedures designed to ensure that information required to be disclosed by a company in the reports that it files or submits under the Exchange Act is accumulated and communicated to the company’s management, including its principal executive and principal financial officers, as appropriate, to allow timely decisions regarding required disclosure. Management recognizes that any controls and procedures, no matter how well designed and operated, can provide only reasonable assurance of achieving their objectives and management necessarily applies its judgment in evaluating the cost-benefit relationship of possible controls and procedures. Based on the evaluation of our disclosure controls and procedures as of March 31, 2018, our Chief Executive Officer and Chief Financial Officer have concluded that, as of March 31, 2018, our disclosure controls and procedures were effective at the reasonable assurance level.
Changes in Internal Control over Financial Reporting
There has been no change in our internal control over financial reporting during the quarter ended March 31, 2018, that has materially affected, or is reasonably likely to materially affect, our internal control over financial reporting.
- 19 -
There have been no material changes to our legal proceedings disclosed in the 2017 10-K..
There have been no material changes to our risk factors disclosed in the 2017 10-K.
Item 2. Unregistered Sales of Equity Securities and Use of Proceeds
In January 2018, an investor in our 2007 Series E preferred shares offering exercised warrants to purchase 1,549 ordinary shares with an exercise price of $3.59 per share. In addition, in January 2018, an investor in our 2007 Series E preferred shares offering cashlessly exercised warrants to purchase 201,692 ordinary shares with an exercise price of $3.59 per share, resulting in the issuance of 167,212 ordinary shares. We believe that these issuances were exempt from registration under the Securities Act of 1933, as amended (the “Securities Act”), in reliance on Section 4(a)(2) of the Securities Act regarding transactions not involving a public offering.
Item 3. Defaults Upon Senior Securities
None.
Item 4. Mine Safety Disclosures
Not applicable.
None.
- 20 -
EXHIBIT INDEX
|
Exhibit |
|
|
|
Incorporated by Reference |
|
Filed |
||||
|
Number |
|
Exhibit Description |
|
Form |
|
Date |
|
Number |
|
Herewith |
|
10.1 |
|
|
|
|
|
|
|
|
X |
|
|
10.2 |
|
|
8-K |
|
4/4/2018 |
|
10.1 |
|
|
|
|
10.3 |
|
|
8-K |
|
4/4/2018 |
|
10.2 |
|
|
|
|
31.1 |
|
|
|
|
|
|
|
|
X |
|
|
31.2 |
|
|
|
|
|
|
|
|
X |
|
|
32.1* |
|
|
|
|
|
|
|
|
X |
|
|
32.2* |
|
|
|
|
|
|
|
|
X |
|
|
101.INS |
|
XBRL Instance Document |
|
|
|
|
|
|
|
X |
|
101.SCH |
|
XBRL Taxonomy Extension Schema Document |
|
|
|
|
|
|
|
X |
|
101.CAL |
|
XBRL Taxonomy Extension Calculation Linkbase Document |
|
|
|
|
|
|
|
X |
|
101.DEF |
|
XBRL Taxonomy Extension Definition Linkbase Document |
|
|
|
|
|
|
|
X |
|
101.LAB |
|
XBRL Taxonomy Extension Label Linkbase Document |
|
|
|
|
|
|
|
X |
|
101.PRE |
|
XBRL Extension Presentation Linkbase Document |
|
|
|
|
|
|
|
X |
|
* |
The certifications attached as Exhibits 32.1 and 32.2 that accompany this Quarterly Report on Form 10-Q are not deemed filed with the Securities and Exchange Commission and are not to be incorporated by reference into any filing of NovoCure Limited under the Securities Act of 1933, as amended, or the Securities Exchange Act of 1934, as amended, whether made before or after the date of this Form 10-Q, irrespective of any general incorporation language contained in such filing. |
- 21 -
Pursuant to the requirements of the Securities Exchange Act of 1934, the registrant has duly caused this report to be signed on its behalf by the undersigned thereunto duly authorized.
|
|
|
NovoCure Limited |
|
|
|
|
|
Date: April 26, 2018 |
|
/s/ Wilco Groenhuysen |
|
|
|
Wilco Groenhuysen |
|
|
|
Chief Financial Officer |
|
|
|
(principal financial and accounting officer and duly authorized officer) |
- 22 -