Attached files
| file | filename |
|---|---|
| EX-99.1 - PRESS RELEASE - Midland States Bancorp, Inc. | exh_991.htm |
| 8-K - FORM 8-K - Midland States Bancorp, Inc. | f8k_042618.htm |
Exhibit 99.2

Midland States Bancorp, Inc. NASDAQ: MSBI First Quarter 2018 Earnings Call

2 Forward - Looking Statements. This presentation may contain forward - looking statements within the meaning of the federal securities laws. Forward - looking statements express management’s current expectations, forecasts of future events or long - term goals, and may be based upon beliefs, expectations and assumptions of Midland’s management, are generally identifiable by the use of words such as “believe,” “expect,” “anticipate,” “plan,” “intend,” “estimate,” “may,” “will,” “would,” “could,” “shoul d” or other similar expressions. All statements in this presentation speak only as of the date they are made, and Midland undertakes no obligation to update any statement. A number of factors, many of which are beyond the ability of Midland to control or predic t, could cause actual results to differ materially from those in its forward - looking statements. These risks and uncertainties sho uld be considered in evaluating forward - looking statements and undue reliance should not be placed on such statements. Additional information concerning Midland and its respective businesses, including additional factors that could materially affect Midla nd’ s financial results, are included in Midland’s filings with the Securities and Exchange Commission. Use of Non - GAAP Financial Measures. This presentation contains certain financial information determined by methods other than in accordance with accounting principles generally accepted in the United States (“GAAP”). These non - GAAP financial measures include “Adjusted Earnings,” “Adjusted Diluted Earnings Per Share,” “Adjusted Return on Average Assets,” “Adjusted Return on Average Shareholders’ Equity,” “Adjusted Return on Average Tangible Common Equity,” “Efficiency Ratio,” “Tangible Common Equity to Tangible Assets,” “Tangible Book Value Per Share” and “Return on Average Tangible Common Equity.” The Company believes that these non - GAAP financial measures provide both management and investors a more complete understanding of the Company’s funding profile and profitability. These non - GAAP financial measures are supplemental and are not a substitute for any analysis based on GAAP financial measures. The Company believes that these non - GAAP financial measures provide both management and investors a more complete understanding of the Company’s funding profile and profitability. These non - GAAP financial measures are supplemental and are not a substitute for any analysis based on GAAP financial measures. Not all companies use the same calculation of these measures; therefore this presentation may not be comparable to other similarly titled measures as presented by other companies. Reconciliations of these non - GAAP measures are provided in the Appendix section of this presentation.

Overview of 1Q18 3 Key Operating Trends Alpine Acquisition Succession Planning Closed on February 28, 2018 • Shifts business mix more towards community banking and wealth management • Expansion in net interest margin (excluding accretion income) • Higher average loan yields (excluding accretion income) • Solid expense management Executive Promotions • Jeff Ludwig promoted to President of Midland States Bancorp • Jeff Mefford promoted to President of Midland States Bank • Steve Erickson promoted to Chief Financial Officer 1Q18 Earnings Net income of $1.8 million, or $0.08 diluted EPS • Integration and acquisition expenses of $11.9 million, impacting EPS by $0.44 per diluted share • Adjusted earnings 1 of $0.52 per diluted share (1) Represents a non - GAAP financial measure. See “Non - GAAP Reconciliation” in the appendix.

Loan Portfolio Total Loans 4 • Total loans surpassed $4 billion due to addition of $ 791 million in loans from Alpine • Organic loan growth of $12 million or 1.5% annualized • Equipment lease portfolio increased $19 million • Pipeline for equipment financing has tripled since hiring of new team Loan Portfolio Mix (in millions, as of quarter - end) (in millions, as of quarter - end) 1Q 2018 4Q 2017 1Q 2017 Commercial $ 803 $ 556 $ 475 Commercial real estate 1,774 1,440 997 Construction and land development 235 201 171 Residential real estate 570 454 277 Consumer 424 371 337 Lease financing 224 205 197 Total $ 4,029 $ 3,227 $ 2,455 $2,455 $3,184 $3,158 $3,227 $4,029 1Q 2017 2Q 2017 3Q 2017 4Q 2017 1Q 2018

Total Deposits Total Deposits 5 • Total deposits increased to $4.23 billion due to addition of $1.1 billion in deposits from Alpine • Noninterest - bearing demand deposits increased to 24.5% of total deposits from 23.1% • With the acquisition of Alpine, retail deposits represent 54% of deposits in 1Q18 vs. 41% in 1Q17 • Excluding Alpine, deposits declined 1% in 1Q18 due in part to normal quarterly fluctuations in public funds and servicing deposits Deposit Mix (in millions, as of quarter - end) (in millions, as of quarter - end) 1Q 2018 4Q 2017 1Q 2017 Noninterest - bearing demand $ 1,038 $ 724 $ 528 Checking 993 786 751 Money market 840 646 415 Savings 467 281 170 Time 672 503 395 Brokered 224 190 269 Total deposits $ 4,234 $ 3,131 $ 2,527 $2,527 $3,333 $3,114 $3,131 $4,234 1Q 2017 2Q 2017 3Q 2017 4Q 2017 1Q 2018

$2.87 $3.41 $3.48 $3.59 $4.18 1Q 2017 2Q 2017 3Q 2017 4Q 2017 1Q 2018 $1,869 $1,930 $2,001 $2,051 $3,125 1Q 2017 2Q 2017 3Q 2017 4Q 2017 1Q 2018 • Wealth Management group offers Trust and Estate services, Investment Management, Financial Planning and Employer Sponsored Retirement Plans • Alpine added $1.1 billion in assets under administration • Total revenue increased 17% from the prior quarter • Year - over - year organic growth in assets under administration was $181 million, or 10%, excluding Alpine acquisition Wealth Management Wealth Management Revenue 6 Assets Under Administration (in millions) (in millions)

$6.4 $4.5 $3.4 $3.0 $3.0 $0.3 $6.7 $4.2 $3.8 $3.1 $3.3 1Q 2017 2Q 2017 3Q 2017 4Q 2017 1Q2018 Gain Servicing $0.4 $0.1 $217 $152 $113 $99 $80 1Q 2017 2Q 2017 3Q 2017 4Q 2017 1Q 2018 Loan Rate Locks Business Overview • Commercial FHA origination and servicing business for multifamily and healthcare facilities • $18 - $20 million in annual revenue from gain on loan sale and servicing • 20 - 25% pre - tax margins • Servicing deposits provide low - cost funding • Generates high margin bridge loan opportunities Love Funding – Commercial FHA Revenue Commercial FHA Revenue Mix 7 Loan Rate Locks (in millions) (in millions) 1Q18 Highlights • $80 million in rate locks • Higher average gain on locks offsets decrease in volume of locks • Average servicing deposits of $291 million, up 4% over the prior year • Average cost of servicing deposits of 10 basis points ($0.3) $0.3

0.35% 0.13% 0.27% 0.26% 0.16% 3.87% 3.70% 3.78% 3.73% 3.69% 1Q 2017 2Q 2017 3Q 2017 4Q 2017 1Q 2018 NIM Accretion Income • Net interest income increased due to one month contribution of Alpine • Net interest margin declined due to lower accretion income • Excluding the impact of accretion income, NIM was positively impacted by loan yields increasing more than funding costs, combined with enhanced earning asset mix Net Interest Income/Margin Net Interest Margin 8 Net Interest Income (in millions) $5.9 $2.6 $4.4 $1.9 $4.9 $2.7 $1.3 $3.0 $2.7 $2.0 $27.5 $29.4 $36.8 $36.0 $38.2 1Q 2017 2Q 2017 3Q 2017 4Q 2017 1Q 2018 NII Accretion Income

Non - Interest Income 9 • Fee generating businesses accounted for 30% of total revenue in 1Q18 • Non - interest income increased 19% due to the one month contribution of Alpine • Continued increase in wealth management revenue • Decline in residential mortgage banking revenue due to lower servicing income Non - Interest Income (in millions) $16.3 $13.6 $15.4 $14. 0 $16.6 1Q 2017 2Q 2017 3Q 2017 4Q 2017 1Q 2018 Commercial FHA Residential Mortgage Wealth Management All other, net

Non - Interest Expense and Operating Efficiency 10 • Efficiency Ratio 1 was 68.5% in 1Q18 vs. 64.6% in 4Q17 • Integration and acquisition related expenses » $11.9 million in 1Q18 » $2.7 million in 4Q17 • Loss on MSRs held - for - sale » $0.4 million in 4Q17 • Excluding these charges, noninterest expense increased 14.1% on a linked - quarter basis » Impact of Alpine’s operations for 1 month » Expansion of Equipment Financing business » Increased payroll taxes Non - Interest Expense and Efficiency Ratio 1 (Non - Interest expense in millions) $30.8 $37.6 $48.4 $36.2 $49.6 66% 67% 69% 65% 68% 1Q 2017 2Q 2017 3Q 2017 4Q2017 1Q 2018 Non-Interest Expense Efficiency Ratio (1) Represents a non - GAAP financial measure. See “Non - GAAP Reconciliation” in the appendix.
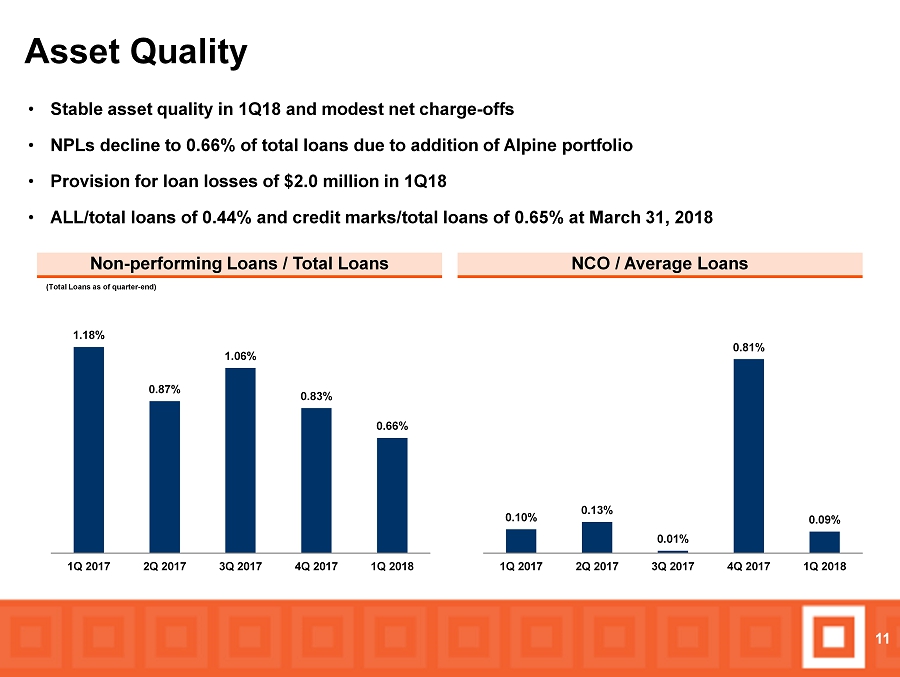
Asset Quality NCO / Average Loans 11 • Stable asset quality in 1Q18 and modest net charge - offs • NPLs decline to 0.66% of total loans due to addition of Alpine portfolio • Provision for loan losses of $2.0 million in 1Q18 • ALL/total loans of 0.44% and credit marks/total loans of 0.65% at March 31, 2018 Non - performing Loans / Total Loans (Total Loans as of quarter - end) 1.18% 0.87% 1.06% 0.83% 0.66% 1Q 2017 2Q 2017 3Q 2017 4Q 2017 1Q 2018 0.10% 0.13% 0.01% 0.81% 0.09% 1Q 2017 2Q 2017 3Q 2017 4Q 2017 1Q 2018

Outlook • Integration of Alpine expected to drive cost savings and improved efficiencies • Alpine system conversion scheduled for mid - July • Focus on liquidity and NIM will impact organic loan growth • Higher revenue and improved efficiencies expected to drive increased profitability • Revenue mix shifting towards more stable sources of income 12

APPENDIX

14 Adjusted Earnings Reconciliation (dollars in thousands, except per share data) Income before income taxes - GAAP $ 3,182 $ 7,766 $ 2,316 $ 4,916 $ 11,473 Adjustments to noninterest income: Gain on sales of investment securities, net 65 2 98 55 67 Gain (loss) on sale of other assets 150 37 45 (91) (58) Total adjustments to noninterest income 215 39 143 (36) 9 Adjustments to noninterest expense: Loss on mortgage servicing rights held for sale - 442 3,617 - - Integration and acquisition expenses 11,884 2,686 8,303 7,450 1,251 Total adjustments to noninterest expense 11,884 3,128 11,920 7,450 1,251 Adjusted earnings pre tax 14,851 10,855 14,093 12,402 12,715 Adjusted earnings tax 3,550 6,992 4,920 4,326 3,472 Revaluation of net deferred tax assets - (4,540) - - - Adjusted earnings - non-GAAP $ 11,301 $ 8,403 $ 9,173 $ 8,076 $ 9,243 Adjusted diluted earnings per common share $ 0.52 $ 0.42 $ 0.46 $ 0.46 $ 0.56 Adjusted return on average assets 0.96 % 0.76 % 0.82 % 0.89 % 1.14 % Adjusted return on average shareholders' equity 9.19 % 7.34 % 8.03 % 8.97 % 11.52 % Adjusted return on average tangible common shareholders' equity 13.10 % 9.92 % 10.87 % 11.23 % 13.91 % MIDLAND STATES BANCORP, INC.RECONCILIATIONS OF NON-GAAP FINANCIAL MEASURES For the Quarter Ended 2018 2017 2017 2017 2017 March 31, December 31, September 30, June 30, March 31,

15 Efficiency Ratio Reconciliation (dollars in thousands) Noninterest expense - GAAP $ 49,602 $ 36,192 $ 48,364 $ 37,644 $ 30,798 Loss on mortgage servicing rights held for sale - (442) (3,617) - - Integration and acquisition expenses (11,884) (2,686) (8,303) (7,450) (1,251) Adjusted noninterest expense $ 37,718 $ 33,064 $ 36,444 $ 30,194 $ 29,547 Net interest income - GAAP $ 38,185 $ 36,036 $ 36,765 $ 29,400 $ 27,461 Effect of tax-exempt income 394 659 687 674 671 Adjusted net interest income 38,579 36,695 37,452 30,074 28,132 Noninterest income - GAAP $ 16,605 $ 13,998 $ 15,403 $ 13,619 $ 16,342 Mortgage servicing rights impairment 133 494 104 1,650 76 Gain on sales of investment securities, net (65) (2) (98) (55) (67) (Gain) loss on sale of other assets (150) (37) (45) 91 58 Adjusted noninterest income 16,523 14,453 15,364 15,305 16,409 Adjusted total revenue $ 55,102 $ 51,148 $ 52,816 $ 45,379 $ 44,541 Efficiency ratio 68.45 % 64.64 % 69.00 % 66.54 % 66.34 % MIDLAND STATES BANCORP, INC.RECONCILIATIONS OF NON-GAAP FINANCIAL MEASURES For the Quarter Ended 2018 2017 2017 2017 2017 March 31, December 31, September 30, June 30, March 31,

16 Tangible Common Equity to Tangible Assets Ratio and Tangible Book Value Per Share (dollars in thousands, except per share data) Shareholders' Equity to Tangible Common Equity Total shareholders' equity
—GAAP $ 585,385 $ 449,545 $ 450,689 $ 451,952 $ 334,333 Adjustments: Preferred Stock (2,923) (2,970) (3,015) (3,134) - Goodwill (155,674) (98,624) (97,351) (96,940) (50,807) Other intangibles (46,473) (16,932) (17,966) (18,459) (8,633) Tangible common equity $ 380,315 $ 331,019 $ 332,357 $ 333,419 $ 274,893 Total Assets to Tangible Assets: Total assets—GAAP $ 5,723,372 $ 4,412,701 $ 4,347,761 $ 4,491,642 $ 3,373,577 Adjustments: Goodwill (155,674) (98,624) (97,351) (96,940) (50,807) Other intangibles (46,473) (16,932) (17,966) (18,459) (8,633) Tangible assets $ 5,521,225 $ 4,297,145 $ 4,232,444 $ 4,376,243 $ 3,314,137 Common Shares Outstanding 23,612,430 19,122,049 19,093,153 19,087,409 15,780,651 Tangible Common Equity to Tangible Assets 6.89 % 7.70 % 7.85 % 7.62 % 8.29 % Tangible Book Value Per Share $ 16.11 $ 17.31 $ 17.41 $ 17.47 $ 17.42 Return on Average Tangible Common Equity (ROATCE) (dollars in thousands) Net Income $ 1,806 $ 1,991 $ 2,036 $ 3,539 $ 8,490 Average total shareholders' equity—GAAP $ 498,941 $ 453,968 $ 453,317 $ 361,335 $ 325,442 Adjustments: Preferred Stock (2,952) (2,997) (3,126) (654) - Goodwill (118,996) (97,406) (97,129) (61,424) (48,836) Other intangibles (27,156) (17,495) (18,153) (10,812) (7,144) Average tangible common equity $ 349,837 $ 336,070 $ 334,909 $ 288,445 $ 269,462 ROATCE 2.09 % 2.35 % 2.41 % 4.92 % 12.78 % As of MIDLAND STATES BANCORP, INC. RECONCILIATIONS OF NON-GAAP FINANCIAL MEASURES As of and for the Quarter Ended March 31, December 31, September 30, June 30, March 31, 2018 2017 2017 2017 2017 2018 2017 2017 2017 2017 March 31, December 31, September 30, June 30, March 31,