Attached files
| file | filename |
|---|---|
| 8-K - 8-K - Hilltop Holdings Inc. | a18-12145_18k.htm |
Preface 2323 Victory Ave, Suite 1400 Dallas, TX 75219 Phone: 214-855-2177 www.hilltop-holdings.com FORWARD-LOOKING STATEMENTS Please Contact: Isabell Novakov Phone: 214-252-4029 Email: inovakov@hilltop-holdings.com This presentation and statements made by representatives of Hilltop Holdings Inc. (“Hilltop” or the “Company”) during the course of this presentation include “forward-looking statements” within the meaning of the Private Securities Litigation Reform Act of 1995. These forward-looking statements involve known and unknown risks, uncertainties and other factors that may cause our actual results, performance or achievements to be materially different from any future results, performance or achievements anticipated in such statements. Forward-looking statements speak only as of the date they are made and, except as required by law, we do not assume any duty to update forward-looking statements. Such forward-looking statements include, but are not limited to, statements concerning such things as our business strategy, our financial condition, our efforts to make strategic acquisitions, integration costs, our revenue, our liquidity and sources of funding, market trends, operations and business, capital levels, mortgage servicing rights (“MSR”) assets, stock repurchases, dividend payments, expectations concerning mortgage loan origination volume and interest rate compression, expected losses on covered loans and related reimbursements from the Federal Deposit Insurance Corporation (“FDIC”), anticipated amortization of our FDIC indemnification asset, expected levels of refinancing as a percentage of total loan origination volume, projected losses on mortgage loans originated, loss estimates related to natural disasters, anticipated changes in our revenue, earnings, or taxes, the effects of government regulation applicable to our operations, the appropriateness of our allowance for loan losses and provision for loan losses, anticipated yields, expected accretion of discount on loans, the collectability of loans and the outcome of litigation, our other plans, objectives, strategies, expectations and intentions and other statements that are not statements of historical fact, and may be identified by words such as “anticipates,” “believes,” “could,” “estimates,” “expects,” “forecasts,” “goal,” “intends,” “may,” “might,” “plan,” “probable,” “projects,” “seeks,” “should,” “target,” “view” or “would” or the negative of these words and phrases or similar words or phrases. The following factors, among others, could cause actual results to differ from those set forth in the forward-looking statements: (i) the credit risks of lending activities, including our ability to estimate loan losses; (ii) the effects of changes in the level of, and trends in, loan delinquencies and write-offs; (iii) changes in general economic, market and business conditions in areas or markets where we compete, including changes in the price of crude oil; (iv) changes in the interest rate environment; (v) risks associated with concentration in real estate related loans; (vi) risks associated with merger and acquisition integration; (vii) severe catastrophic events in Texas and other areas of the southern United States; (viii) effectiveness of our data security controls in the face of cyber attacks; (ix) the effects of our indebtedness on our ability to manage our business successfully, including the restrictions imposed by the indenture governing our indebtedness; (x) cost and availability of capital; (xi) changes in state and federal laws, regulations or policies affecting one or more of the our business segments, including changes in regulatory fees, deposit insurance premiums, capital requirements and the Dodd-Frank Wall Street Reform and Consumer Protection Act; (xii) changes in key management; (xiii) competition in our banking, broker-dealer, mortgage origination and insurance segments from other banks and financial institutions, as well as investment banking and financial advisory firms, mortgage bankers, asset-based non-bank lenders, government agencies and insurance companies; (xiv) legal and regulatory proceedings (xv) our obligations under loss-share agreements with the FDIC, including the possibility that we may be required to make a “true-up” payment to the FDIC; (xvi) failure of our insurance segment reinsurers to pay obligations under reinsurance contracts; (xvi) our ability to use excess capital in an effective manner; and (xvii) the possibility that any of the anticipated benefits of the proposed transaction with The Bank of River Oaks (“BORO”) will not be realized or will not be realized within the expected time period or that the transaction may be more expensive to complete than anticipated; (xviii) the failure of the proposed transaction with BORO to close on the expected timeline or at all; and (xiv) the ability to obtain regulatory approvals and meet other closing conditions to the acquisition of BORO, including approval by BORO shareholders on the expected terms and schedule. For further discussion of such factors, see the risk factors described in our most recent Annual Report on Form 10-K , and subsequent Quarterly Reports on Form 10-Q and other reports, that we have filed with the Securities and Exchange Commission. All forward-looking statements are qualified in their entirety by this cautionary statement. 2 Corporate Headquarters Additional Information

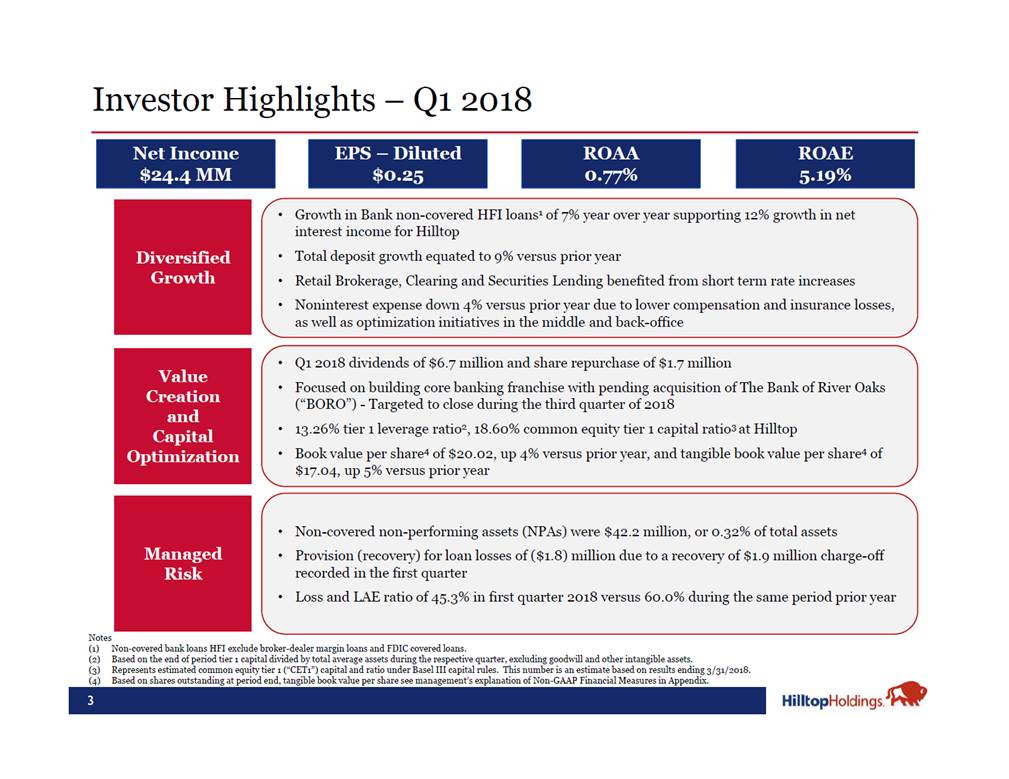
Investor Highlights – Q1 2018 • Growth in Bank non-covered HFI loans1 of 7% year over year supporting 12% growth in net interest income for Hilltop Total deposit growth equated to 9% versus prior year Retail Brokerage, Clearing and Securities Lending benefited from short term rate increases Noninterest expense down 4% versus prior year due to lower compensation and insurance losses, as well as optimization initiatives in the middle and back-office • • • • • Q1 2018 dividends of $6.7 million and share repurchase of $1.7 million Focused on building core banking franchise with pending acquisition of The Bank of River Oaks (“BORO”) - Targeted to close during the third quarter of 2018 13.26% tier 1 leverage ratio2, 18.60% common equity tier 1 capital ratio3 at Hilltop Book value per share4 of $20.02, up 4% versus prior year, and tangible book value per share4 of $17.04, up 5% versus prior year • • • • Non-covered non-performing assets (NPAs) were $42.2 million, or 0.32% of total assets Provision (recovery) for loan losses of ($1.8) million due to a recovery of $1.9 million charge-off recorded in the first quarter Loss and LAE ratio of 45.3% in first quarter 2018 versus 60.0% during the same period prior year • Notes (1) (2) (3) (4) Non-covered bank loans HFI exclude broker-dealer margin loans and FDIC covered loans. Based on the end of period tier 1 capital divided by total average assets during the respective quarter, excluding goodwill and other intangible assets. Represents estimated common equity tier 1 (“CET1”) capital and ratio under Basel III capital rules. This number is an estimate based on results ending 3/31/2018. Based on shares outstanding at period end, tangible book value per share see management’s explanation of Non-GAAP Financial Measures in Appendix. 3 Managed Risk Value Creation and Capital Optimization Diversified Growth ROAE 5.19% EPS – Diluted $0.25 ROAA 0.77% Net Income $24.4 MM
Business Results – Q1 2018 • Banking pre-tax income up $7 million, or 22%, relative to Q1 2017 largely driven by bank non-covered HFI loan growth of 7% and strong NIM of 4.15% (taxable equivalent NIM of 4.16%). Bank efficiency ratio of 61.3% versus 64.4% in Q1 2017 Mortgage pre-tax loss of $3 million relative to $10 million pre-tax income in Q1 2017 primarily resulted from the impact of increased competition in the marketplace and tightening secondary market spreads Broker-Dealer pre-tax income of $4 million primarily resulted from decreased trading gains from derivative and trading portfolio activities and lower public finance issuances, which in part can be attributed to the “Tax Act” that was enacted during the fourth quarter 2017. Pre-tax income decline in the quarter also resulted from increased rate volatility that lowered revenues in our fixed income businesses Insurance had a combined ratio of 85.2%, which drove pre-tax income of $4.8 million compared to $1.8 million in Q1 2017. Lower storm frequency and severity during this quarter contributed to the improvement. The second quarter typically experiences the seasonally highest frequency of storms and losses • • • 4 Business Drivers for Q1 2018 Pre-Tax Income vs. Prior Year ($ millions) Q1 2017Q1 2018 $39$41 $32 ($12)($13) BankingMortgageBroker-DealerInsuranceCorporate/ OtherHilltop Holdings $32 $10$10 $4$2$5 ($3)

Hilltop Holdings – Financial Summary Noninterest income 271.4 290.5 235.1 PPNR1 $43.0 $70.5 $30.4 Pre-tax income $41.3 $65.0 $32.2 Revenue 11.5 12.0 9.7 Pre-tax income impact $4.9 $6.4 $3.9 ROAA 0.88% 0.41% 0.77% Efficiency Ratio3 88.2% 82.3% 91.0% Tier 1 Leverage Ratio 13.98% 12.94% 13.26% Notes: (1) (2) (3) (4) Pre-provision net revenue is calculated as the sum of net interest income and noninterest income less noninterest expense (excludes provision (recovery) for loan losses). Includes impact of Purchase Accounting, FDIC Indemnification and True-up accrual (clawback). Efficiency Ratio is calculated as noninterest expense divided by the sum of net interest income and noninterest income. Based on the end of period Tier 1 capital divided by total average assets during the respective quarter, excluding goodwill and other intangible assets. 5 Common Equity Tier 1 Capital Ratio4 19.03%17.71%18.60% ROAE5.73%2.78%5.19% Key Metrics EPS - Diluted$0.27$0.14$0.25 Expenses6.65.65.8 Purchase Accounting Impact2 Net income applicable to common shareholders$26.4$13.4$24.4 Provision (recovery) for loan losses1.75.5(1.8) Noninterest expense320.5328.7308.2 $ in Millions, except per share data Income StatementQ1 2017Q4 2017Q1 2018 Net interest income92.1108.7103.4

Hilltop Holdings – Net Interest Income & Margin ($ in billions) • Net interest income of $103 million increased $11 million, or 12%, from first quarter 2017 • Loan accretion of $9.9 million declined ($2.2) million, or 18%, year over year Gross loan yields increased 19 bps to 5.27% in Q1 2018 from 5.08% during the same period prior year • Accretion increased gross loan yields by 78 bps in Q1 2017 and 59 bps in Q1 2018 Earning asset growth driven by commercial loan growth and higher securities balances at the Bank and HilltopSecurities HTH total deposit Beta approximately 21% since December 2015 • • • Note: (1) See appendix for reconciliation of NIM to Pre-PAA taxable equivalent NIM, as presented. (2) Noted measures during the 2017 periods presented reflect certain category reclassifications within the detailed calculations to conform with the current period presentation. 6 Net Interest Income Highlights Average Earning Assets and NIM1 Trends

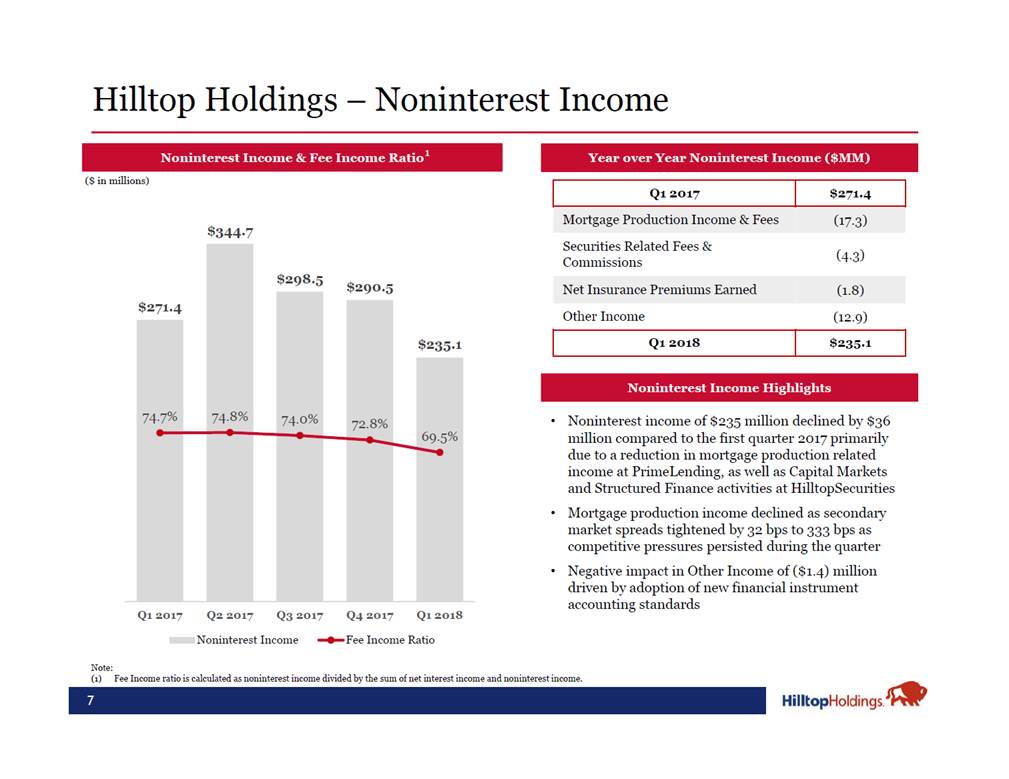
Hilltop Holdings – Noninterest Income ($ in millions) Mortgage Production Income & Fees Securities Related Fees & Commissions Net Insurance Premiums Earned Other Income (17.3) $344.7 (4.3) (1.8) (12.9) • Noninterest income of $235 million declined by $36 million compared to the first quarter 2017 primarily due to a reduction in mortgage production related income at PrimeLending, as well as Capital Markets and Structured Finance activities at HilltopSecurities Mortgage production income declined as secondary market spreads tightened by 32 bps to 333 bps as competitive pressures persisted during the quarter Negative impact in Other Income of ($1.4) million driven by adoption of new financial instrument accounting standards • • Q1 2017 Q2 2017 Q3 2017 Q4 2017 Q1 2018 Noninterest Income Fee Income Ratio Note: (1) Fee Income ratio is calculated as noninterest income divided by the sum of net interest income and noninterest income. 7 Noninterest Income Highlights Q1 2018 $235.1 $271.4 74.8% $298.5$290.5 74.0% 72.8% $235.1 74.7% 69.5% Q1 2017 $271.4 Noninterest Income & Fee Income Ratio1 Year over Year Noninterest Income ($MM)
Hilltop Holdings – Noninterest Expenses ($ in millions) $366.3 Compensation and Benefits Occupancy and Equipment Professional Services Insurance Loss and LAE Other Expenses (4.3) 0.5 (0.3) (6.2) (2.0) • Noninterest expense of $308 million declined $12 million from the first quarter 2017, driven by improved Loss & LAE and a decrease in variable compensation Year over year decrease in Compensation and Benefits attributed to revenue decline in the broker-dealer businesses • Mortgage banking related variable compensation generally aligned to production volume Q1 2018 expenses include $2.7 million of costs related to core system replacements and enhancements across the organization No significant BORO related transaction costs during the quarter • • Q1 2017 Q2 2017 Q3 2017 Q4 2017 Q1 2018 Noninterest Expense Efficiency Ratio • Note: (1) Efficiency Ratio is calculated as noninterest expense divided by the sum of net interest income and noninterest income. 8 Noninterest Expense Highlights Q1 2018 $308.2 $320.5 79.5% $353.8 87.7% $328.7 82.3% $308.2 88.2% 91.0% Q1 2017 $320.5 Noninterest Expenses and Efficiency Ratio1 Year over Year Noninterest Expense ($MM)

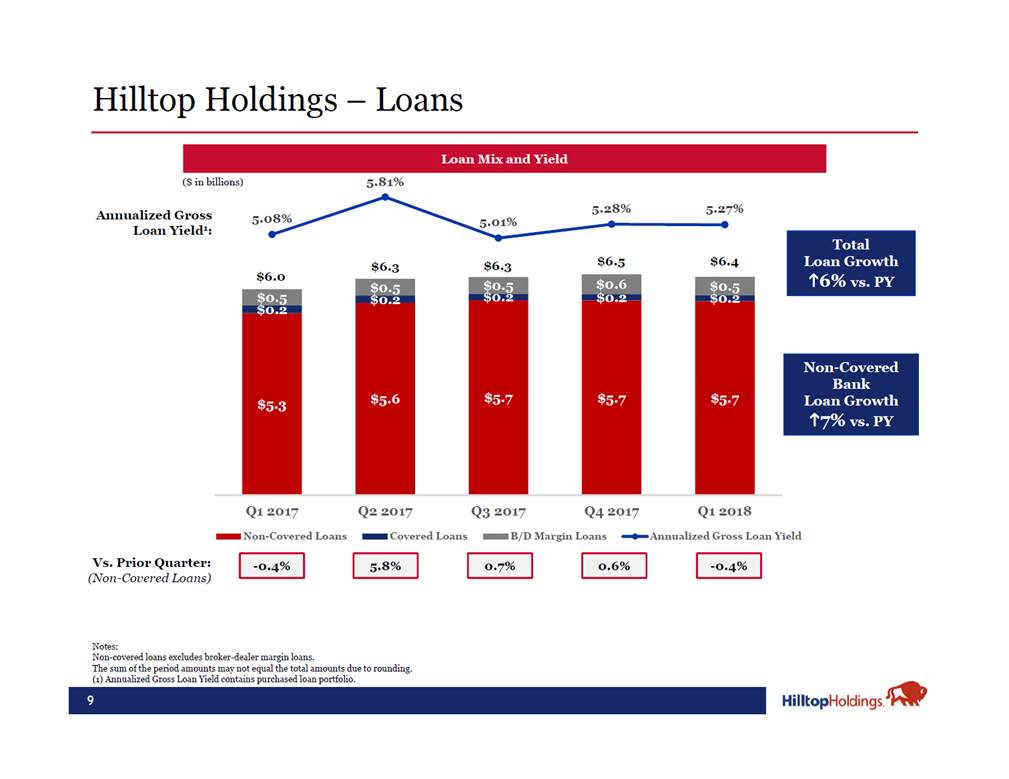
Hilltop Holdings – Loans 5.81% ($ in billions) 5.28% 5.27% Annualized Gross Loan Yield1: 5.08% 5.01% $6.5 $6.4 $6.3 $6.3 $6.0 Loan Growth Q1 2017 Non-Covered Loans Q2 2017 Q3 2017 Q4 2017 Q1 2018 Annualized Gross Loan Yield Covered Loans B/D Margin Loans Vs. Prior Quarter: (Non-Covered Loans) Notes: Non-covered loans excludes broker-dealer margin loans. The sum of the period amounts may not equal the total amounts due to rounding. (1) Annualized Gross Loan Yield contains purchased loan portfolio. 9 -0.4% 0.6% 5.8% -0.4% 0.7% Non-Covered Bank 7% vs. PY $0.5 $0.5 $5.7 $5.7 $5.7 $5.6 $5.3 $0.5 $0.5 $0.6 Total Loan Growth 6% vs. PY Loan Mix and Yield
Hilltop Holdings – Deposits ($ in billions) 0.44% 0.39% 0.36% 0.30% 0.27% Cost of Deposits: $8.0 $8.0 $7.7 $7.6 $7.3 Q1 2017 Q2 2017 Q3 2017 Q4 2017 B/D Sweep Deposits Q1 2018 Cost of Deposits (%) Noninterest bearing Interest bearing Vs. Prior Quarter: (Total Deposits) Notes: Noninterest-bearing deposits excludes broker-dealer sweep deposits. The sum of the period amounts may not equal the total amounts due to rounding. 10 -0.2% 4.1% 3.3% 3.8% 1.2% Deposit Growth excluding B/D Sweeps 7% vs. PY $1.1$1.3$1.3 $4.0$4.0$4.1 $2.3$2.3$2.3 $1.3 $4.3 $2.4 $1.3 $4.1 $2.6 Deposit Growth 9% vs. PY Deposit Mix and Cost

PlainsCapital Bank – Q1 2018 Highlights Net Interest Income Provision (recover) for Loan Losses Noninterest Income Noninterest Expense 82.1 1.8 12.4 60.8 86.6 (1.5) 10.2 59.4 ROAA Efficiency Ratio1 Net Interest Margin TE - Net Interest Margin – Pre-PAA Average Assets ($bn) 0.94% 64.4% 4.21% 3.56% $8.8 1.31% 61.3% 4.15% 3.65% $9.3 ($ in millions) 0.34% • Non-covered loan growth equates to 7%, driving approximately 5% net interest income growth • Growth continues to be focused in commercial real estate • C&I lending remains slower and highly competitive Bank deposit growth, excluding broker-dealer sweep and brokered deposits, of 8% year over year Credit quality continues to improve as non-covered NPAs declined for the 3rd consecutive quarter • Q1 results include a recovery of $1.9 million related to a loan charged off in a prior quarter 0.33% 0.32% 0.28% $45.4 $44.7 0.26% $42.2 • • Q1 2017 Q2 2017 Q3 2017 Q4 2017 Q1 2018 Non-Covered NPAs Non-Covered NPAs / Total HTH Assets Note: The sum of the period amounts may not equal the total amounts due to rounding. (1) Efficiency Ratio is calculated as noninterest expense divided by the sum of net interest income and noninterest income. 11 $34.0$34.8 Q1 2018 Highlights Credit Quality Income Before Taxes$31.8$39.0 Key Highlights Q1 2017 Q1 2018 Summary Results ($ in millions) Q1 2017 Q1 2018

PrimeLending – Q1 2018 Highlights Origination Volume ($mm) % Purchase Sales Volume ($mm) Servicing Assets ($mm) $2,824 80% $3,275 $46 $2,960 80% $3,185 $64 Net Interest Income (Expense) Noninterest Income Noninterest Expense (1.9) 143.6 131.8 0.9 127.1 130.7 • Origination volume of $3.0 billion in Q1 2018 exceeded prior year by $136 million, or 5% • Home purchase volume increased $90 million versus Q1 2017, or 4%, to $2.4 billion Noninterest income decreased $17 million, or 12%, versus prior year as increased competition drove additional mortgage pricing pressure Fixed expenses were down for the period primarily driven by a decrease in loan processing costs 388 380 375 365 362 333 $4.1 $4.0 $3.9 • • Q4 2016 Q1 2017 Q2 2017 Q3 2017 Q4 2017 Q1 2018 Gain on Sale (bps) 2 Mortgage Originations ($bn) Notes: 1)Source: Mortgage Bankers Association as of Mar 20, 2018. 2)Gain on Sale calculated as net gains from sale of loans divided by sales volume. 12 $3.6 $2.8 $3.0 Q1 2018 Highlights Mortgage Originations and Gain on Sale Income (Loss) Before Taxes$9.9($2.7) Key Highlights Q1 2017 Q1 2018 Summary Results ($ in millions) Q1 2017 Q1 2018

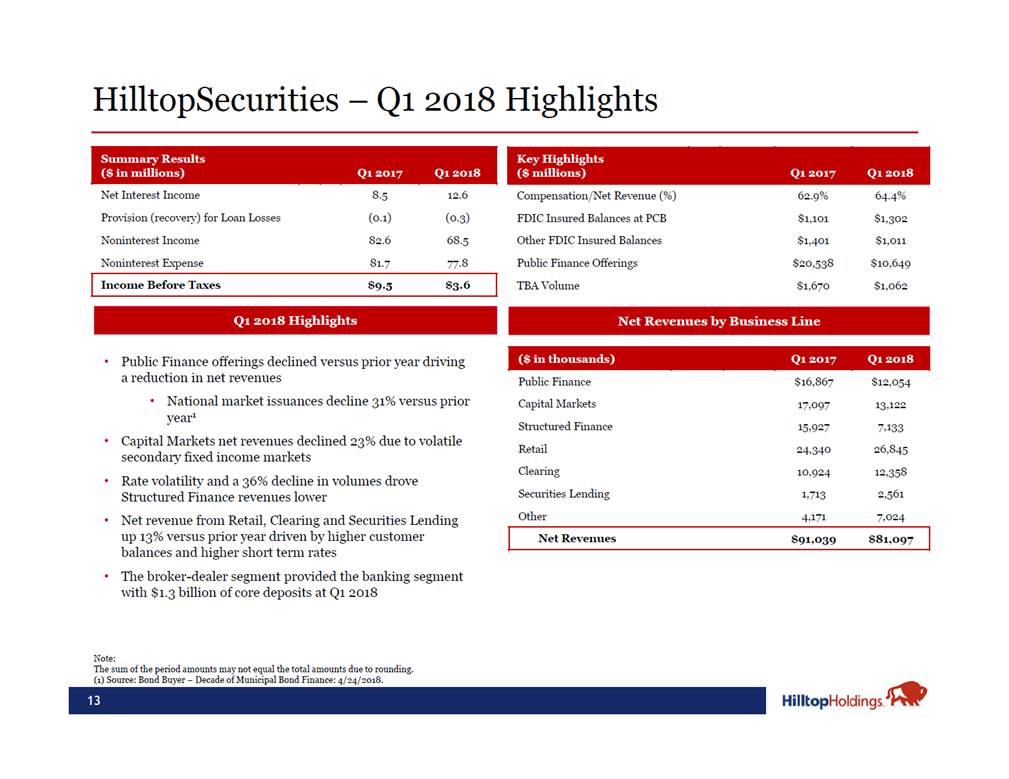
HilltopSecurities – Q1 2018 Highlights Net Interest Income Provision (recovery) for Loan Losses 8.5 (0.1) 12.6 (0.3) Compensation/Net Revenue (%) FDIC Insured Balances at PCB 62.9% $1,101 64.4% $1,302 Noninterest Income Noninterest Expense 82.6 81.7 68.5 77.8 Other FDIC Insured Balances Public Finance Offerings TBA Volume $1,401 $20,538 $1,670 $1,011 $10,649 $1,062 • Public Finance offerings declined versus prior year driving a reduction in net revenues • National market issuances decline 31% versus prior year1 Capital Markets net revenues declined 23% due to volatile secondary fixed income markets Rate volatility and a 36% decline in volumes drove Structured Finance revenues lower Net revenue from Retail, Clearing and Securities Lending up 13% versus prior year driven by higher customer balances and higher short term rates The broker-dealer segment provided the banking segment with $1.3 billion of core deposits at Q1 2018 Public Finance Capital Markets $16,867 17,097 15,927 24,340 10,924 1,713 4,171 $12,054 13,122 7,133 26,845 12,358 2,561 7,024 Structured Finance Retail Clearing • • Securities Lending Other • • Note: The sum of the period amounts may not equal the total amounts due to rounding. (1) Source: Bond Buyer – Decade of Municipal Bond Finance: 4/24/2018. 13 Net Revenues $91,039 $81,097 ($ in thousands) Q1 2017 Q1 2018 Net Revenues by Business Line Q1 2018 Highlights Income Before Taxes $9.5 $3.6 Key Highlights ($ millions) Q1 2017 Q1 2018 Summary Results ($ in millions) Q1 2017 Q1 2018
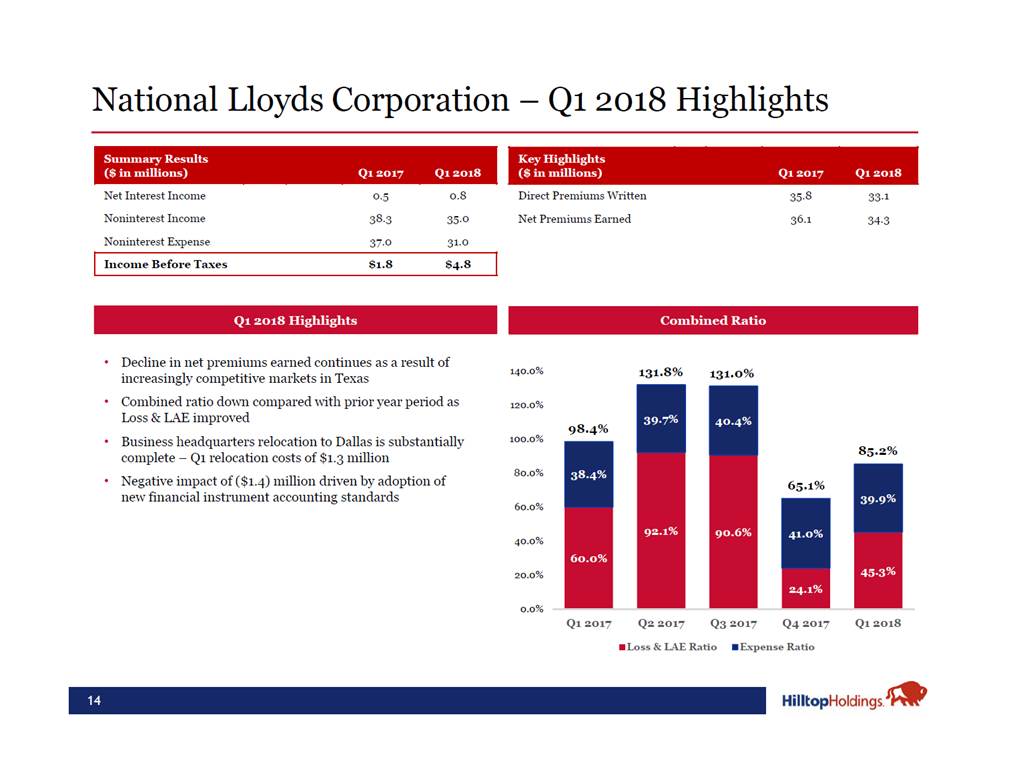
National Lloyds Corporation – Q1 2018 Highlights Net Interest Income Noninterest Income Noninterest Expense 0.5 38.3 37.0 0.8 35.0 31.0 Direct Premiums Written Net Premiums Earned 35.8 36.1 33.1 34.3 • Decline in net premiums earned continues as a result of increasingly competitive markets in Texas Combined ratio down compared with prior year period as Loss & LAE improved Business headquarters relocation to Dallas is substantially complete – Q1 relocation costs of $1.3 million Negative impact of ($1.4) million driven by adoption of new financial instrument accounting standards 140.0% 131.8% 131.0% • 120.0% 100.0% • 80.0% • 60.0% 40.0% 20.0% 0.0% Q1 2017 Q2 2017 Q3 2017 Q4 2017 Q1 2018 Loss & LAE Ratio Expense Ratio 14 98.4% 39.7% 40.4% 85.2% 38.4% 92.1% 90.6% 65.1% 39.9% 41.0% 60.0% 45.3% 24.1% Combined Ratio Q1 2018 Highlights Income Before Taxes$1.8$4.8 Key Highlights ($ in millions) Q1 2017 Q1 2018 Summary Results ($ in millions) Q1 2017 Q1 2018
Appendix 15

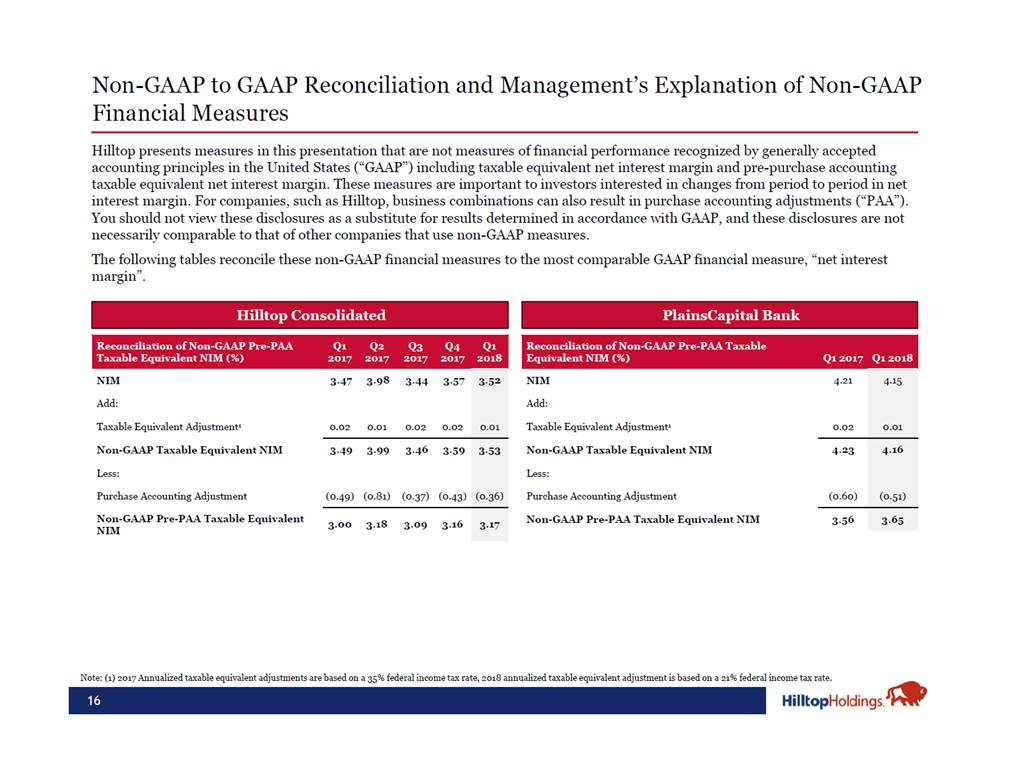
Non-GAAP to GAAP Reconciliation and Management’s Explanation of Non-GAAP Financial Measures Hilltop presents measures in this presentation that are not measures of financial performance recognized by generally accepted accounting principles in the United States (“GAAP”) including taxable equivalent net interest margin and pre-purchase accounting taxable equivalent net interest margin. These measures are important to investors interested in changes from period to period in net interest margin. For companies, such as Hilltop, business combinations can also result in purchase accounting adjustments (“PAA”). You should not view these disclosures as a substitute for results determined in accordance with GAAP, and these disclosures are not necessarily comparable to that of other companies that use non-GAAP measures. The following tables reconcile these non-GAAP financial measures to the most comparable GAAP financial measure, “net interest margin”. Note: (1) 2017 Annualized taxable equivalent adjustments are based on a 35% federal income tax rate, 2018 annualized taxable equivalent adjustment is based on a 21% federal income tax rate. 16 Reconciliation of Non-GAAP Pre-PAA Taxable Equivalent NIM (%)Q1 2017 Q1 2018 NIM Add: Taxable Equivalent Adjustment1 Non-GAAP Taxable Equivalent NIM Less: Purchase Accounting Adjustment Non-GAAP Pre-PAA Taxable Equivalent NIM 4.21 0.02 4.15 0.01 4.23 (0.60) 4.16 (0.51) 3.56 3.65 Reconciliation of Non-GAAP Pre-PAAQ1Q2Q3Q4Q1 Taxable Equivalent NIM (%)2017201720172017 2018 NIM Add: Taxable Equivalent Adjustment1 Non-GAAP Taxable Equivalent NIM Less: Purchase Accounting Adjustment Non-GAAP Pre-PAA Taxable Equivalent NIM 3.473.983.443.57 0.020.010.020.02 3.52 0.01 3.493.993.463.59 (0.49) (0.81) (0.37) (0.43) 3.53 (0.36) 3.003.183.093.16 3.17 •PlainsCapital Bank •Hilltop Consolidated
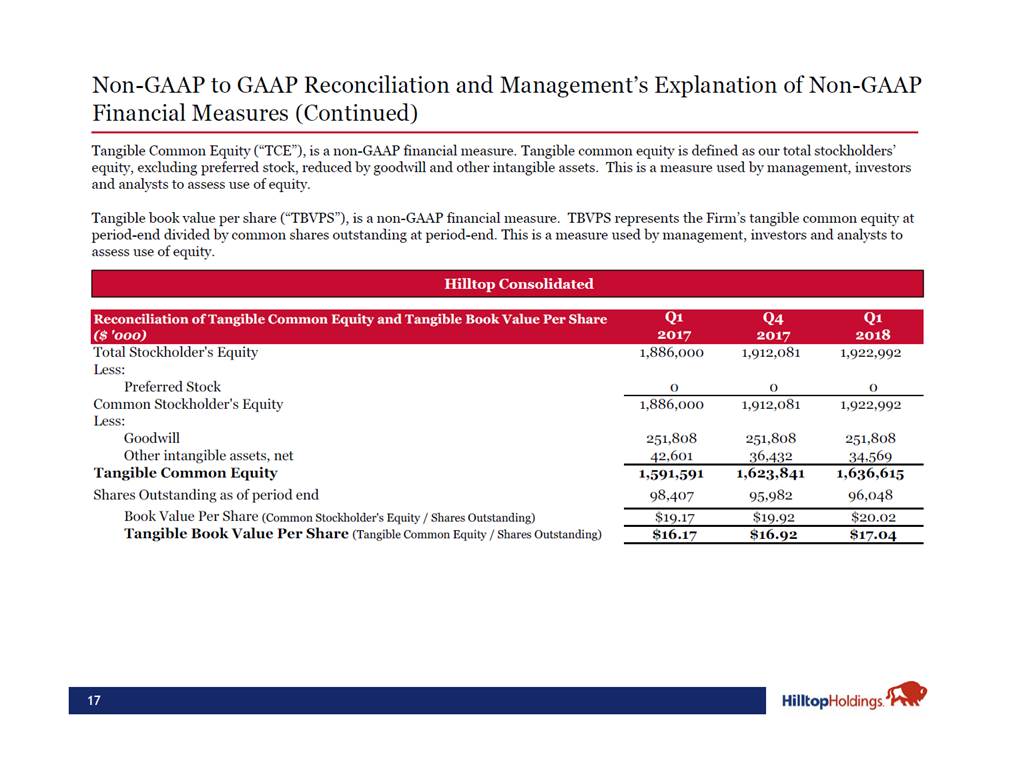
Non-GAAP to GAAP Reconciliation and Management’s Explanation of Non-GAAP Financial Measures (Continued) Tangible Common Equity (“TCE”), is a non-GAAP financial measure. Tangible common equity is defined as our total stockholders’ equity, excluding preferred stock, reduced by goodwill and other intangible assets. This is a measure used by management, investors and analysts to assess use of equity. Tangible book value per share (“TBVPS”), is a non-GAAP financial measure. TBVPS represents the Firm’s tangible common equity at period-end divided by common shares outstanding at period-end. This is a measure used by management, investors and analysts to assess use of equity. Total Stockholder's Equity Less: Preferred Stock Common Stockholder's Equity Less: Goodwill Other intangible assets, net Tangible Common Equity Shares Outstanding as of period end Book Value Per Share (Common Stockholder's Equity / Shares Outstanding) Tangible Book Value Per Share (Tangible Common Equity / Shares Outstanding) 1,886,000 1,912,081 1,922,992 0 0 0 1,886,000 1,912,081 1,922,992 251,808 42,601 251,808 36,432 251,808 34,569 1,591,591 98,407 1,623,841 95,982 1,636,615 96,048 $19.17 $19.92 $20.02 $16.17 $16.92 $17.04 17 Reconciliation of Tangible Common Equity and Tangible Book Value Per ShareQ1Q4Q1 ($ '000)201720172018 •Hilltop Consolidated